Epigenetic regulation of lateralized fetal spinal gene expression underlies hemispheric asymmetries
- Ruhr University Bochum, Germany
- St. Johannes Hospital, Germany
- University Hospital Bergmannsheil, Germany
- Max Planck Institute for Psycholinguistics, Netherlands
- Radboud University, Netherlands
- Wallenberg Research Centre at Stellenbosch University, South Africa
Figures
Figure 1
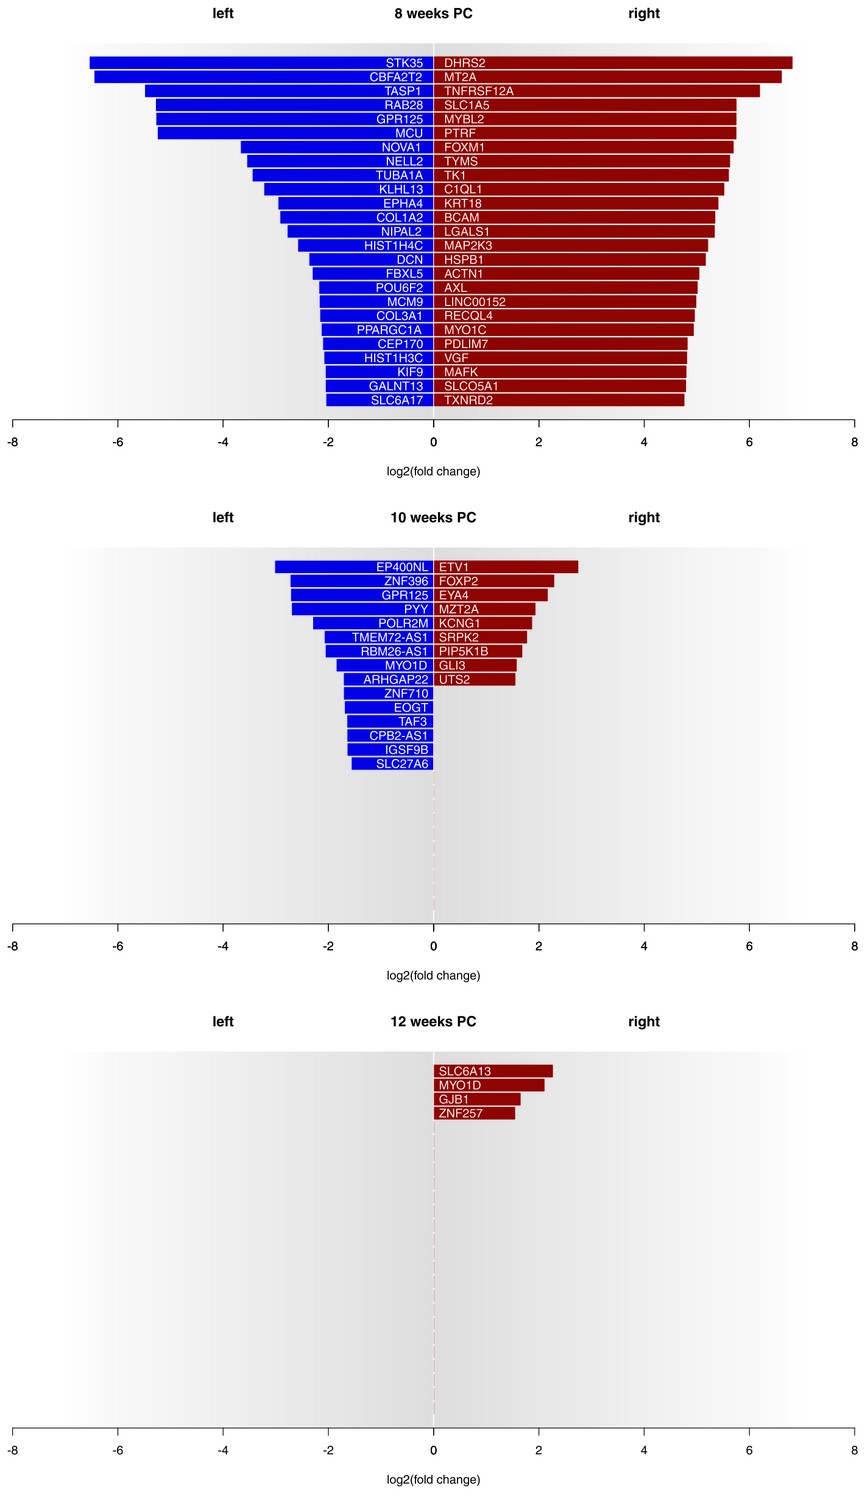
Gene expression asymmetries in human fetal spinal cord at 8, 10 and 12 weeks PC.
X-axis shows the extent of asymmetry measured in log2(fold change) between right and left spinal cord samples. Blue bars show leftward asymmetrically expressed genes, red bars show rightward asymmetrically expressed genes. For 8 weeks PC, the top 25 genes with highest rightward/leftward gene expression asymmetries are depicted. For 10 and 12 weeks PC, all genes with a log2(fold change) > 1.5 are shown. The source files of asymmetrically expressed genes per developmental stage with corresponding fold change values are available in Figure 1—source data 1.
-
Figure 1—source data 1
Asymmetrically expressed genes per week.
- https://doi.org/10.7554/eLife.22784.003
Figure 2
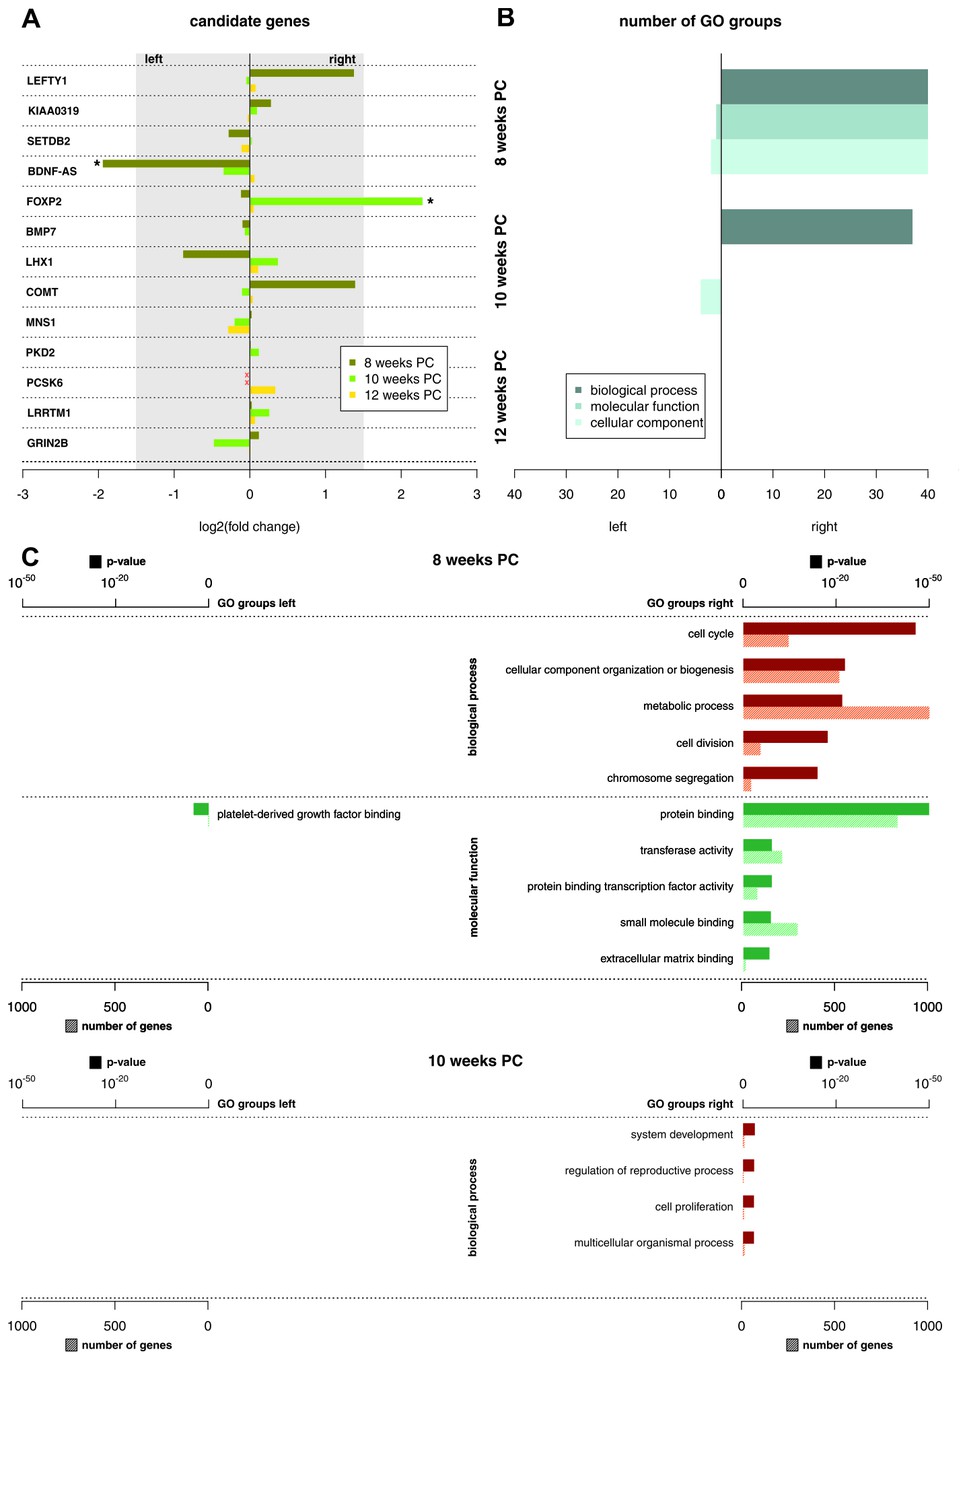
Functional genes and gene groups.
(A) Gene expression asymmetries for previously published candidate genes for handedness and functional lateralization. Asterisks indicate biologically relevant gene expression asymmetry with a log2(fold change) > 1.5. (B) Number of significant Gene Ontology (GO) groups for the three main categories ‘biological processes’, 'molecular function' and 'cellular component' for weeks 8, 10 and 12 PC. (C) Main GO groups for 8 and 10 weeks PC with p-value and number of involved genes for the left and right spinal cord. The source files of all enriched GO groups are available in Figure 2—source data 1.
-
Figure 2—source data 1
Enriched GO groups per week and side of the spinal cord.
- https://doi.org/10.7554/eLife.22784.005
Figure 3
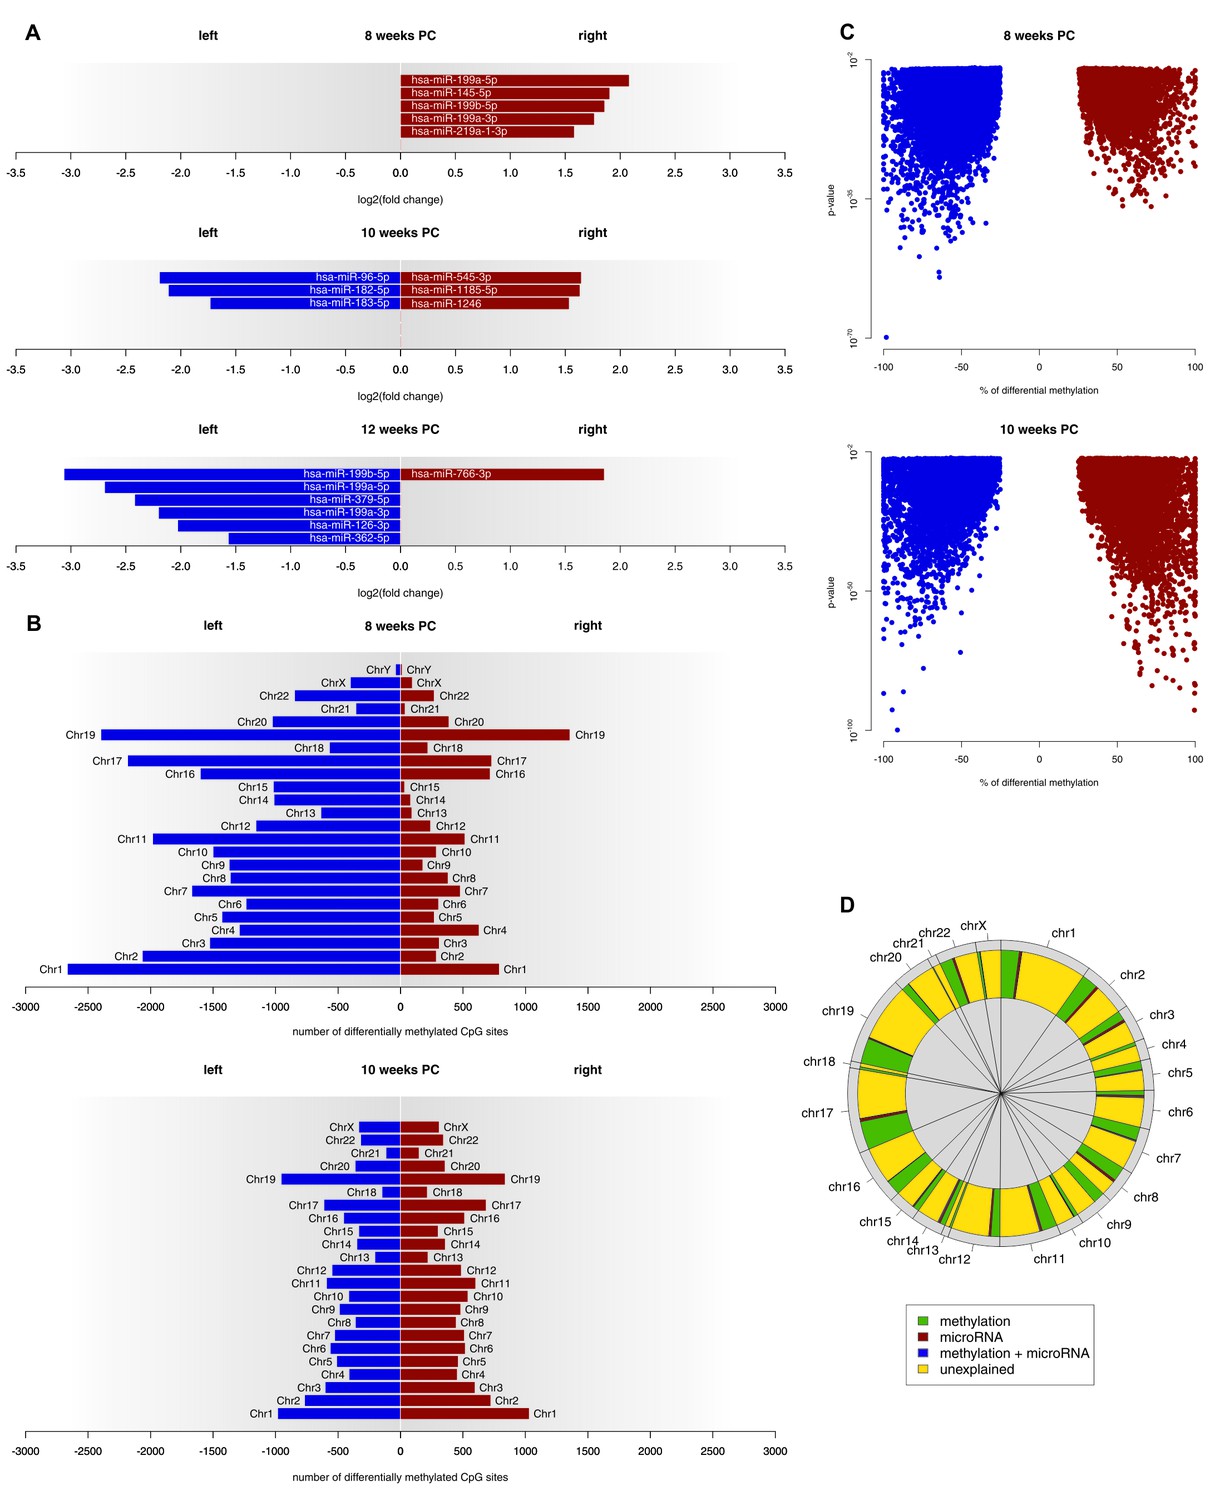
Epigenetic regulation of gene expression asymmetries in human fetal spinal cord.
(A) Asymmetrically expressed miRNA transcripts at 8, 10 and 12 weeks PC. The extent of expression asymmetries is measured in log2(fold change). Red bars show rightward asymmetrically expressed microRNA transcripts, blue bars show leftward asymmetrically expressed miRNA transcripts. (B) Number of CpG sites showing differential DNA methylation per chromosome, compared between the left and right spinal cord for 8 and 10 weeks PC. Depicted are only CpG sites with methylation asymmetries in both samples. Red bars represent the number of CpG sites that showed significantly higher DNA methylation on the right side, blue bars show the number of CpG sites that showed significantly more DNA methylation on the left side. (C) Percentage of differential DNA methylation in leftward (blue) and rightward (red) asymmetrically methylated CpG sites as a function of p-value. (D) Percentage of gene expression asymmetries on each chromosome at 8 weeks PC that can be explained by regulation via asymmetrically expressed miRNAs or asymmetric DNA methylation of CpG sites within and 1500 nucleotides upstream of the expressed genes. The source files of asymmetrically expressed miRNAs, asymmetrically expressed targets of miRNAs, enriched KEGG pathways and differentially methylated CpG sites are available in Figure 3—source data 1, Figure 3—source data 2, Figure 3—source data 3, and Figure 3—source data 4 respectively.
-
Figure 3—source data 1
Asymmetrically expressed miRNAs per week.
- https://doi.org/10.7554/eLife.22784.007
-
Figure 3—source data 2
Asymmetrically expressed RNA targets of asymmetrically expressed miRNAs per week.
- https://doi.org/10.7554/eLife.22784.008
-
Figure 3—source data 3
Enriched KEGG pathways per week and side of the spinal cord.
- https://doi.org/10.7554/eLife.22784.009
-
Figure 3—source data 4
Asymmetrically methylated CpG sites per week and side of the spinal cord.
- https://doi.org/10.7554/eLife.22784.010
Additional files
-
Supplementary file 1
(A) Description of tissue samples. (B) RNA quality measurements. (C) DNA quality measurements. (D) RNA read statistics. (E) DNA read statistics. (F) Methylation report. (G) Top 25 asymmetrically expressed genes per sample.
- https://doi.org/10.7554/eLife.22784.011
Download links
A two-part list of links to download the article, or parts of the article, in various formats.
Downloads (link to download the article as PDF)
Open citations (links to open the citations from this article in various online reference manager services)
Cite this article (links to download the citations from this article in formats compatible with various reference manager tools)
Epigenetic regulation of lateralized fetal spinal gene expression underlies hemispheric asymmetries
eLife 6:e22784.
https://doi.org/10.7554/eLife.22784


