mTORC1 in AGRP neurons integrates exteroceptive and interoceptive food-related cues in the modulation of adaptive energy expenditure in mice
- University of Cambridge, United Kingdom
- The Albert Einstein College of Medicine, United States
Figures
Figure 1 with 1 supplement
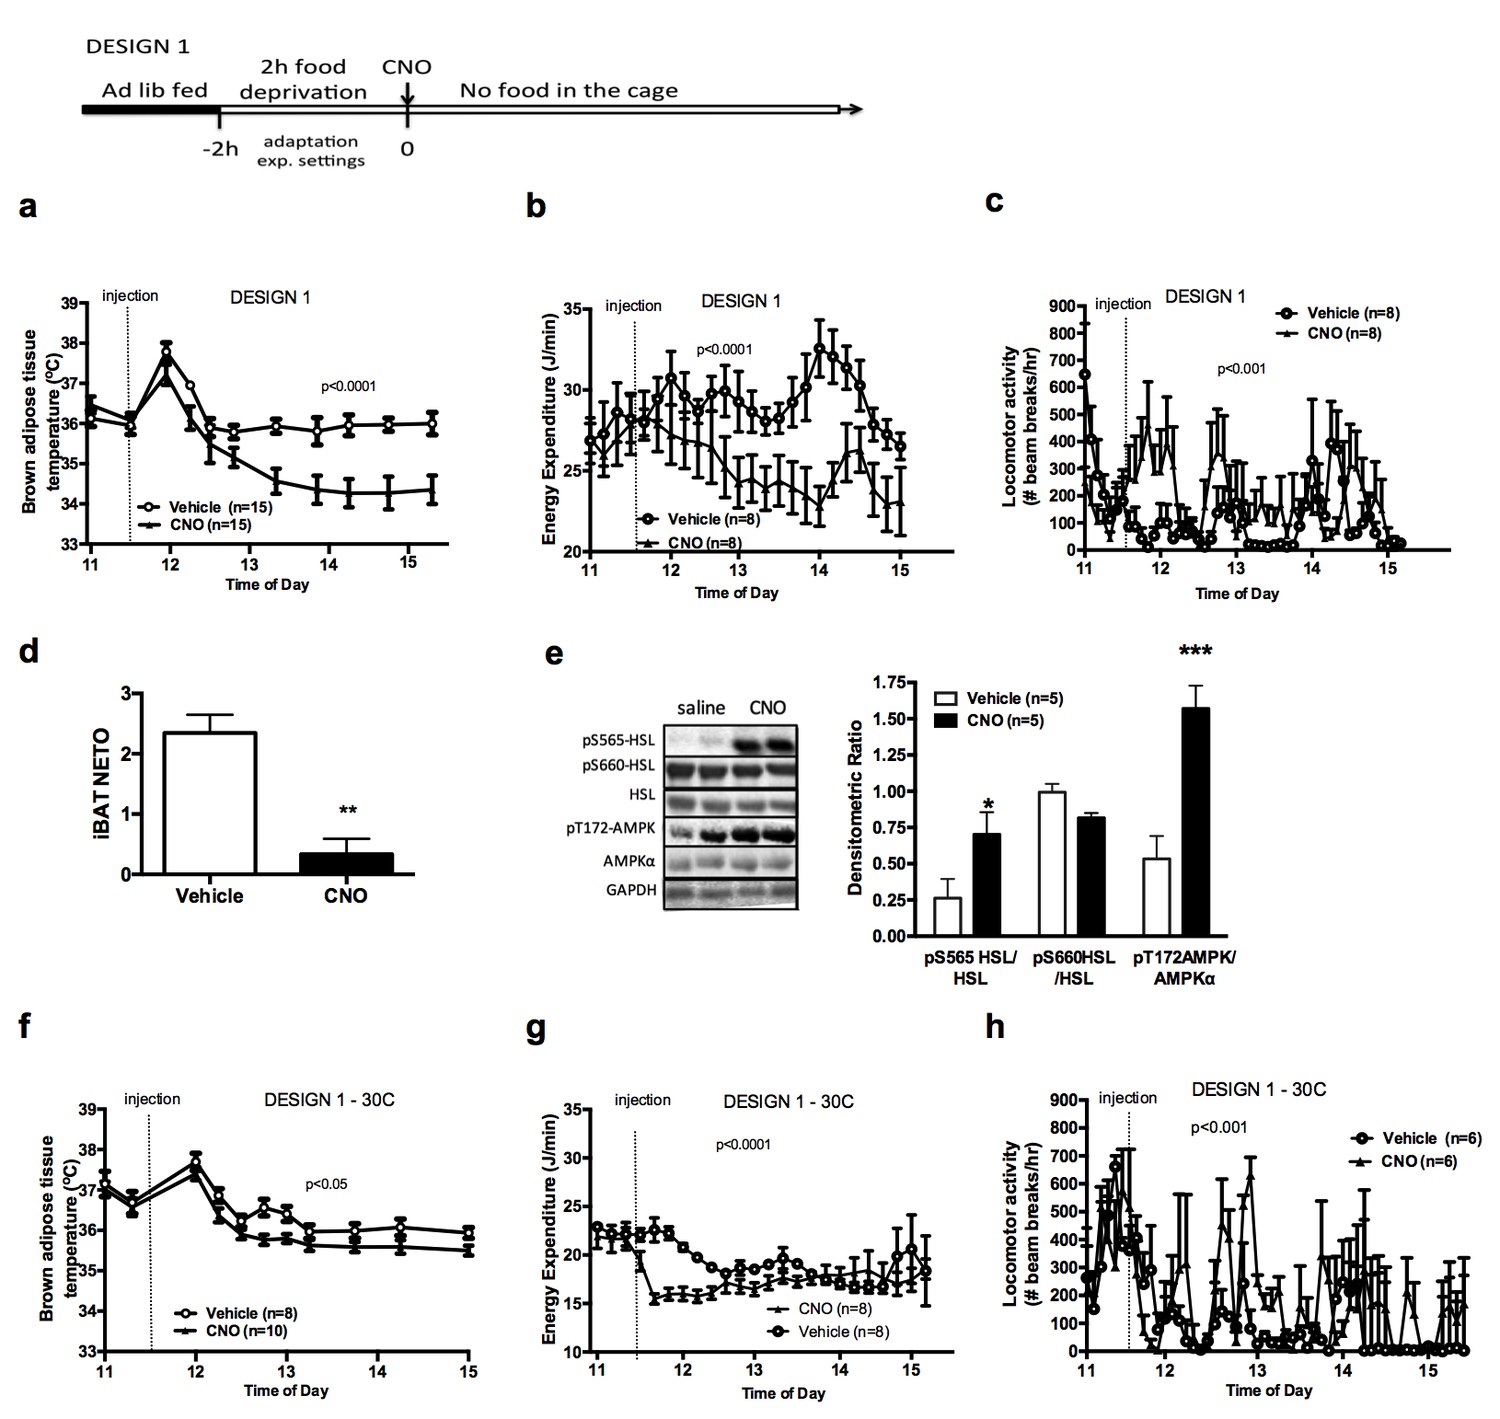
AGRP neurons control iBAT thermogenesis.
iBAT temperature (a), energy expenditure (b), locomotor activity (c), Norepinephrine turnover (n = 8) (d) and phosphorylation levels of lipolytic pathways in the iBAT (d) following chemogenetic activation of AGRP neurons in food-deprived mice (DESIGN 1). iBAT temperature (f), energy expenditure (g) and locomotor activity (h) following chemogenetic activation of AGRP neurons at 30°C. Data are mean ± SEM, *p<0.05 ; ***p<0.001.
Figure 1—figure supplement 1
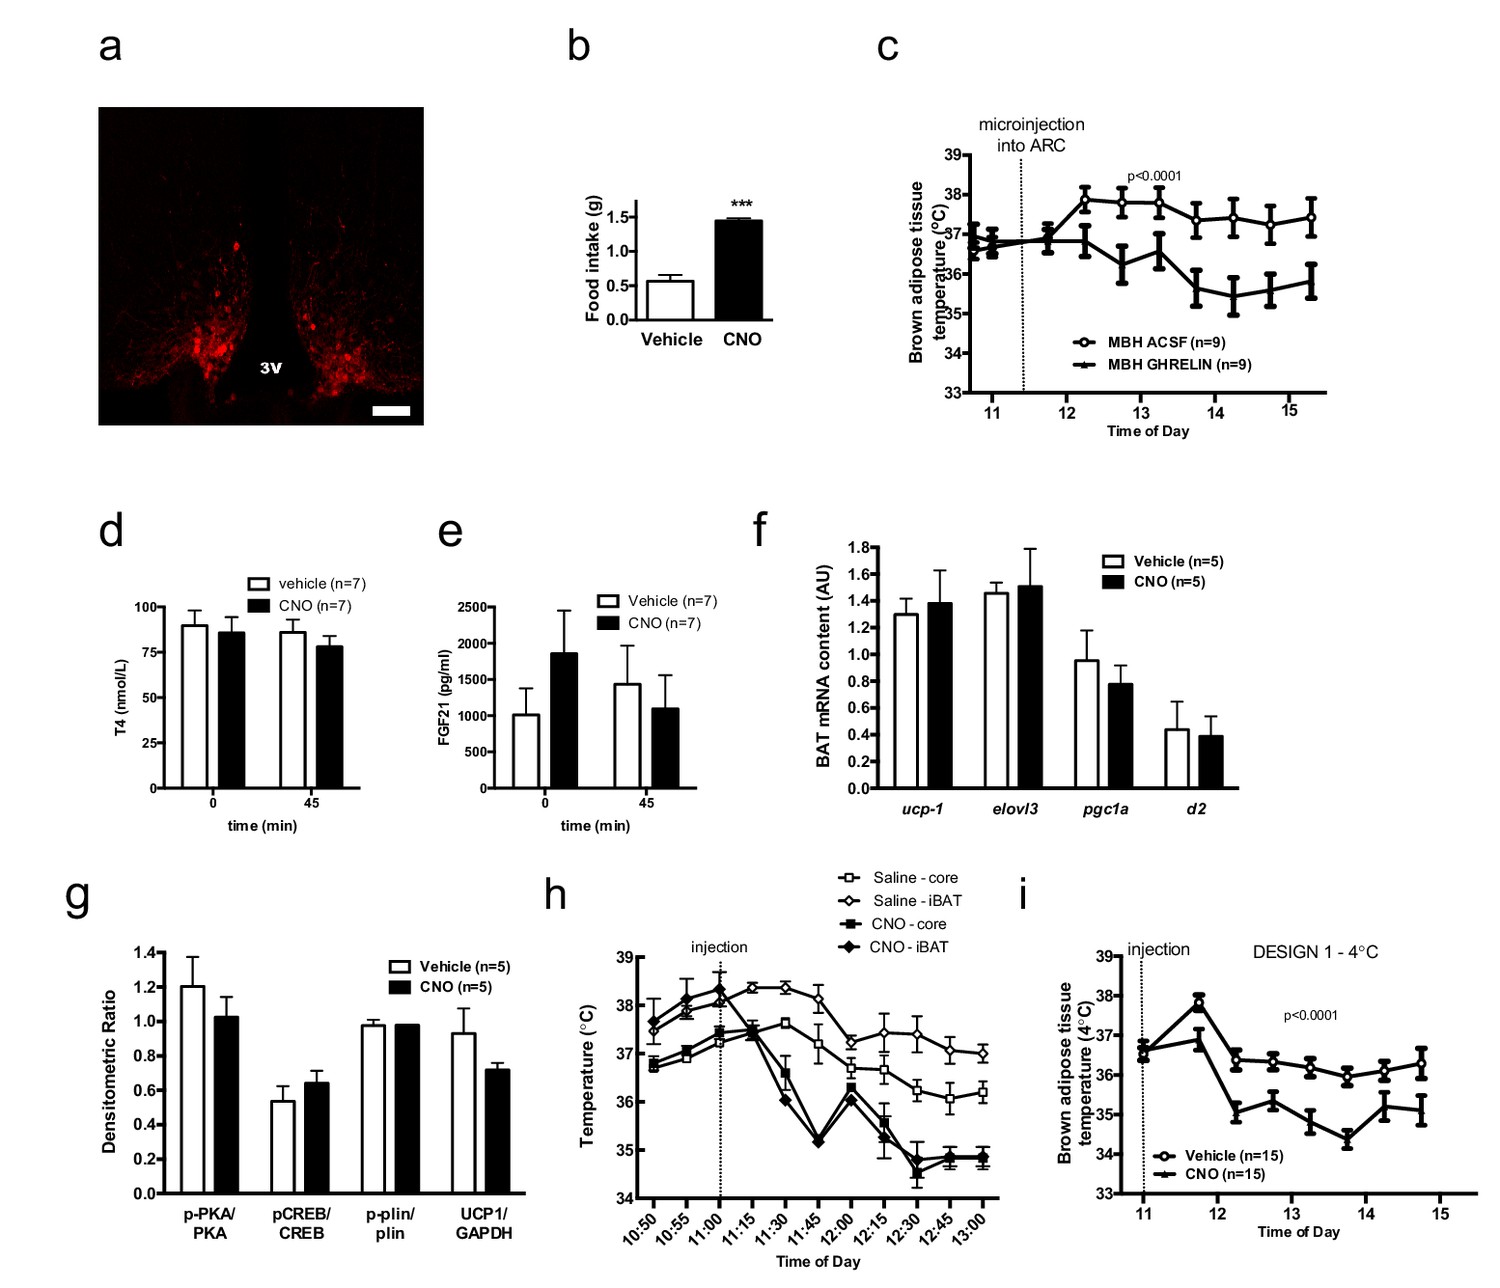
AGRP neurons control iBAT thermogenesis.
Confirmation of successful AAV-targeting using mCherry staining - Scale bar 150 μm (a). Confirmation of increased food intake upon CNO administration (b) iBAT temperature in response to local nanoinjection of ghrelin or artificial cerebrospinal fluid (aCSF) into the mediobasal hypothalamuc (MBH) (c) Serum thyroxine (d) and FGF21 (e) concentrations before and 45 min after AGRP activation. Thermogenic gene expression (f) and β3-adrenergic signaling (g) in iBAT 2 hr following AGRP activation. iBAT and core temperature response to AGRP neuronal activation (n = 4) (h) iBAT temperature response to AGRP neuronal activation in animals maintained a 4°C (i) Data are mean ± SEM. ***p<0.001.
Figure 2 with 1 supplement
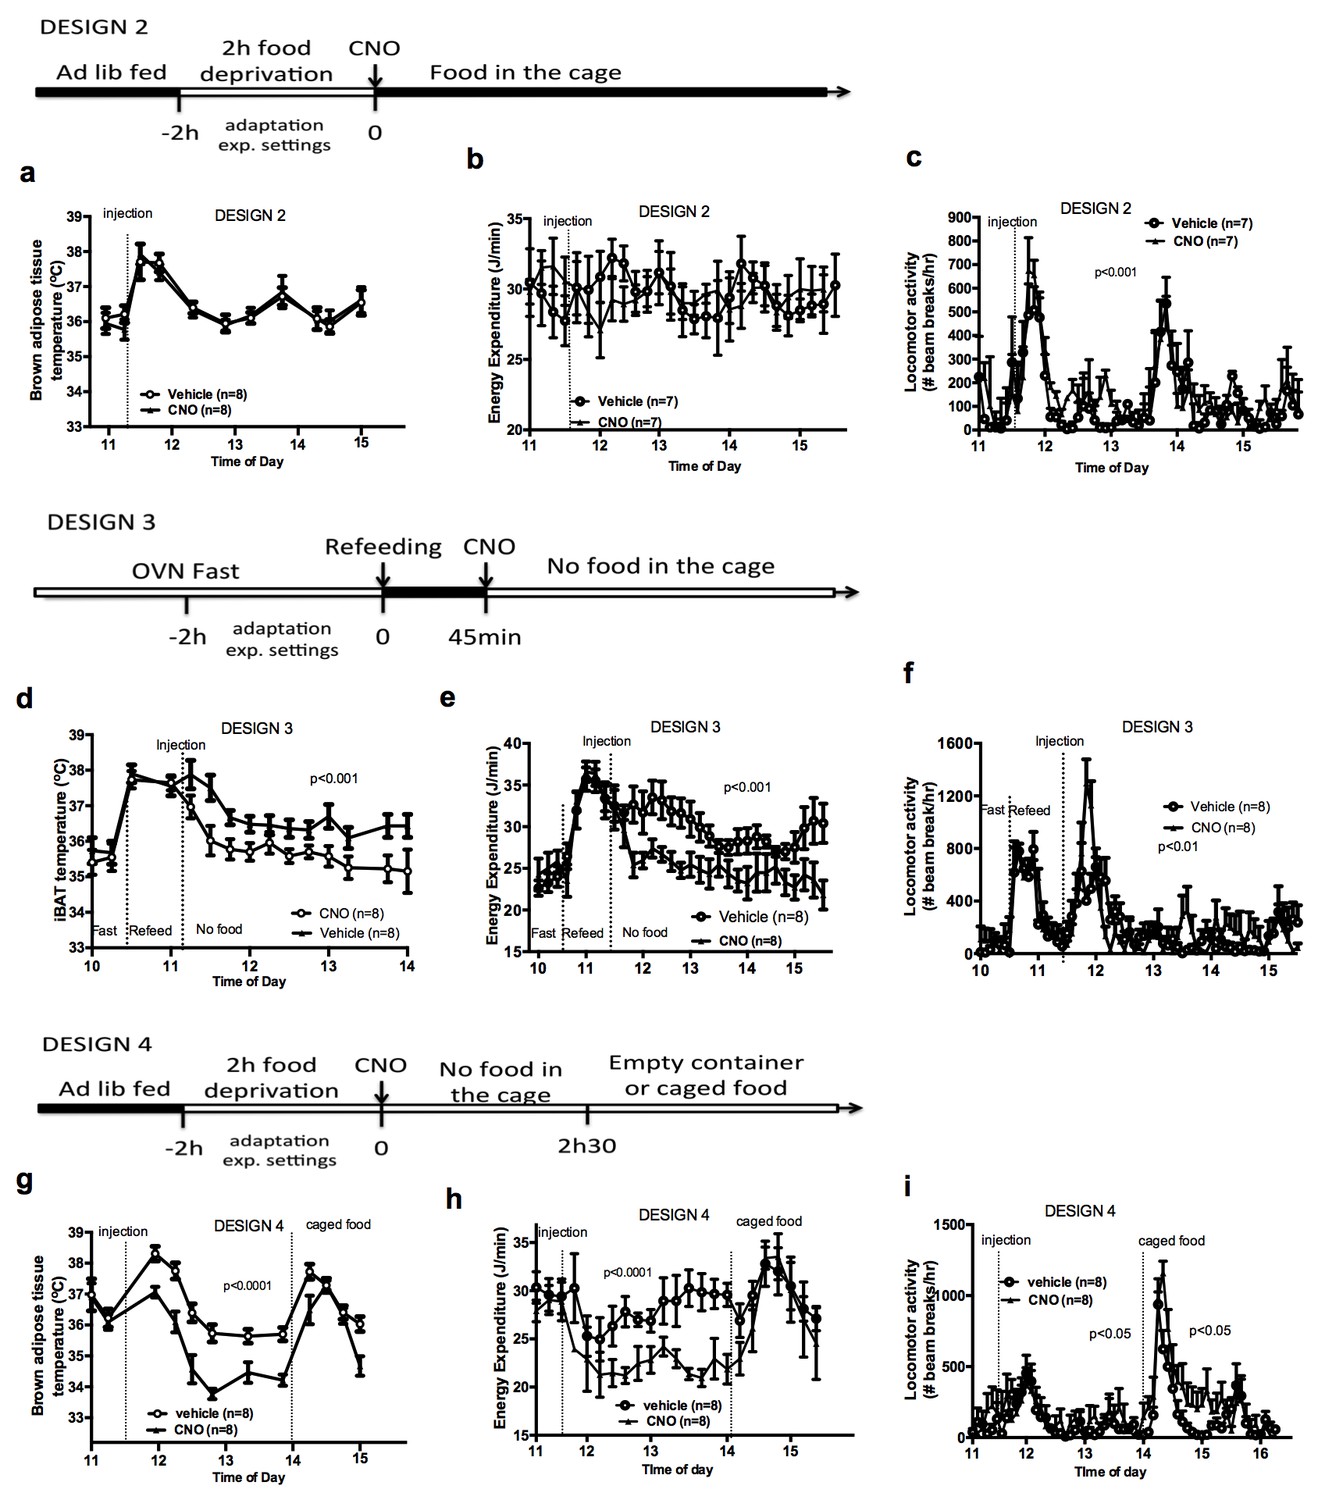
Food availability and sensory cues of food availability modulate the AGRP-iBAT circuit.
iBAT temperature (a), energy expenditure (b) and locomotor activity (c) following chemogenetic activation of AGRP neurons in the presence of food (DESIGN 2). iBAT temperature (d), energy expenditure (e) and locomotor activity (f) following chemogenetic activation of AGRP neurons in refed mice (DESIGN 3). iBAT temperature (g), energy expenditure (h) and locomotor activity (i) following chemogenetic activation of AGRP neurons in the presence of caged food (DESIGN 4). Data are mean ± SEM, *p<0.05 ; ***p<0.001.
Figure 2—figure supplement 1
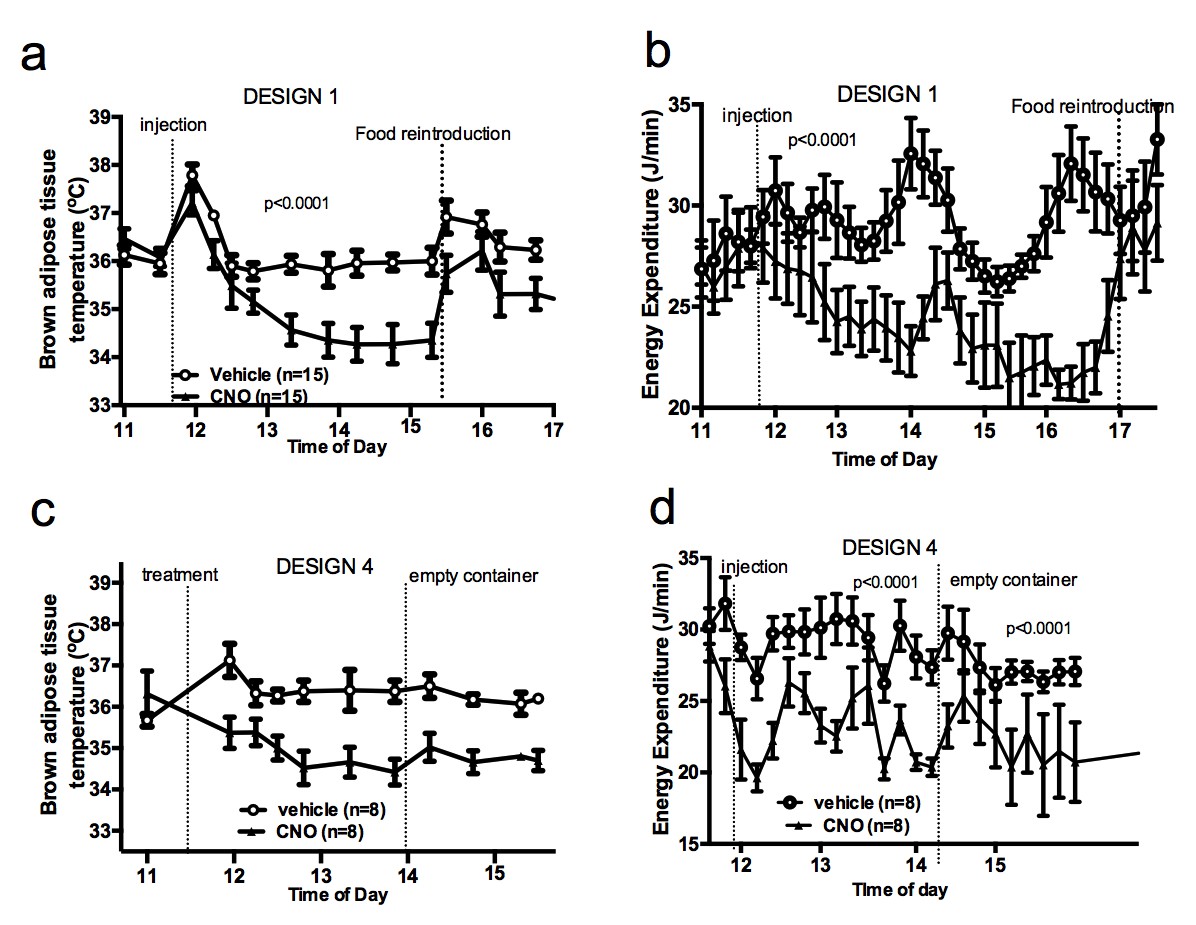
Food availability and sensory cues of food availability modulate the AGRP-iBAT circuit.
iBAT temperature (a) and energy expenditure (b) following chemogenetic activation of AGRP neurons and exposure to a novel empty container. Data are mean ± SEM.
Figure 3 with 1 supplement
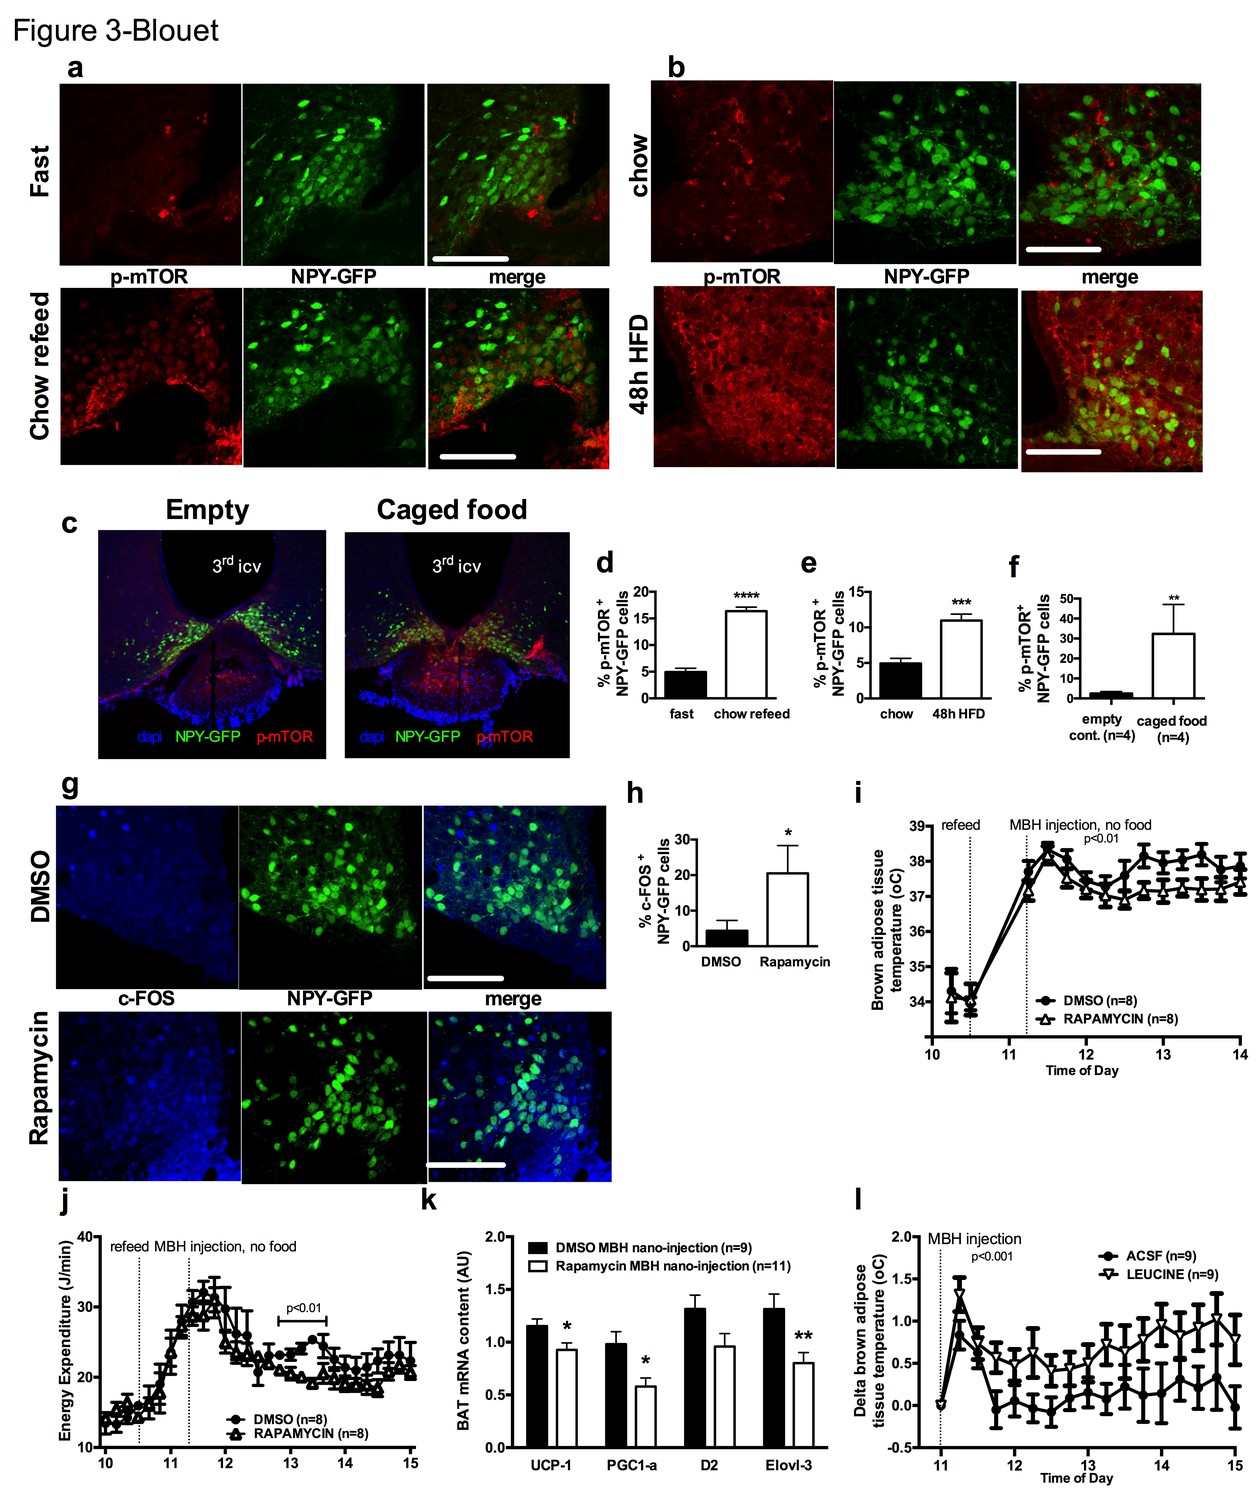
mTOR signaling in AGRP neurons senses endogenous and environmental signals of energy availability, regulates AGRP activity and iBAT thermogenesis.
Activation levels of mTOR in Npy-GFP neurons following a 18 hr fast and 1 hr chow re-feed (a, d, n = 5), and a 48 hr transition from chow to HF diet (b, e, n = 6), and a 18 hr fast followed by a 30 min exposure to caged food (c, f). Npy-GFP neuronal c-fos expression following inhibition of mTORC1 using rapamycin (g, h) – scale bar is 100 μm. iBAT temperature (i), energy expenditure (j) and iBAT thermogenic gene expression (k) following MBH nanoinjection of rapamycin in refed mice. iBAT temperature (l) following MBH nanoinjection of L- leucine in fasted mice. Data are mean ± SEM *p<0.05 ; ***p<0.001 ; ****p<0.0001.
Figure 3—figure supplement 1

mTOR signaling in AGRP neurons senses endogenous and environmental signals of energy availability, regulates AGRP activity and iBAT thermogenesis.
iBAT temperature (a) and energy expenditure (b) in mice fasted for 19 hr and refed for 60 min. p-mTOR immunofluorescent staining in mouse hypothalamic brain sections at the rostrocaudal level of the ARH 60 min following an ip injection of DMSO or rapamycin (c). p-mTOR (red) immunostaining in one refed Npy-GFP mouse showing the rostrocaudal localization of the NPY/p-mTOR costain (d). iBAT temperature (e) iBAT ucp-1 mRNA expression (f) and energy expenditure (g) in mice maintained on chow or fed a high fat diet for 48 hr. Locomotor activity (h) in mice fasted overnight for 19 hr, refed a chow meal and injected with rapamycin into the MBH. Energy expenditure (i) in mice fasted for 6 hr and injected with L-leucine into the MBH. Data are mean ± SEM. *p<0.05, ***p<0.001.
Figure 4 with 1 supplement
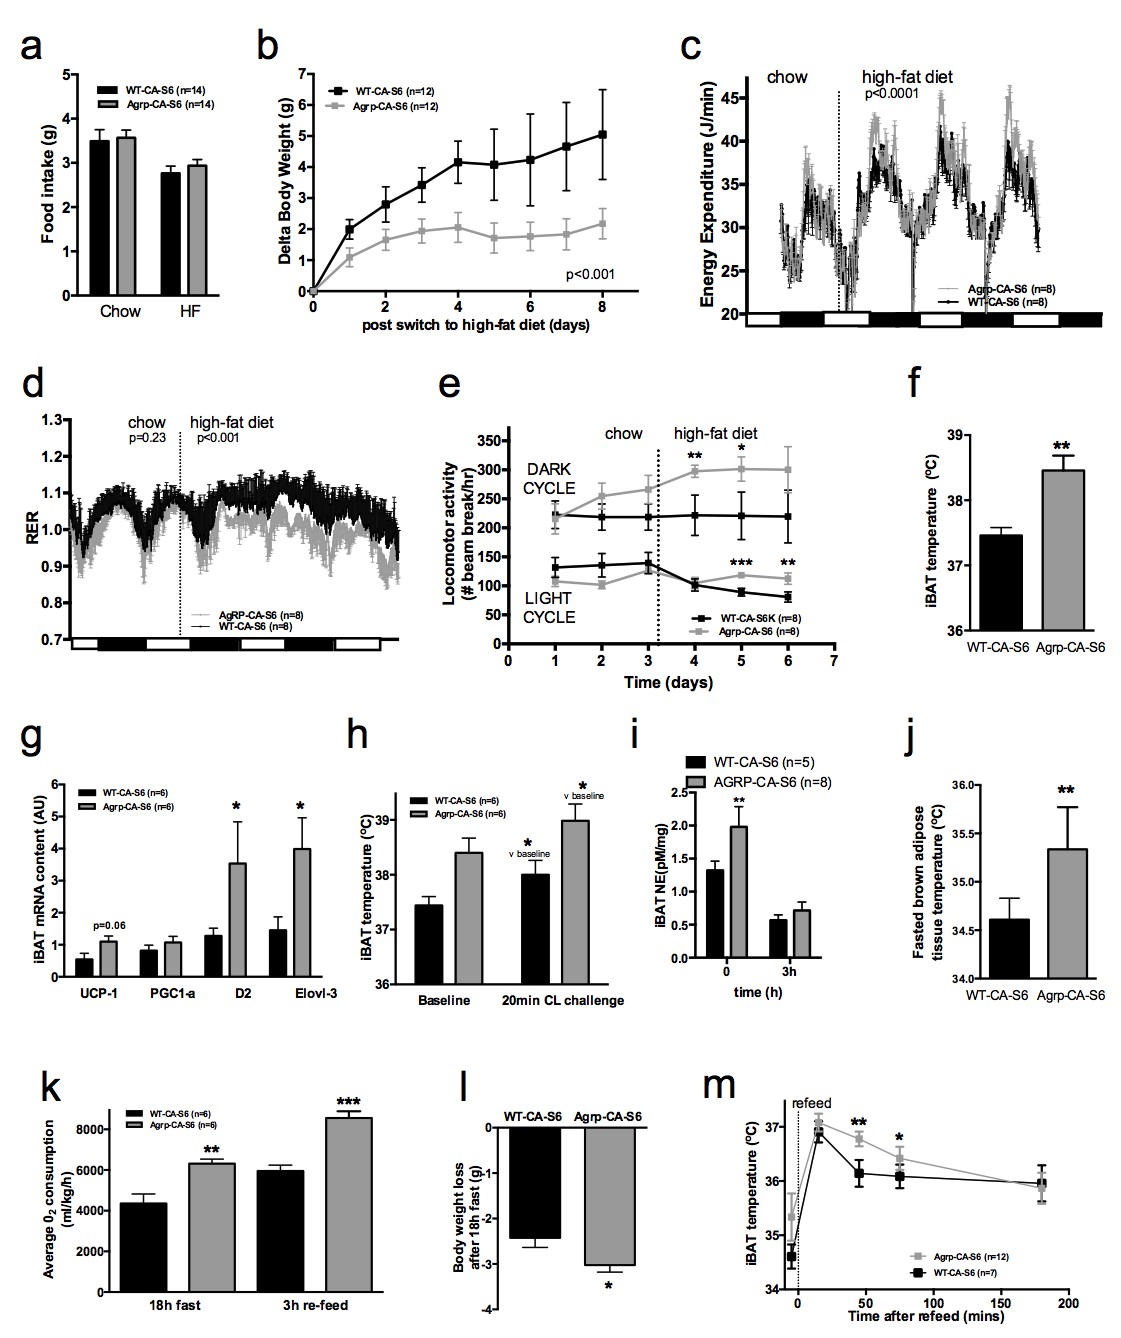
Metabolic phenotyping of mice expressing constitutively active mutant of mTORC1 effector p70 S6 kinase one in Agrp-IRES-cre (Agrp-CA-S6) or wild-type (WT-CA-S6) littermates.
Food intake (a), body weight gain on high-fat diet (b), energy expenditure (c), RER (d), locomotor activity (e), iBAT temperature (f), iBAT thermogenic gene expression (g), iBAT temperature following β3-agonist-induced challenge (h), and Norepinephrine turnover (i) in Agrp-CA-S6 and WT-CA-S6 mice. iBAT temperature (i), energy expenditure (j), and body weight loss during 18 hr overnight fast (k), and iBAT temperature during 3 hr re-feed (l) in Agrp-CA-S6 and WT-CA-S6 mice. Data are mean ± SEM *p<0.05 ; **p<0.01 ; ***p<0.001.
Figure 4—figure supplement 1
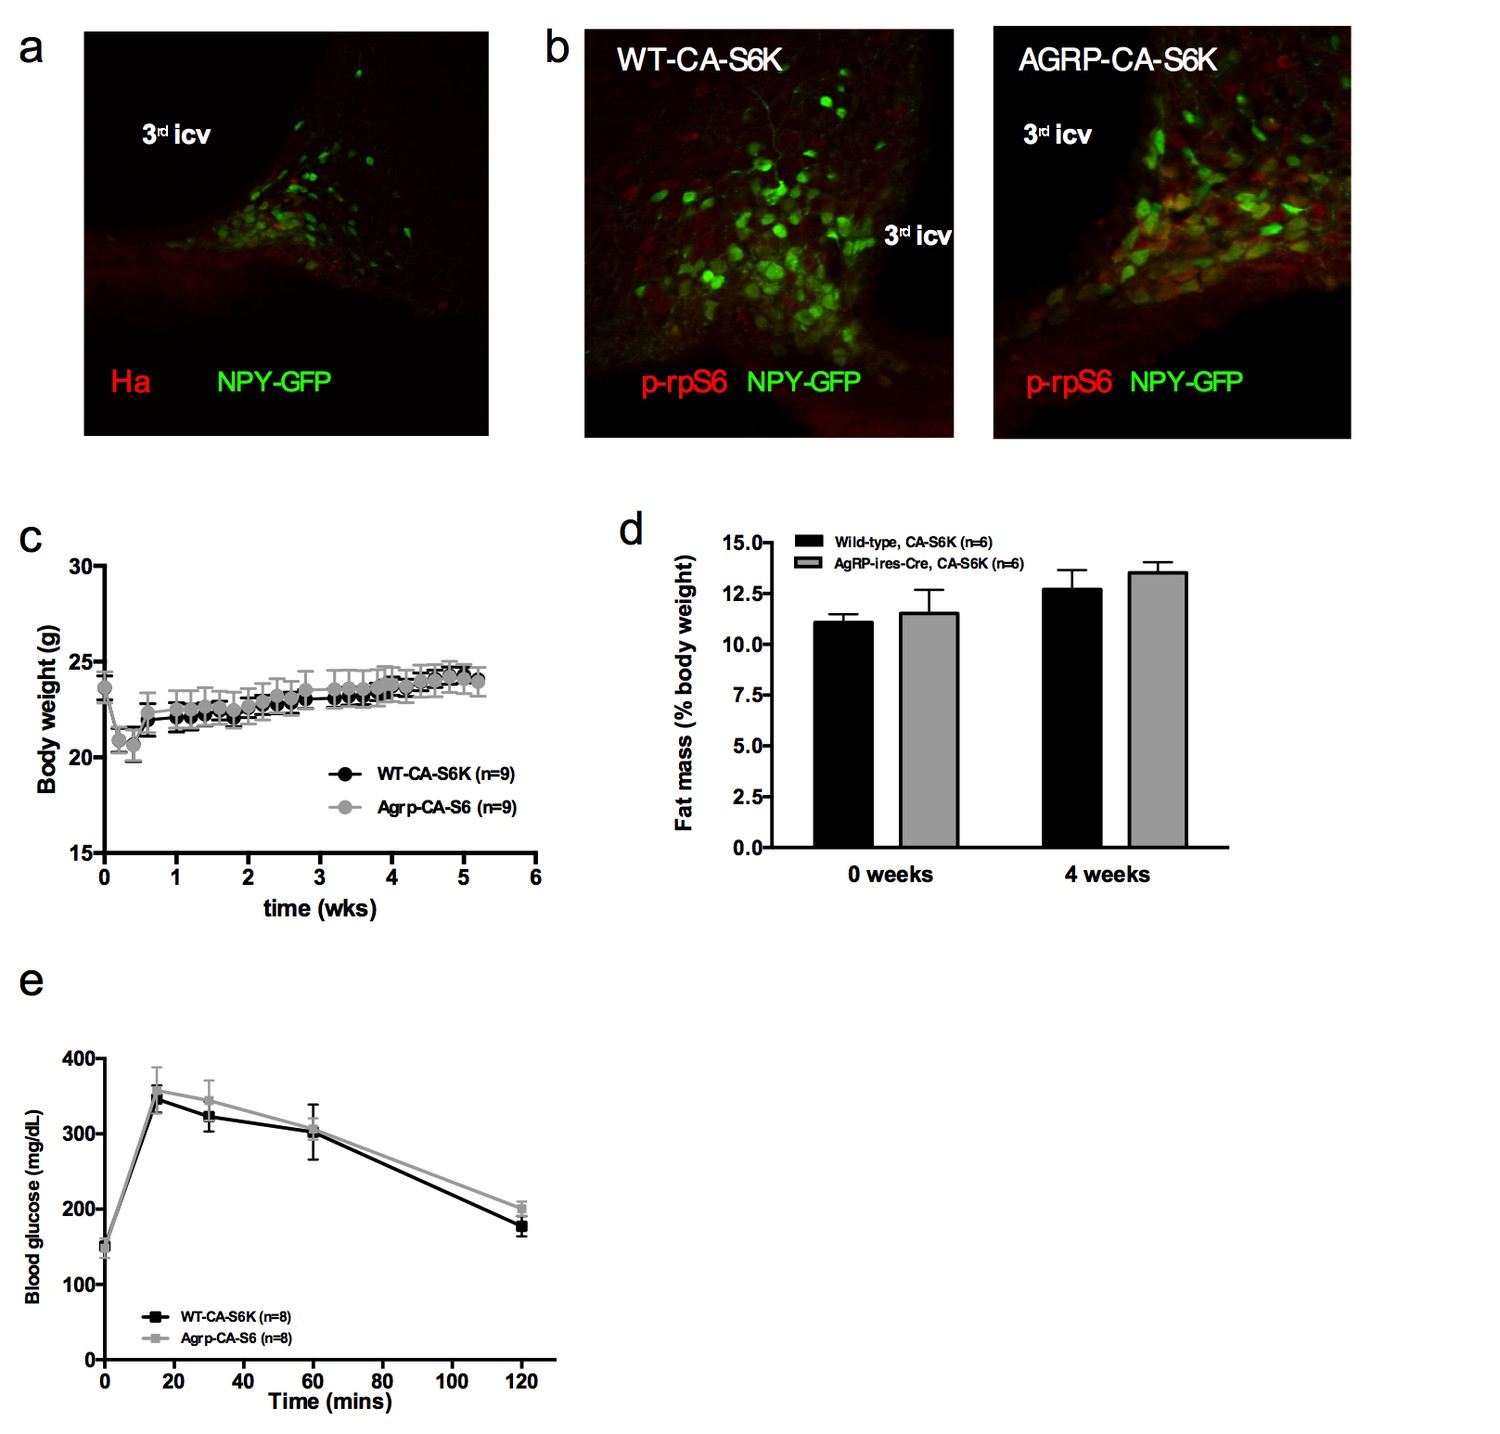
Metabolic phenotyping of mice expressing constitutively active mutant of mTORC1 effector p70 S6 kinase one in Agrp-IRES-cre (Agrp-CA-S6) or wild-type (WT-CA-S6) littermates.
Ha (a) and p-rpS6 (b) immunostaining in Agrp-IRES-cre;Npy-GFP mice infected with the pCDH-CMV-FLEX-HA-S6K1-F5a lentivirus. Body weight gain (c) fat mass (d) and glucose tolerance (d) of Agrp-CA-S6 and WT-CA-S6 mice under chow maintenance. Data are mean ± SEM.
Figure 5 with 1 supplement

Metabolic phenotyping of mice expressing dominant negative mutant of mTORC1 effector p70 S6 kinase 1 (S6K1) in Agrp-IRES-cre (Agrp-DN-S6) or wild-type (WT-DN-S6).
Energy expenditure (a), locomotor activity (b), iBAT temperature (c), iBAT thermogenic gene expression (d), body weight gain during initial switch to HF diet (e), food intake (f), body weight loss during overnight 18 hr fast (g), and energy expenditure during fast and re-feed (h) in Agrp-DN-S6 and WT-DN-S6 mice. Body weight gain of Agrp-DN-S6 and WT-DN-S6 mice at thermoneutrality under chow (i) and HF (k) diet. Data are mean ± SEM *p<0.05 ; **p<0.01; ***p<0.001.
Figure 5—figure supplement 1
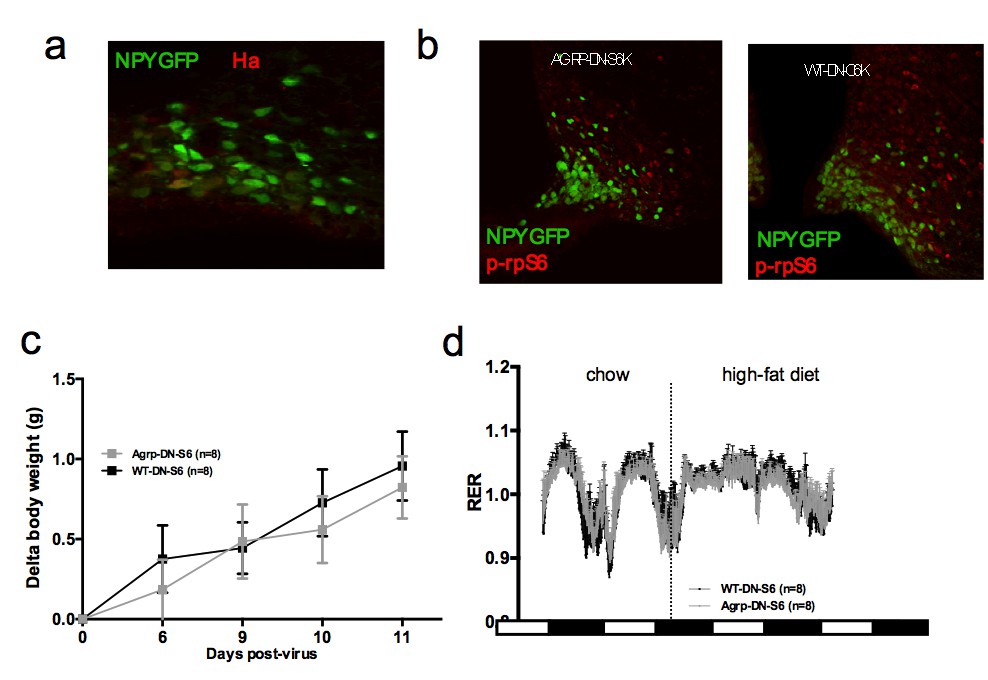
Metabolic phenotyping of mice expressing dominant negative mutant of mTORC1 effector p70 S6 kinase 1 (S6K1) in Agrp-IRES-cre(Agrp-DN-S6) or wild-type (WT-DN-S6).
Ha (a) and p-rpS6 (b) immunostaining in Agrp-IRES-cre;Npy-GFP mice infected with the pCDH-CMV-FLEX-HA-S6K1-KR lentivirus. Body weight gain on chow (c) and RER in Agrp-DN-S6 and WT-DN-S6 mice. Data are mean ± SEM.
Figure 6
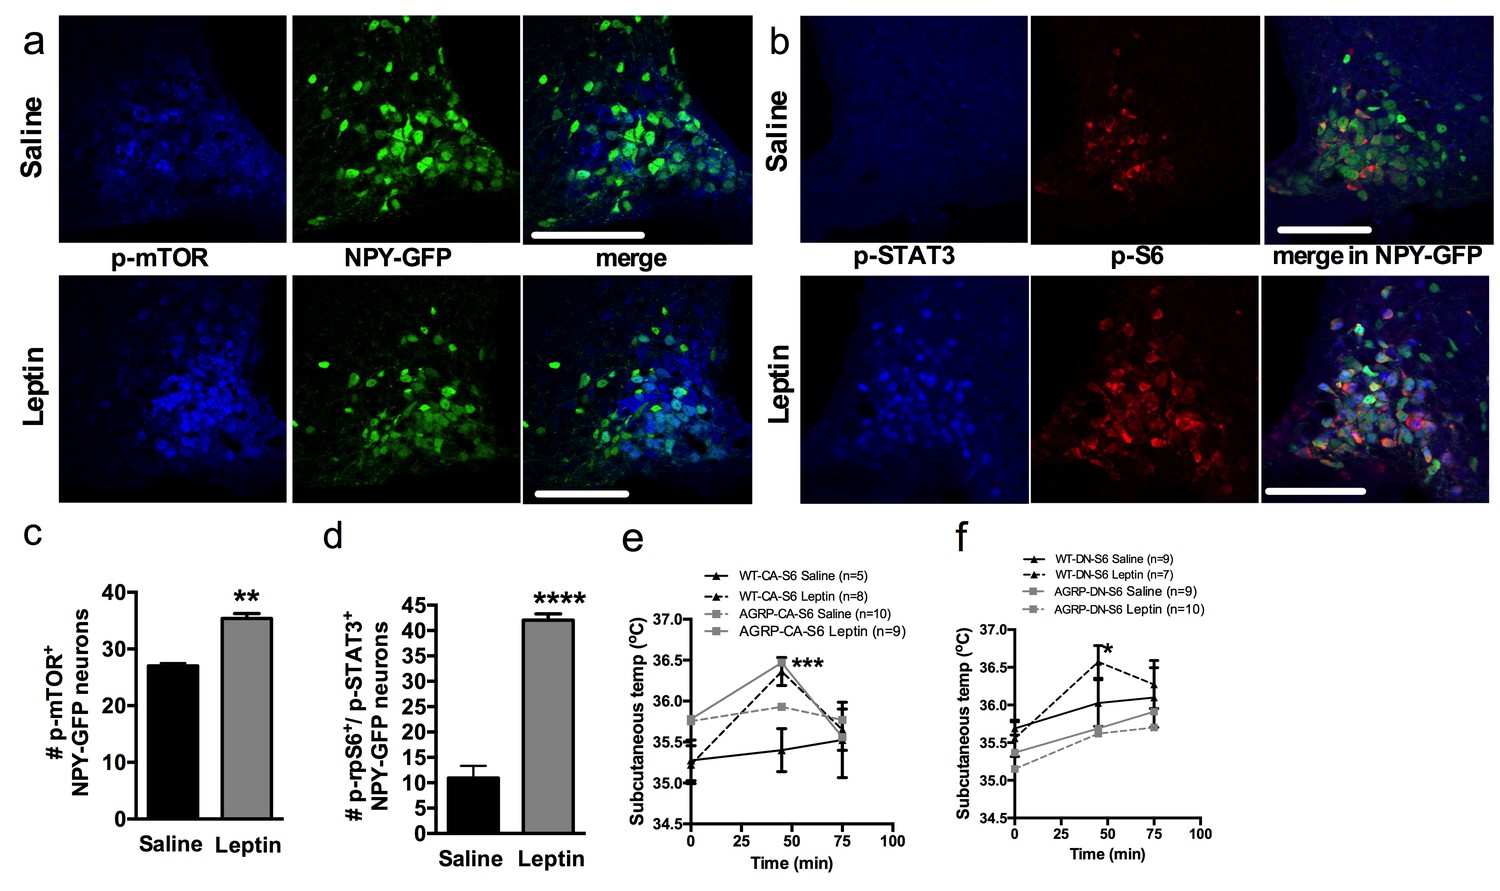
Leptin engages mTORC1 signaling in AGRP neurons to regulate thermogenesis.
Expression of p-mTORC1 (a, c) and colocalization of p-rpS6 and p-STAT3 (b, d) in Npy-GFP neurons following systemic leptin treatment. Leptin’s thermogenic effects in WT-CA-S6 and Agrp-CA-S6 (e), and WT-DN-S6 and Agrp-DN-S6 (f) mice. Data are mean ± SEM *p<0.05 ; **p<0.01 ; ***p<0.001.
Additional files
-
Supplementary file 1
Real time PCR oligonucleotide sequences.
- https://doi.org/10.7554/eLife.22848.014
Download links
A two-part list of links to download the article, or parts of the article, in various formats.
Downloads (link to download the article as PDF)
Open citations (links to open the citations from this article in various online reference manager services)
Cite this article (links to download the citations from this article in formats compatible with various reference manager tools)
mTORC1 in AGRP neurons integrates exteroceptive and interoceptive food-related cues in the modulation of adaptive energy expenditure in mice
eLife 6:e22848.
https://doi.org/10.7554/eLife.22848


