Semi-intact ex vivo approach to investigate spinal somatosensory circuits
- University of Pittsburgh, United States
Figures
Figure 1 with 1 supplement
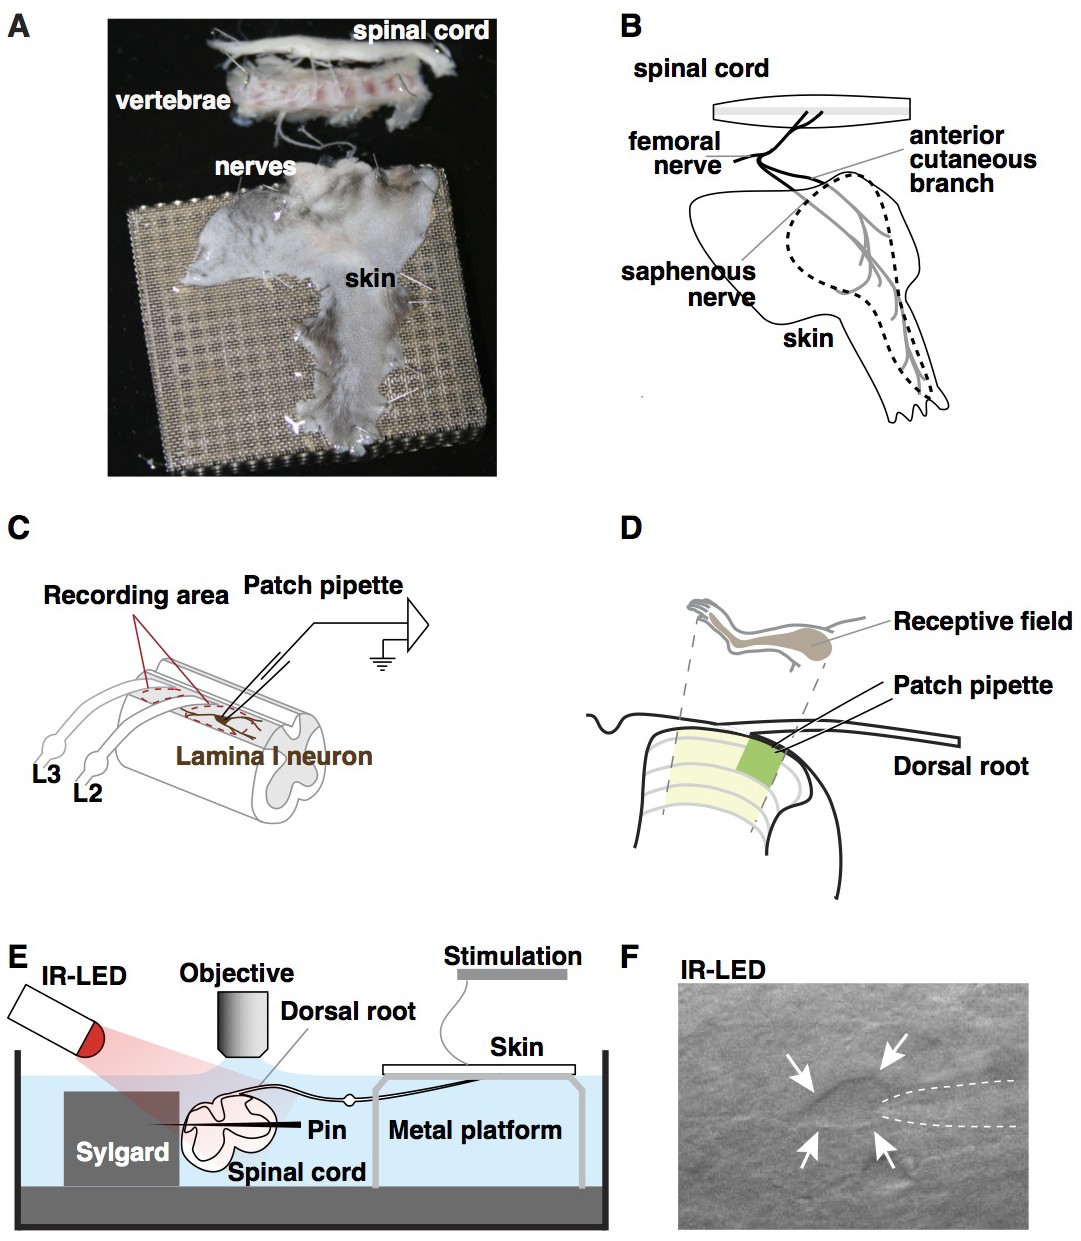
Ex vivo semi-intact somatosensory preparation.
(A–B) Photograph (A) and schematic (B) of the semi-intact somatosensory preparation. The right dorsal hindlimb skin with saphenous nerve and anterior cutaneous branch are dissected in continuity with L2 and L3 roots and the spinal cord. Region containing receptive fields of recorded neurons is dotted. (C) Diagram illustrating targeted region of spinal cord. Patch-clamp recordings are made rostral to L2 root or between L2 and L3 (red dotted circles). (D) Somatotopic organization of saphenous nerve and anterior cutaneous branch. Hindlimb skin is represented in the area of spinal cord that is shaded yellow. The region that is most accessible for recording is shaded green. (E) Side view of the preparation. The spinal cord is pinned to Sylgard chamber and illuminated by high-power infrared LED. (F) Oblique infrared LED illumination reveals a lamina I neuron, as indicated by arrows, which is targeted for recording by glass electrode, indicated with dotted lines.
Figure 1—figure supplement 1
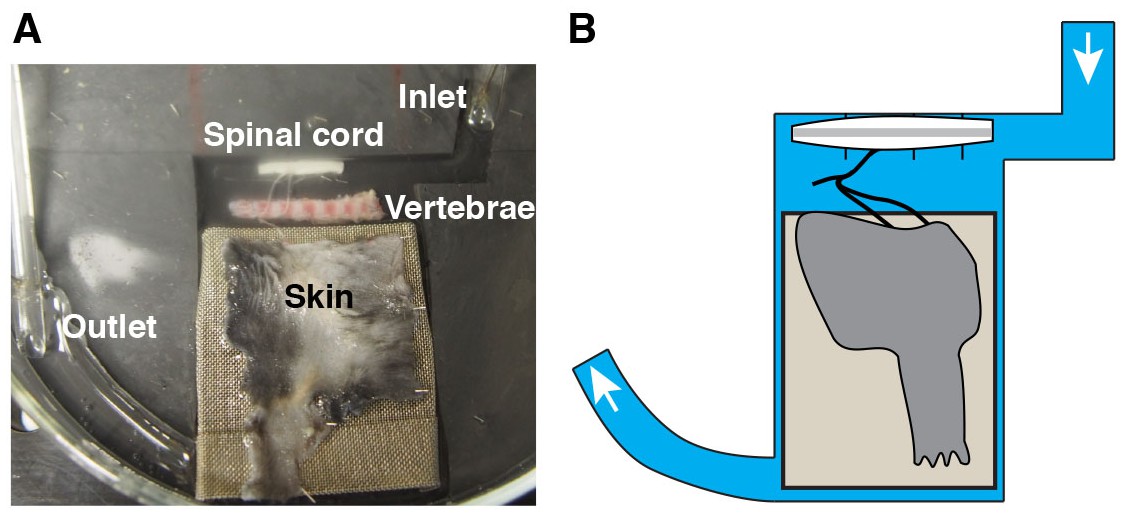
Alternative recording chamber optimized for pharmacological experiments.
(A–B) Photograph (A) and cartoon (B) of the chamber. The Sylgard-carved water route enables a reduced perfusion rate and a rapid solution exchange for temporal control of drug application and removal.
Figure 2
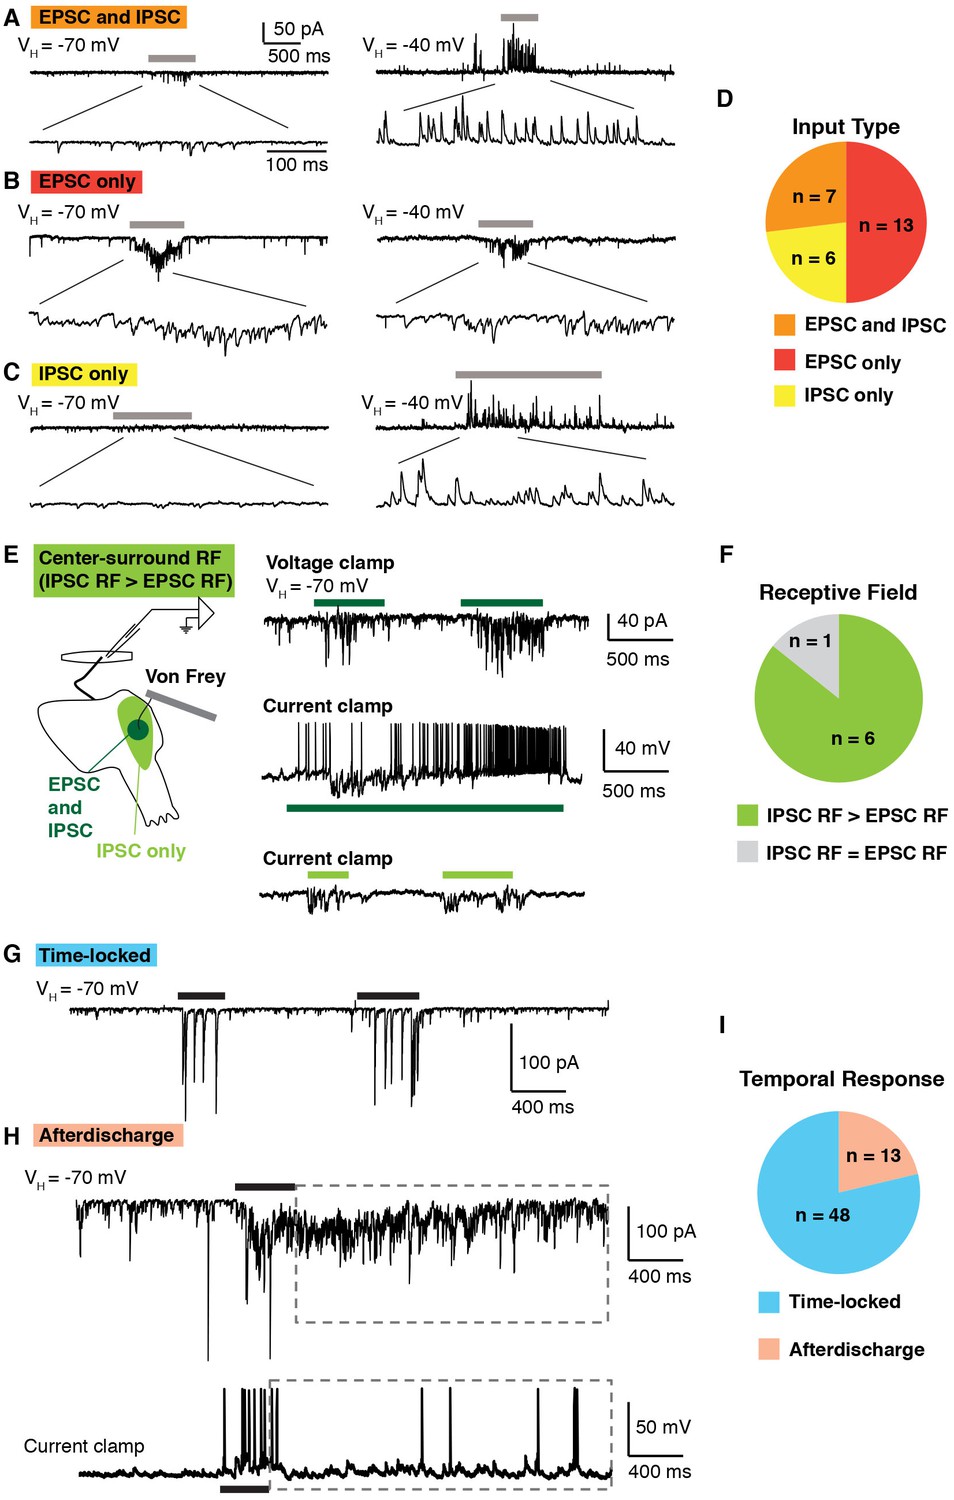
Temporal and spatial response of excitatory and inhibitory inputs.
(A–D) Analysis of excitatory and inhibitory input onto lamina I neurons upon brushing of the skin (grey bars). At a holding potential of −70 mV, only EPSCs are observed, whereas at a holding potential of −40, IPSCs are clearly visible as outward current. Example of a lamina I cell that receives EPSCs and IPSCs (A), EPSCS only (B) and IPSCs only (C). Summary (D) of input type from 26 lamina I neurons. (E–F) Spatial analysis of the receptive fields of lamina I neurons. Example of a neuron that shows center-surround organization (E). Stimulation (von Frey filament 2 g) in the center of the receptive field (dark green) elicited EPSCs in voltage clamp at VH of −70 mV (top trace). In current clamp, mechanical stimulation causes IPSPs as well as action potentials (middle trace). Mechanical stimulation on the outer side of the receptive field (light green area) caused IPSPs but no EPSPs (bottom trace). Summary (F) of receptive fields from seven lamina I neurons. 6 of 7 showed inhibitory receptive fields that were significantly larger than their excitatory receptive fields. (G–I) Temporal analysis of responses of lamina I neurons. Example of a neuron that showed time-locked responses (G) and afterdischarge (boxed dashed line; H) to mechanical stimulation (von Frey filament, 2 g, black bar) of the receptive field. Summary (I) of temporal responses of 61 lamina I neurons.
Figure 3

Modality tuning of projection neurons.
(A) Infrared (IR; left) and epifluorescent image (right) of lamina I projection neuron that was retrogradely labeled by injection of DiI into the lateral parabrachial nucleus. The cell is indicated with arrows. (B–E) Example traces of lamina I projection neurons that respond to mechanical stimulation (M; von Frey filament, 1 g, black bar), heat (H; 50°C saline, red bar) and/or cold (C; 0°C saline, blue bar), (F) Summary of tuning properties of 14 lamina I spinal projection neurons.
Figure 4
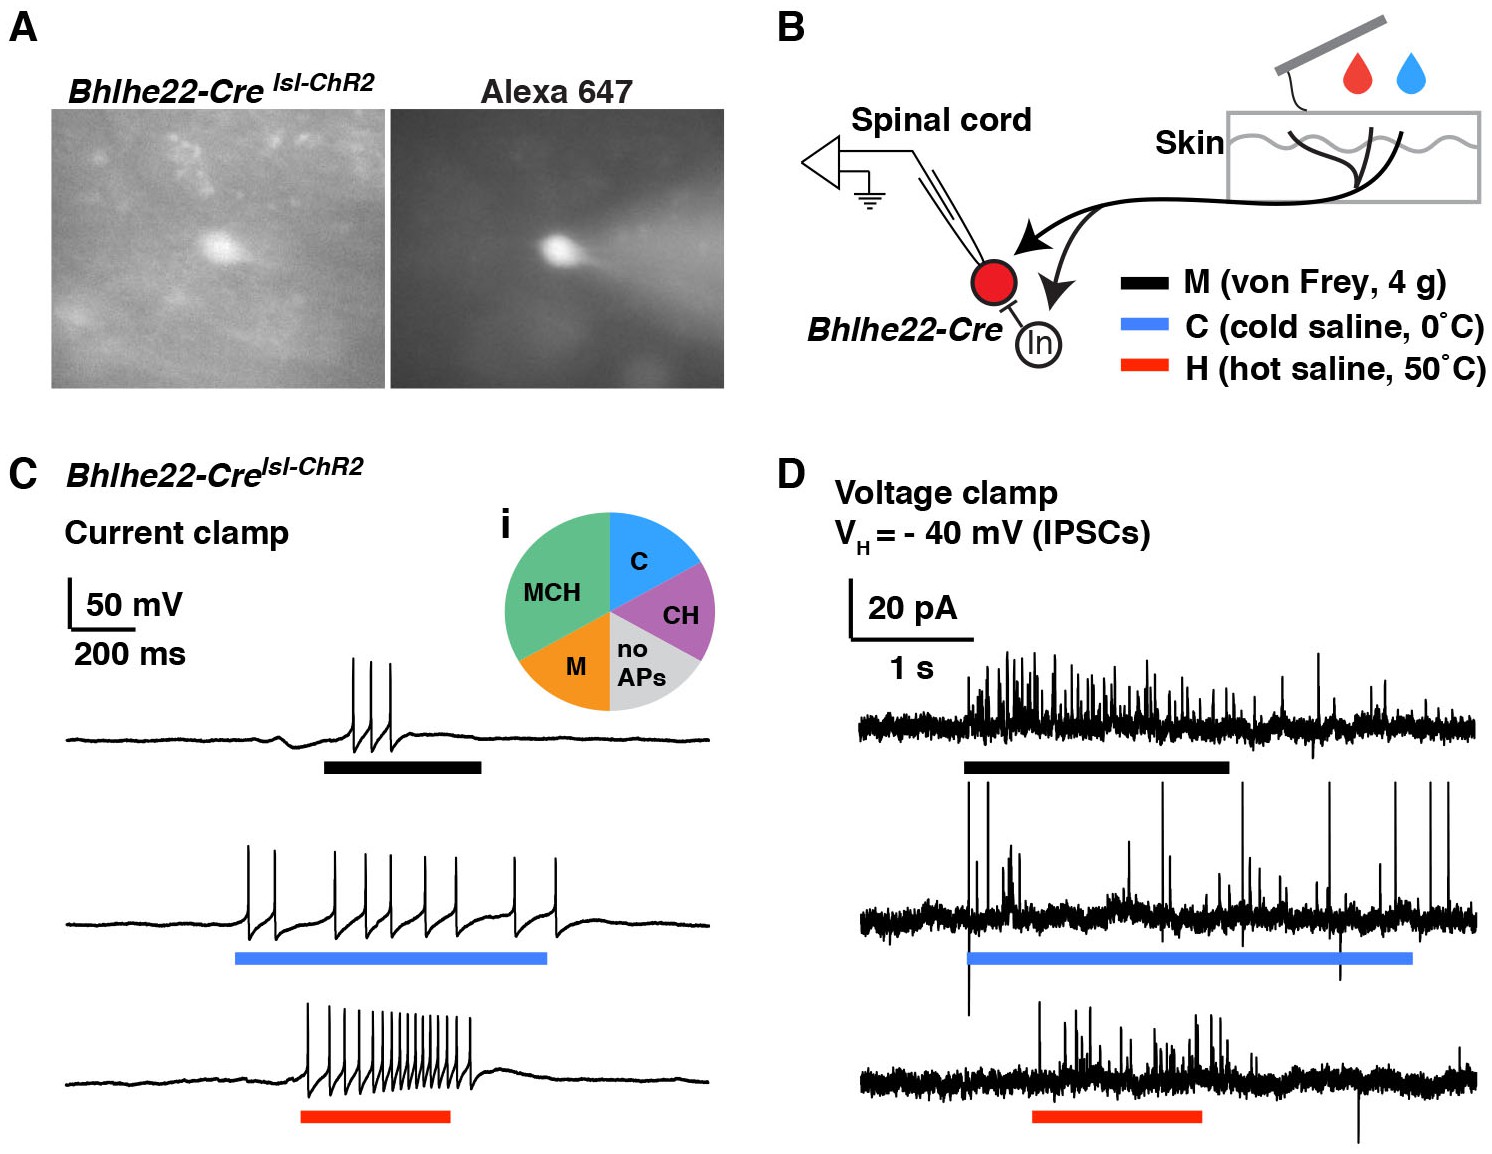
Modality tuning (excitatory and inhibitory) of Bhlhe22-Cre-labeled spinal interneurons.
(A) Recording from a lamina II interneuron from a Bhlhe22-Crelsl-tdT mouse (left). The cell was filled with alexa 647 to confirm correct targeting (right). (B) Diagram illustrating the recording set-up. Bhlhe22-Cre cells were characterized based on the types of stimuli that caused action potentials, and the types of stimuli that elicited inhibitory input, as indicated. (C) Example traces from a Bhlhe22-Cre neuron that showed action potentials in response to mechanical stimulation, cold and heat. Inset (i) shows summary of responses from 6 Bhlhe22-Cre neurons. (D) Example traces from a Bhlhe22-Cre neuron that showed IPSCs in response to mechanical stimulation, cold and heat. C and D are recorded from the same cell.
Figure 5 with 1 supplement
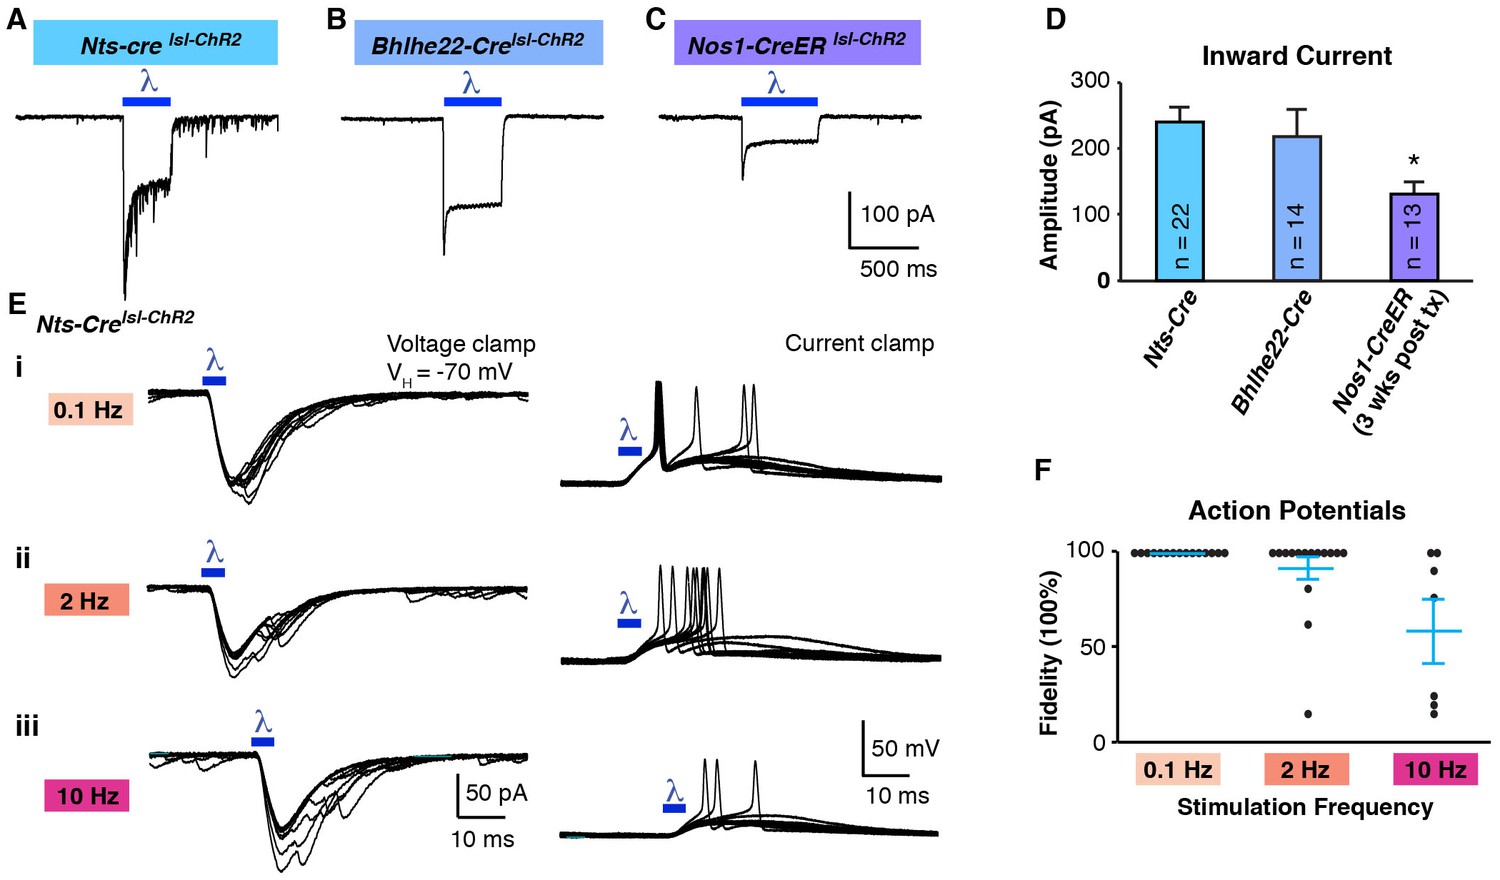
Optogenetic activation of spinal interneurons.
(A–C) Representative traces of light-induced inward current in Nts-Cre (A), Bhlhe22-Cre (B) and Nos1-CreER (C) neurons expressing ChR2. (D) Quantification of light-evoked inward current. *p<0.05, One-way ANOVA followed by Tukey’s test. Data are mean + SEM. Number of recorded cells is indicated. (E) Inward current (left) and action potentials (right) in Nts-Cre neurons expressing ChR2 induced by a brief blue light pulse (blue bar; 5 ms) delivered 0.1 Hz (i), 2 Hz (ii) or 10 Hz (iii). Ten traces are superimposed to compare response jitter. (F) Fidelity of optogenetic-induced action potentials in Nts-Cre cells (expressed as percent) varies with frequency of stimulation. Black dots, individual cells; blue lines, mean ± SEM.
Figure 5—figure supplement 1
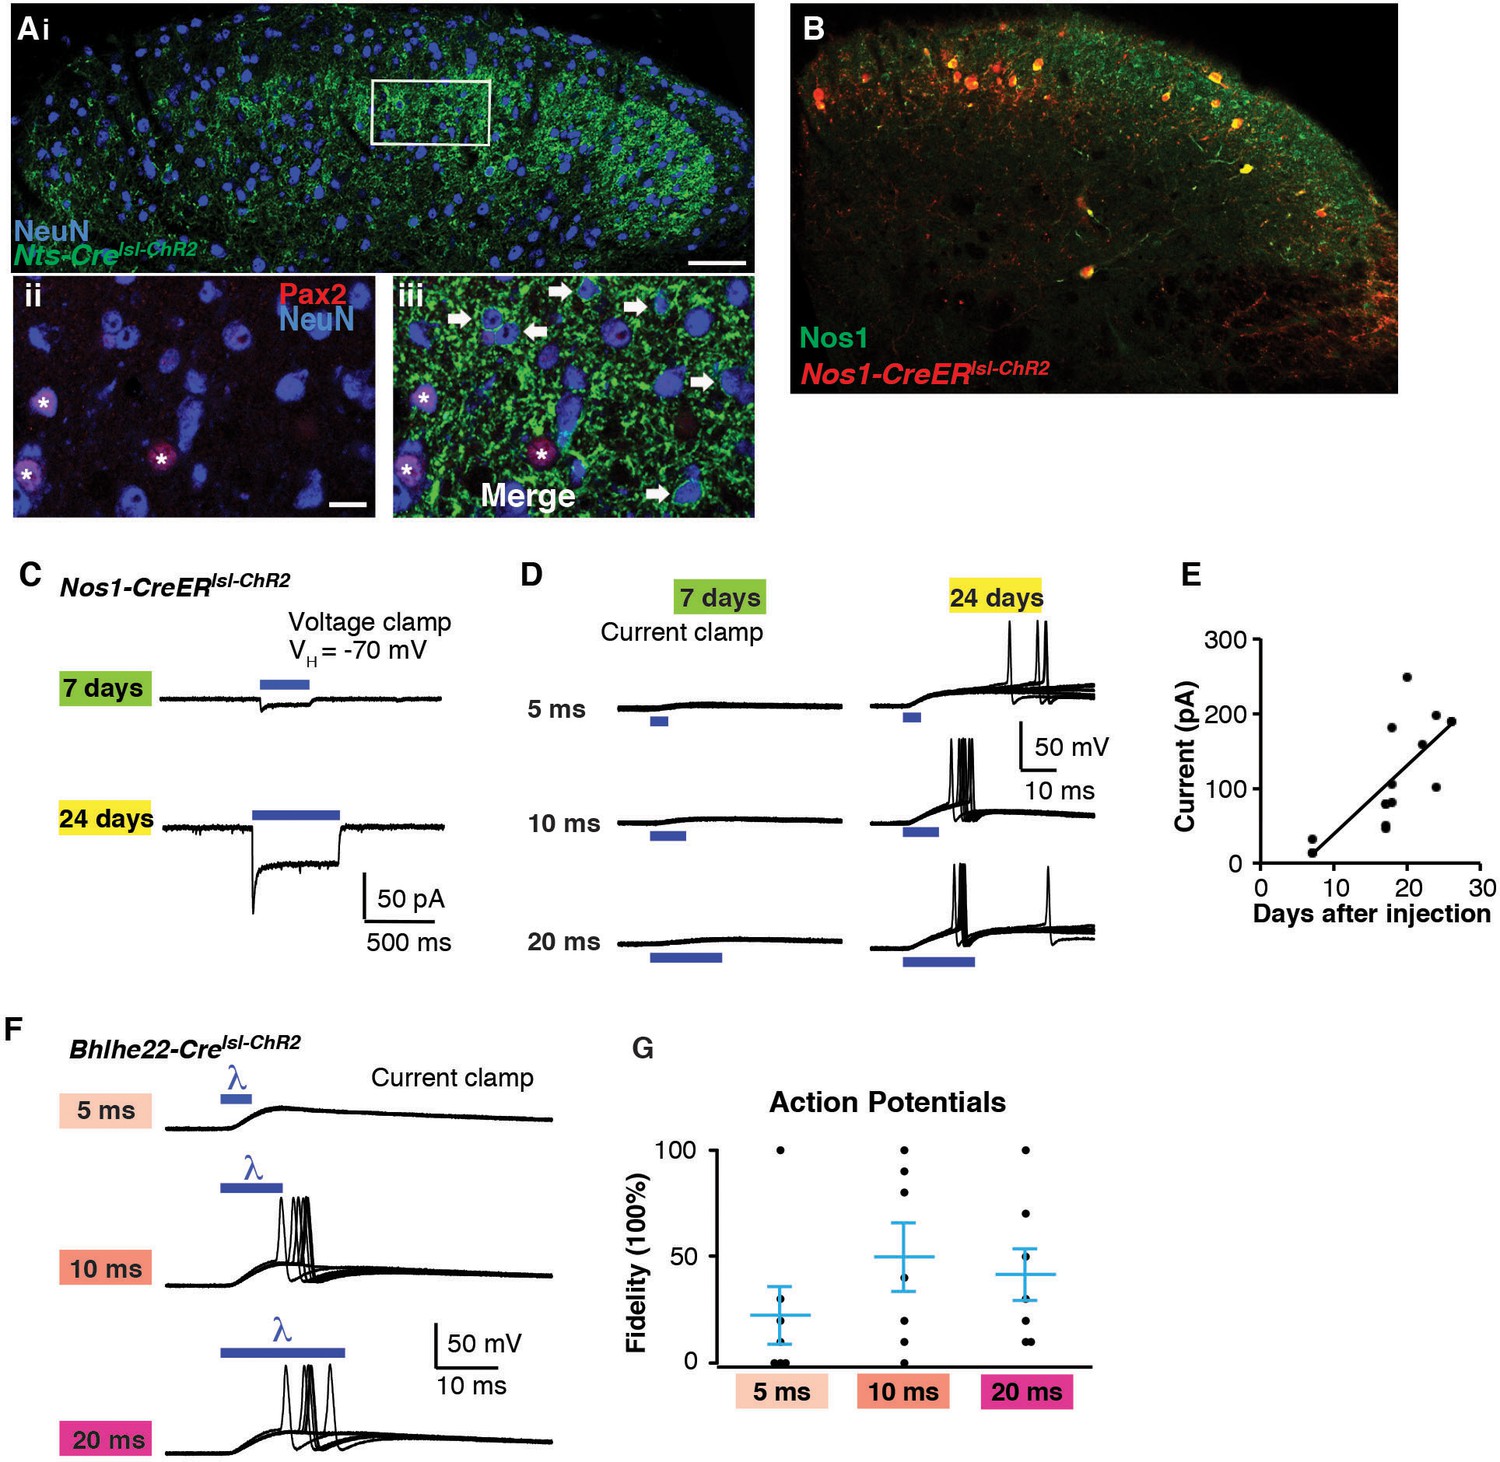
Optogenetic activation of spinal interneurons.
(A) Confocal image of transverse spinal cord section from Nts-Crelsl-ChR2 mice. (i) ChR2-YFP signal (green) is mainly found in lamina IIo-III. Inhibitory neurons are labeled with Pax2 in red (ii, asterisk). Little to no co-localization is found between ChR2 (arrow) and Pax2. (iii). Approximately 50% of Pax2-negative neurons show recombination. (B) Confocal image of transverse spinal cord section from Nos1-CreERlsl-tdT mice. Nos1 (green) was co-labeled with tdT. Approximately 95% of recombined cells show Nos1 expression; up to 90% (depending on dose of tamoxifen) of Nos1-expressing neurons show recombination (C) Blue light-induced inward current from mice of different survival time after tamoxifen injection (7 and 24 days). (D) Response to blue light pulses (5 ms, 0.3 Hz) in Nos1-CreER neurons. Note that blue light induced only small EPSP without action potentials 7 days after tamoxifen injection. (E) Relationship between days after tamoxifen injection and peak inward current evoked by blue light. (Equation for regression: y = 9.15 x –52.57) (F) Response to different light pulse duration in Bhlhe22-Crelsl-ChR2 neurons. G. Fidelity in response to different light pulse duration.
Figure 6

Optogenetic inhibition of spinal interneurons.
(A–B) Representative traces of light-induced outward current in an Nts-Cre interneuron that expresses Arch (A) and a Bhlhe22-Cre interneuron that expresses Halo (B). (C) Quantification of optogenetic-induced outward current in Nts-Cre neurons expressing Arch (NtsArch; green) and Bhlhe22-Cre neurons expressing Halo (Bhlhe22Halo; orange). Data are mean + SEM; n.s., not significant (p>0.05, student’s t-test). Number of recorded cells is indicated. (D–E) Representative traces showing the effect of optogenetic stimulation on root-evoked action potentials in Nts-Cre neurons expressing Arch (D) and Bhlhe22-Cre neurons expressing Halo (E). Root stimulation is indicated with arrows; optogenetic stimulation is marked by bars. Expanded traces are shown below. (F) Quantification of optogenetic-induced hyperpolarization in Nts-Cre neurons expressing Arch (NtsArch; green) and Bhlhe22-Cre neurons expressing Halo (Bhlhe22Halo; orange). Data are mean + SEM; n.s., not significant (p>0.05, student’s t-test). Number of recorded cells is indicated. (G) Quantification of the effect of optogenetic activation on root-evoked action potentials in Nts-Cre neurons expressing Arch (NtsArch; green) and Bhlhe22-Cre neurons expressing Halo (Bhlhe22Halo; orange). Data are mean + SEM; n = 5 Nts-Cre neurons and 3 Bhlhe22-Cre neurons; *p<0.05, Student’s t-test.
Figure 7
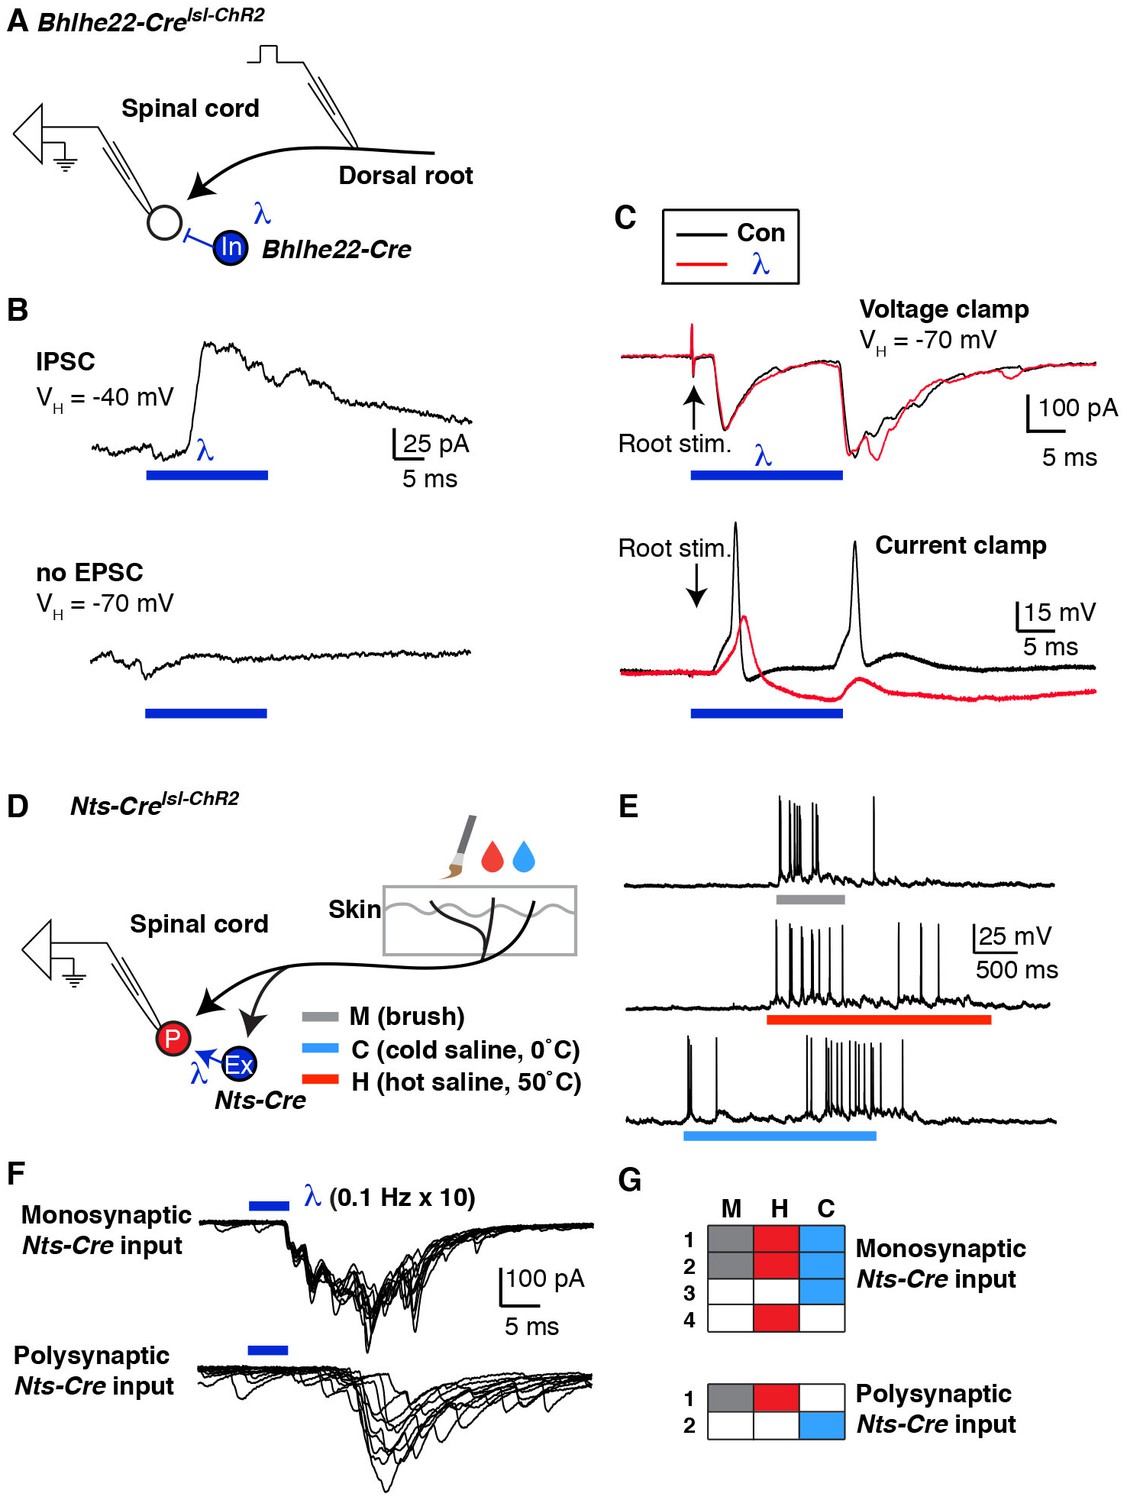
Mapping spinal connectivity using optogenetics.
(A) Diagram illustrating experimental set-up to test the effect of optogentic activation of Bhlhe22-Cre neurons on action potentials mediated by dorsal root stimulation. (B) The recorded cell receives a light-evoked IPSC (top trace) but no light-evoked EPSC (bottom trace). (C) EPSCs (top) and action potentials (bottom) upon electrical stimulation of the dorsal root (arrows) in the absence (black trace) and presence (red trace) of blue light. (D) Diagram illustrating experimental set-up to characterize the modality tuning of spinal projection neurons and characterize whether they receive input from Nts-Cre interneurons. (E) Example of a lamina I projection neuron that responds to mechanical stimulation, heat and cold. (F) Representative traces of lamina I spinal projections that receive direct monosynaptic input from Nts-Cre cells (top) or only polysynaptic Nts-Cre cells (bottom). Ten traces are superimposed to compare response jitter. (G) Modality tuning characteristics of 4 spinal projection neurons that receive monosynaptic Nts-Cre input (top) and two spinal projection neurons that receive only polysynaptic Nts-Cre input (bottom).
Figure 8
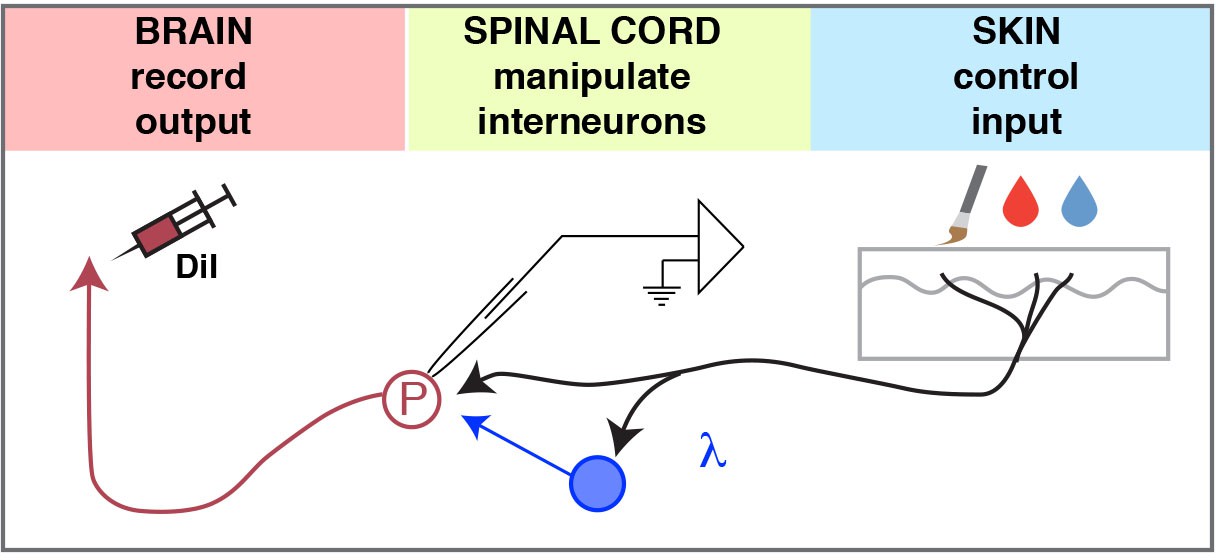
Model.
The ex-vivo semi-intact somatosensory preparation enables 1) control of the input, 2) manipulation (excitation or inhibition) of spinal interneurons, and 3) quantification of the output to investigate the neural circuits of the dorsal horn.
Download links
A two-part list of links to download the article, or parts of the article, in various formats.
Downloads (link to download the article as PDF)
Open citations (links to open the citations from this article in various online reference manager services)
Cite this article (links to download the citations from this article in formats compatible with various reference manager tools)
Semi-intact ex vivo approach to investigate spinal somatosensory circuits
eLife 5:e22866.
https://doi.org/10.7554/eLife.22866


