De-repression of the RAC activator ELMO1 in cancer stem cells drives progression of TGFβ-deficient squamous cell carcinoma from transition zones
- Cincinnati Children’s Hospital Medical Center, United States
- Inserm, U1068, F-13009, CNRS, UMR7258, F-13009, Institut Paoli-Calmettes, F-13009, Aix-Marseille University, UM 105, F-13284, France
Figures
Figure 1 with 1 supplement
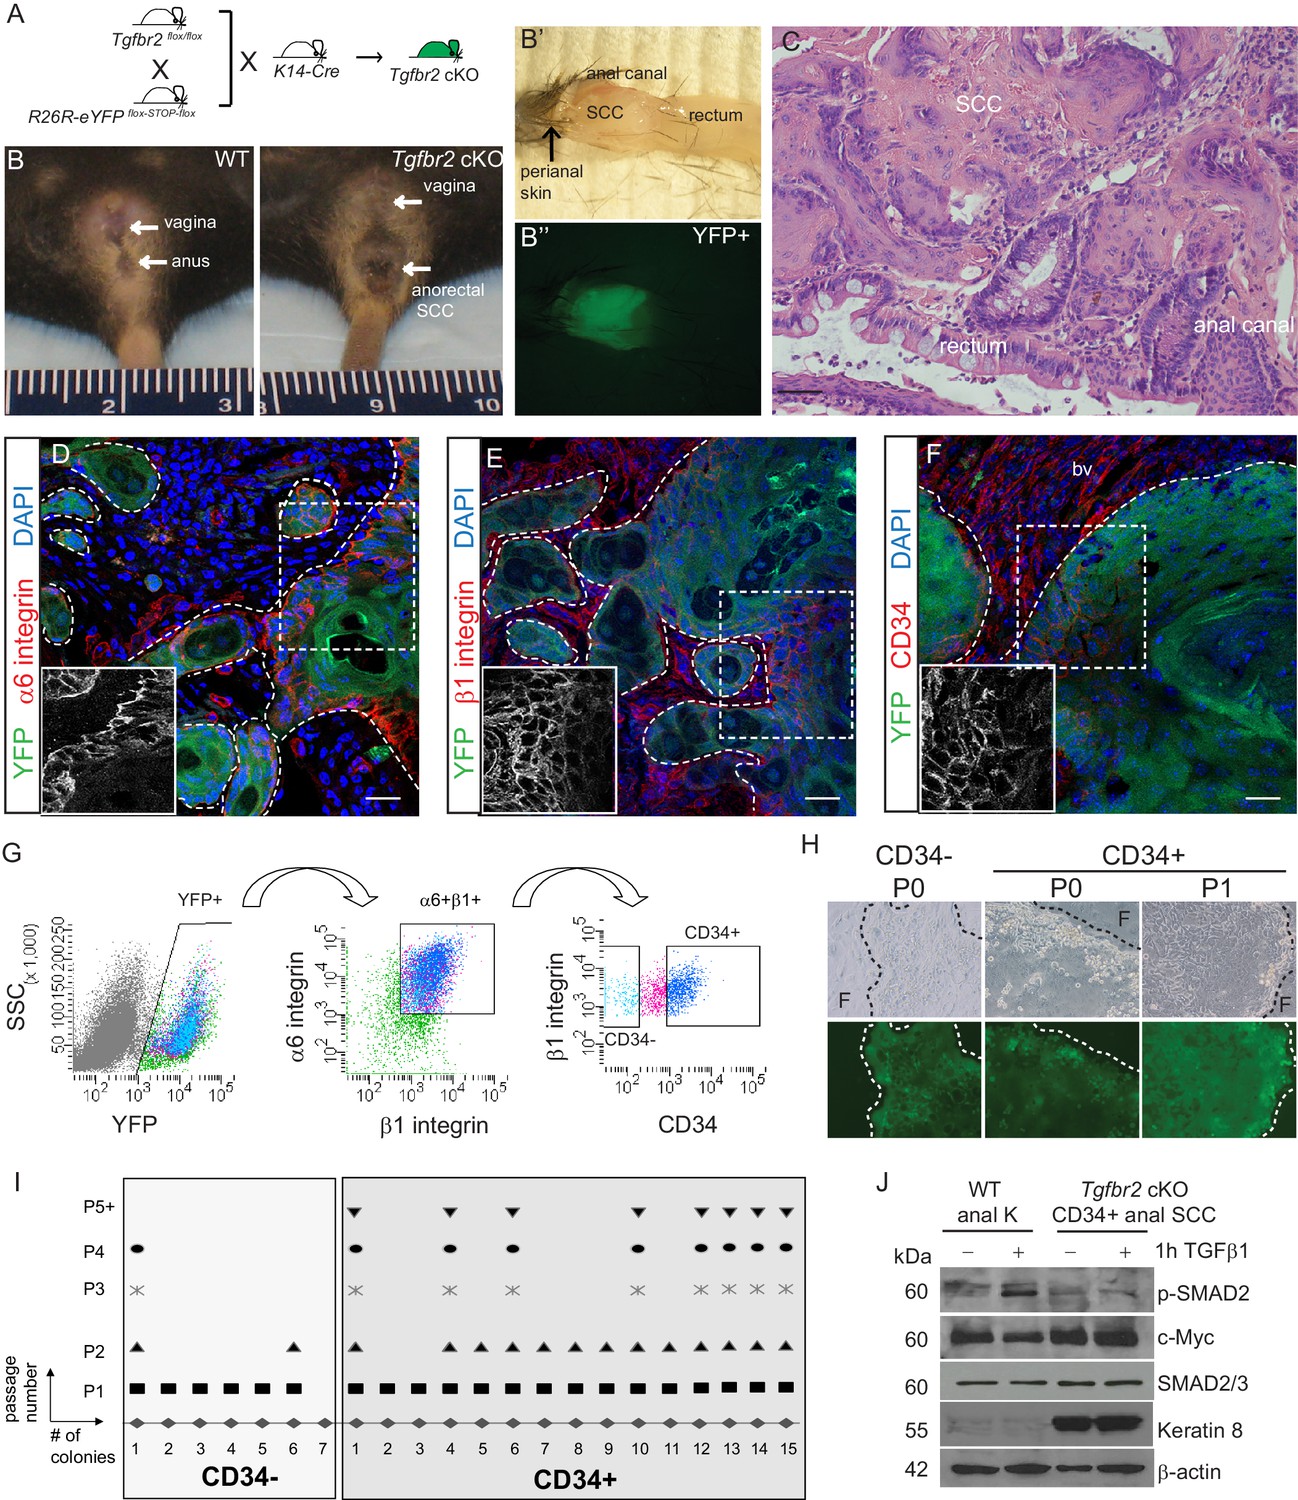
Tgfbr2 cKO anorectal SCC contain a population of epithelial CD34+ cells which are enriched for in vitro clonogenicity.
(A) Triple transgenic mice were obtained by crossing Tgfbr2flox/flox mice with R26R-eYFPflox-STOP-flox mice and K14-Cre mice. (See Figure 1—figure supplement 1) (B, B’, B’’). Tgfbr2 cKO mice developed spontaneous anorectal tumors (B) which formed in the anal canal between the hair-bearing perianal skin and rectum (B’), and expressed YFP (B’’). (C) Hematoxylin and eosin (H and E) staining of Tgfbr2 cKO tumors revealed moderately- to poorly-differentiated squamous cell carcinoma (SCC) at the transition between the epithelium of the anal canal and the rectum. (D–F) Immunofluorescence staining of Tgfbr2 cKO anorectal SCC revealed YFP+ tumor cells expressed both α6-integrin (D) and β1-integrin (E) and that there was a distinct population of CD34+ tumor cells (F). Boxed areas represent isolation and magnification of the red channel. DAPI counterstains nuclei in blue. Representative of 16 mice analyzed by histology and immunostaining and 37 analyzed by FACS (G). CD34+ and CD34− cells were isolated from the Tgfbr2 cKO anorectal SCC by fluorescence-activated cell sorting (FACS). After dissociation and staining, CD45+ blood cells, CD31+ endothelial cells and CD11b+ macrophages were excluded from the live (7AAD-), K14+YFP+ population. These epithelial tumor cells were further purified by gating for α6-integrin (CD49f+) and β1-integrin (CD29+) cells (YFP +7AAD-CD11b-CD31-CD45-CD49f+CD29+, abbreviated: YFP+). Of these epithelial tumor cells, distinct CD34+ and CD34− populations were isolated (see Figure 2—figure supplement 1). (H–I) When plated on a feeder layer of irradiated fibroblasts, sorted YFP+CD34− and YFP+CD34+ tumor cells were able to form clones. CD34− clones appeared differentiated and were unable to survive multiple passages, whereas CD34+ clones formed holoclones and subsequently robust cell lines which survived unlimited passage (n = 4 tumor-bearing mice). Panel H is a representative example of three different primary clones isolated from one of four distinct spontaneous tumors. (J) Tgfbr2 cKO anorectal CD34+ SCC cells are nonresponsive to TGFβ as they did not phosphorylate SMAD2 nor downregulate c-Myc compared to WT anal keratinocytes, and aberrantly expressed Keratin 8. Abbreviations: bv, blood vessel; F, irradiated fibroblast; P0, passage 0; P1, passage 1; k, keratinocyte. Scale bars = 20 µm.
Figure 1—figure supplement 1
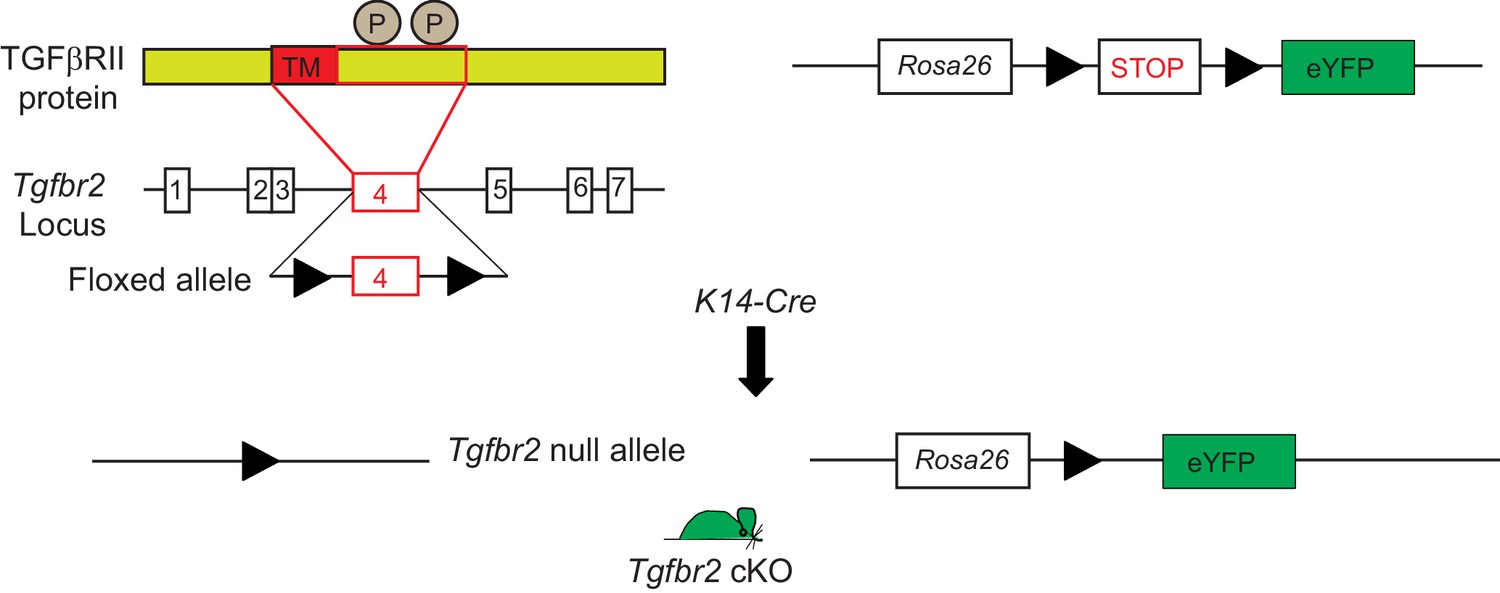
Conditional targeting of Tgfbr2 and lineage tracing in Keratin 14-positive tissues.
Exon 4 of the Tgfbr2 locus, encoding the transmembrane domain (TM) and the intracellular phosphorylation sites (P) of the TGFβRII protein is flanked by loxP sites and has been backcrossed into a mouse reporter containing an Enhanced Yellow Fluorescent Protein gene (eYFP) inserted into the ROSA locus. Tgfbr2 is deleted and YFP is expressed in epithelial tissue upon breeding with K14-Cre mice.
Figure 2 with 2 supplements
Tgfbr2 cKO CD34+ SCC cells are enriched for in vivo tumorigenicity.
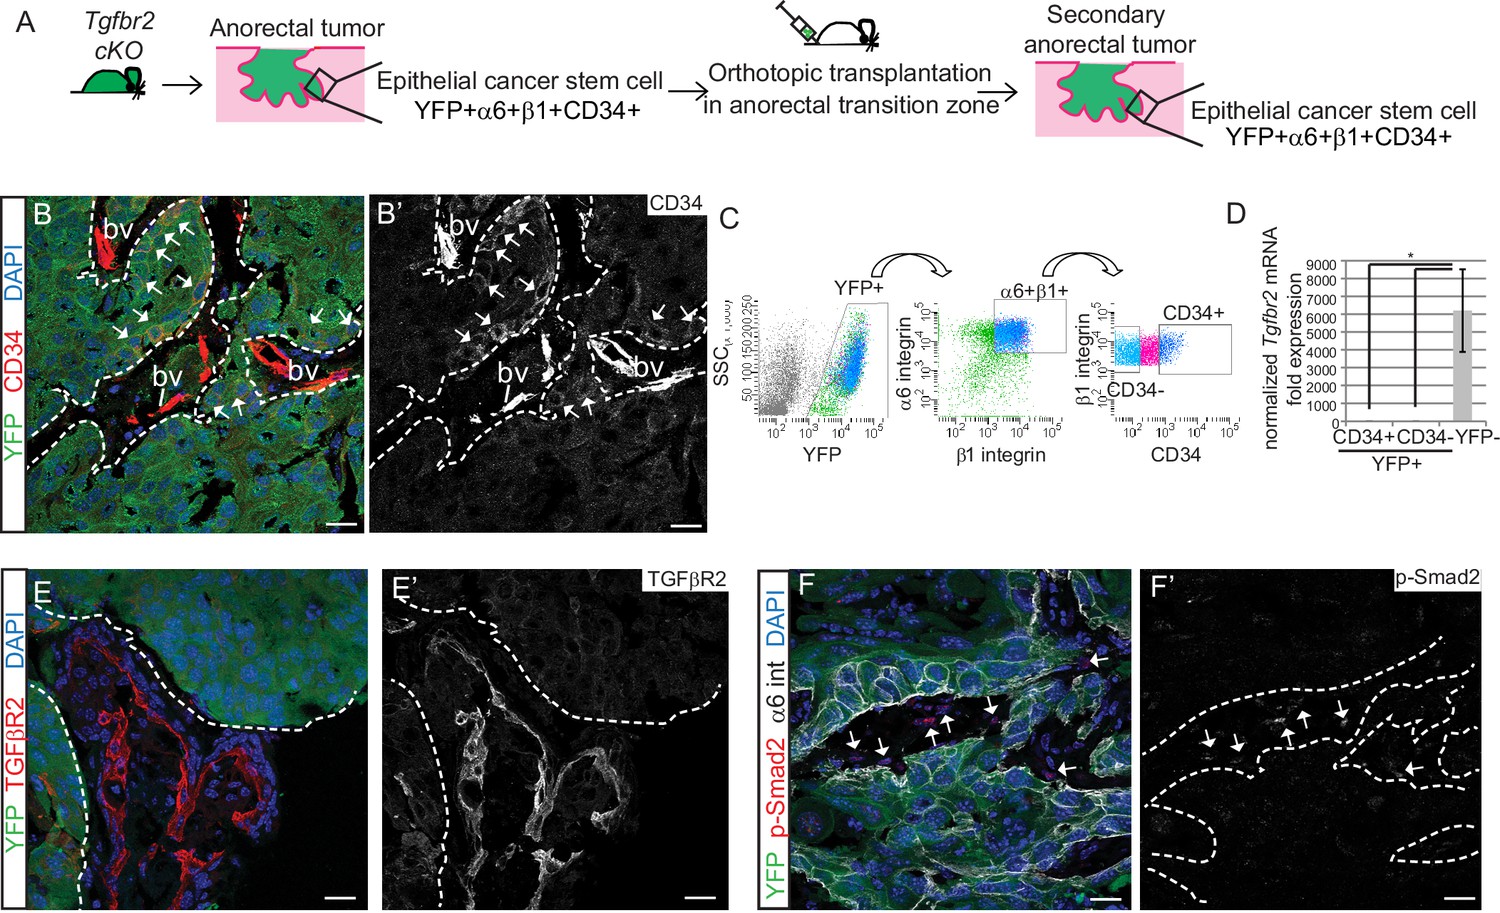
(A) Strategy to generate secondary tumors from the triple transgenic mice K14-Cre; Tgfbr2flox/flox; R26R-eYFPflox-STOP-flox (cKO). (B–B’) Immunofluorescence staining of the secondary anorectal SCC revealed populations of YFP+CD34+ and YFP+CD34− tumor cells, preserving the hierarchy observed in the primary Tgfbr2 cKO tumor. White arrows show the clusters of YFP+CD34+ cells. Dotted lines delineate the tumor from stroma. DAPI counterstains nuclei in blue. See Figure 2—figure supplement 2 for histology and FACS profile of the secondary and tertiary tumors. (C) Using the same FACS strategy as employed for the primary Tgfbr2 cKO anorectal SCC, the secondary anorectal tumors were sorted and distinct CD34+ and CD34− epithelial populations were isolated. (D) FACS-isolated YFP+CD34+ and YFP+CD34− epithelial tumor cells were subjected to mRNA extraction and qPCR and compared to FACS-isolated YFP-negative cells for Tgfbr2 expression. Data represent the mean ± s.d. from three independent tumors; Student's t-test, *p=0.0313. (E–F) Immunofluorescence staining of the secondary anorectal SCC confirmed the loss of TGFβRII (E–E’) and phosphorylated SMAD2 (F–F’) in the epithelial YFP+ cells while expression was maintained in the K14-YFP- stroma (denoted by the white arrows). This is a representative example of 21 secondary tumors analyzed by histology, immunostaining and FACS. Abbreviation: bv, blood vessel. Scale bars = 20 µm.
-
Figure 2—source data 1
Values and statistics for Figure 2D using the Wilcoxon matched-pairs signed rank test.
- https://doi.org/10.7554/eLife.22914.006
Figure 2—figure supplement 1
Orthotopic transplant of CD34+ cKO SCC cells results in secondary and tertiary tumor formation which recapitulate the hierarchy of the tumor of origin.
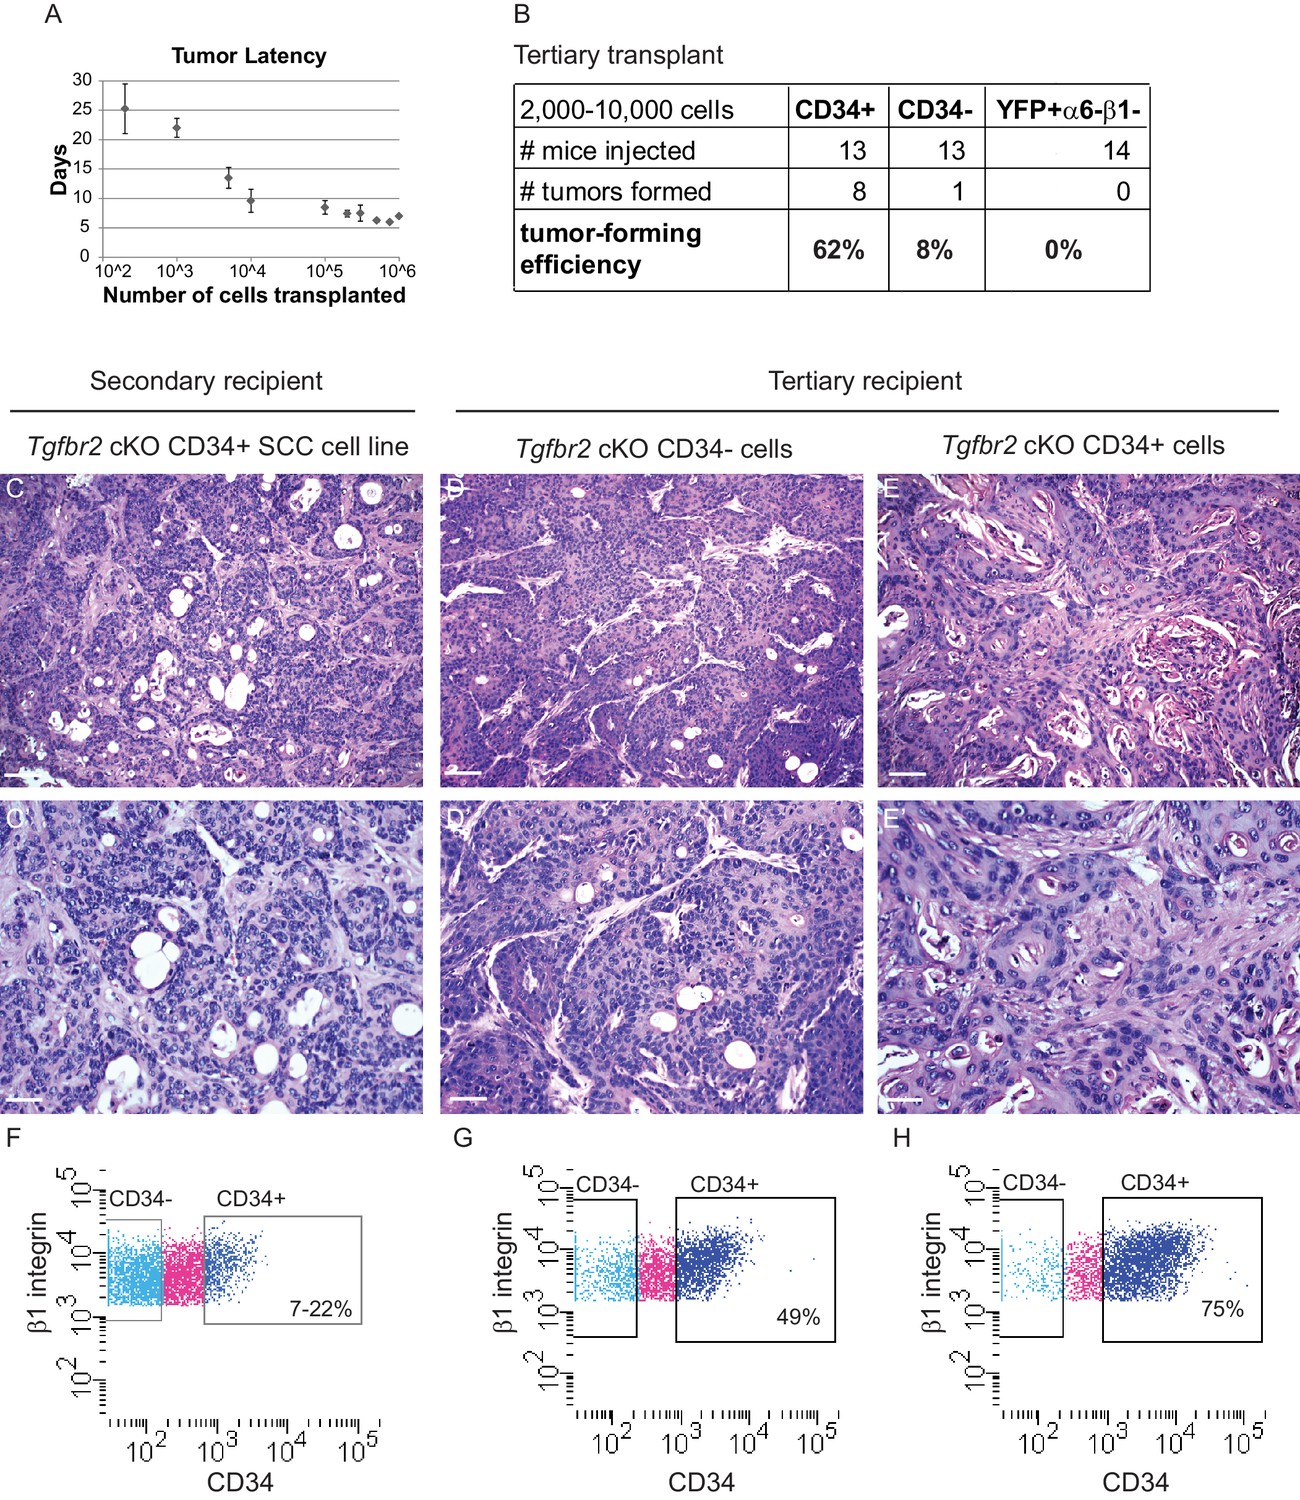
(A) Orthotopic transplantation of 200–106 Tgfbr2 cKO CD34+ SCC cells into the anorectal transition zone of recipient nude mice resulted in secondary tumor formation with 100% efficiency (n = 89 in sum; 200 cells, n = 4; 1000 cells, n = 6; 5000 cells, n = 2; 10,000 cells, n = 10; 100,000 cells, n = 44; 200,000 cells, n = 7; 300,000 cells, n = 6; 500,000 cells, n = 4; 750,000 cells, n = 2; 1,000,000 cells, n = 4). Data represent the mean number of days after transplantation before palpable tumor formation ± standard deviation. (B) CD34+ SCC cells were enriched for tumor forming efficiency, compared to CD34− SCC cells or YFP+α6-β1- SCC cells, when transplanted orthotopically into a tertiary mouse. (C–E) H and E staining revealed that orthotopic transplant of cultured Tgfbr2 cKO CD34+ SCC cells into a secondary recipient (C) or orthotopic transplant of Tgfbr2 cKO CD34− SCC cells (D) or orthotopic transplant of Tgfbr2 cKO CD34+ SCC cells directly into a tertiary recipient (E) results in SCC formation which recapitulate the morphology of the Tgfbr2 deficient tumor of origin (n = 1/13 CD34−, n = 8/13 CD34+). Scale bars: 100 µm (C–E), 50 µm (C’–E’). (F–H) Using the same FACS strategy as employed for the primary Tgfbr2 cKO anorectal SCC, the secondary and tertiary anorectal tumors were sorted and distinct CD34+ and CD34− epithelial populations were isolated, maintaining the tumor hierarchy of the Tgfbr2 cKO tumor of origin. Of the one tertiary mouse that developed a tumor from transplant of CD34− cells, CD34 was re-expressed within the tumor environment (G).
Figure 2—figure supplement 2
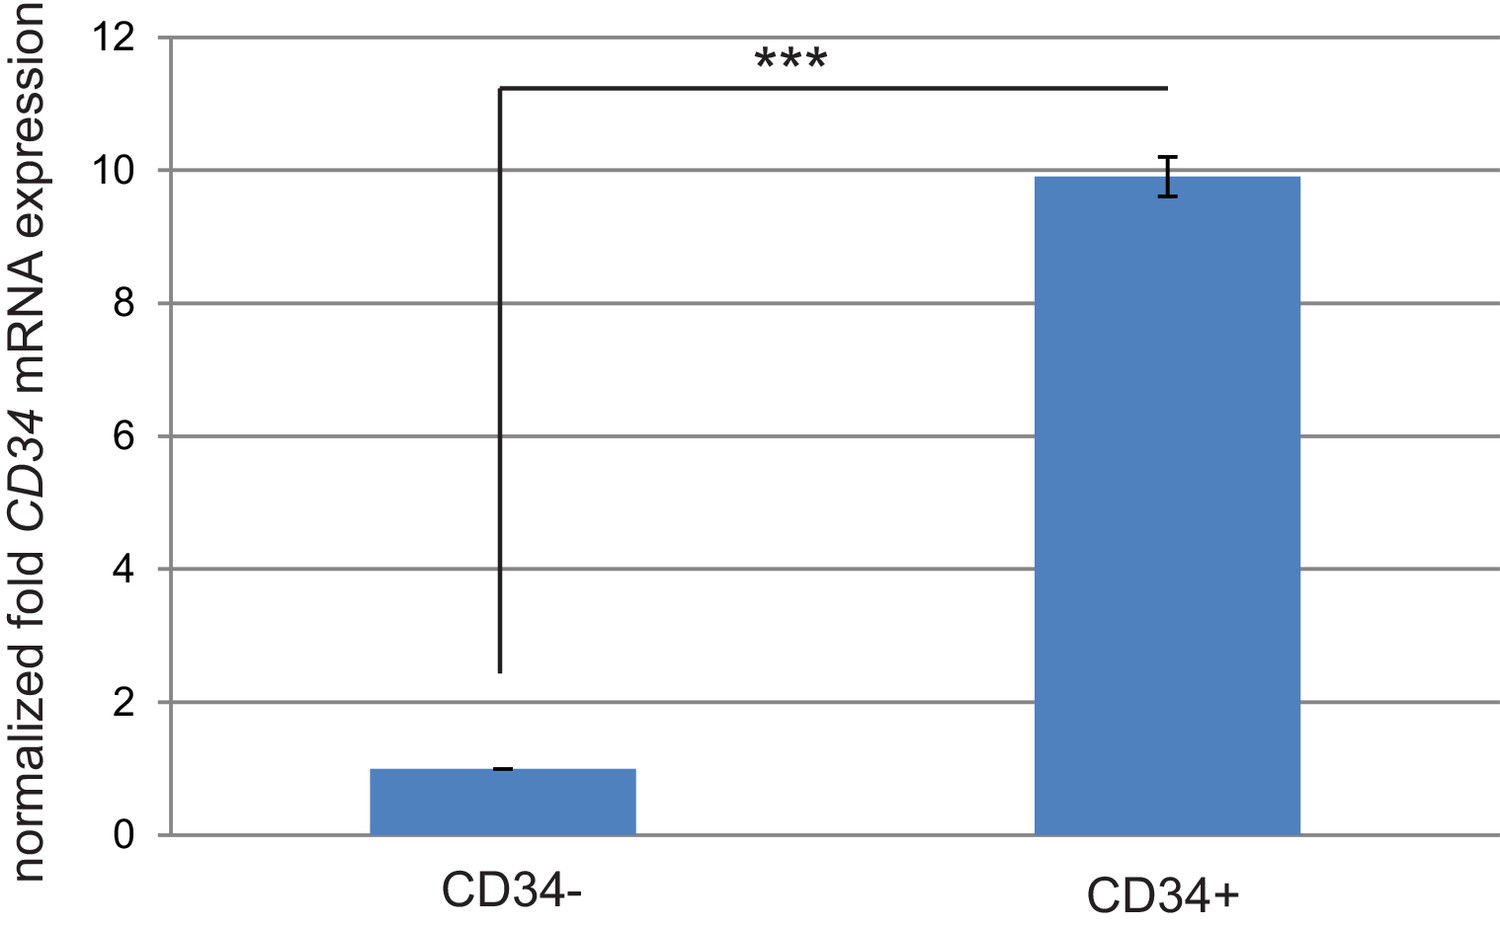
CD34 mRNA expression correlates with CD34 protein expression in sorted cKO SCC cells.
Quantitative real-time PCR validated that CD34 mRNA expression is increased in the CD34+ sorted cell populations (two cell lines tested). ***p=0.000013.
Figure 3 with 2 supplements
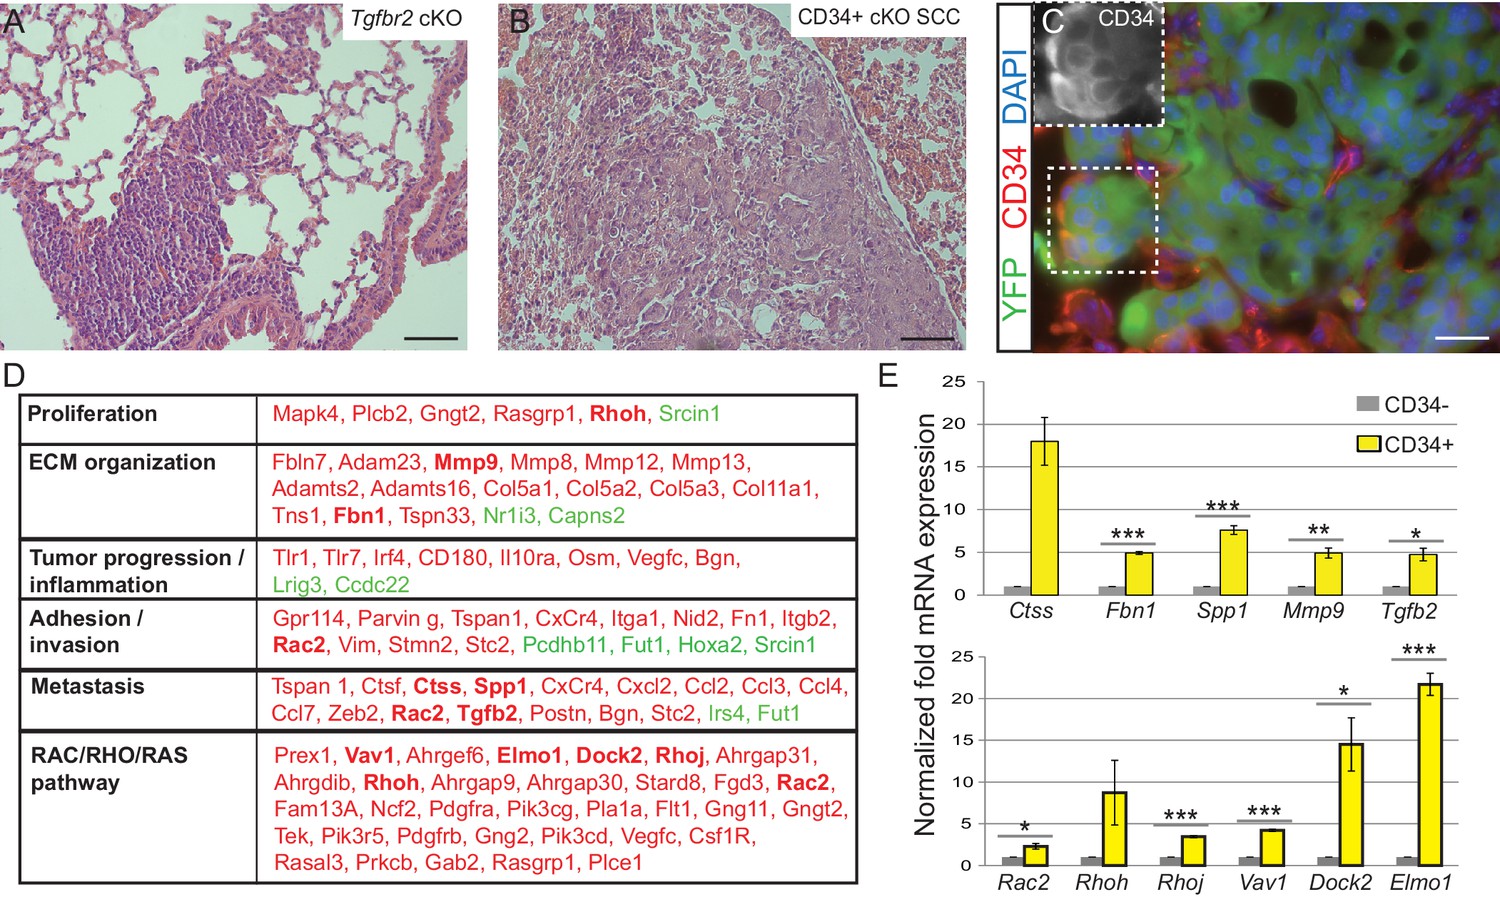
Tgfbr2 cKO CD34+ SCC cells display a metastatic transcriptional signature.
(A–C) H and E staining of the lungs of Tgfbr2 cKO mice (A) and mice orthotopically transplanted with Tgfbr2 cKO CD34+ SCC cells (B) revealed metastatic nodules which are YFP+ and contain a population of CD34+ tumor cells (C). The boxed area represents isolation and magnification of CD34 in the red channel. See also Figure 3—figure supplement 1. (D) RNA-Seq comparison of CD34− and CD34+ cells isolated from Tgfbr2 cKO CD34+ SCC (n = 2 tumors each from two distinct cell lines) revealed that CD34+ SCC cells were enriched for an invasive and metastatic signature. This table represents a selected set of genes which are upregulated (red) or downregulated (green) by more than two fold with an FDR <0.05 in FACS-purified CD34+ cells compared to CD34− cells. Genes in bold were selected for validation by qRT-PCR. See Supplementary file 1 for the full table of differentially expressed genes and Figure 3—figure supplement 2 for comparison with human databases. (E) Selected genes which were upregulated in CD34+ cells compared to CD34− cells in the RNA-Seq analysis were selected for validation by qRT-PCR, including genes involved in ECM organization, adhesion, invasion and metastasis and the RAC/RHO/RAS pathway. Asterisks denote statistical significance using two-tailed, unpaired student’s t-test; Ctss p=0.050895, Fbn1 p***=0.00003, Spp1 p***=0.00035, MMP9 p**=0.00801, Tgfb2 p*=0.016721, Rac2 p*=0.0296, Rhoh p=0.177, Rhoj p***=0.000057, Vav1 p***=0.000032, Dock2 p*=0.02782, Elmo1 p***=0.00067.
Figure 3—figure supplement 1
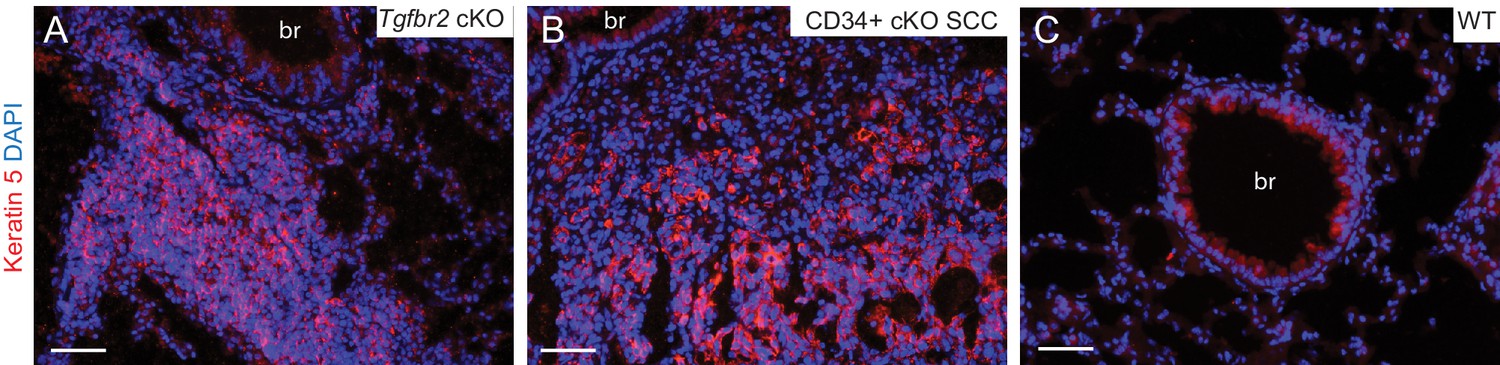
Lung metastases express keratin 5.
(A–B) Immunofluorescence staining of lungs of Tgfbr2 cKO mice (A) and mice transplanted with CD34+ cKO SCC cells (B) revealed clusters of keratin 5-positive epithelial tumor cells, whereas the lung parenchyma of wild-type mice (C) is negative for keratin five with the exception of low expression levels in the larger conducting airways. Abbreviation: br, bronchi. DAPI counterstains nuclei in blue. Scale bars = 50 µm.
Figure 3—figure supplement 2
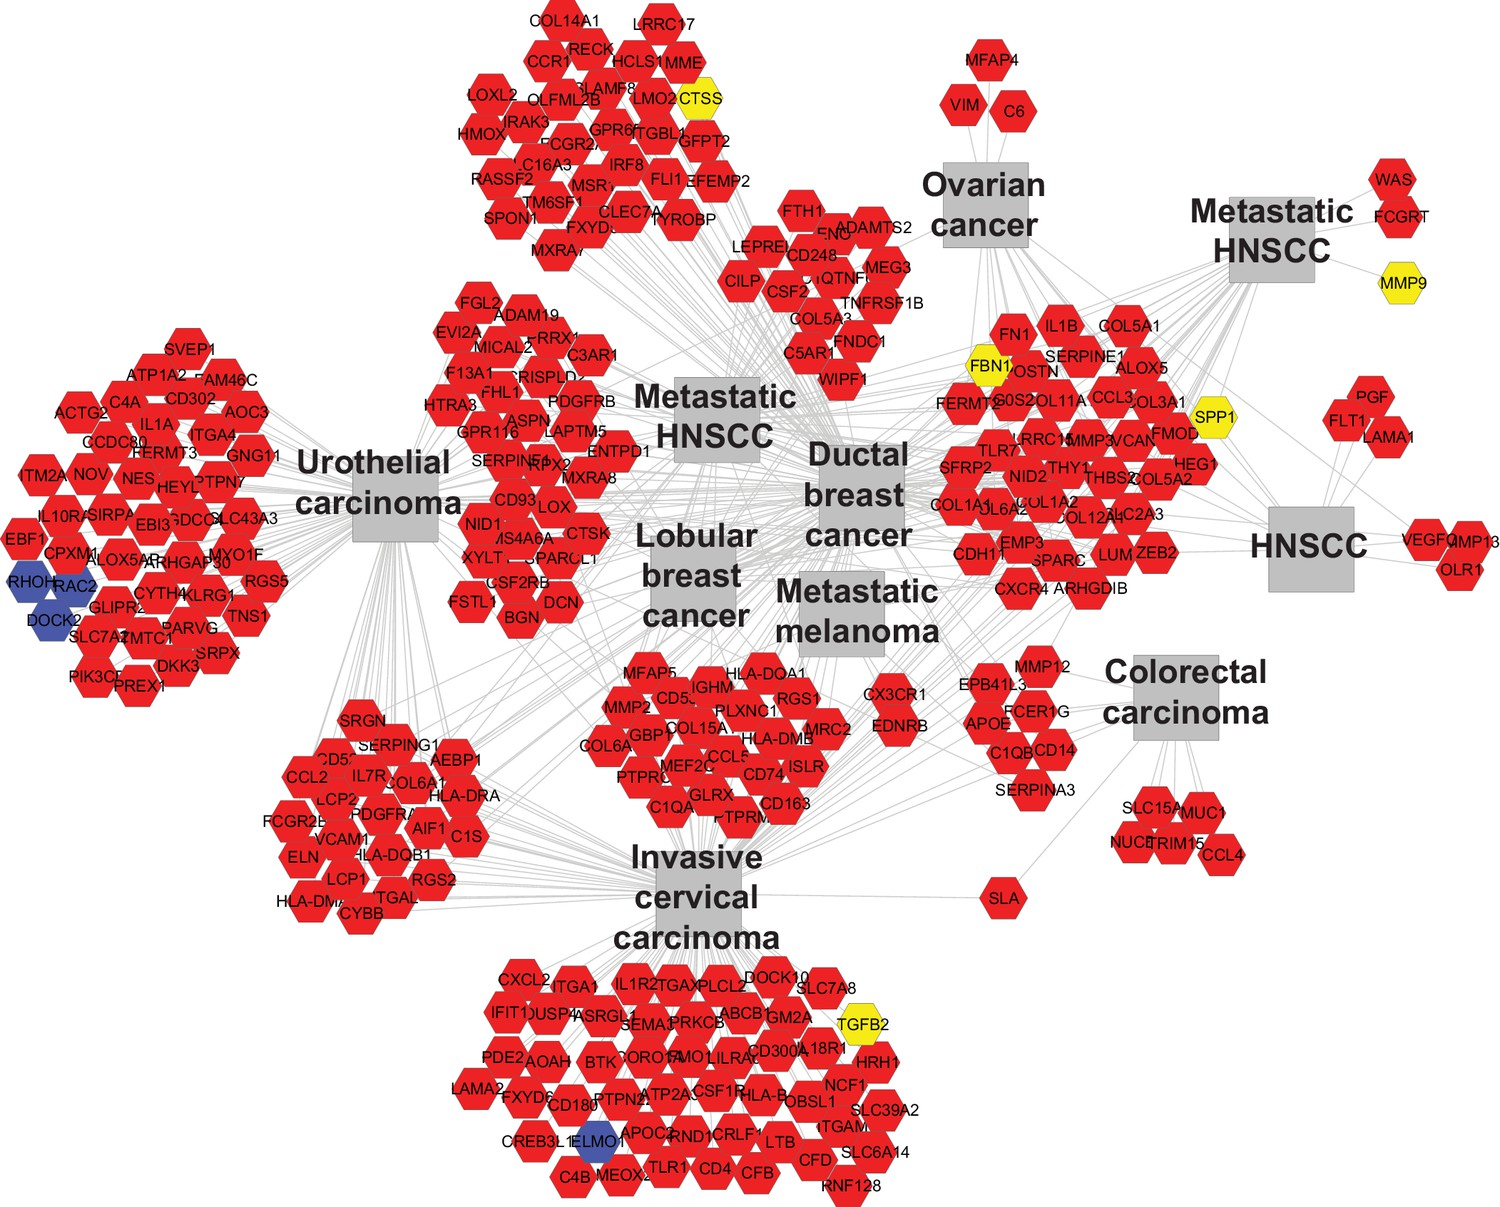
Tgfbr2 cKO CD34+ SCC cells upregulate genes implicated in invasive human cancers.
Using ToppCluster, the genes upregulated in CD34+ SCC cells were compared to previously published datasets and a network of genes shared between Tgfbr2 deficient transitional epithelial CD34+ SCC cells and aggressive human cancers was generated. Genes colored in yellow (invasion and metastasis) and blue (RAC/RHO/RAS pathway) correspond to the genes selected for qRT-PCR validation in Figure 3E.
Figure 4
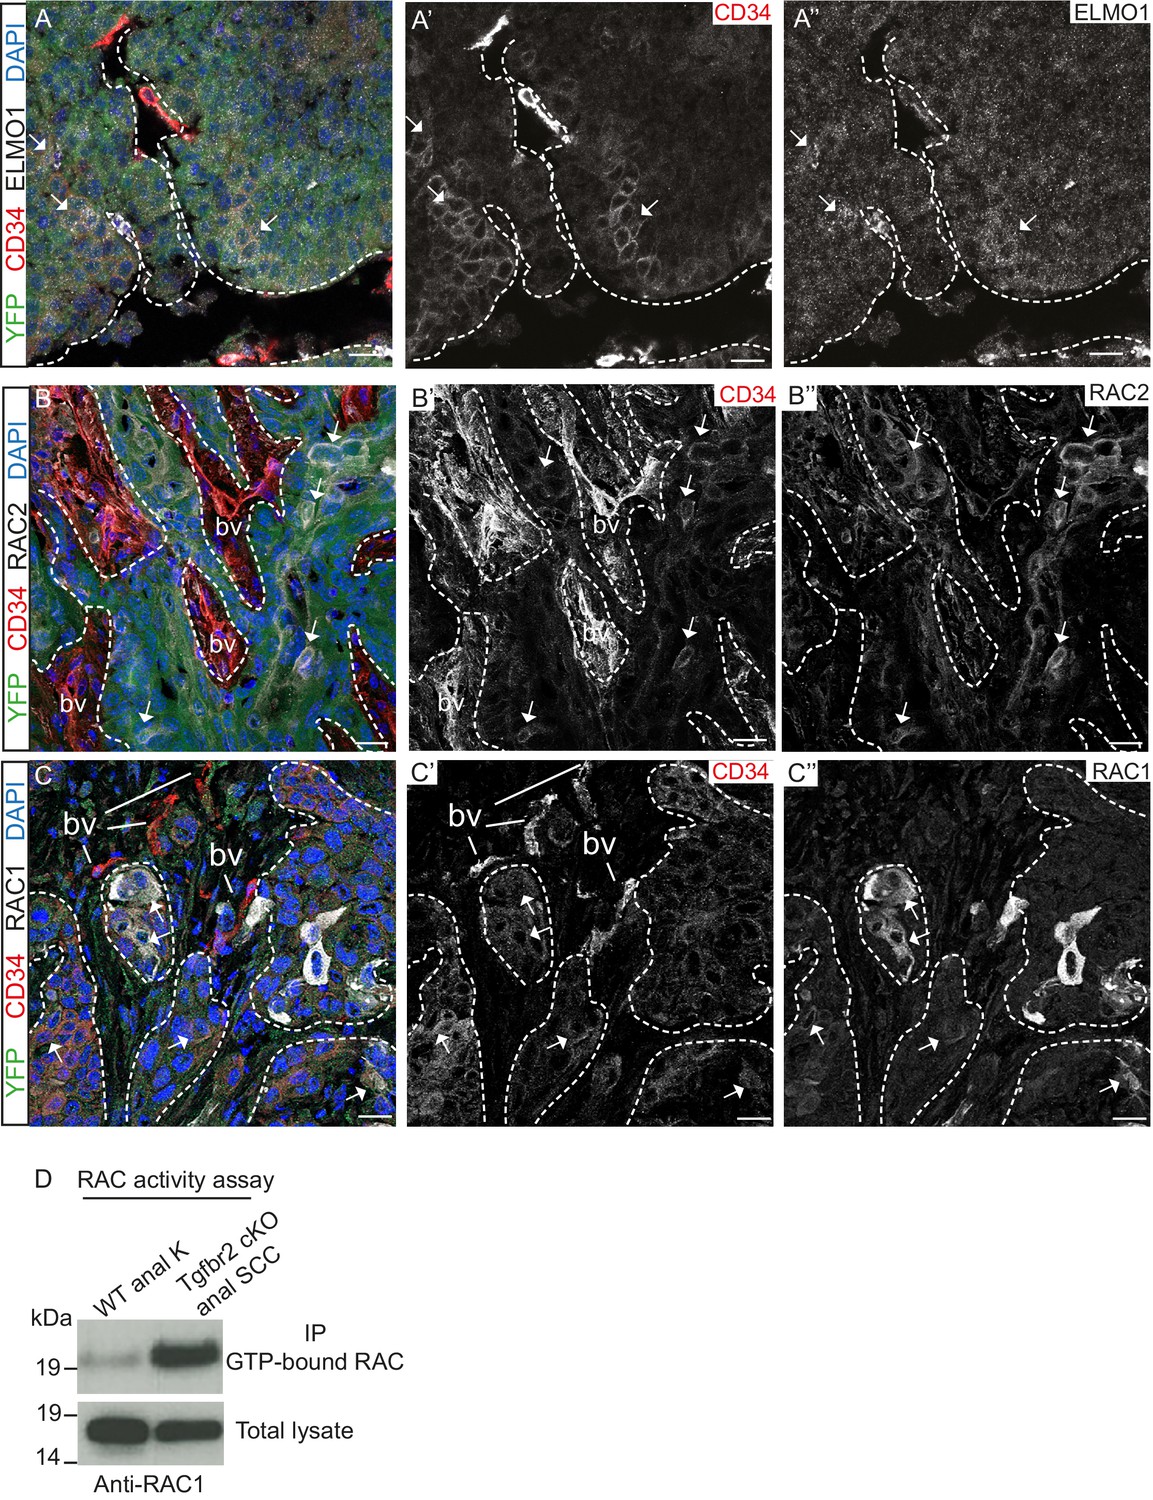
Tgfbr2-deficient tumors upregulate RAC signaling.
(A–C) Immunofluorescence staining with antibodies against YFP, ELMO1, RAC2, RAC1 and CD34 revealed that some CD34+ tumor cells co-express ELMO1 (A, white arrows), RAC2 (B, white arrows) and RAC1 (C, white arrows), with strong expression at the invading front at the tumor-stroma border (dashed lines). DAPI counterstains nuclei in blue. n = 6 tumors tested. Abbreviations: bv, blood vessel. Scale bars = 20 µm. (D) RAC activity assay revealed the increased amount of GTP-bound RAC in the Tgfbr2 cKO SCC CD34+ cell line compared to wild-type anal keratinocytes (K).
Figure 5 with 1 supplement
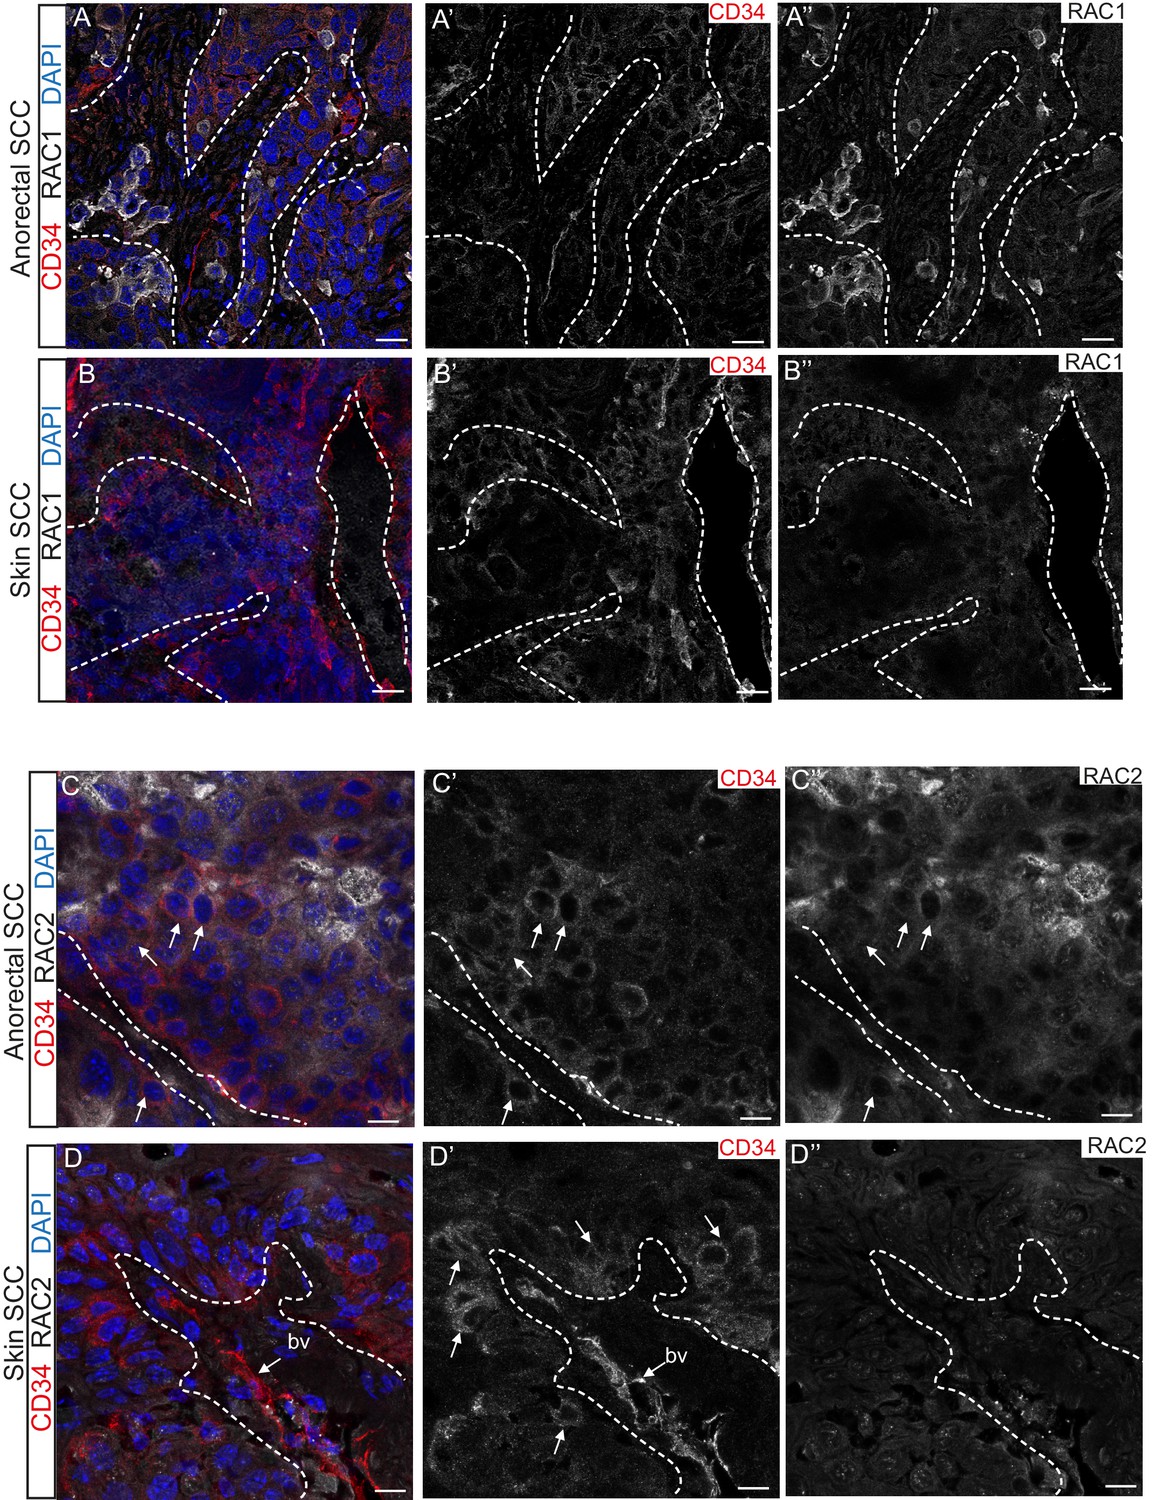
RAC1 and RAC2 are uniquely expressed in Tgfbr2-deficient transition zone tumors compared to DMBA-induced Tgfbr2-deficient skin SCC.
(A–D) Immunofluorescence staining with antibodies against RAC1, RAC2 and CD34 revealed strong expression of RAC1 and RAC2 in the anorectal SCC tumor compared to the backskin SCC. Skin tumors come from cKO mice treated for 16 weeks topically with the chemical mutagen 7,12-dimethyl-benz[a] anthracene (DMBA) as previously described (Guasch et al., 2007). Some RAC1-positive cells (A) and clusters of RAC2-positive tumor cells (C) correlate with CD34+ tumor cells (white arrows) in the anorectal SCC but not in the skin SCC (B, D). All images have been acquired using the same laser parameters and exposure time. DAPI counterstains nuclei in blue. Abbreviation: bv, blood vessel. Scale bars = 20 µm (A–A’’–B–B’’), 10 µm (C–C’’–D–D’’). n = 3 different skin and anorectal tumors tested for each antibody. See also Figure 5—figure supplement 1.
Figure 5—figure supplement 1
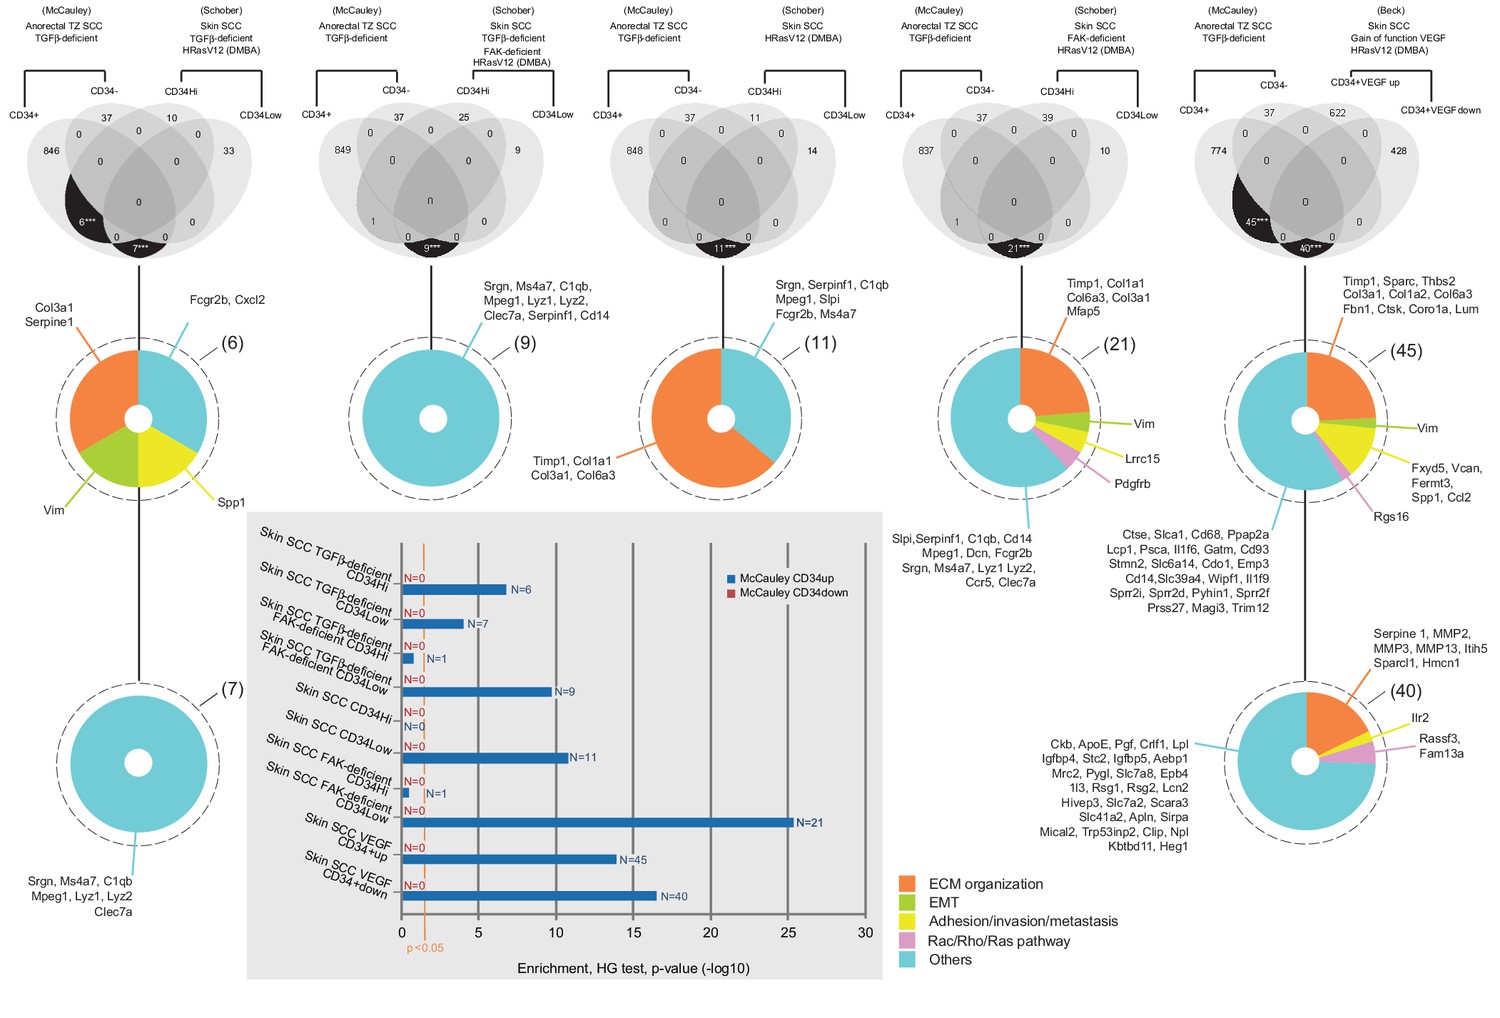
Venn diagrams of cell-type specific signatures in various skin SCC.
CD34+ and CD34− anorectal TZ SCC TGFβ-deficient signatures (Supplementary file 1) have been compared with all databases in Table 1 of Schober and Fuchs (2011) that are in the same genetic drivers Tgfbr2-deficient with and without loss of Focal Adhesion Kinase (FAK) using R program available through the Comprehensive R Archive Network. CD34+ and CD34− anorectal TZ SCC TGFβ-deficient signatures have been also compared with other transcriptional profiles of CSC from skin cancers in a TGFβ-intact background (DMBA/TPA treated) in a WT background (Schober and Fuchs, 2011) and VEGF gain of function (from Beck et al., 2011), https://www-ncbi-nlm-nih-gov.gate2.inist.fr/geo/query/acc.cgi?acc=GSE31465). The overlaps represent commonly enriched genes in corresponding populations compared to all others. In a TGFβ-deficient background, only six genes were found significantly commonly highly expressed between the Tgfbr2 cKO CD34+ SCC anorectal TZ cells and the Tgfbr2 cKO CD34High SCC skin cells (***p value=1.57×10⁻⁷), seven genes were found significantly commonly highly expressed between the Tgfbr2 cKO CD34+ SCC anorectal TZ cells and the Tgfbr2 cKO CD34Low SCC skin cells (***p value=7.48×10⁻⁵) and nine genes were found significantly commonly highly expressed between the Tgfbr2 cKO CD34+ SCC anorectal TZ cells and the Tgfbr2/FAK double KO CD34Low SCC skin cells (***p value=1.98×10⁻¹⁰). In a WT background, 11 genes were found common between the Tgfbr2 cKO CD34+ SCC anorectal TZ cells and the CD34Low SCC skin cells (***p value=1.49×10⁻¹¹) and 21 genes when FAK is deficient (***p value=5.35×10⁻²⁶). In skin SCC with a gain of function of VEGF (Beck et al., 2011), 45 genes upregulated in CD34+VEGF versus CD34+ skin SCC were found also significantly highly expressed in the Tgfbr2 cKO CD34+ SCC anorectal TZ cells (***p value=2.62×10-39) and 40 genes downregulated in CD34+VEGF versus CD34+ skin SCC were found significantly highly expressed in the Tgfbr2 cKO CD34+ SCC anorectal TZ cells (***p value=2.69×10-53). The genes have been listed and classified in five categories: ECM organization, epithelial to mesenchymal transition, adhesion/invasion/metastasis, Rac/Rho/Ras pathway and others. All p values have been calculated with the hypergeometric (HG) test and are represented in the graph. The orange vertical bar indicates the statistical significance at 5%.
Figure 6 with 2 supplements
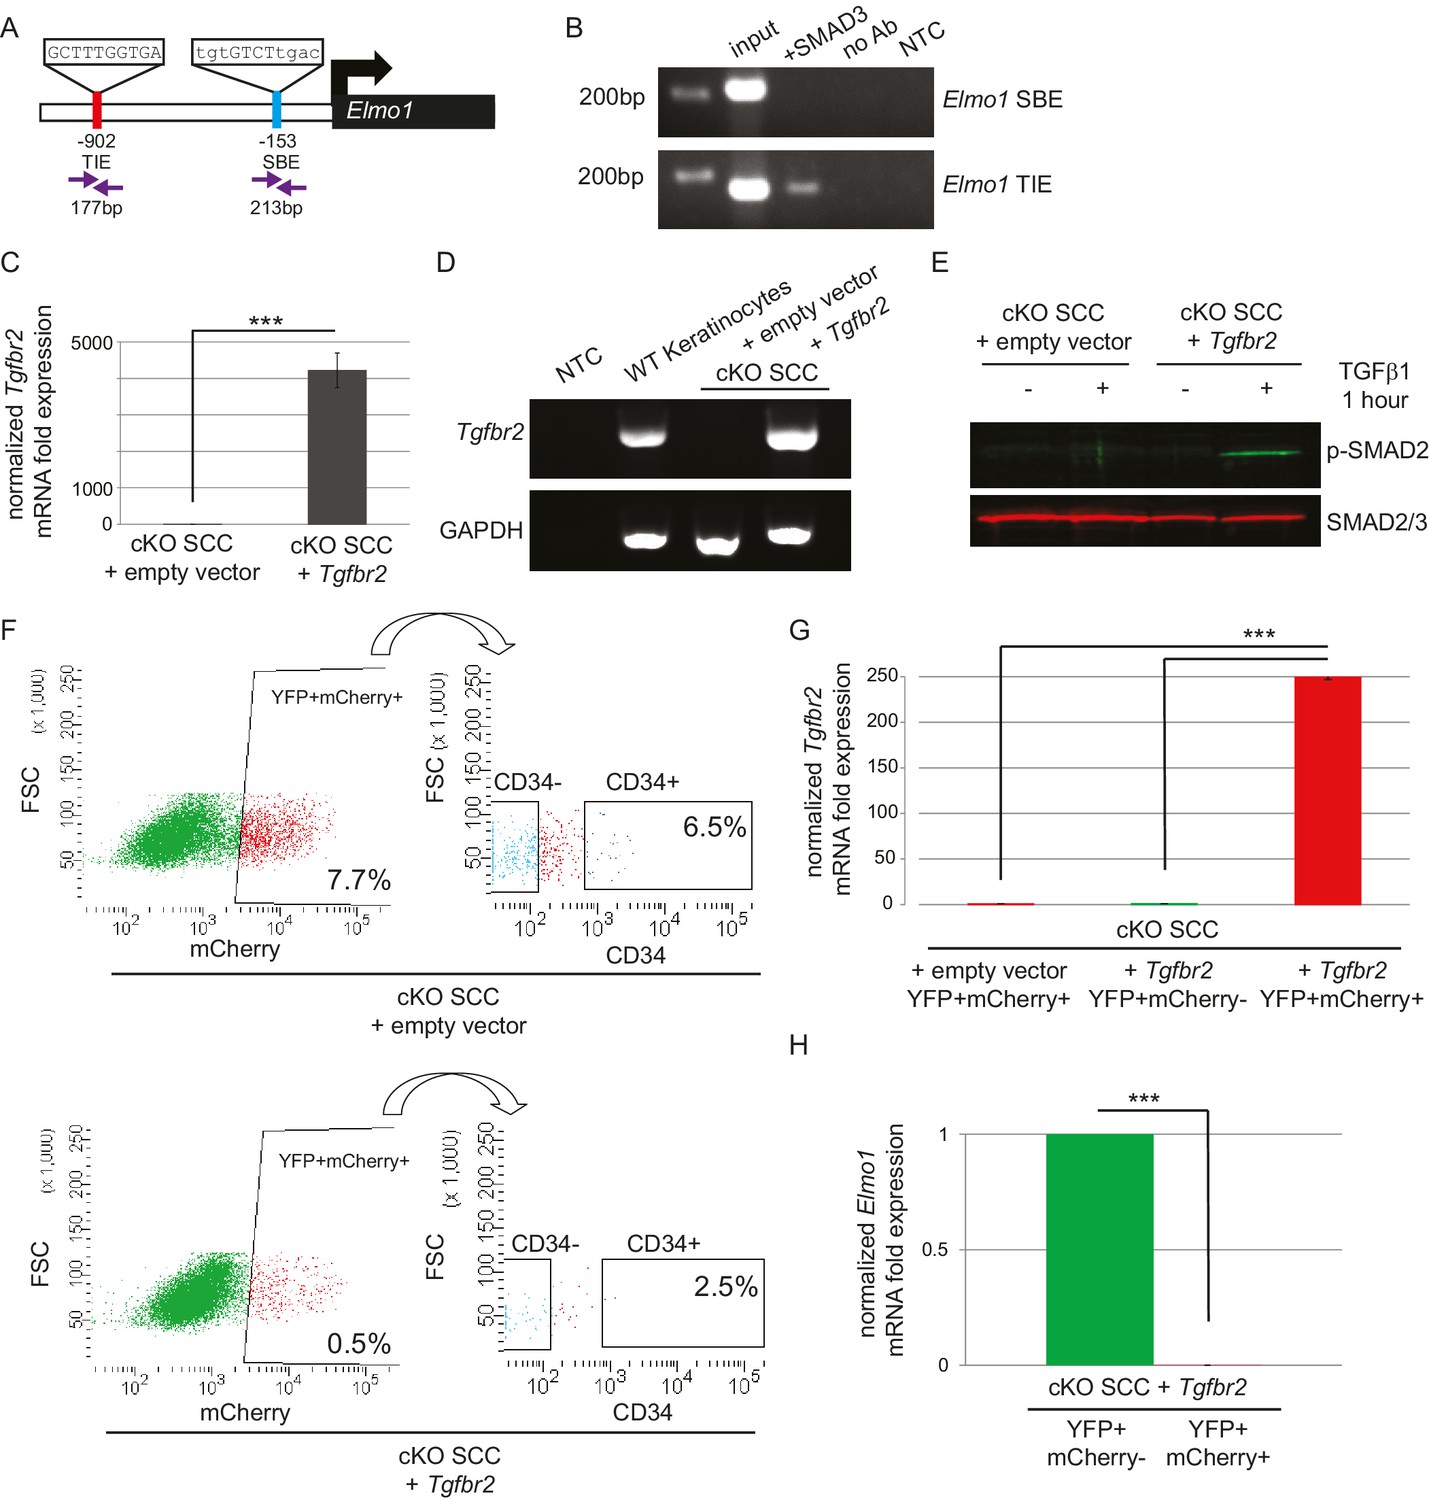
The GEF ELMO1 is a novel target of TGFβ signaling via SMAD3.
(A) Promoter analysis using MatInspector (Genomatrix) revealed two putative SMAD-responsive elements in the Elmo1 promoter. The consensus SMAD-binding element (SBE) sequence GTCT was identified 153 base pairs (bp) upstream of the Elmo1 transcriptional start site, and the consensus TGFβ-inhibitory site (TIE) GNNTTGGNGN was identified 902 bp upstream of the Elmo1 transcriptional start site. Primers were designed to flank these sites (purple arrows). (B) Chromatin immunoprecipitation with an anti-SMAD3 antibody was used to isolate DNA fragments that were amplified by the primers designed to flank the Elmo1 TIE, but not the Elmo1 SBE, after overexpressing SMAD3 in NIH3T3 cells and treating with TGFβ1 (2 ng/ml) for 24 hr. Non-template (NTC) and no-antibody (no Ab) controls were used to verify the specificity of binding. (C–E) Lentiviral infection of Tgfbr2 cKO CD34+ SCC cells with the full-length Tgfbr2 gene inserted into the pLVX-IRES-mCherry vector resulted in rescue of Tgfbr2 mRNA by more than 4000-fold (C–D) and phosphorylated SMAD2 (p-SMAD2) in response to treatment with TGFβ1 (2 ng/ml) for 1 hr (E), compared to Tgfbr2 cKO CD34+ SCC cells infected with the empty pLVX-IRES-mCherry vector. No Tgfbr2 mRNA was detected in Tgfbr2 cKO CD34+ SCC cells infected with the empty pLVX-IRES-mCherry vector. Data represent the mean ± standard deviation; student’s t-test, ***p=0.000112. (F–I) Tumors generated from orthotopic transplantation of 100,000 Tgfbr2 cKO CD34+ SCC cells infected with empty vector or with full-length Tgfbr2 were dissociated and YFP+mCherry+, YFP+mCherry-CD34+ and YFP+mCherry-CD34− cells were isolated by FACS and subjected to RNA extraction. (F) Approximately 7.7% of the cKO SCC + empty vector total tumor bulk expressed mCherry, whereas 0.5% of the cKO SCC + Tgfbr2 expressed mCherry at the time of analysis. See also Figure 6—figure supplement 2. The frequency of YFP+mCherry+CD34+ cells was significantly reduced in the rescued cKO SCC + Tgfbr2 tumor. (G) YFP+mCherry+ cells isolated from tumors generated from Tgfbr2 cKO CD34+ SCC cells infected with full-length Tgfbr2 expressed Tgfbr2 mRNA 250-fold over YFP+mCherry- cells isolated from the same tumor or YFP+mCherry+ cells isolated from tumors generated from Tgfbr2 cKO CD34+ SCC cells infected with empty vector (***p=0.000005). No Tgfbr2 mRNA was detected by qRT-PCR in YFP+mCherry- cells isolated from tumors generated from Tgfbr2 cKO CD34+ SCC cells infected with full-length Tgfbr2 or YFP+mCherry+ cells isolated from tumors generated from Tgfbr2 cKO CD34+ SCC cells infected with empty vector. (H) Rescue of TGFβRII abolished Elmo1 mRNA expression in YFP+mCherry+ cells isolated from tumors generated from Tgfbr2 cKO CD34+ SCC cells infected with full-length Tgfbr2 compared to YFP+mCherry-CD34+ cells isolated from the same tumor. Data represent the mean ± standard deviation. Asterisks denote statistical significance using two-tailed, unpaired student’s t-test; p***=9×10⁻²⁴. Three different tumors for each condition have been analyzed.
Figure 6—figure supplement 1
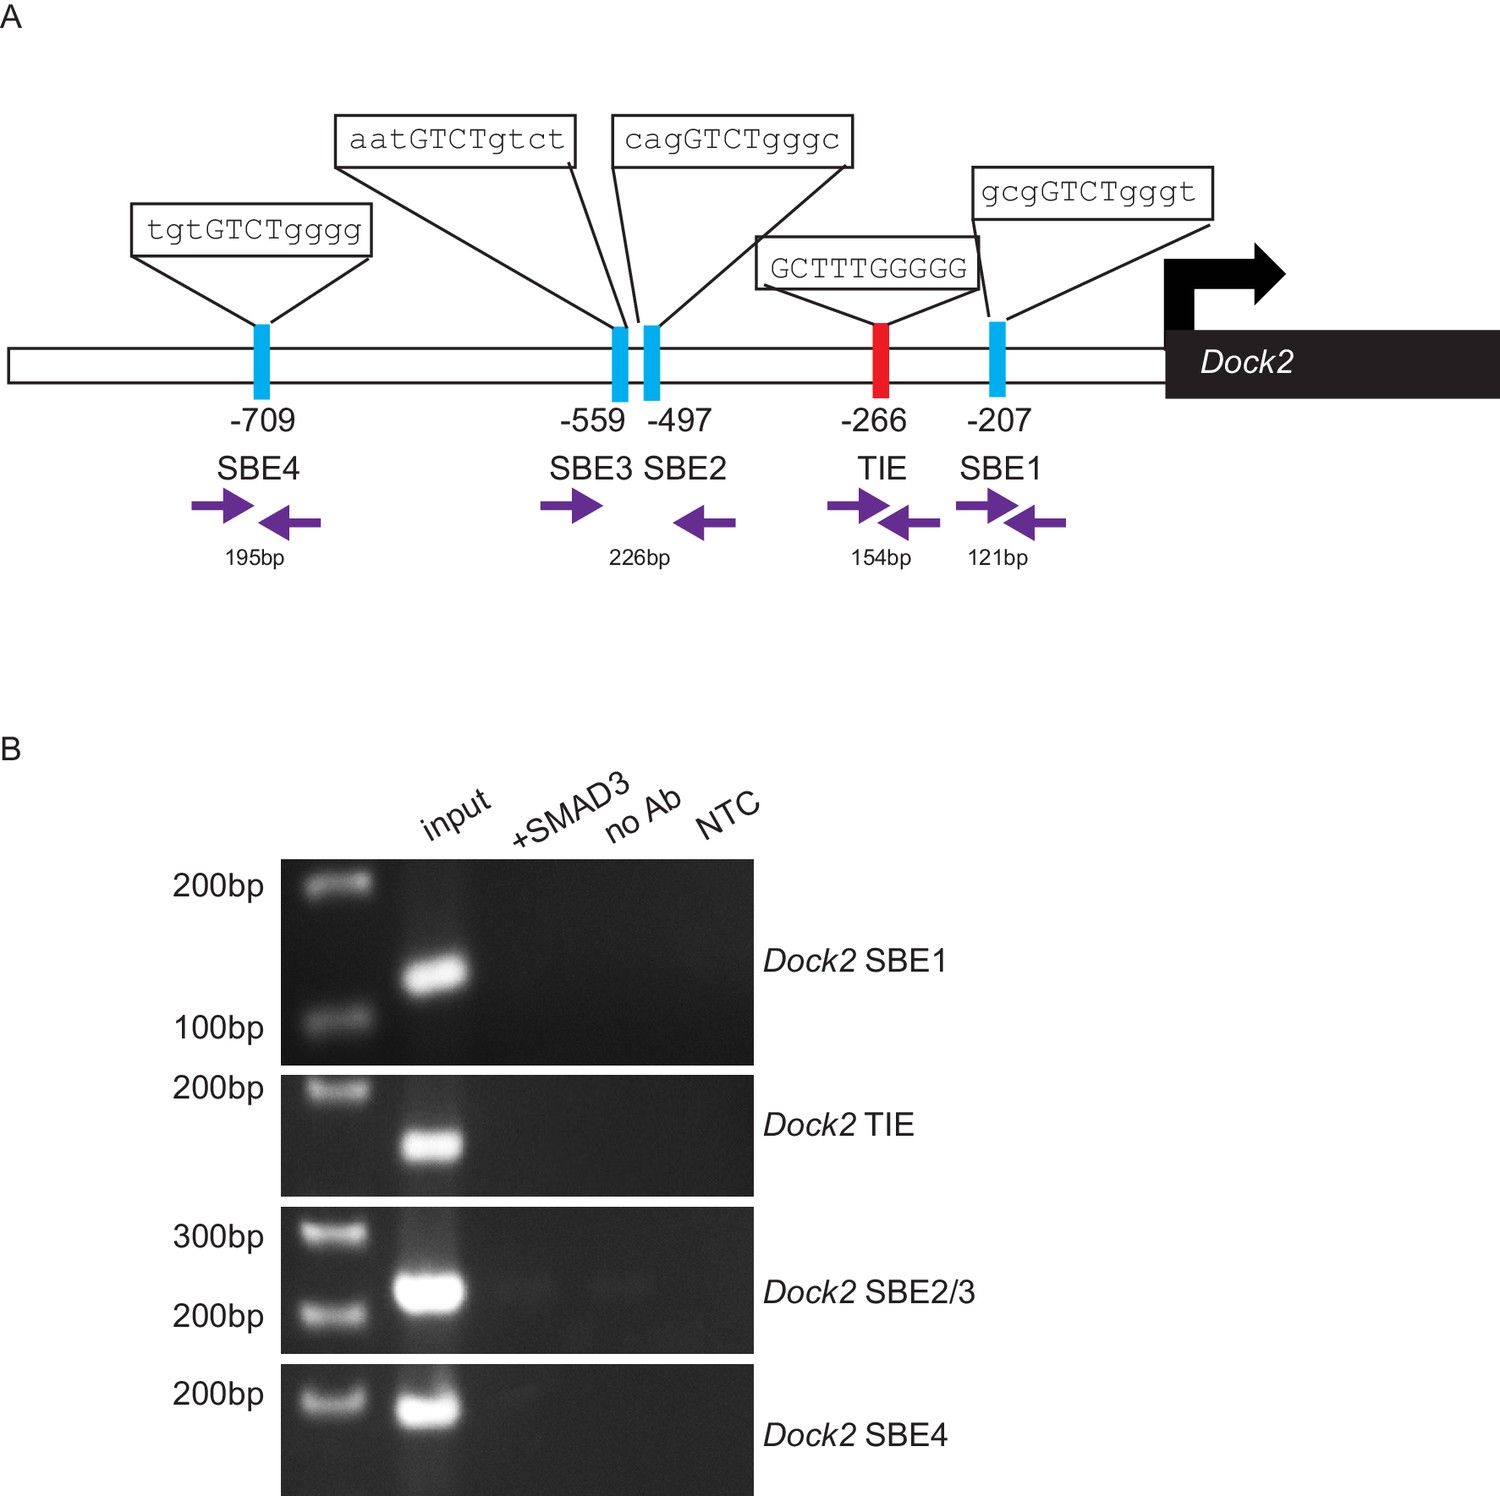
Dock2 is not a direct target of TGFβ signaling via SMAD3.
(A) Promoter analysis using MatInspector (Genomatrix) revealed five putative SMAD- responsive elements in the Dock2 promoter. The consensus SMAD-binding element (SBE) sequence GTCT was identified 207, 497, 559 and 709 base pairs (bp) upstream of the Dock2 transcriptional start site, and the consensus TGFβ-inhibitory site (TIE) GNNTTGGNGN was identified 266 bp upstream of the Dock2 transcriptional start site. Primers were designed to flank these sites (purple arrows). (B) Chromatin immunoprecipitation with an anti-SMAD3 antibody failed to isolate DNA fragments that were amplified by the primers designed to flank any of these sites on the Dock2 promoter, after overexpressing SMAD3 in NIH3T3 cells and treating with TGFβ1 (2 ng/ml) for 24 hr. Non-template (NTC) and no-antibody (no Ab) controls were used to verify the specificity of binding.
Figure 6—figure supplement 2
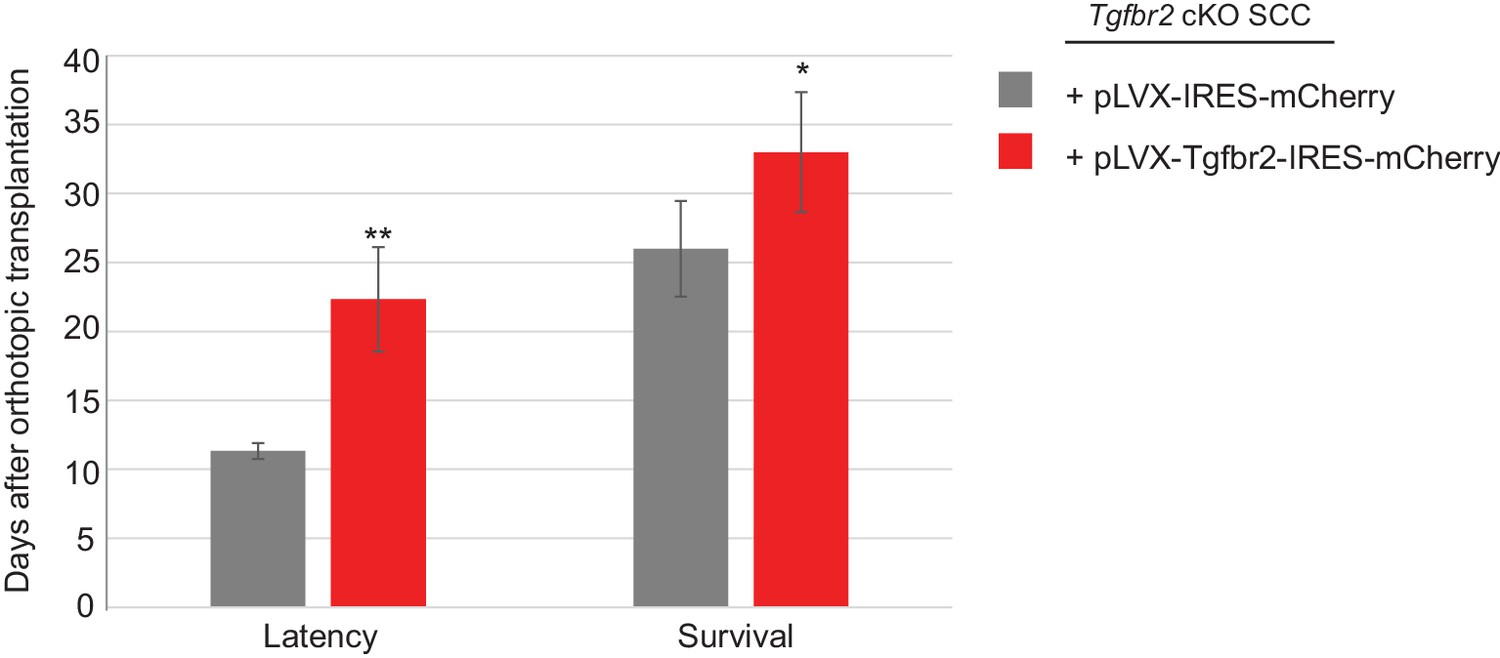
Restoration of Tgfbr2 caused a two-fold delay in tumor formation.
Tumors were generated from orthotopic transplantation of 100,000 Tgfbr2 cKO CD34+ SCC cells infected with empty vector pLVX-IRES-mCherry or with full-length Tgfbr2 inserted into the pLVX-IRES-mCherry vector. Three tumors for each condition were generated. The latency represents the day when the tumor is visible and palpable. The survival represents the day when the mouse is sacrificed due to tumor burden. Mice are sacrificed when the tumor exceeds the authorized size and volume according to Institutional Animal Care and Use Committee. Asterisks denote statistical significance using two-way ANOVA and Bonferroni post tests. p**<0.01, p*<0.05.
Figure 7 with 1 supplement

ELMO1 is expressed in human TGFβ-deficient invasive anorectal SCC.
Human anorectal tumor biopsies were analyzed for phosphorylated (activated) SMAD2 (pSMAD2) and ELMO1 by immunohistochemistry (IHC). See also Figure 7—figure supplement 1 for additional tumor biopsy sections and antibody controls. Examples of IHC staining from three invasive anal SCC grade 3 (C–E) show reduced or absent nuclear pSMAD2 staining in contrast to normal anorectal mucosa (A) and early stage tumor, anal intraepithelial neoplasia (B). Loss of pSMAD2 correlated with increased ELMO1 expression in 5 out of 6 SCC samples (see Table 1). Scoring: (++), strong positive staining; (+), positive staining; (−), negative staining. Dashed lines delineate the epidermis from dermis in (A) and delineate the tumor from stroma in (B–E). Hematoxylin counterstains nuclei in blue. Scale bars = 100 µm.
Figure 7—figure supplement 1
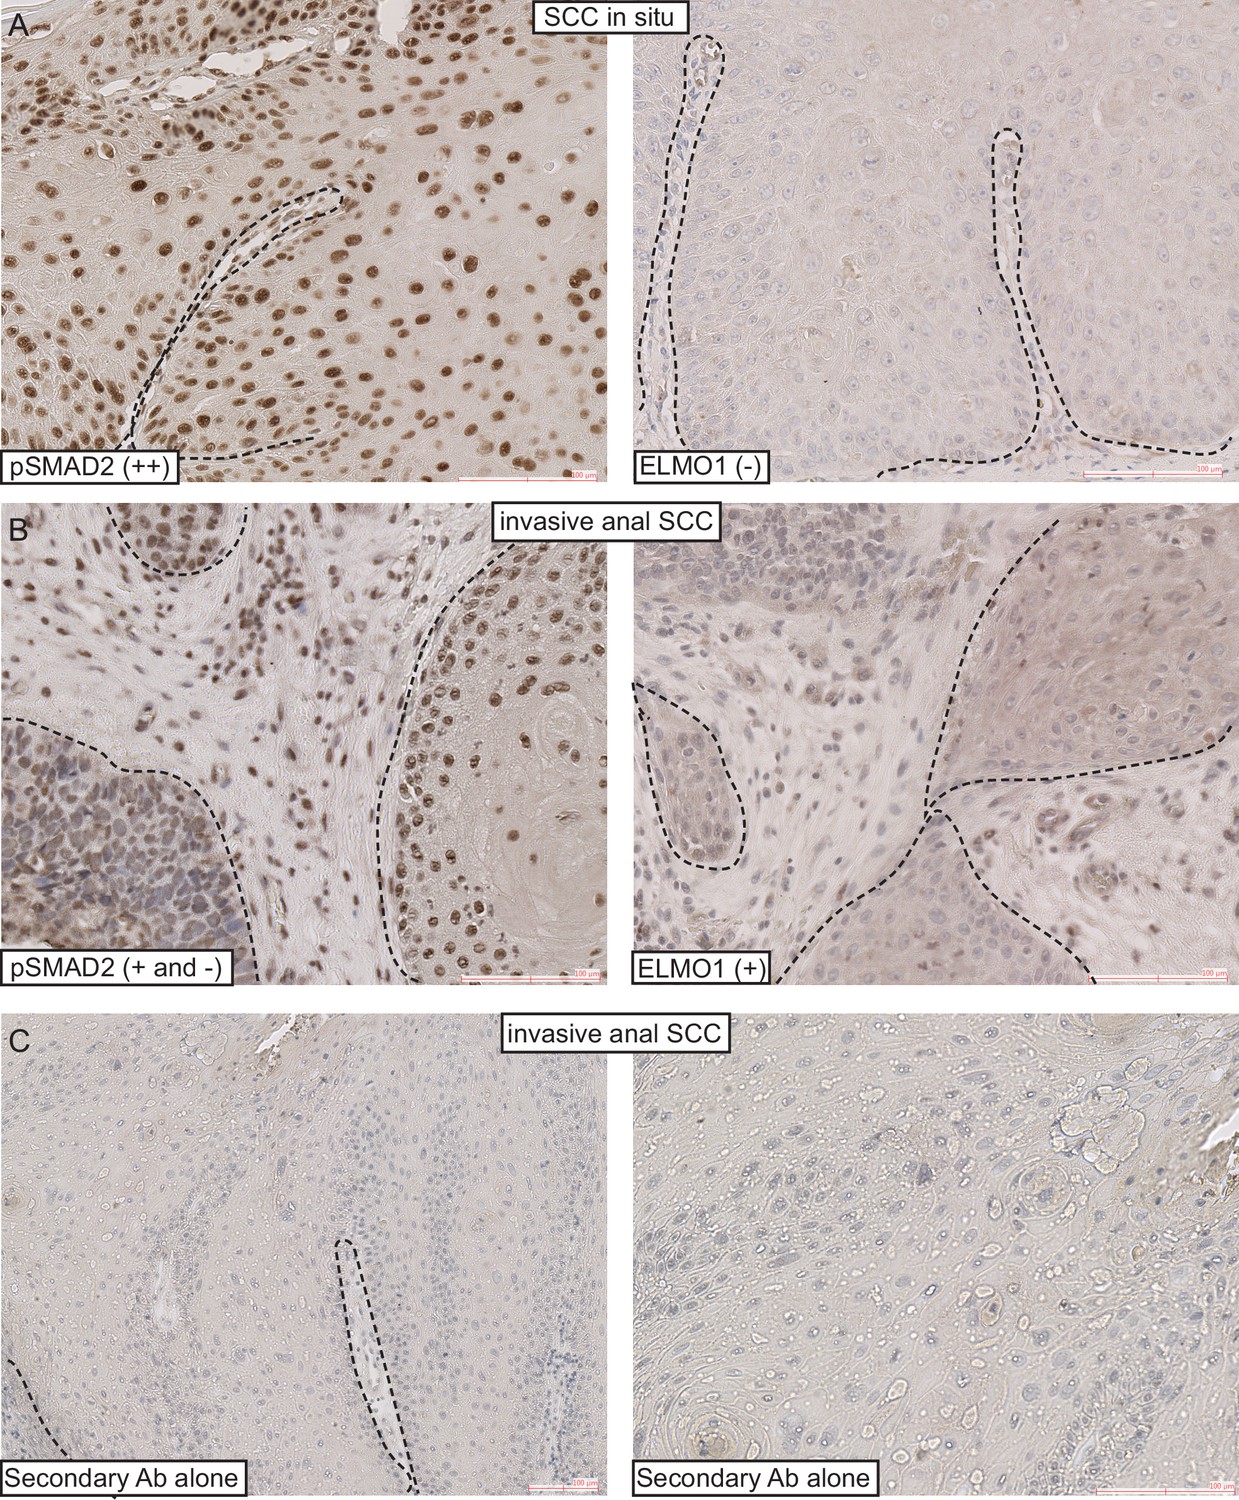
ELMO1 is expressed in human TGFβ-deficient invasive anorectal SCC.
Human anorectal tumors were analyzed for phosphorylated (activated) SMAD2 (pSMAD2) and ELMO1 by immunohistochemistry (IHC) (A–B). Secondary antibodies alone were used as controls for the IHC (C). Examples of IHC staining from one SCC in situ and one invasive anal SCC. Scoring: (++), strong positive staining; (+), positive staining; (−), negative staining. Dashed lines delineate the tumor from stroma. Hematoxylin counterstains nuclei in blue. Scale bars = 100 µm.
Figure 8 with 1 supplement
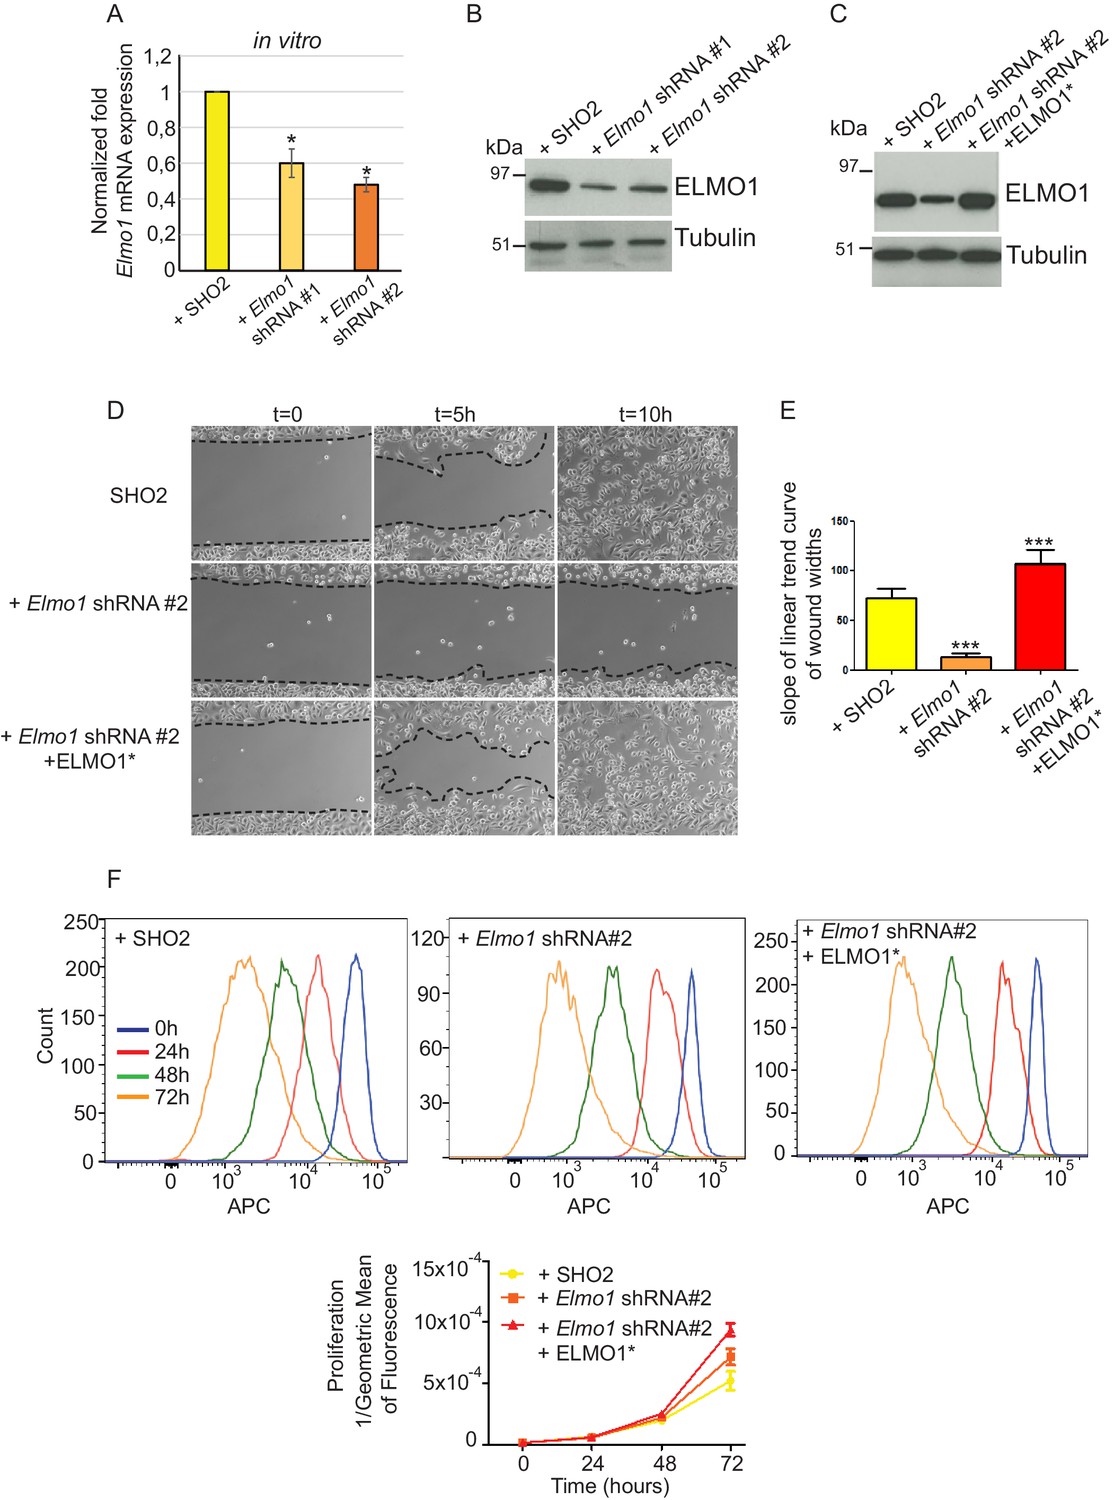
Knockdown of Elmo1 in vitro affects cell migration.
(A) shRNA knockdown of Elmo1 in cKO SCC CD34+ cells with two constructs resulted in 40–50% reduction in endogenous Elmo1 mRNA expression compared to cKO SCC CD34+ cells infected with control shRNA (SH02). Asterisks denote statistical significance using paired-sample Wilcoxon Signed Rank test; p*=0.0350 (Elmo1 shRNA#1), p*=0.0355 (Elmo1 shRNA#2). (B) Western blot analysis confirmed the reduction in endogenous ELMO1 protein in cKO SCC cells compared to cells infected with control shRNA. (C) Western blot analysis confirmed that overexpression of the hairpin-resistant ELMO1 construct (ELMO1*) in the Elmo1 shRNA cKO SCC cells restored expression of Elmo1. See also Figure 8—figure supplement 1. (D–E) Wound healing assay in vitro showed that knockdown of Elmo1 in cKO SCC cells impaired their ability to migrate 5 hr and 10 hr after wounding. This effect was rescued when the hairpin-resistant Elmo1 construct (ELMO1*) is expressed. See also Video 1. (E) Quantification of the wound healing assay showing the slope of linear trend curve of wound widths normalized to SH02 control. For each construct three different cell lines have been tested and the experiments have been repeated five times. Asterisks denote statistical significance using two-tailed, unpaired student’s t-test; p***<0.0001 (Elmo1 shRNA#2), p***=0.0002 (Elmo1 shRNA#2 + ELMO1*). (F) Elmo1 knockdown did not affect cell proliferation. Histograms show the fluorescence of the dye eFluor 670 in the APC channel at 0 hr, 24 hr, 48 hr and 72 hr. Decrease of the fluorescence reflected proliferation by the dilution of the dye over time. Three separate experiments have been done and the mean of the geometric mean for each sample is represented in the graph. There was no statistical difference in cell proliferation between samples calculated by two-way ANOVA and Bonferroni post tests.
-
Figure 8—source data 1
Values and statistics for Figure 8A using paired-sample Wilcoxon Signed Rank test.
- https://doi.org/10.7554/eLife.22914.022
-
Figure 8—source data 2
Values and statistics for Figure 8E using two-tailed, unpaired student’s t-test.
- https://doi.org/10.7554/eLife.22914.023
-
Figure 8—source data 3
Values and statistics for Figure 8F using two-way ANOVA and Bonferroni post tests.
- https://doi.org/10.7554/eLife.22914.024
Figure 8—figure supplement 1
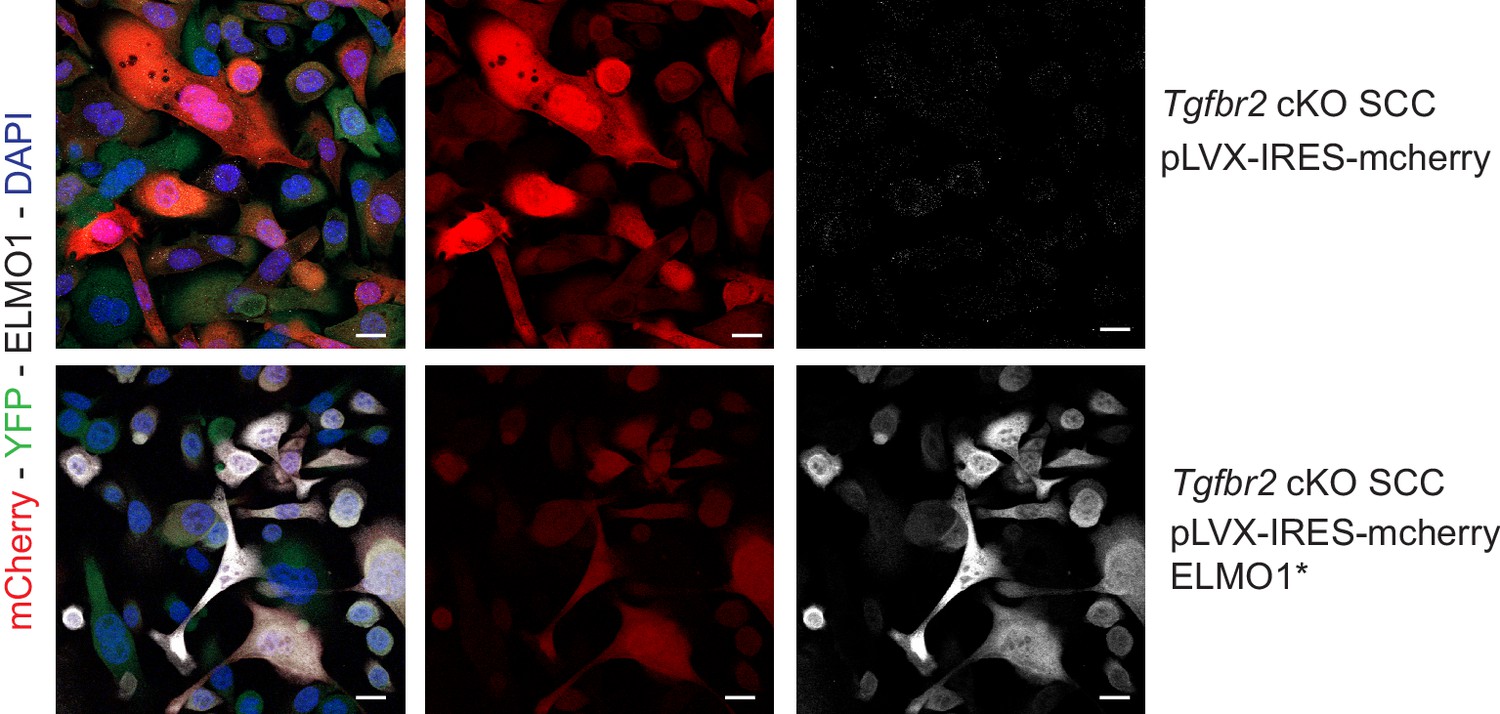
Expression of the hairpin-resistant ELMO1* construct.
To validate the specificity of the anti-ELMO1 antibody (white) and the expression of the ELMO1 hairpin resistant construct (ELMO1*), Tgfbr2 cKO CD34+ EYFP+ SCC cells were infected for 48 hr by the vector pLVX-IRES-mcherry control or the vector expressing a mutant form of ELMO1 (ELMO1*) that blocks the effect of the shRNA ELMO1 without affecting ELMO1 function. Immunofluorescence staining reveals that ELMO1 is recognized only in the pLVX-IRESmcherry-ELMO1* and correlated with the mcherry expression. Scale bars: 20 μm.
Figure 9 with 2 supplements
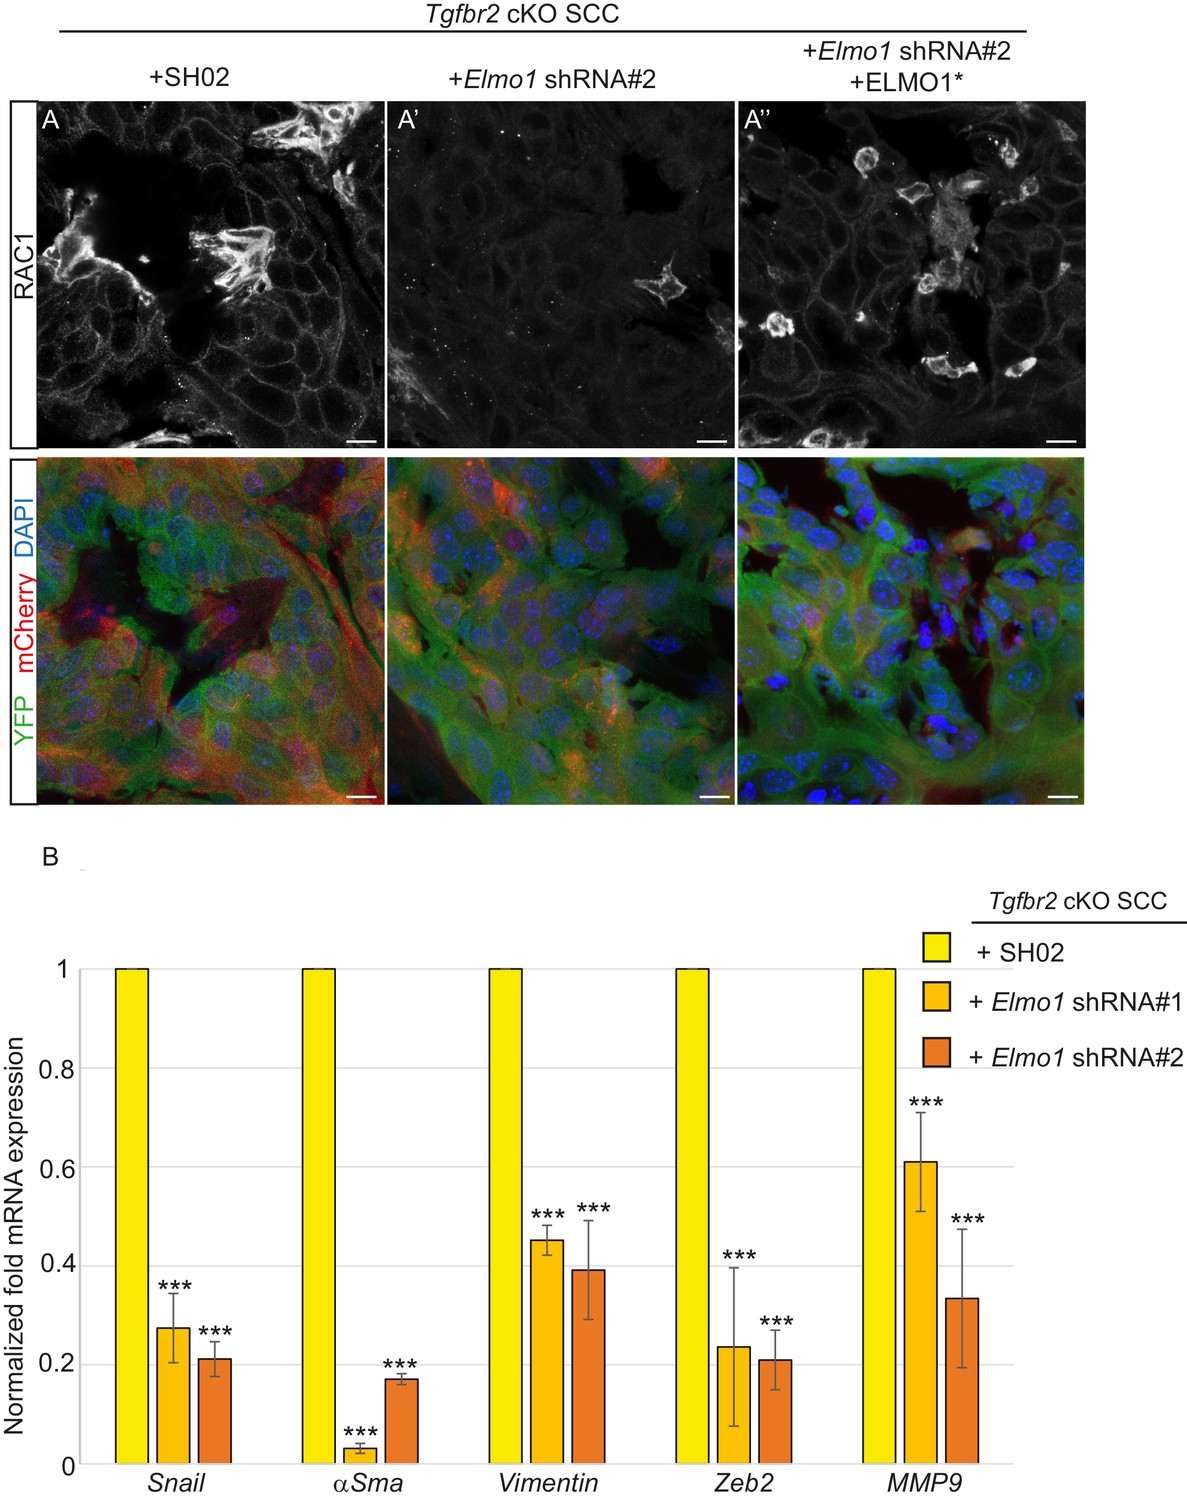
Knockdown of Elmo1 diminishes RAC1 expression and markers of invasion in Tgfbr2-deficient SCC.
(A) Immunofluorescence staining with antibodies against YFP and RAC1 revealed a reduction in RAC1 staining at the tumor-stroma border in Tgfbr2 cKO tumors with knockdown of Elmo1 (A’), compared to SH02 control tumors (A). Tumors expressing the hairpin-resistant ELMO1* construct show restoration of RAC1 compared to tumors with Elmo1 knockdown (A’’). All pictures have been taken at the same exposure time in the RAC1 channel. Three tumors for each condition have been analyzed. DAPI counterstains all nuclei in blue. Scale bars = 10 μm. (B) qPCR analysis of genes implicated in EMT, invasion and metastasis revealed a significant reduction in their mRNA expression in CD34+ cells isolated from Tgfbr2 cKO tumors with knockdown of Elmo1 compared to SH02 control tumors (see Figure 9—figure supplement 1 and 2). Data represent the mean ± standard deviation. Asterisks denote statistical significance using two way-ANOVA and Bonferroni post tests to compare each Elmo1 shRNA to SHO2 control. All p-values are <0.001.
-
Figure 9—source data 1
Values and statistics for Figure 9B using two way-ANOVA and Bonferroni post tests.
- https://doi.org/10.7554/eLife.22914.028
Figure 9—figure supplement 1
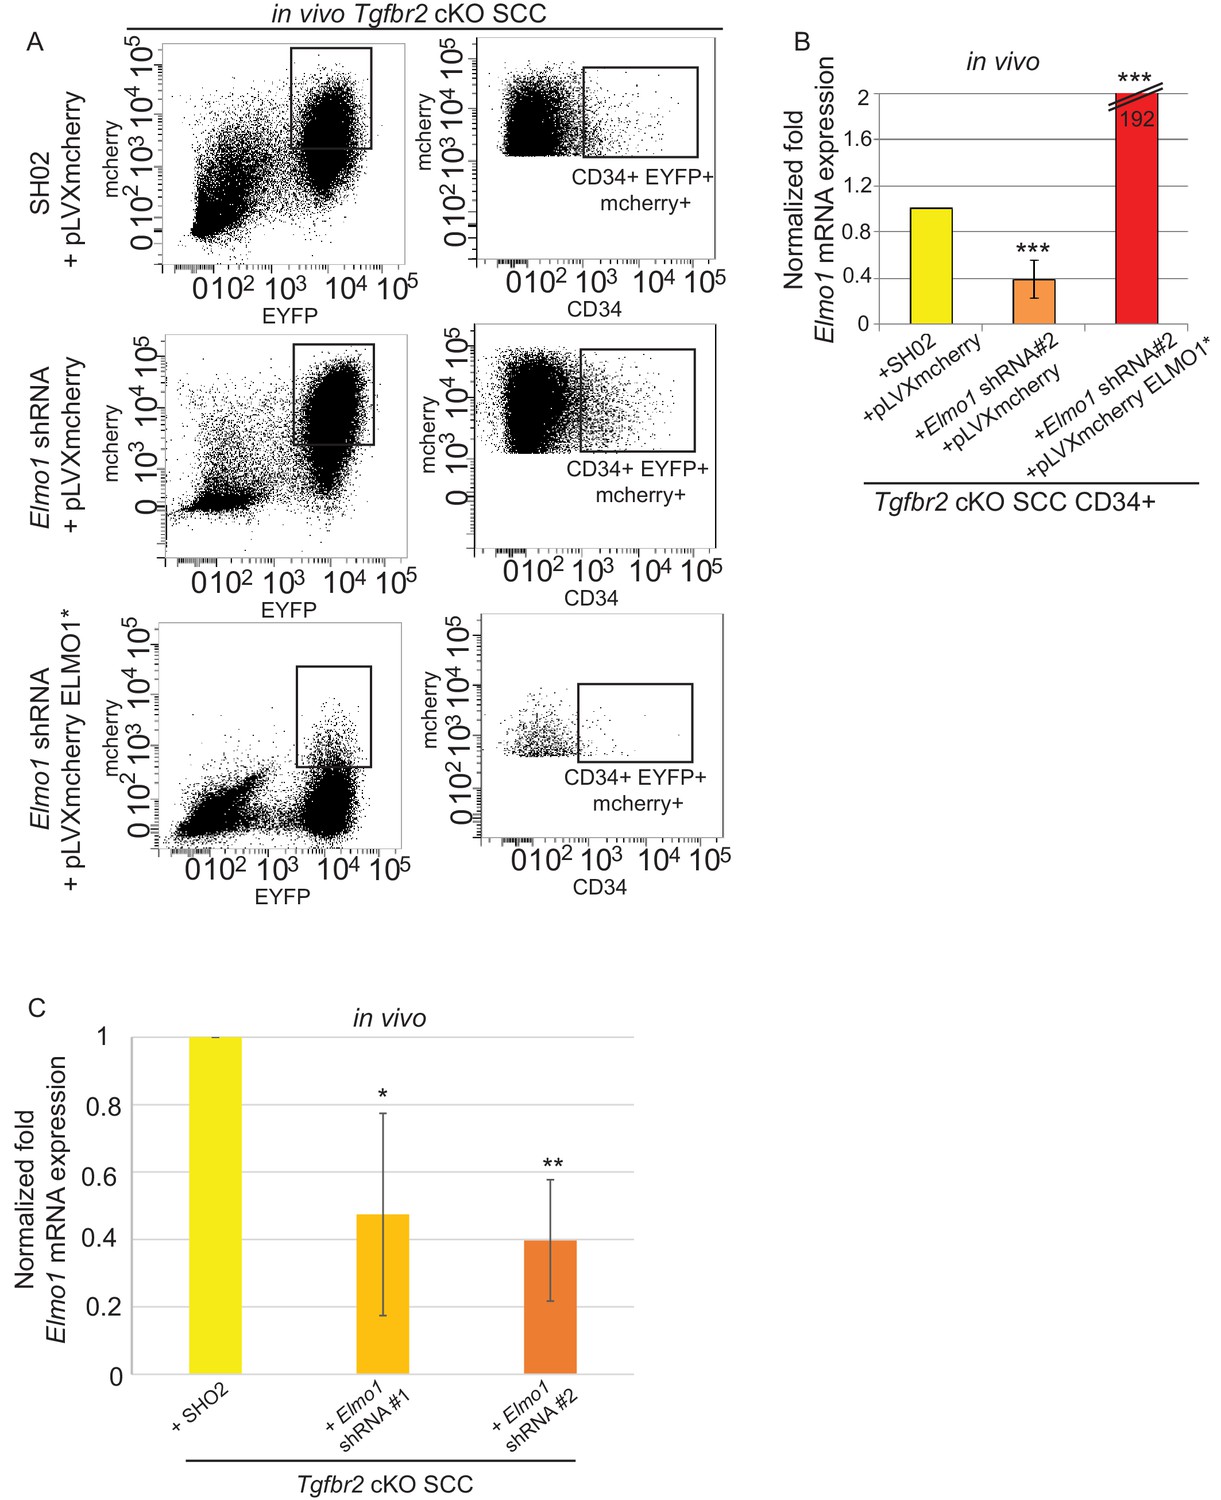
Knockdown of Elmo1 in vivo.
(A) FACS analysis of tumors generated from orthotopic transplantation of 100,000 Tgfbr2 cKO CD34+ SCC cells infected with SH02 control or Elmo1 shRNA selected with puromycin and infected again with pLVX-IRES-mCherry or with the hairpin-resistant Elmo1 construct (ELMO1*) and selected based on mCherry expression. Three different tumors for each construct were analyzed. Approximately 32% of the cKO SCC SH02 or Elmo1 shRNA + empty vector total tumor bulk expressed mCherry, whereas less than 1.5% of the cKO SCC Elmo1 shRNA + ELMO1* expressed mCherry at the time of analysis. (B) Tumors were dissociated and YFP+mCherry-CD34+ and YFP+mCherry-CD34− cells were isolated by FACS and subjected to RNA extraction and qPCR analysis. We observed a 60% reduction in Elmo1 mRNA compared to CD34+ cells isolated from SH02 tumors. Infection of CD34+ Elmo1 shRNA SCC cells with the hairpin-resistant ELMO1* construct efficiently restored Elmo1 mRNA. Asterisks denote statistical significance using two-way ANOVA and Bonferroni post tests; p***<0.001. (C) 100,000 CD34+ cKO SCC cells which were infected with SH02 control, Elmo1 shRNA construct#1 or Elmo1 shRNA construct #2 were orthotopically transplanted into recipient mice and YFP+CD34+ cells were isolated from the resulting tumors using the same FACS strategy as employed in Figure 1, and subjected to qPCR. Elmo1 mRNA was reduced by 53–61% in CD34+ cells isolated from tumors with knockdown of Elmo1 compared to SH02 tumors. *p=0.045 for construct #1 and **p=0.004 for construct #2.
Figure 9—figure supplement 2
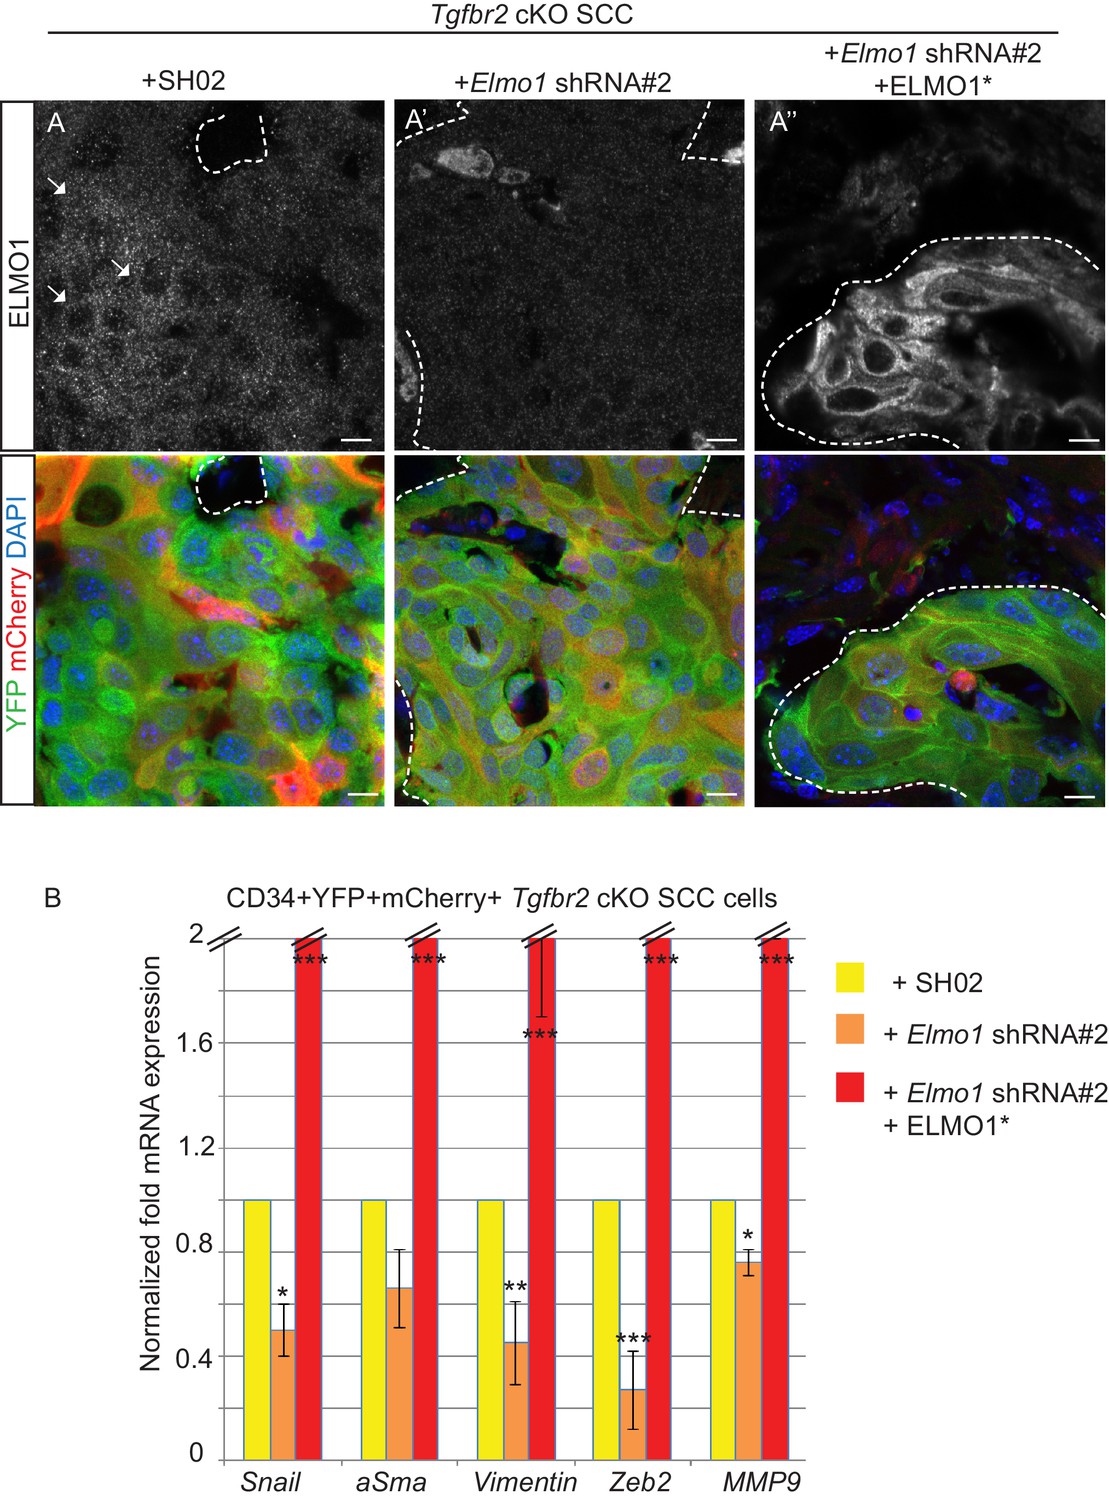
Knockdown of Elmo1 diminishes markers of invasion in Tgfbr2- deficient SCC.
(A) Infection of CD34+ Elmo1 shRNA SCC cells with the hairpin-resistant ELMO1* construct efficiently restored ELMO1 protein expression in the generated tumors as shown by immunofluorescence with an antibody against ELMO1. Scale bars: 10 μm. (B) 100,000 CD34+ cKO SCC cells which were infected with SH02 control, Elmo1 shRNA construct #2 or Elmo1 shRNA construct #2 with the hairpin-resistant ELMO1* were orthotopically transplanted into recipient mice and CD34+ YFP+mCherry+ cells were isolated from the resulting tumors using the same FACS strategy as employed in Figure 1, and subjected to qPCR. qPCR analysis of genes implicated in EMT, invasion and metastasis revealed a significant reduction in their mRNA expression in CD34+ cells isolated from Tgfbr2 cKO tumors with knockdown of Elmo1 compared to SH02 control tumors. See also Figure 9—figure supplement 1. The level of mRNA expression of these genes is restored or increased in the cells expressing the hairpin-resistant ELMO*1 construct. Data represent the mean ± standard deviation. Asterisks denote statistical significance using two-way ANOVA and Bonferroni post tests compared to SHO2; p*<0.05, p**<0.01, p***<0.001..
Figure 10
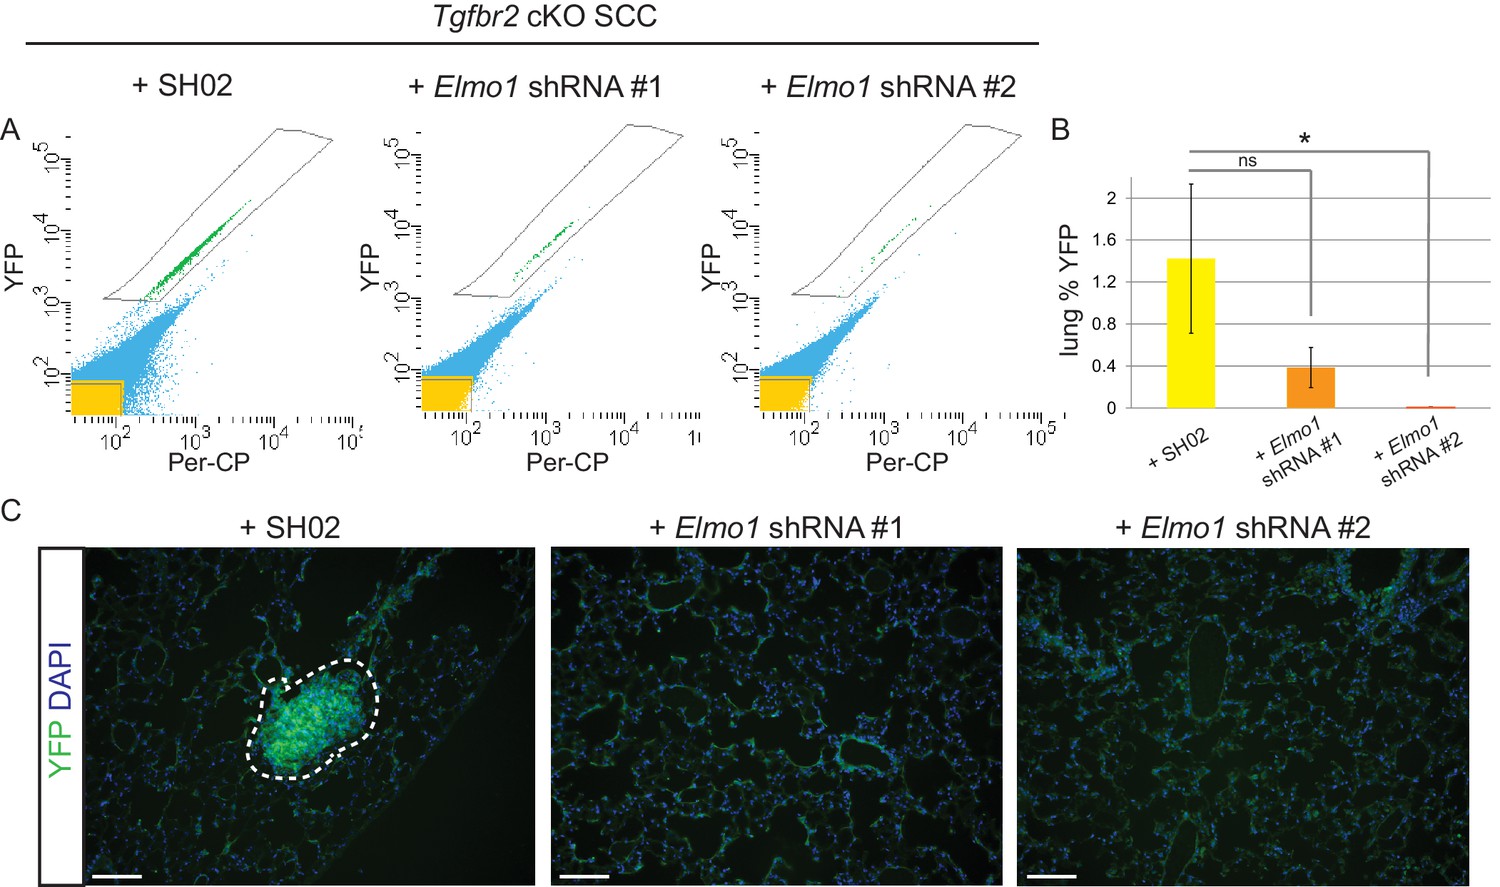
Knockdown of Elmo1 inhibits Tgfbr2-deficient SCC metastasis.
(A–B) Whole lungs from mice bearing tumors from orthotopic transplantation of Tgfbr2 cKO CD34+ SCC cells infected with SH02 control and Elmo1 shRNA were dissociated and total YFP+ cells were quantified by FACS (n = 6 different mice analyzed for each construct). Per-CP was used to exclude auto-fluorescent cells. Data represent the mean ± standard deviation. Asterisks denote statistical significance using two-tailed, unpaired student’s t-test; *p=0.0318. (C) Upon serial section of entire lungs, YFP+ lung metastases were only observed microscopically in mice bearing tumors from orthotopic transplantation of Tgfbr2 cKO CD34+ SCC cells infected with SH02 control, but not infected with Elmo1 shRNA#1 or #2. DAPI counterstains nuclei in blue. Scale bars = 100 µm.
-
Figure 10—source data 1
Values and statistics for Figure 10B using two-tailed, unpaired student’s t-test.
- https://doi.org/10.7554/eLife.22914.032
Videos
Video 1
In vitro wound healing assay showing the migration of cKO SCC SHO2 control, knockdown of Elmo1 and the hairpin-resistant Elmo1 construct.
Images were taken every 10 min for 10 hr.
Tables
Table 1
ELMO1 is expressed in human TGFβ-deficient invasive anorectal SCC. Human anorectal tumor biopsies from male and female patients, aged 32–70, were analyzed for phosphorylated (activated) SMAD2 (pSMAD2) and ELMO1 by immunohistochemistry (IHC) (see Figure 7 and Figure 7—figure supplement 1). Loss of pSMAD2 correlated with increased ELMO1 expression in 5 out of 6 SCC samples. Scoring: (++), strong positive staining; (+), positive staining; (-), negative staining. Abbreviations: SCC: squamous cell carcinoma; AIN3: Anal intraepithelial neoplasia (early stage tumor).
| Diagnosis | Sex | Age | pSMAD2 | ELMO1 | Pictures |
|---|---|---|---|---|---|
| normal anorectal mucosa | M | 58 | ++ | − | Figure 7A |
| SCC in situ | M | 47 | ++ | − | Figure 7—figure supplement 1A |
| SCC in situ + focus of invasion | M | 37 | ++ | − | |
| SCC in situ with microinvasion | M | 69 | ++ | − | |
| SCC in situ + invasive SCC | F | 70 | ++ and − | − | |
| AIN3 | F | 32 | ++ | − | Figure 7B |
| AIN3 | M | 52 | ++ | − | |
| invasive SCC + AIN3 | M | 61 | ++ and − | + | |
| invasive SCC + AIN3 | M | 52 | ++ and − | + | Figure 7—figure supplement 1B |
| invasive SCC grade 2 | M | 51 | ++ | − | |
| invasive SCC grade 2 | M | 59 | ++ | − | |
| invasive SCC grade 2 | F | 51 | ++ | − | |
| invasive SCC grade 3 | M | 53 | ++ | − | |
| invasive SCC grade 3 | F | 55 | ++ and − | + | Figure 7C |
| invasive SCC grade 3 | F | 53 | + and − | ++ | Figure 7D |
| invasive SCC grade 3 | M | 48 | − | ++ | Figure 7E |
Additional files
-
Supplementary file 1
Tgfbr2 cKO CD34+ SCC signature.
Annotated genes for mRNAs upregulated and downregulated more than two fold with an FDR < 0.05 in FACS-purified CD34+ epithelial cancer populations in comparison with mRNA from CD34− epithelial cancer populations purified with the same surface markers. Each column represents the average of two data sets for CD34+ and CD34− populations obtained from independent SCCs. Gene names are listed from the most highly upregulated to the least. Averaged expression values and averaged fold change (FC) are listed.
- https://doi.org/10.7554/eLife.22914.033
Download links
A two-part list of links to download the article, or parts of the article, in various formats.
Downloads (link to download the article as PDF)
Open citations (links to open the citations from this article in various online reference manager services)
Cite this article (links to download the citations from this article in formats compatible with various reference manager tools)
De-repression of the RAC activator ELMO1 in cancer stem cells drives progression of TGFβ-deficient squamous cell carcinoma from transition zones
eLife 6:e22914.
https://doi.org/10.7554/eLife.22914


