Adaptive tuning of mutation rates allows fast response to lethal stress in Escherichia coli
- KU Leuven - University of Leuven, Belgium
- Vlaams Instituut voor Biotechnologie, Belgium
- Imec (Interuniversity Micro-Electronics Centre), Belgium
Figures
Figure 1 with 4 supplements
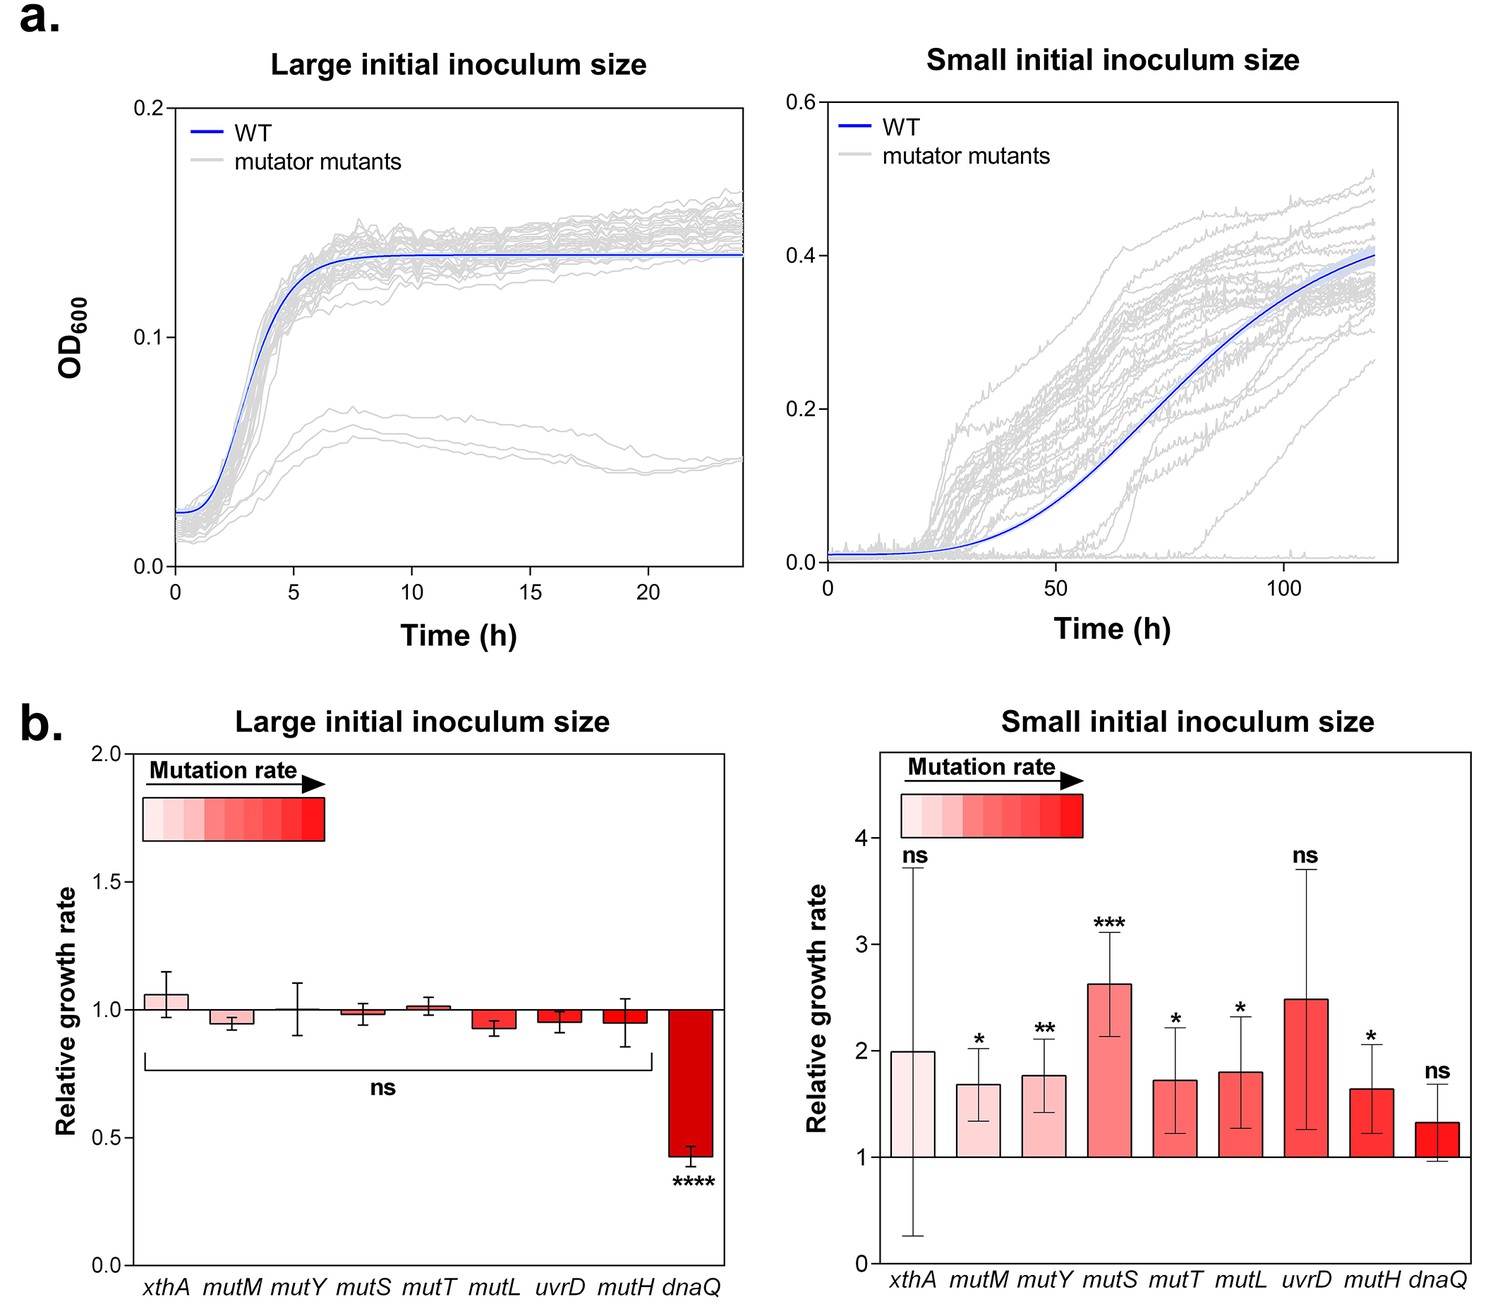
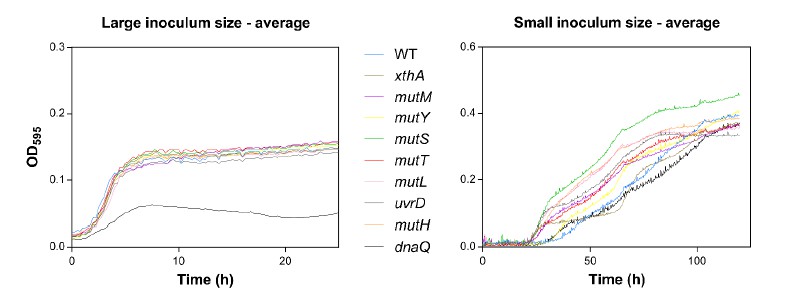
Hypermutation favors growth in high EtOH stress through generation of beneficial mutations.
(a) In the left panel, the large initial population size (107 CFU/ml) mitigates the effect on growth of emerging beneficial mutations. Growth curves of both wild type and mutators are overlapping except for all replicates of the ∆dnaQ mutant. In the right panel, we observed highly dispersed growth curves. The effect of a beneficial mutation manifests itself due to the small initial population size (104 CFU/ml). The blue line and shading represents the sigmoidal fit of the wild-type growth curves (n = 3, fit using Gompertz equation with 95% c.i. (shading), see Equation 1 in Materials and methods section), while the grey lines represent growth curve of separate replicates for each mutator mutant (b) Growth rates of all strains in the presence of 5% EtOH were measured both starting from a large initial population size of 107 cells per ml (left) and a small initial population size of 104 cells per ml (right). No significant difference was observed between the growth rates of the wild type and mutants in the case of a large starting population, indicating no direct fitness effect caused by the deletion of mutator genes (except for the ∆dnaQ mutant) (mean ± s.d., n = 3, repeated measures ANOVA with post hoc Dunnett correction, ****p<0.001). When starting from a small initial population, growth rates of all mutator mutants increased compared to the wild type (mean ± s.d., n = 3, two-sided Student’s t-test, *p<0.1; **p<0.05; ***p<0.01; ns: not significant), indicative of the occurrence of adaptive mutations as an indirect benefit for hypermutation under complex, near-lethal stress.
Figure 1—figure supplement 1
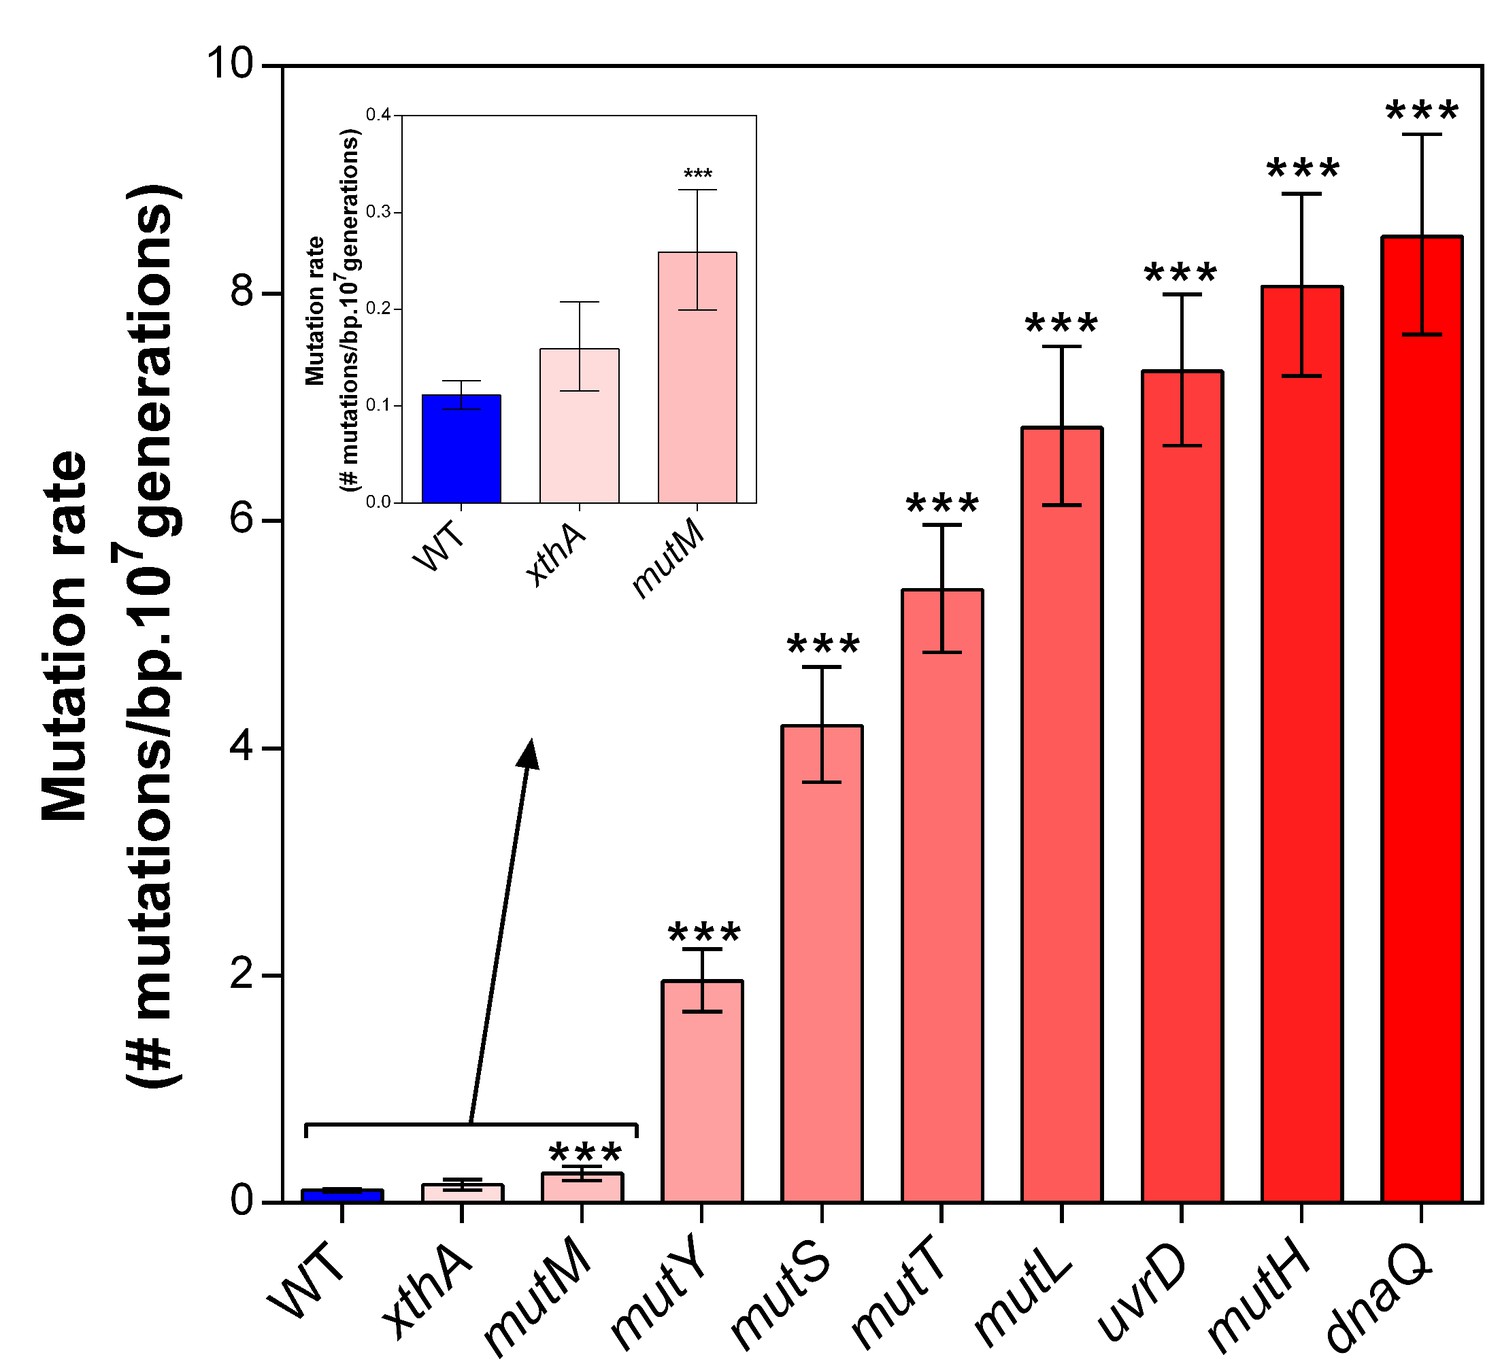
Deletion of selected mutator genes causes increased mutation rates under normal growth conditions.
These genes were selected based on their role in DNA replication and repair. Error bars represent upper and lower limits of the 95% confidence intervals. All mutation rates were statistically compared to the wild-type mutation rate using a two-sided Student’s t-test on the absolute number of mutational events as calculated by FALCOR (***p<0.001), assuming equal cell densities (see Materials and methods). Our measured mutation rate for the ∆dnaQ mutant is possibly an underestimation as a much higher mutation rate is described in literature (Schaaper and Radman, 1989).
Figure 1—figure supplement 2
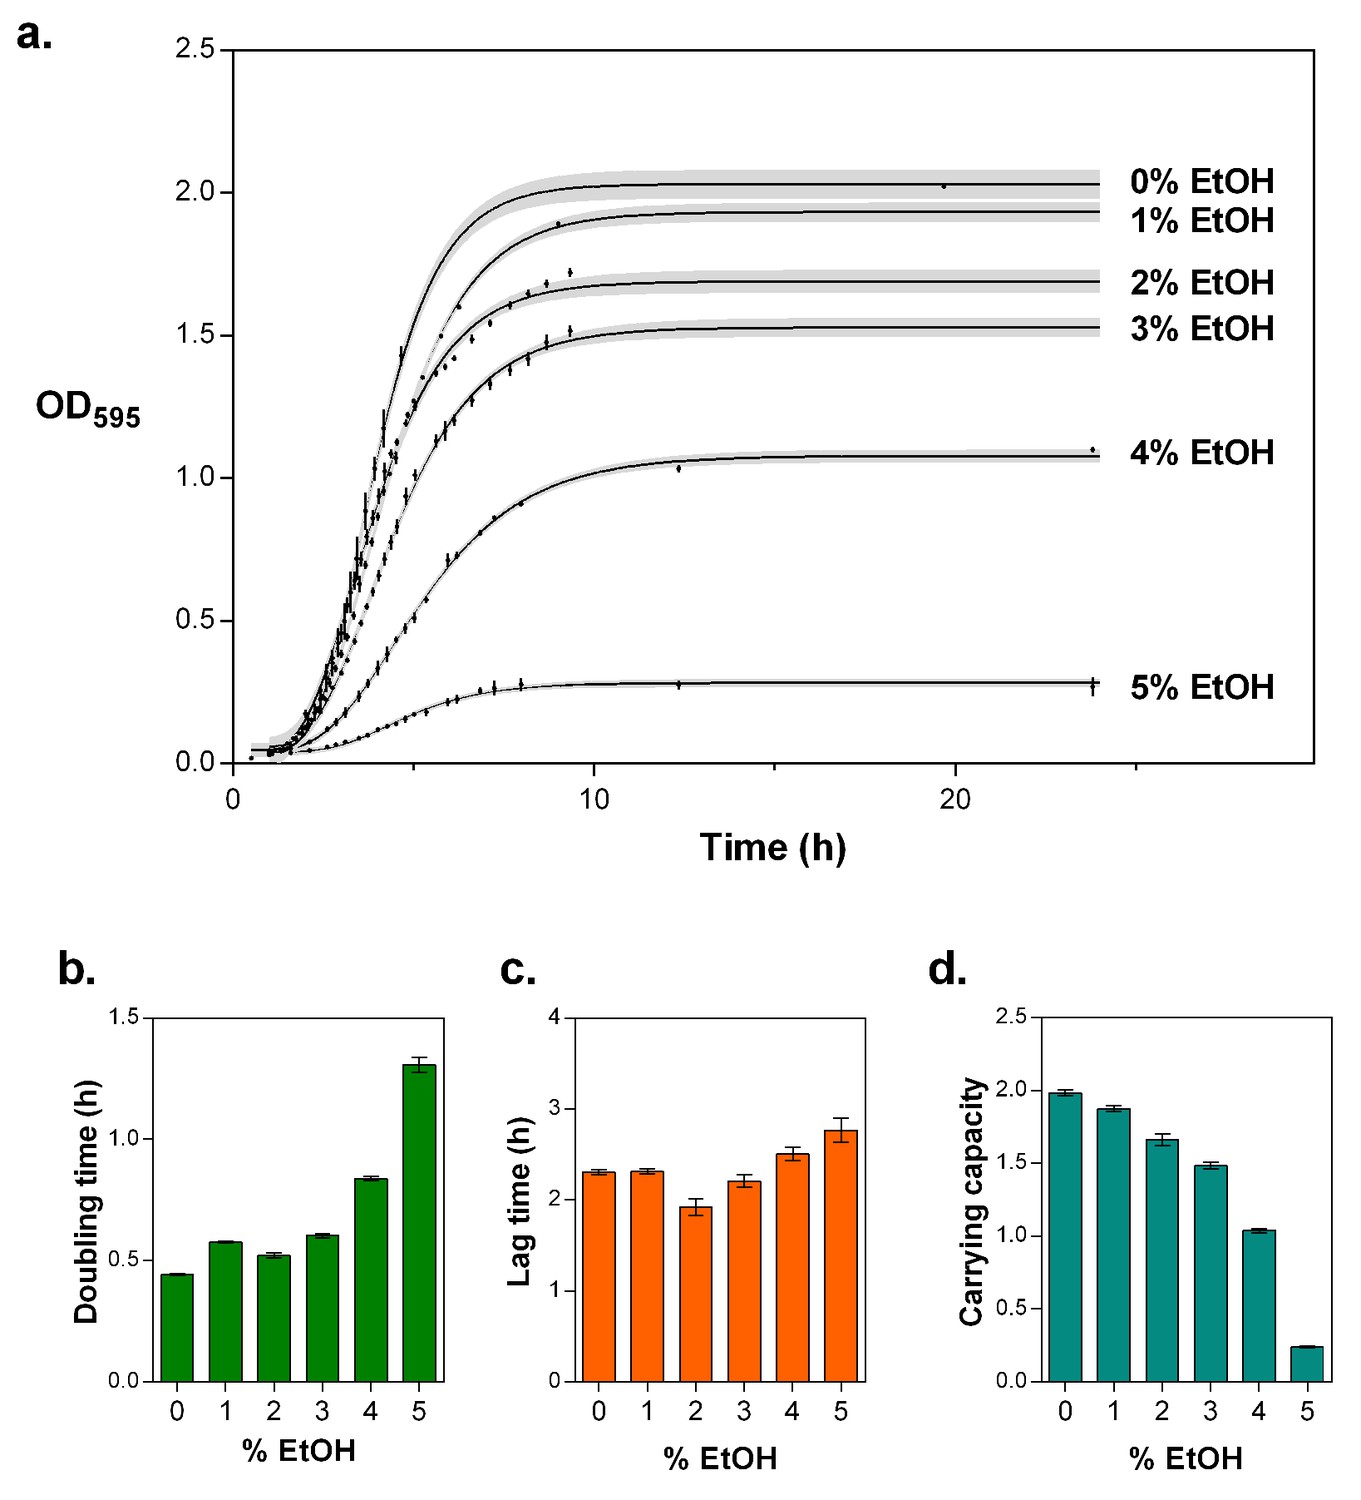
5% EtOH mimics near-lethal stress and leads to a severe decrease in growth rate and a decrease in carrying capacity.
(a) Optical density as a function of time reflects growth dynamics and shows a rapid decrease in growth as the concentration of EtOH increases (mean ± s.d., n = 3, sigmoidal fit using Gompertz equation with 95% c.i. (shading), see Equation 1 in Materials and methods). (b) Doubling time for growth in increasing percentages of EtOH, calculated as the log10(2) divided by the specific growth rate obtained from the fittings (mean ± 95% c.i., n = 3). The doubling time triples at 5% EtOH mimicking near-lethal stress. (c) Lag time for growth in increasing percentages of EtOH (mean ± 95% c.i., n = 3). (d) Carrying capacity of the population for growth in increasing percentage of EtOH (mean ± 95% c.i., n = 3).
Figure 1—figure supplement 3
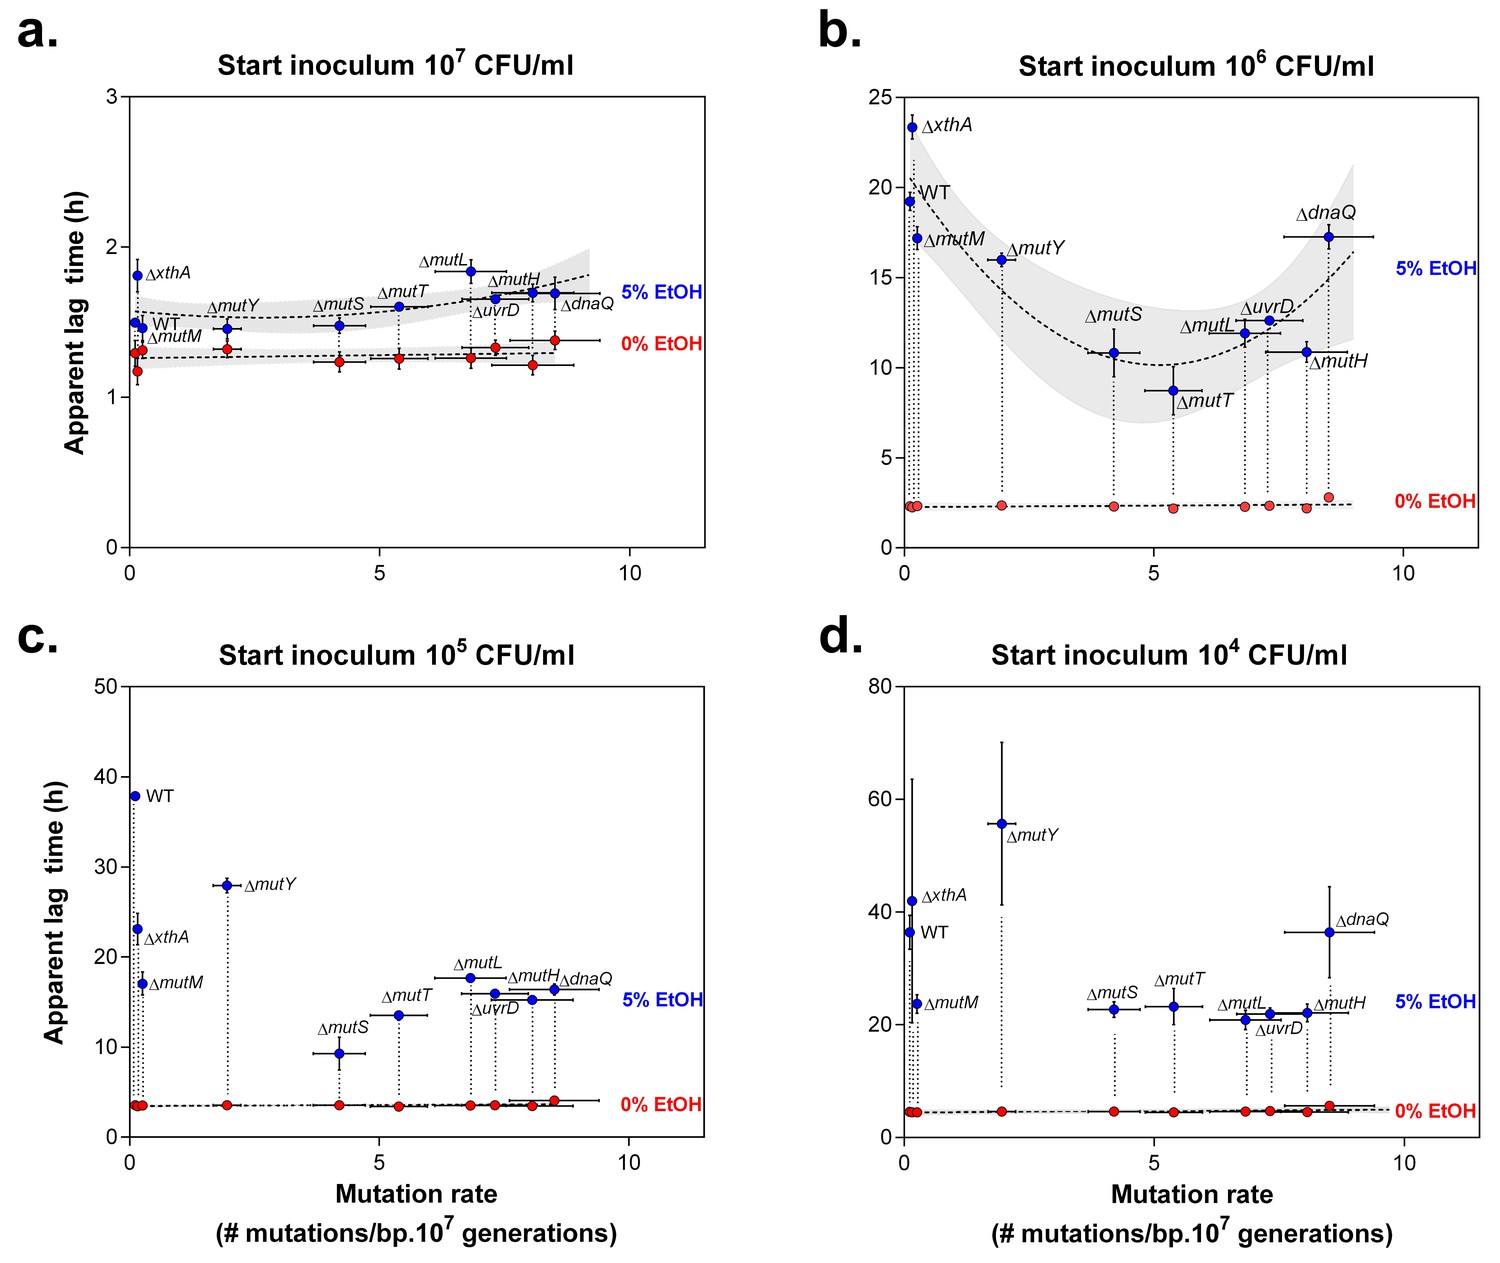
Lag times reveal a window of optimal mutation rates for growth in the presence of 5% EtOH.
The vertical axis shows the lag time of wild type and mutator mutants for growth under 0% EtOH ( ) and 5% EtOH (
 ) (mean ± 95% c.i., n = 3, values extracted from sigmoidal fitting, see Equation 1 in Materials and methods). The horizontal axis shows the absolute mutation rate for each tested strain (mean ± 95% c.i.). In the case of a large initial population, size (a) the lag times of most mutants under 5% EtOH did not differ significantly (repeated measures ANOVA with post hoc Dunnett correction), even though an inverse parabolic equation could be fitted on the data (dashed line, shading = 95% c.i.). The lag times in the absence of EtOH were linearly fitted (dashed line, shading = 95% c.i.). A 10-fold smaller initial population size (b) demonstrates the range of optimal mutation rates, reflected by a lower lag time compared to the wild type (inverse parabolic fit, shading = 95% c.i.). Interestingly, mutation rates associated with ∆mutS and ∆mutT are best suited for growth on 5% EtOH. The range of optimal mutation rates was also observed in the case of lower initial population sizes (c and d), although the inverse parabolic fit was less accurate. The lag times in the absence of EtOH were linearly fitted (dashed line, shading = 95% c.i.). When starting from a very small initial population size (d), most mutators have a lower lag time than the wild type, demonstrating that even a small increase in mutation rate (i.e. ∆mutM) is sufficient for a competitive advantage over the wild type. Only the lag times of the wild type, ∆xthA and ∆dnaQ are high, showing that mutation rates that are either too low or too high are not beneficial under these conditions. Finally, the ∆mutY mutant showed a higher lag time, possibly due to direct effects of a mutY deletion under EtOH stress.
Figure 1—figure supplement 4
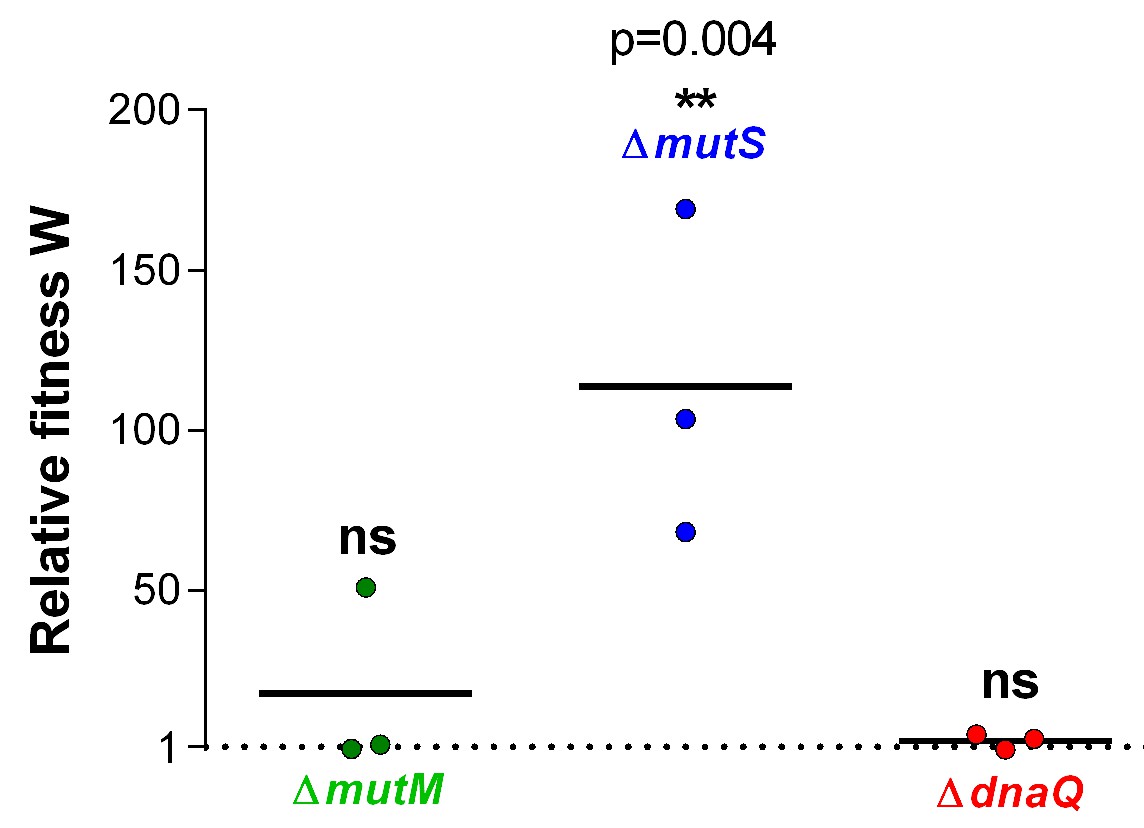
Relative fitness W associated with different mutation rate variants reveals an advantage for the ∆mutS mutator under EtOH stress.
Three mutator mutants were selected based on their contrasting mutation rates (Figure 1—figure supplement 1). Significance of difference from 1, where the mutant has no benefit over the wild type, was determined using a one-way ANOVA with post hoc Dunnett correction (n = 3, **p<0.01). ∆mutS is the only mutant with a significantly increased selection rate, showing a competitive advantage for mutants with this mutation rate for growth in the presence of 5% EtOH.
Figure 2 with 3 supplements
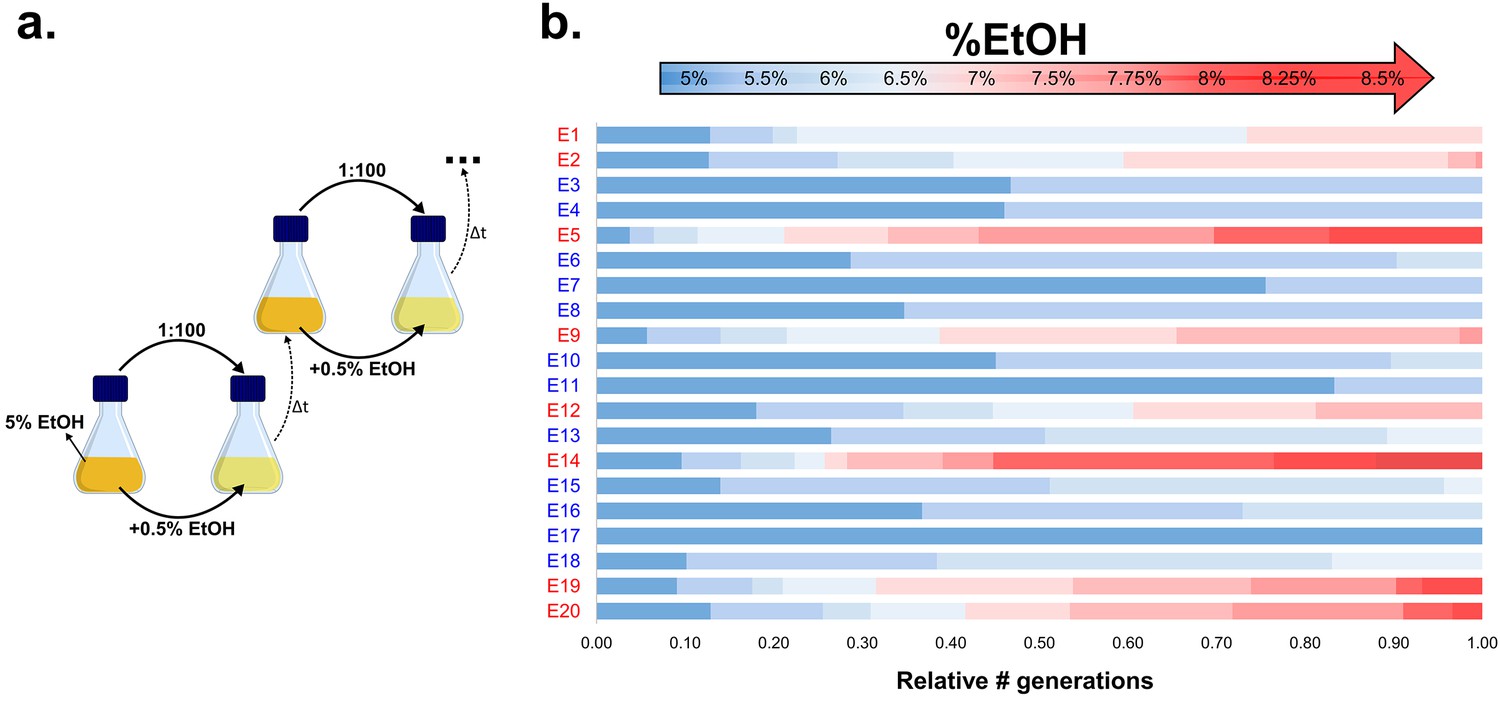
Experimental evolution of E. coli to increasing EtOH concentrations.
(a) Setup of the evolution experiment with increasing percentage of EtOH. Initially, ancestral cells were grown in the presence of 5% EtOH, the condition that mimics near-lethal stress (Figure 1—figure supplement 2). Populations that grew until exponential phase were transferred to fresh medium while simultaneously increasing EtOH concentrations with 0.5% (for full details, see Materials and methods). (b) Evolutionary outcome of 20 independent parallel lines. Eight parallel lines evolved to high EtOH tolerance (shown in red). The other 12 lines were only able to acquire low EtOH-tolerance levels (shown in blue). For each line, the relative time (in generations) it spent growing on a certain percentage of EtOH is shown.
Figure 2—figure supplement 1
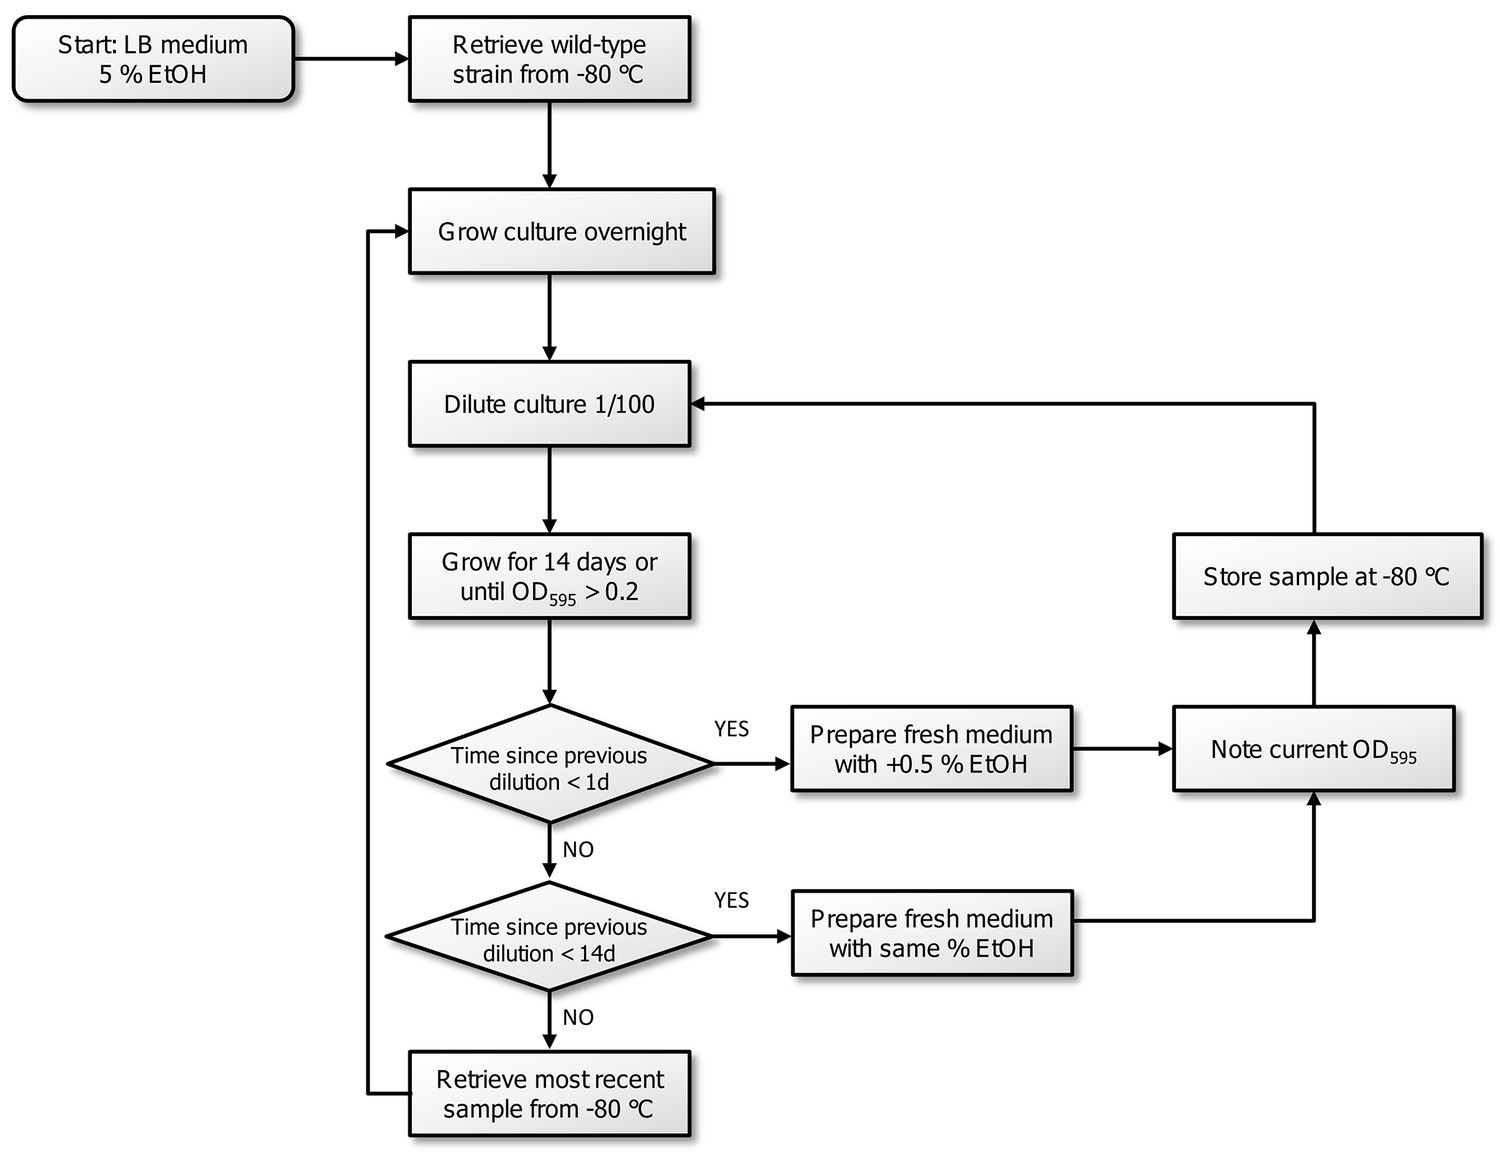
Flowchart of the experimental evolution experiment to high EtOH tolerance in E. coli.
All strains were initially grown in LB medium containing 5% EtOH. The optical density, inherent to exponential-phase growth, and time to reach this optical density, were subsequently used to determine the consecutive step in the evolution experiment. If adaptation occurred (time since dilution <1 day,) the strain was transferred to medium with 0.5% more EtOH. If the strain grew, but was not fully adapted to a certain percentage (time since dilution <14 days), the strain was transferred to medium with the same amount of EtOH. If the strain did not show growth in a 14 days timespan, we assumed that the line died out and we revived the previous stored intermediate point to restart the evolution.
Figure 2—figure supplement 2
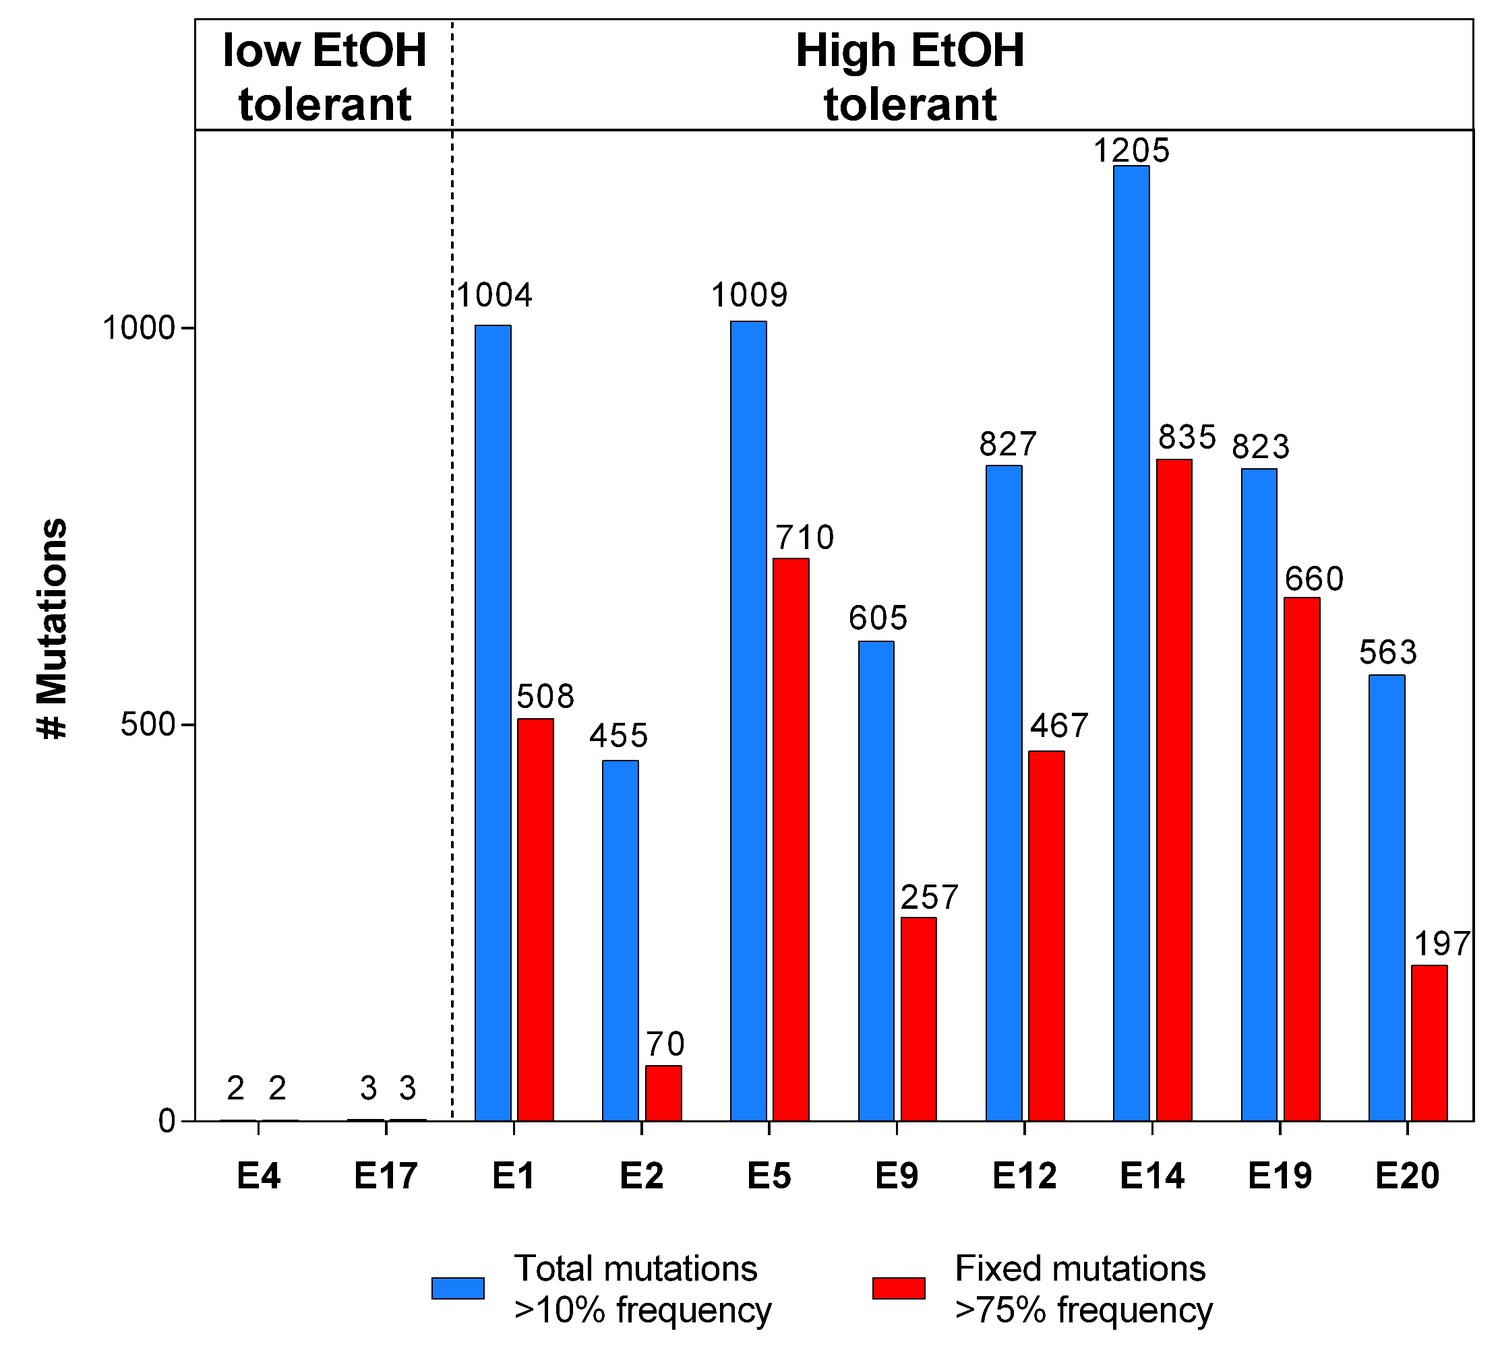
The total number of mutations exceeds the number of fixed mutations in the population.
For each line, the low frequency variant caller (CLC Genomics Workbench, Qiagen) was used to detect all variants in the population with a frequency of 10% or higher, represented by the blue bars. The red bars represent the fraction of these mutations that are ‘fixed’ with a frequency of 75% or higher. The discrepancy between the two values demonstrates the complex structure of evolving hypermutator populations, possibly containing several subpopulations with higher or lower mutation rates compared to the average population mutation rate.
Figure 2—figure supplement 3
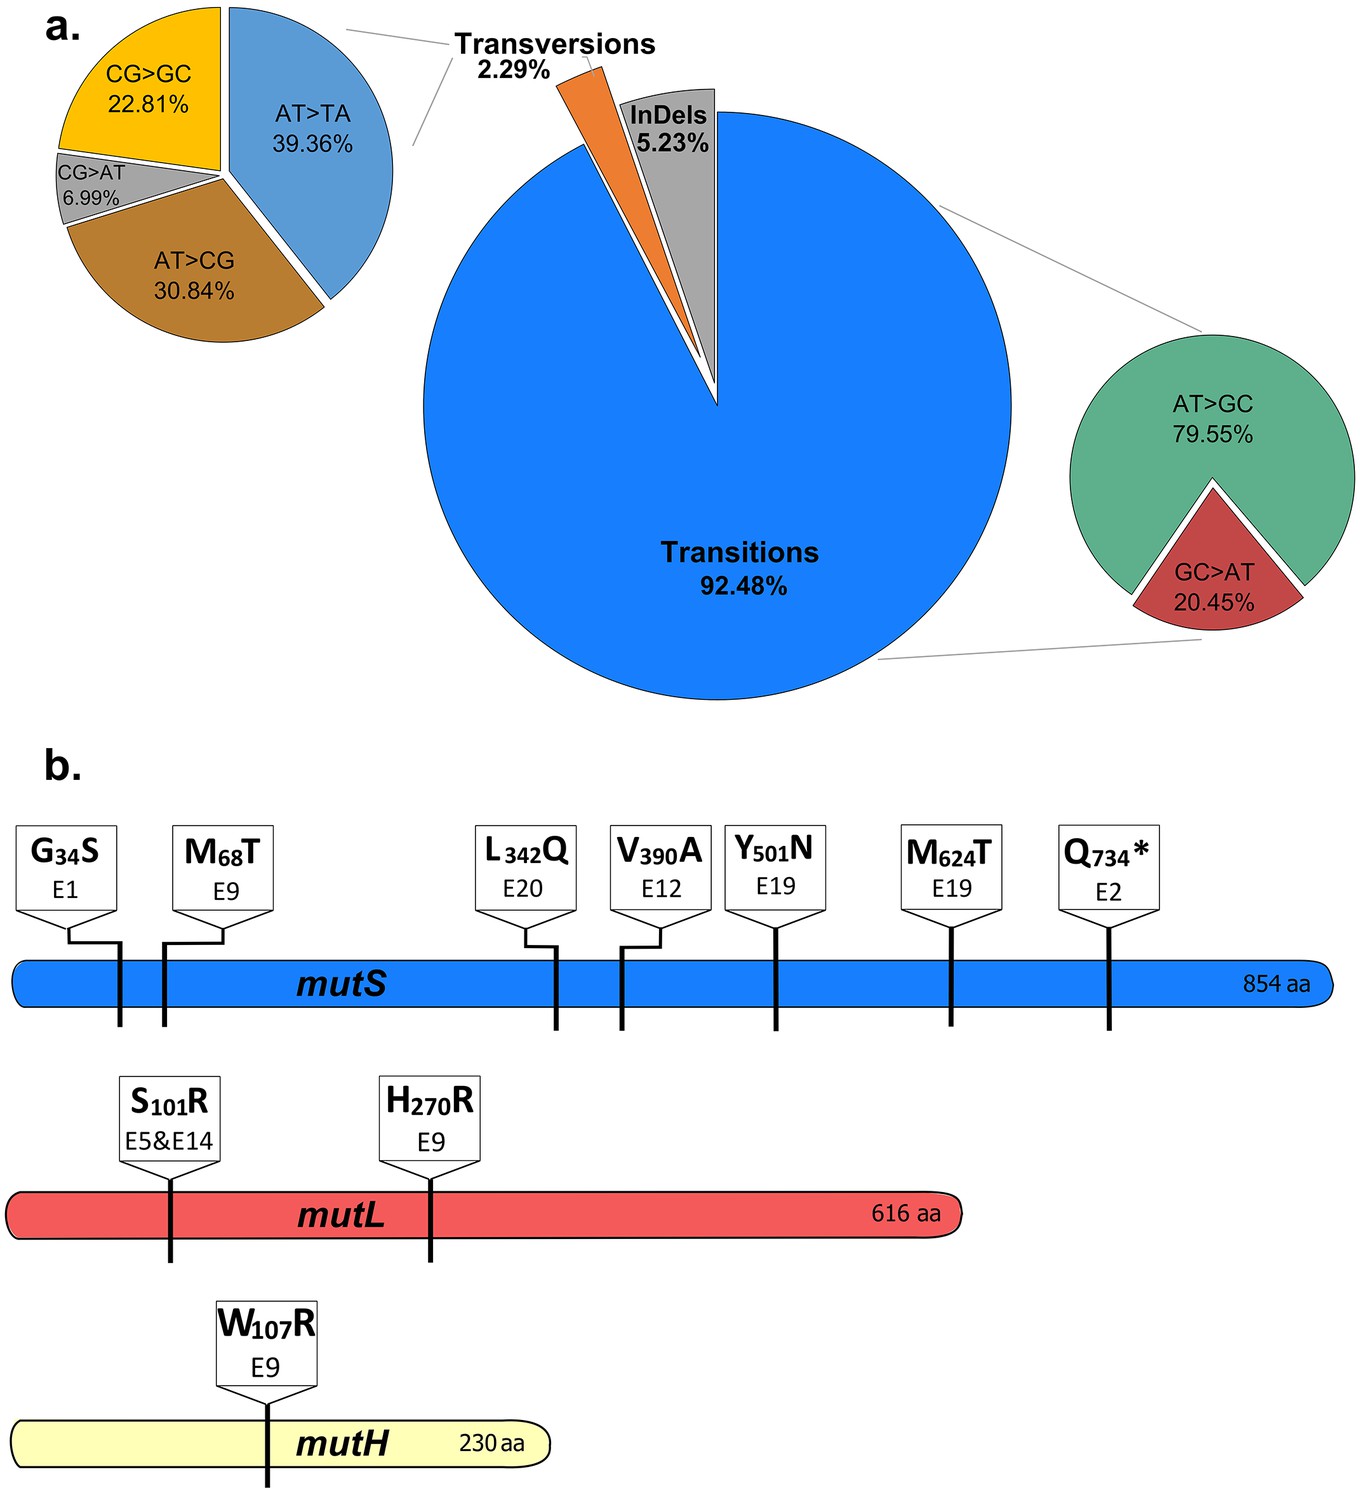
The mutational spectrum of evolved EtOH-tolerant lines corresponds to the mutational spectrum of MMR mutators.
(a) The combined spectrum of mutations found in all high EtOH-tolerant lines (eight lines, clonal sequence data) reveals a vast majority of transitions compared to transversions and frameshifts. This spectrum corresponds to the typical spectrum found in MMR mutators (Schaaper and Dunn, 1987). (b) Multiple non-synonymous mutations were found in the three main MMR genes, mutS, mutL and mutH. The location and specific amino acid changes are shown for each mutation found in these genes. Different mutations at distinct locations in the MMR genes were found, suggesting an important role for the MMR system in modulating the mutation rate according to the current stress conditions.
Figure 3
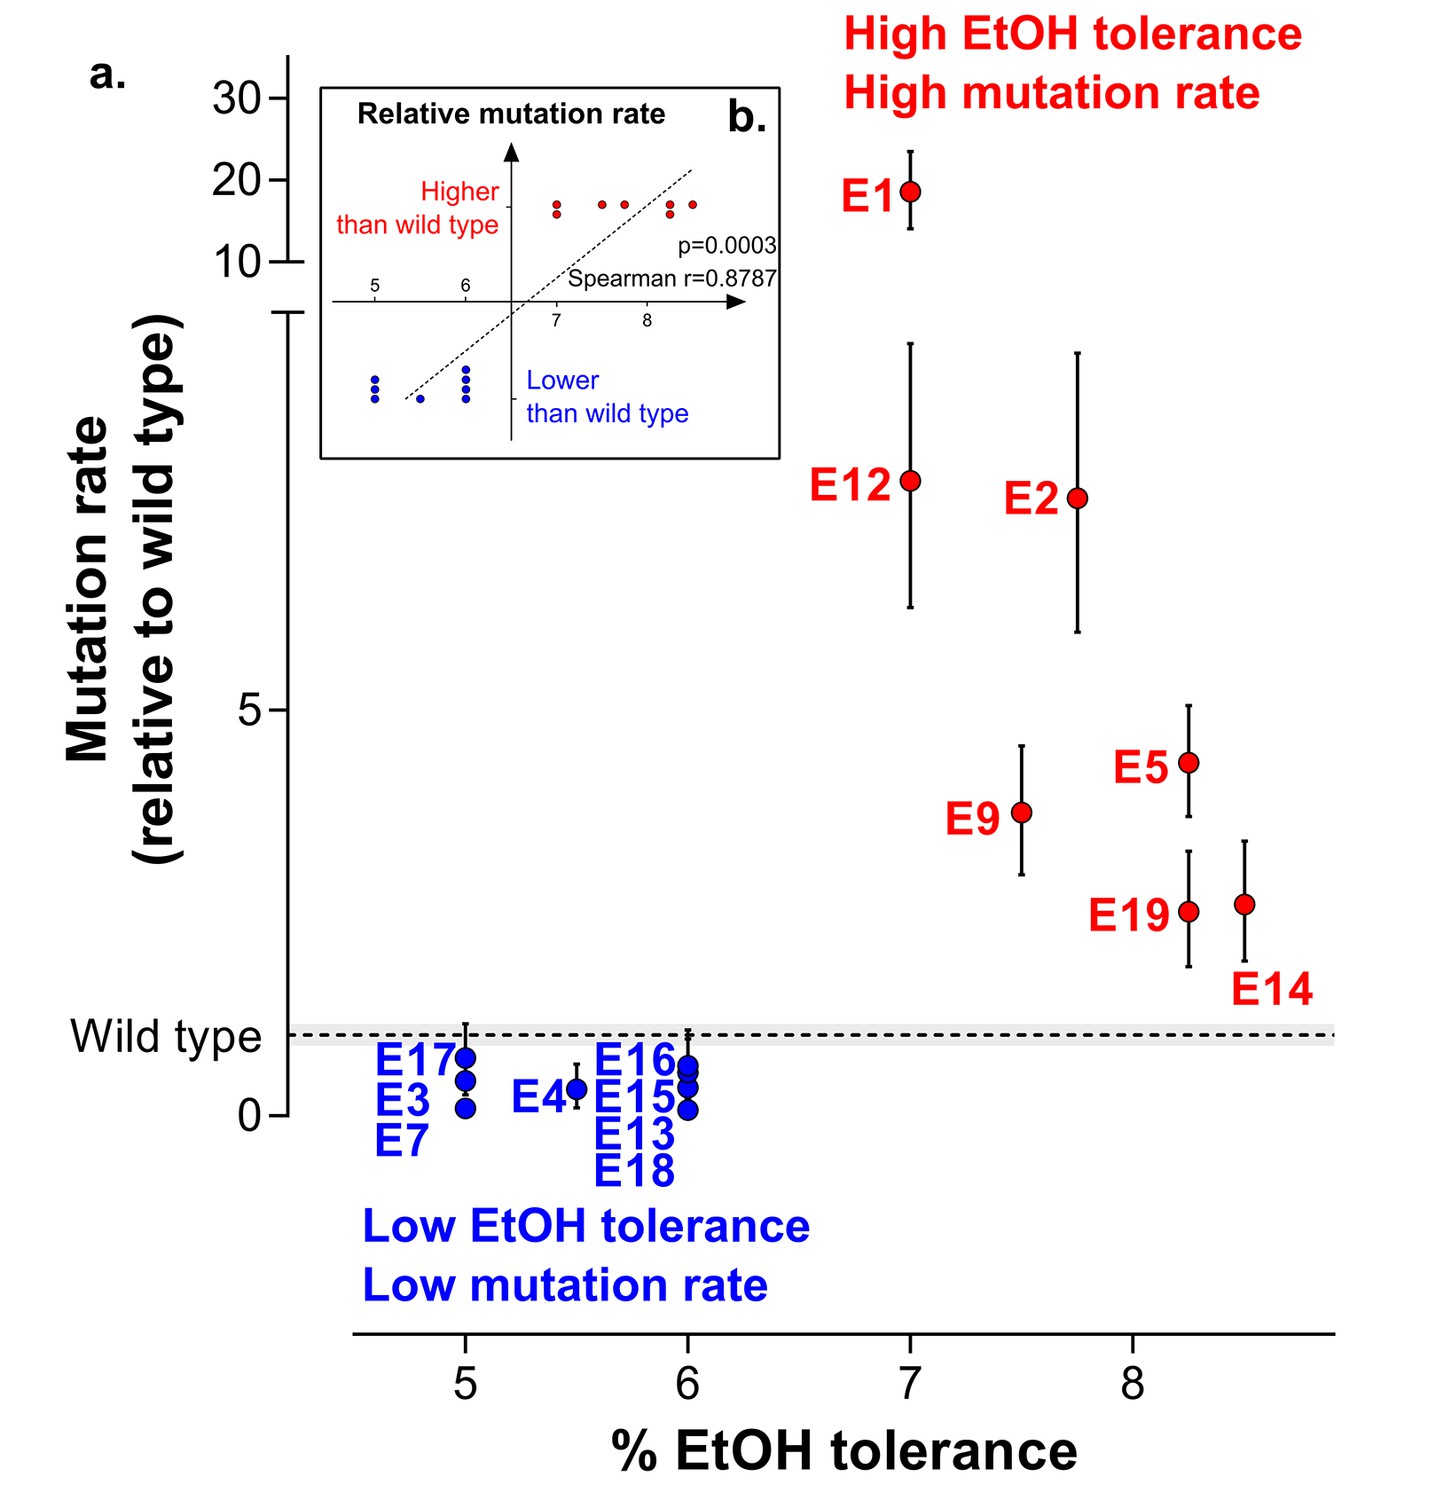
Increased mutation rate underlies evolution of high EtOH tolerance.
(a) The population mutation rate of parallel evolved lines relative to the wild type mutation rate is shown (mean ± 95% c.i., see Materials and methods). Two different groups can clearly be distinguished according to the higher than wild-type ( ) or lower than wild-type (
 ) mutation rate. This subdivision is in accordance with the difference in endpoint EtOH tolerance levels (Figure 2b). All mutation rates were significantly different from the wild type (p<0.001; two-sided Student’s t-test on the absolute number of mutational events as calculated by FALCOR, assuming equal cell densities [see Materials and methods]) (b) For correlation analysis, all parallel lines were subdivided in two groups according to their higher or lower than wild type mutation rate. Spearman correlation analysis resulted in a highly significant positive correlation (p<0.001). Lines with a mutation rate lower or equal than the wild-type mutation rate are therefore correlated with lower ethanol tolerance, whereas lines with a higher mutation rate than the wild-type mutation rate are correlated with high ethanol tolerance. In conclusion, these data suggest that hypermutation is necessary for adaptation to high EtOH stress.
Figure 4 with 1 supplement
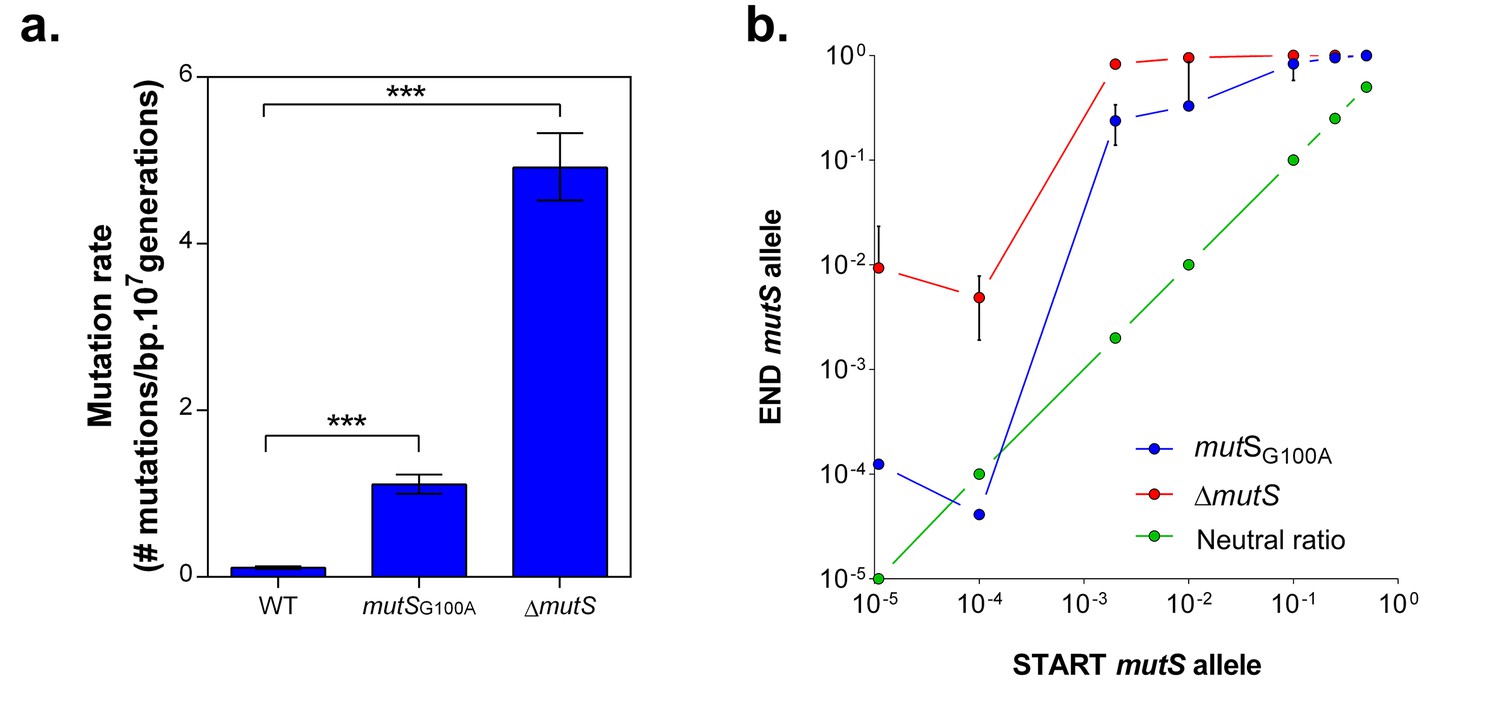
mutS mutators are able to outcompete wild-type cells in direct competition under 5% EtOH, irrespective of the mutator population size.
(a) The specific G100A point mutation in mutS was introduced in a wild-type background. This point mutation confers a significantly increased mutation rate compared to the wild type strain (mean ± 95% c.i., ***p<0.001, see Materials and methods). The mutation rate of the mutSG100A strain is lower than the mutation rate of the clean ∆mutS knockout mutant (1.1127 vs 4.1971 mutations per bp per 107 generations). (b) The green line ( ) represents the expected ratio if there is no fitness effect. The red line (
 ) gives the results for the ∆mutS mutant and the blue line (
 ) represents the results for the mutSG100A mutant (mean ± s.d., n = 3). For both mutants, an increase in fraction of mutators in the population was seen, showing the advantage of hypermutation under high EtOH stress.
Figure 4—figure supplement 1
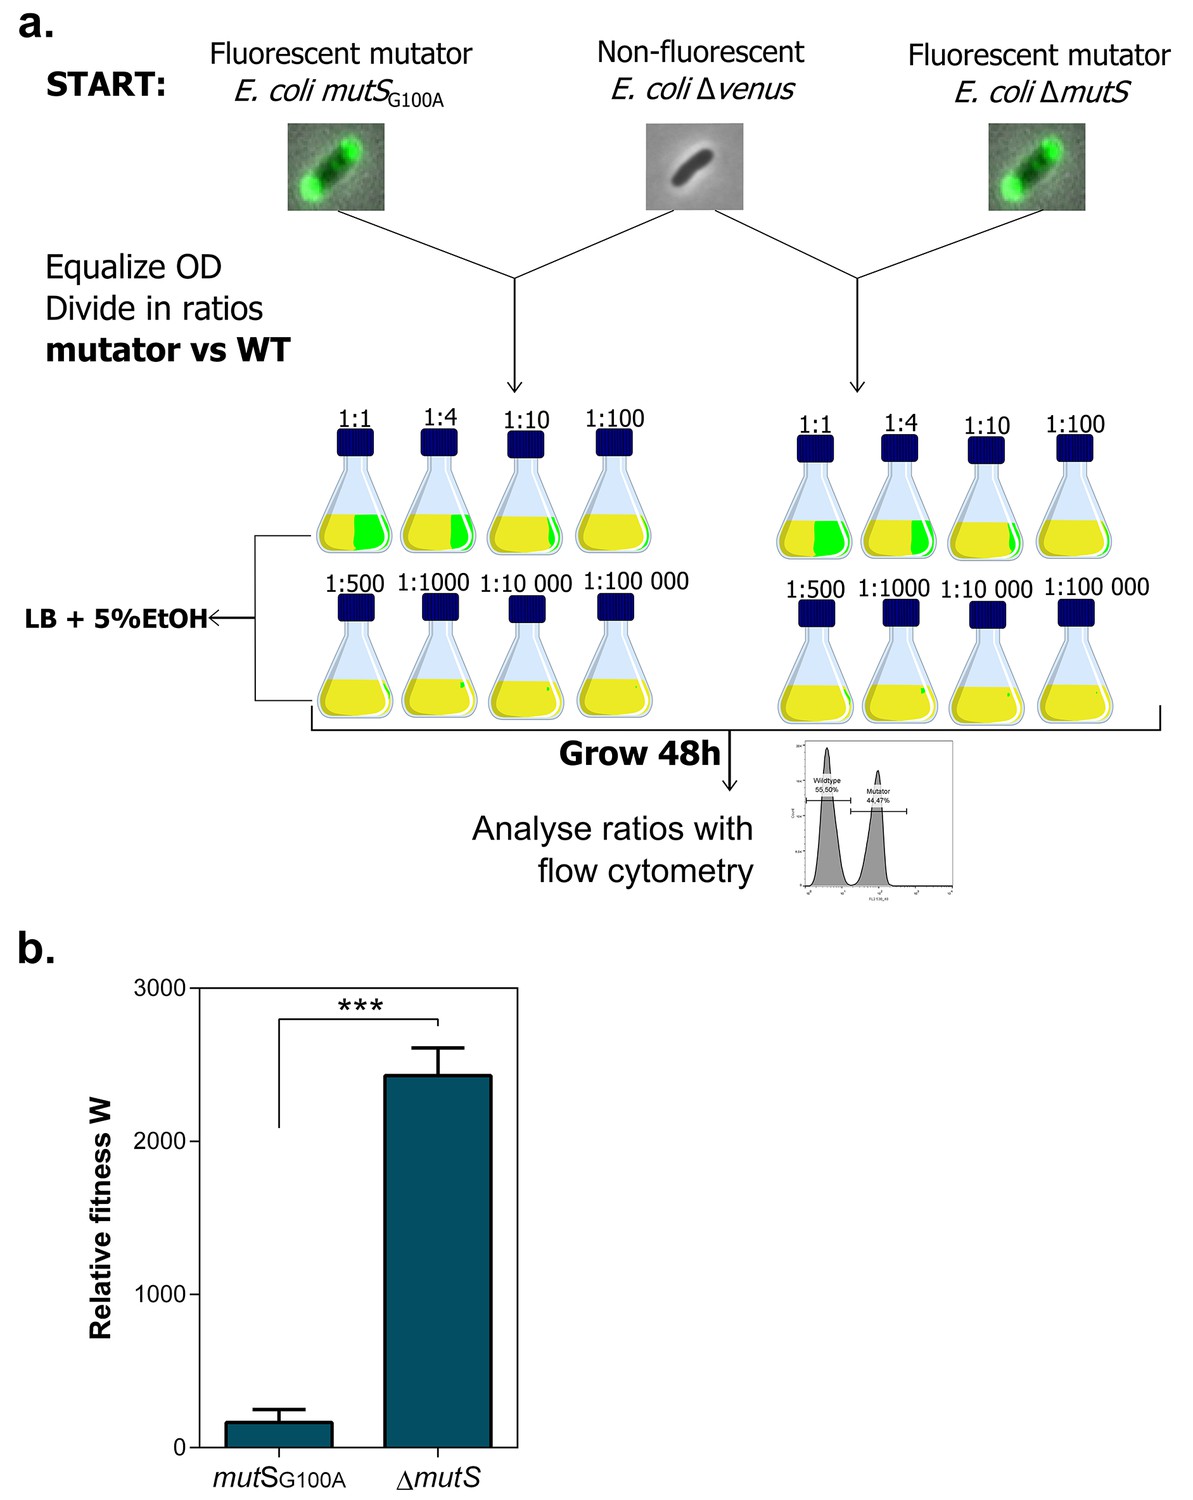
Setup mutS mutator competition experiment under 5% EtOH.
(a) Both fluorescent mutators and non-fluorescent wild type were directly competed against each other in the presence of 5% EtOH. The share of mutators in the entire population varied from 50% to 0.001%. Exact ratios were measured at the start of the competition experiment and after 48 hr of growth by flow cytometry. (b) The relative fitness under 5% EtOH is significantly lower for a mutSG100A mutant than for the ∆mutS mutant (two-sided Student’s t-test, n = 3, mean ± s.d., ***p<0.001). These results demonstrate that different mutation rate variants have different fitness advantages under near-lethal EtOH stress. Surprisingly, we did not observe knock-out mutations in mutS in any evolved line. A knock-out of mutS would possibly limit further fine-tuning of the mutation rate. Therefore, a lower-than-optimal, increased mutation rate would be favored to avoid an early, excessive increase in genetic load and to avoid reaching the boundaries to further increase the mutation rate if necessary. Although this hypothesis is difficult to confirm, it is supported by the fact that the evolved lines with the highest mutation rate (E1 and E12) only evolved to 7% EtOH tolerance, while strains with a less increased mutation rate were able to evolve to 8% EtOH tolerance and higher (Figure 3).
Figure 5 with 1 supplement
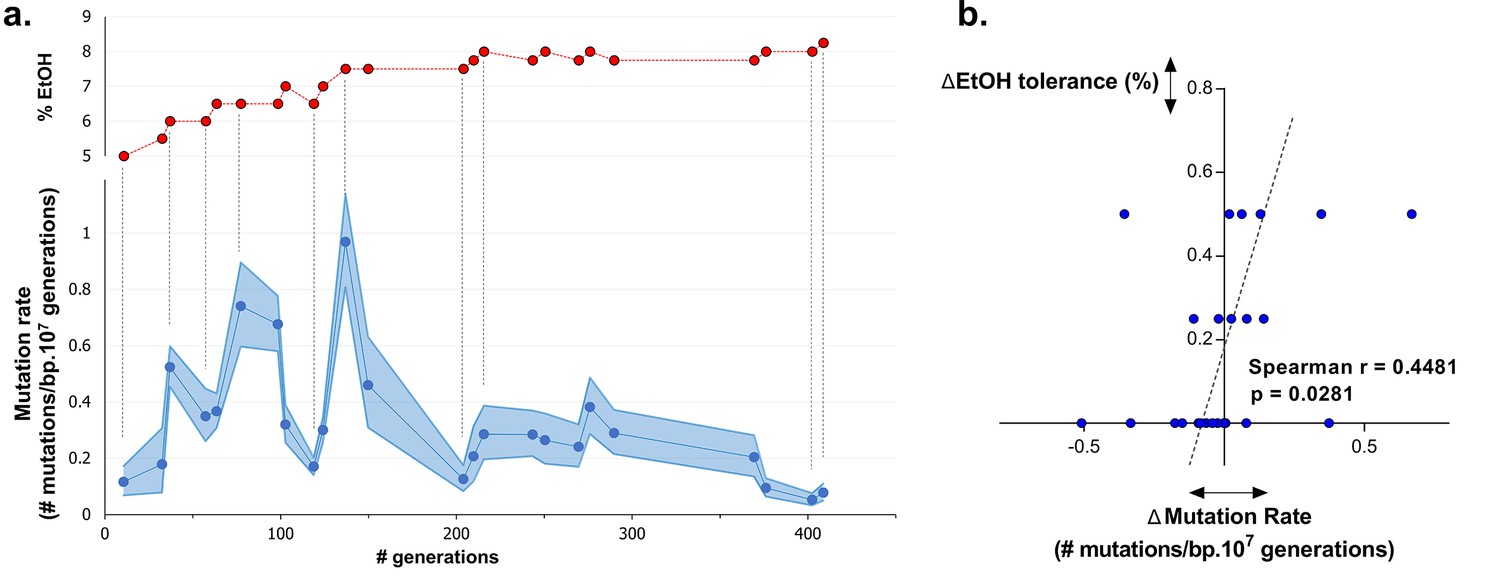
Dynamics in population mutation rate underlie evolution to high EtOH tolerance.
(a) The genomic mutation rate in the absence of EtOH is shown for selected intermediate time points of line E5 ( ) (mean ± 95% c.i. (blue shading), see Materials and methods). In the top graph, the EtOH tolerance associated with each time point is shown (
 ) and corresponding points in both graphs are connected by dashed lines. Increases in EtOH tolerance co-occur with increases in mutation rate, suggesting the hitchhiking of a mutator mutation with adaptive mutations conferring higher EtOH tolerance. During periods of constant EtOH exposure, mutation rates decline, suggesting that once a strain is adapted to a certain percentage of EtOH, high mutation rates become deleterious and selection acts to decrease the mutation rate. (b) The difference in mutation rate at consecutive time points and the difference in EtOH tolerance correlate positively (Spearman rank coefficient = 0.4481, p<0.05). The dashed line represents the linear regression through the data points.
Figure 5—figure supplement 1
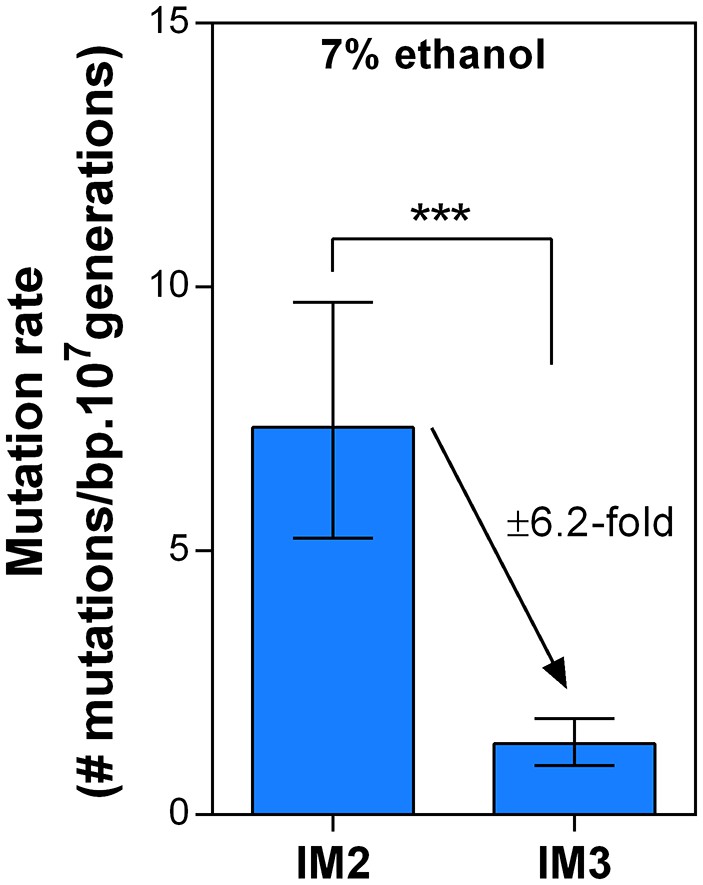
Dynamics in mutation rate during evolution are not affected by ethanol itself.
We measured the mutation rate of 2 selected intermediate points of line E5 (Figure 6) in the presence of 7% ethanol to determine the effect of ethanol itself on the dynamics of the genomic mutation rate observed in the absence of ethanol. As these are harsh stress conditions the final cell density in the fluctuation assays was about two orders of magnitude lower than the final cell density in the fluctuation assays in the absence of ethanol. Therefore, absolute mutation rates in presence and absence of ethanol could not be compared, so we cannot make a statement about the absolute effect of ethanol on the mutation rate. However, the relative fold-change decrease in mutation rate between IM2 and IM3 was unaffected in the presence of ethanol compared to the ±seven fold change in the absence of ethanol. Therefore, these data strongly suggest that even though ethanol might affect the absolute mutation rate, it likely does not change the dynamics caused by differences in the genomic mutation rate.
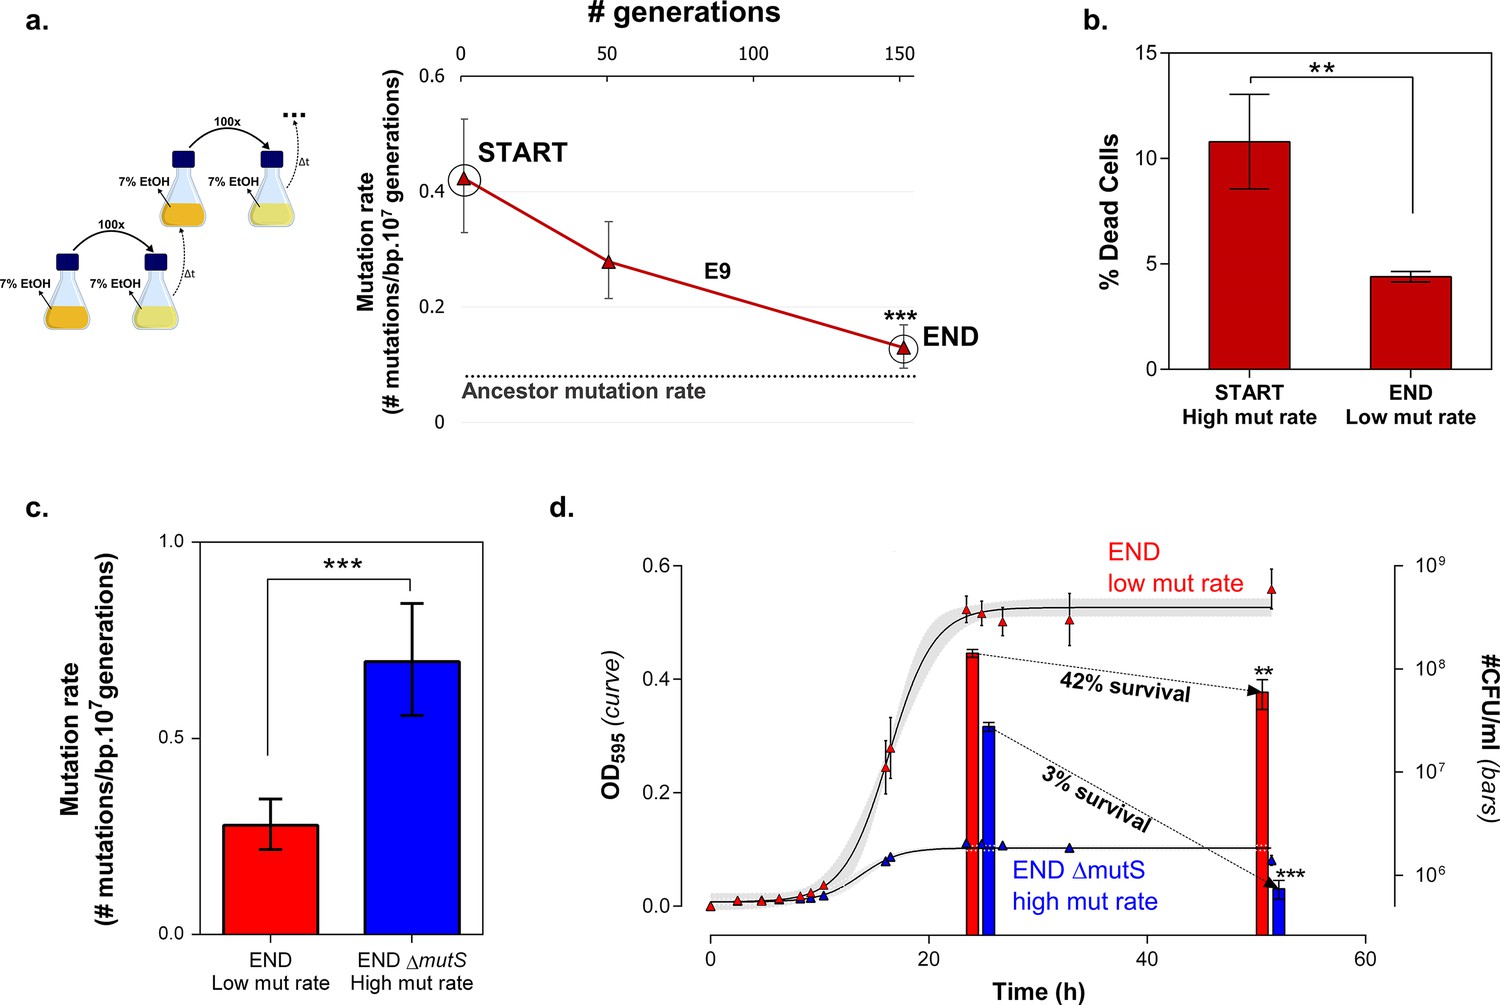
Figure 6 with 3 supplements
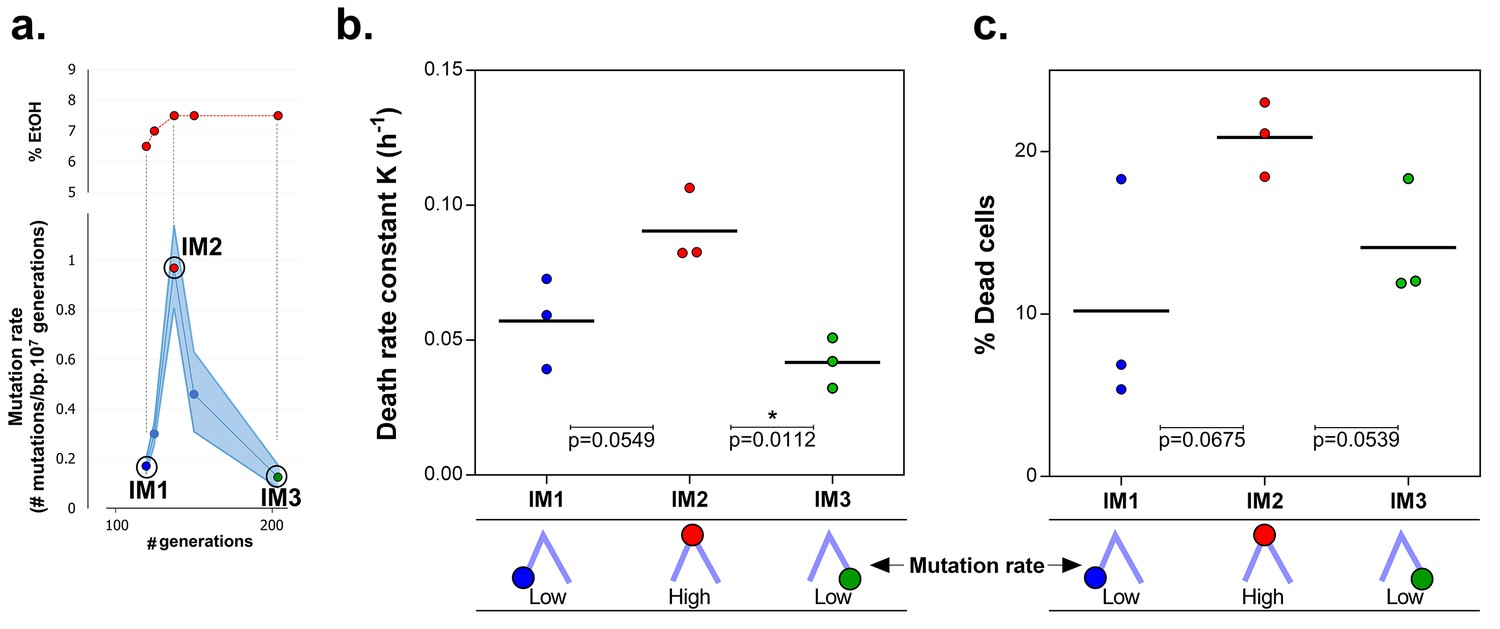
Mortality is the cost of hypermutation in evolved strains when high EtOH tolerance is reached.
(a) The specified intermediate time points from high EtOH-tolerant line E5 were selected based on their different mutation rate (Figure 5). (b) The death rate constant for each intermediate point is shown (mean, n = 3, one-phase exponential decay fitting on the decrease in viable cell count, see Materials and methods, Figure 6—figure supplement 1). The death rate constants were statistically compared using a one-way ANOVA with post hoc Tukey correction (*p<0.05). (c) The percentage dead cells as determined by live-dead staining (see Materials and methods) is shown for each intermediate time point. The fractions of dead cells were statistically compared using a two-sided Student’s t-test (mean, n = 3, *p<0.05). An increase in mutation rate coincides with both an increase in death rate constant and an increase in fraction of dead cells in the population. A subsequent decrease in mutation rate coincides with a decrease in death rate constant and fraction of dead cells. These data suggest that higher mortality is the cost of hypermutation when adaptation to a certain level of EtOH stress is achieved.
Figure 6—figure supplement 1
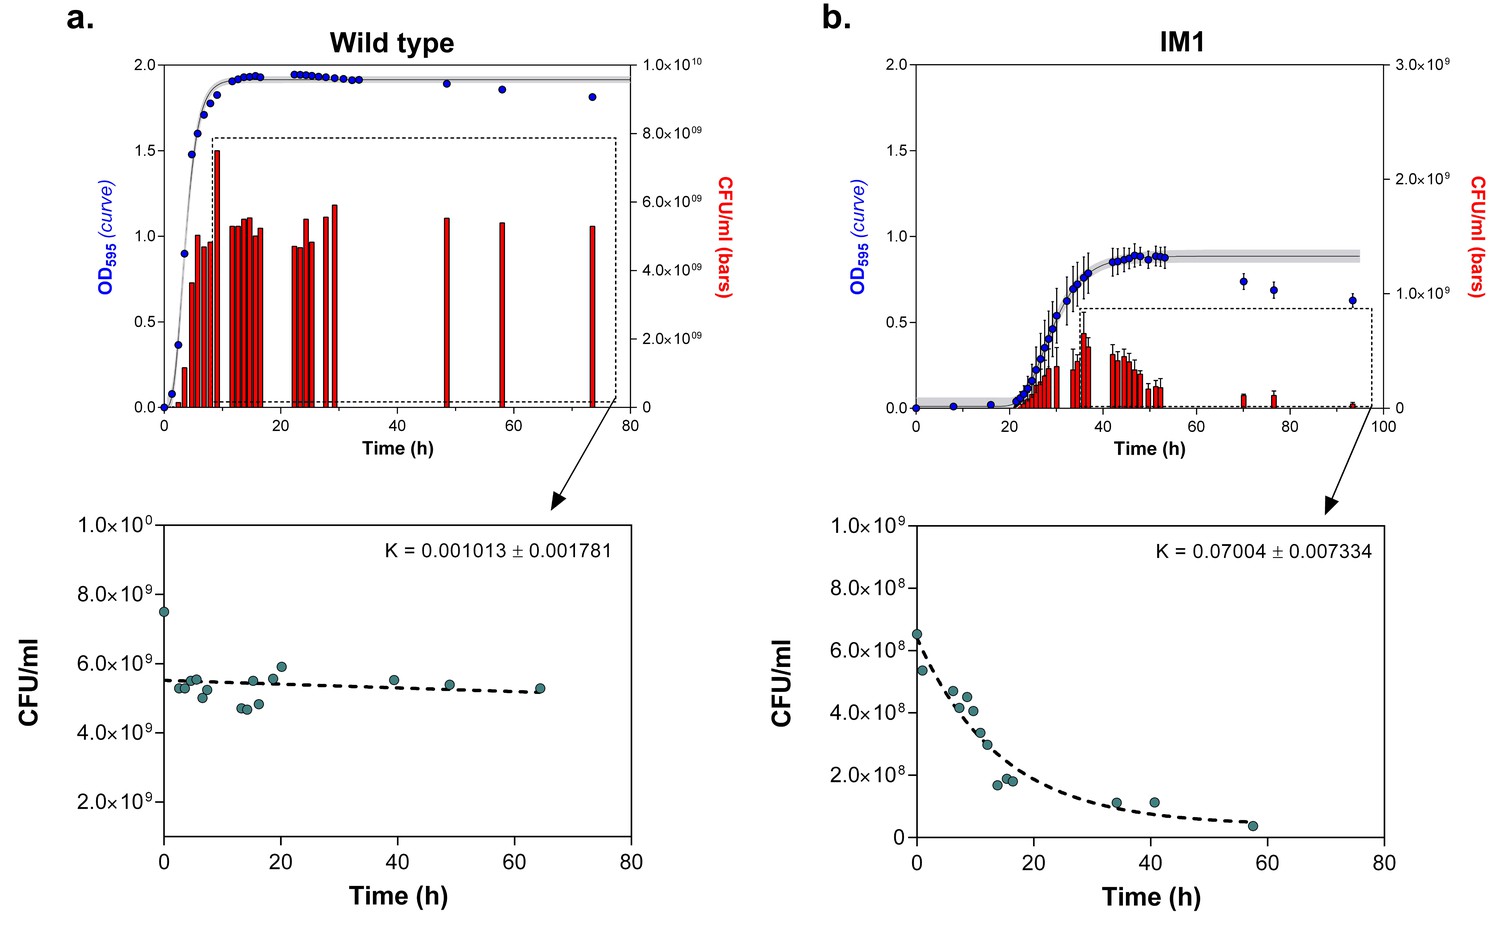
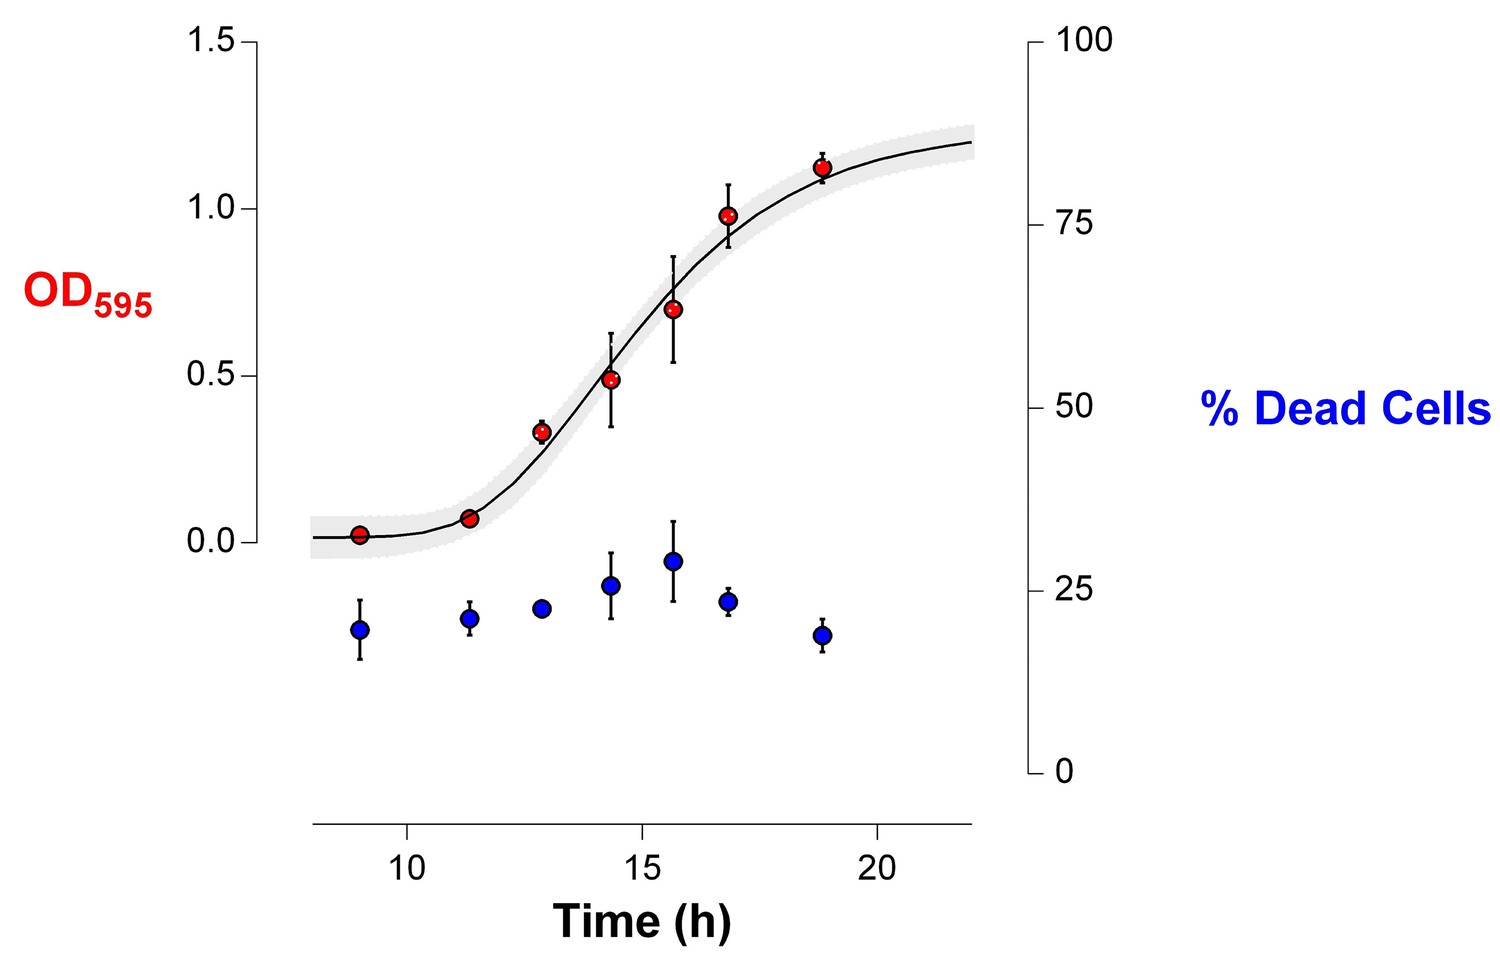
Number of viable cells decreases more rapidly in highly EtOH-tolerant strains than in the wild type.
(a) in the wild type, the number of viable cells only slightly decreases as the strain progresses in stationary phase (0% EtOH). (b) Contrastingly, the number of viable cells in the highly EtOH-tolerant line, IM1 (as well as in IM2 and 3, data not shown), shows a rapid decrease upon entering the stationary phase (5% EtOH), reflecting the high mortality inherent to this strain. Blue dots ( ) in the upper graphs represent the OD595 value (sigmoidal fit using Gompertz equation with 95% c.i. (grey shading), see Equation 1 in Materials and methods), while red bars (
 ) represent the number of viable cells at each time point (mean ± s.d., n = 3). Cyan dots (
 ) in the bottom graphs represent viable cell counts at selected time points used to fit the one-phase exponential decay function (dashed line) and determine the death rate constant K (see Materials and methods).
Figure 6—figure supplement 2
The death rate is constant during exponential-phase growth of IM1 (Figure 6).
The percentage of dead cells in the population during growth was determined using live-dead staining (see Materials and methods). This amount of dead cells remained constant during exponential growth (mean ± s.d., n = 3), indicating that the death rate is constant and specific for the analyzed strain.
Figure 6—figure supplement 3
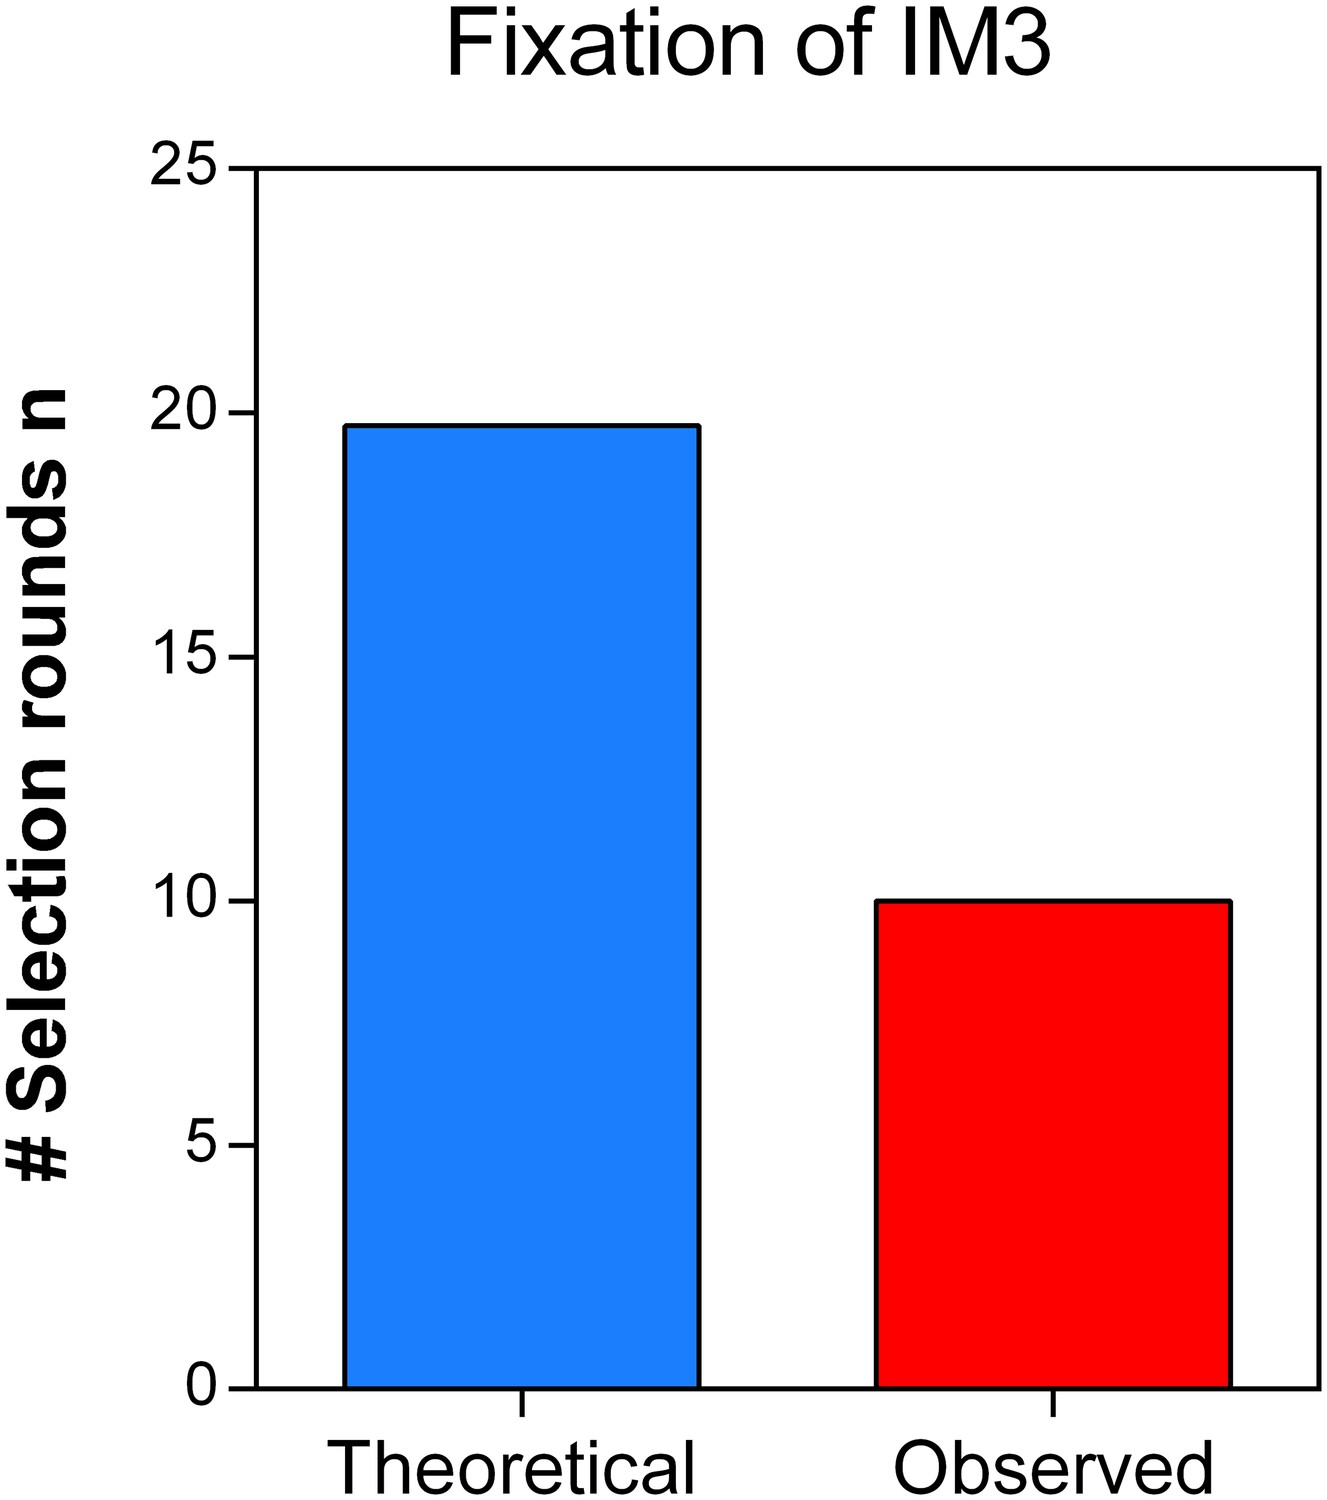
Direct effects of acquired mutations possibly cause the discrepancy between calculated and observed number of selection rounds necessary for fixation of IM3.
We determined the growth speed of IM2 and IM3 in the presence of 7.5% ethanol using data from the initial evolution experiment and viable cell counts obtained in the death rate experiments. By using the Gompertz growth model, we theoretically competed IM2 and IM3 against each other. This allowed to calculate a relative fitness of 3.61 of strain IM3 with a lower mutation rate compared to IM2 with a higher mutation rate. Next, we solved Equation 2 (Materials and methods) for the number of selection rounds n and used it to calculate the time it would theoretically take for IM3 to fix in the population. As shown here, the calculated n exceeds the true observed n, suggesting direct effects of accumulated mutations during evolution from IM2 to IM3. Therefore, the calculated relative fitness cannot be directly linked to the decrease in mutation rate or mortality.
Figure 7 with 2 supplements
Mortality is the cost of hypermutation when adaptation to a certain EtOH stress level is achieved.
(a) A selected intermediate point of evolved highly EtOH-tolerant line E9 with an increased mutation rate was evolved during approximately 150 generations on the same percentage of 7% EtOH. After 150 generations the genomic mutation rate, measured in the absence of ethanol, significantly decreased to almost the ancestral mutation rate (mean ± 95% c.i., ***p<0.001, see Materials and methods). (b) Measuring the percentage of dead cells revealed a higher death rate in the START point with high mutation rate compared to the END point with a lower mutation rate (two-sided Student’s t-test, mean ± s.d., n = 3, **p<0.01). (c) To confirm the role of mortality as modulator of cellular mutation rate, the mutS gene was deleted in the END point with a low mutation rate. This deletion caused a significant increase in mutation rate (mean ± 95% c.i., ***p<0.001, see Materials and methods). However, the increase in mutation rate is less pronounced as for the mutS deletion mutant in the clean wild-type background, suggesting the presence of mutations that not only compensate for the original mutator mutation in E9 but also for a deletion of mutS. (d) The number of viable cells decreases significantly for both low and high mutation rate variants during growth on 7% EtOH, although this decrease in the strain with a low mutation rate is less compared to the strain with a high mutation rate (two-sided Student’s t-test, mean ± s.d., n = 3, **p<0.01, ***p<0.001). These results show a lower mortality for a strain with a lower mutation rate, resulting in a competitive advantage in an EtOH environment to which the strain is already adapted.
Figure 7—figure supplement 1

In direct competition under 7% EtOH the strain with a low mutation rate outcompetes the hypermutating strain.
(a) To determine the cost for a high mutation rate if a strain is adapted to a certain level of EtOH, we competed both END (low mutation rate) and END ∆mutS (high mutation rate) under 7% EtOH, the percentage to which they were adapted. Already after two days of growth, a fast decrease in END ∆mutS was observed, showing the cost of hypermutation (mean ± s.e.m., n = 3). (b) The relative fitness after 2 days was calculated showing a significantly increased fitness for the END strain with a low mutation rate compared to the END ∆mutS strain with a high mutation rate. Significance of the difference from 1, where the strain has no direct fitness advantage or disadvantage, was calculated using a one-tailed Student’s t-test (mean ± s.d., n = 3, *p<0.05, ***p<0.001).
Figure 7—figure supplement 2
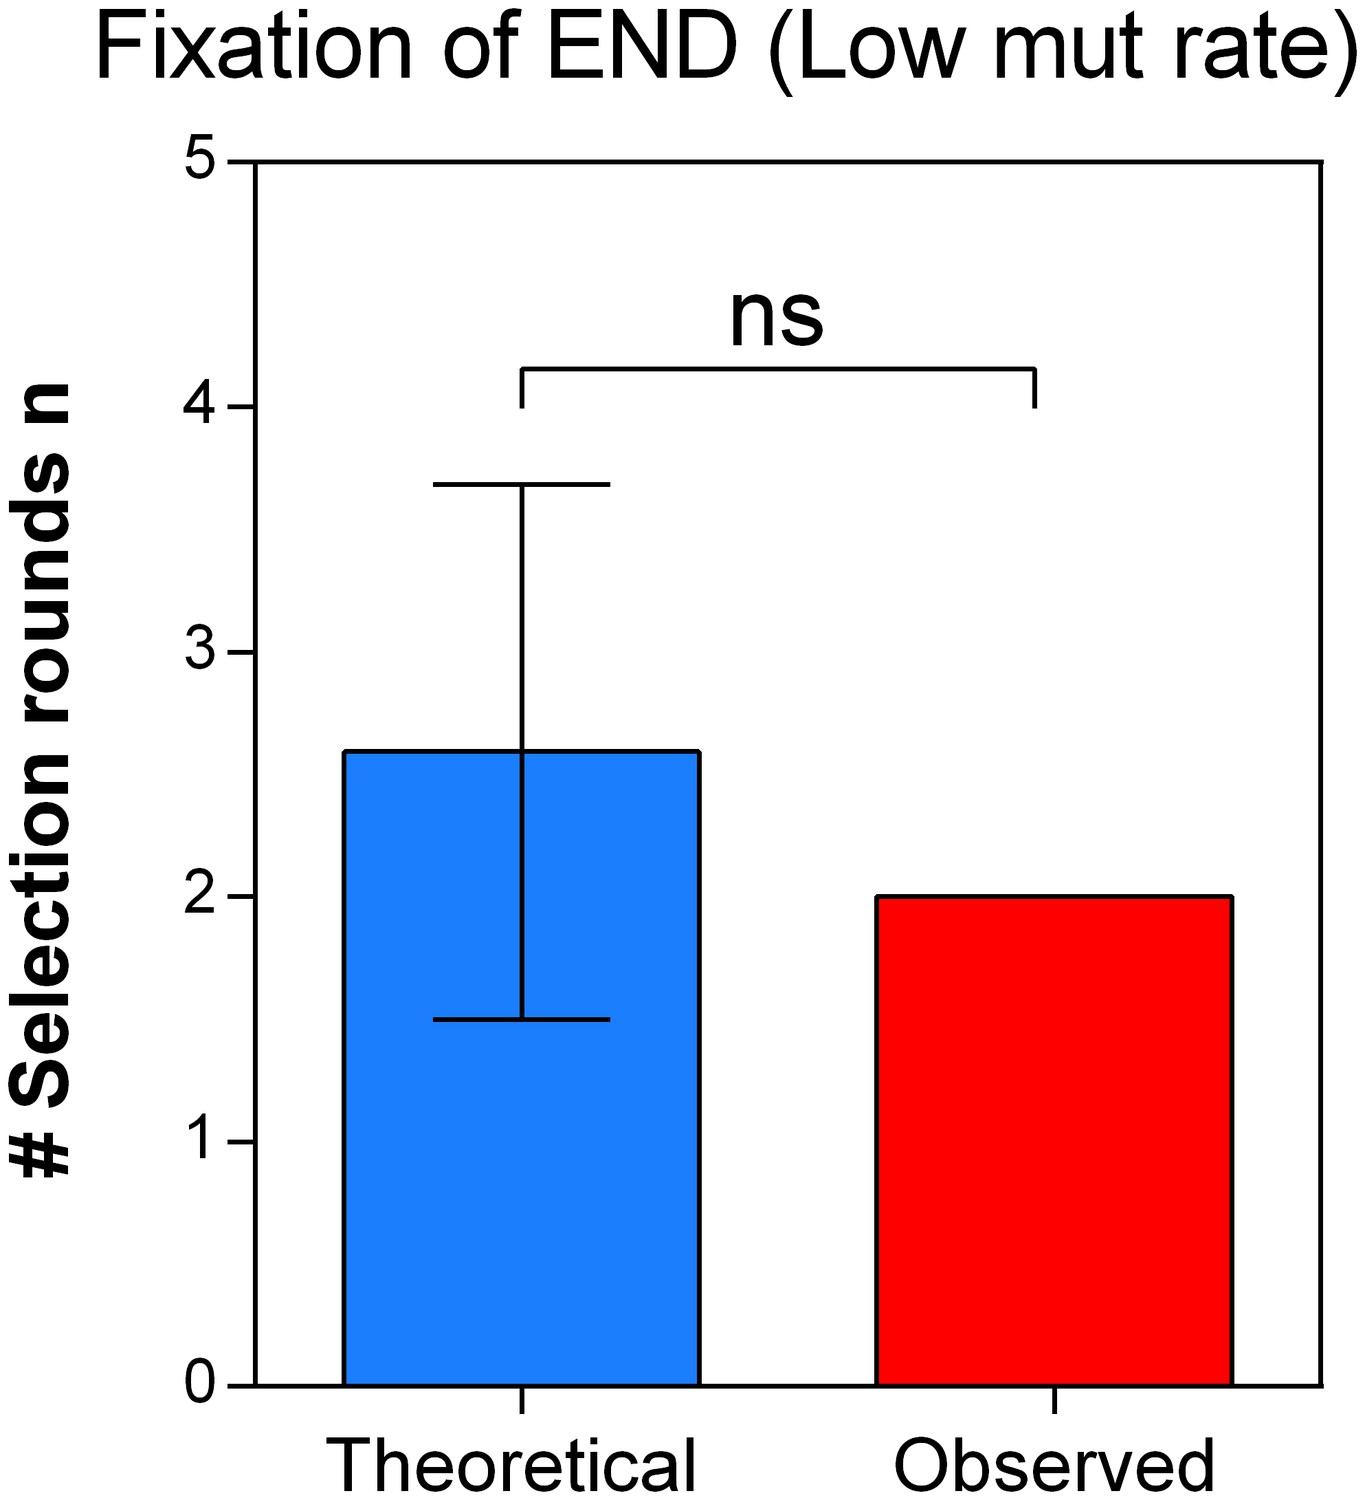
The theoretical number of selection rounds needed for END ΔmutS to fix corresponds to the actual observed number of selection rounds.
Strains END and END ΔmutS are isogenic apart from the mutS allele that leads to an increased mutation rate and increased mortality. Using the relative fitness derived from the competition experiment (Figure 7—figure supplement 1) we calculated the theoretical number of selection rounds necessary for END to outcompete END ΔmutS. Here, the theoretical n did not differ significantly from the actual n, showing that the fitness value directly reflects the effect of the mutation rate on the competitive advantage of END (low mutation rate-low mortality) over END ΔmutS (high mutation rate-high mortality). A two-sided Student’s t-test was used for statistical comparison (n = 3; ns = not significant).
Author response image 1
Author response image 2
Author response image 3
Additional files
-
Supplementary file 1
Addtional tables with primer sequences and selected mutator genes.
- https://doi.org/10.7554/eLife.22939.024
Download links
A two-part list of links to download the article, or parts of the article, in various formats.
Downloads (link to download the article as PDF)
Open citations (links to open the citations from this article in various online reference manager services)
Cite this article (links to download the citations from this article in formats compatible with various reference manager tools)
Adaptive tuning of mutation rates allows fast response to lethal stress in Escherichia coli
eLife 6:e22939.
https://doi.org/10.7554/eLife.22939


