Hippocampal activation is associated with longitudinal amyloid accumulation and cognitive decline
- University of California, United States
- Lawrence Berkeley National Laboratory, United States
Figures
Figure 1
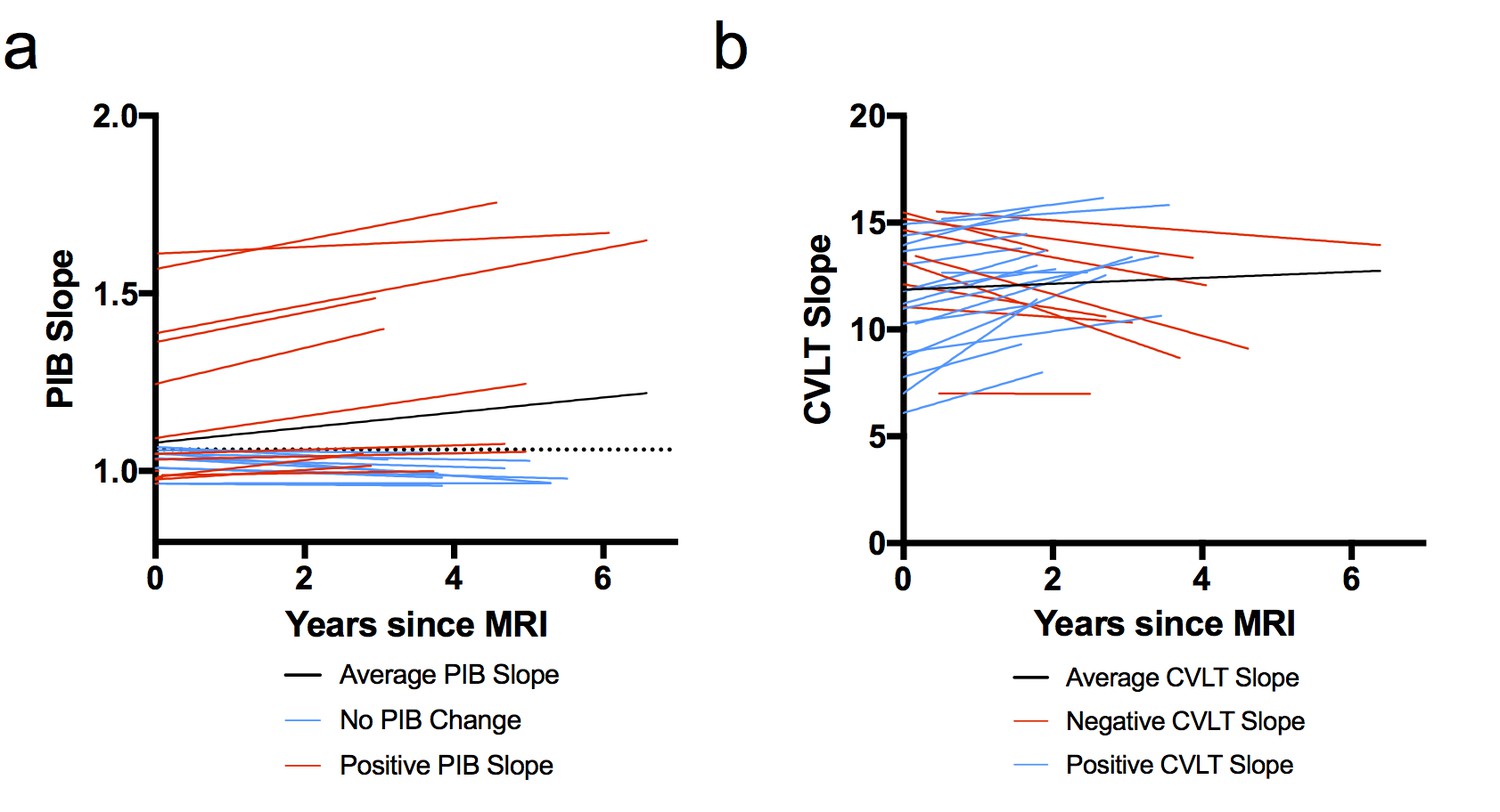
Model-derived individual slopes for amyloid and memory change over time.
(A) [11C] Pittsburgh Compound-B distribution volume ratio slope (PIB slope) for each participant over time, relative to baseline MRI (x = 0), where black line indicates average PIB slope, blue lines indicate little/no change in PIB, and red lines indicate positive PIB slope. The horizontal dotted line indicates the criterion for a positive PIB scan (1.06), (B) California Verbal Learning Test Long-Delay Free Recall slope (CVLT slope) for each participant over time, relative to baseline MRI (x = 0), where black line indicates average CVLT slope, red lines indicate negative CVLT slope, and blue lines indicate positive CVLT slope. All slopes were obtained from the linear mixed model. The following source data (Figure 1—source data 1) is relevant for Figures 1–4.
-
Figure 1—source data 1
- https://doi.org/10.7554/eLife.22978.005
Figure 2
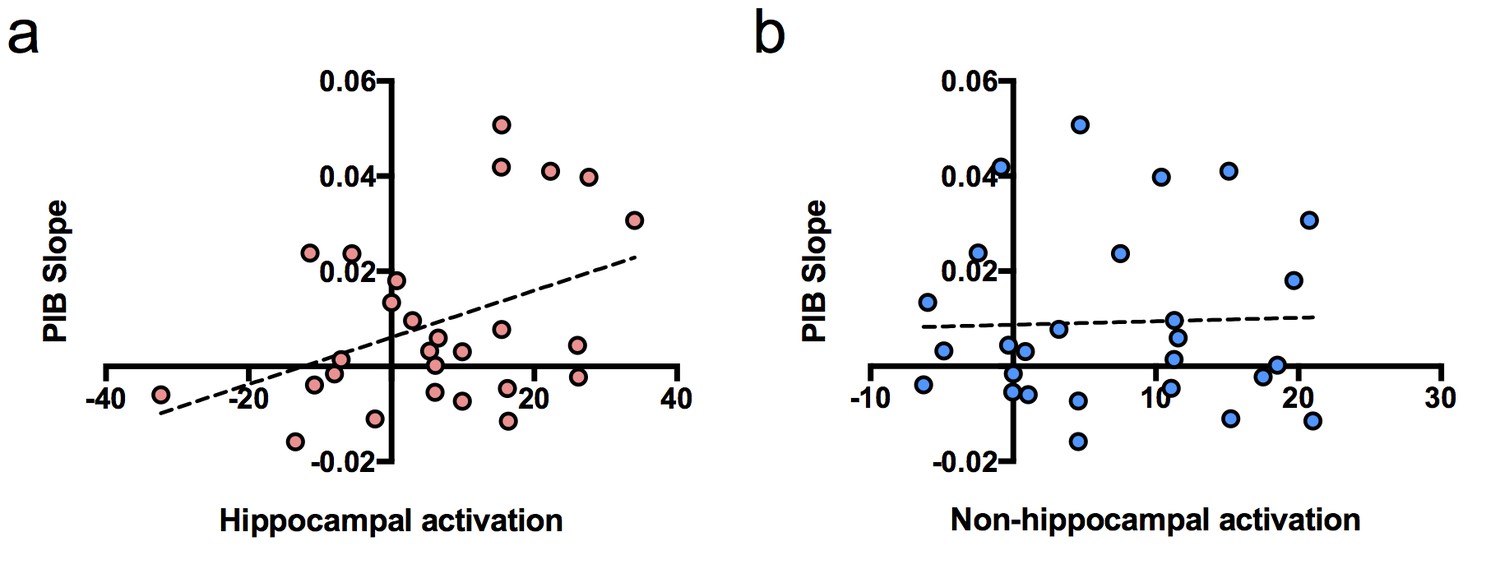
Relationship between brain activation at baseline and longitudinal amyloid accumulation.
(a) Positive relationship between hippocampal activation (contrast values for subsequent hits versus misses) at baseline and [11C] Pittsburgh Compound-B distribution volume ratio (DVR) slopes (PIB slope measured as PIB DVR values over time) obtained from the linear mixed model, (b) No relationship between non-hippocampal activation (contrast values for subsequent hits versus misses in inferior frontal cortex and occipital cortex) at baseline and [11C] Pittsburgh Compound-B distribution volume ratio (DVR) slopes (PIB slope measured as PIB DVR values over time) obtained from the linear mixed model.
Figure 3

Relationship between longitudinal amyloid accumulation and memory decline.
Negative relationship between [11C] Pittsburgh Compound-B distribution volume ratio slopes (PIB slope) and California Verbal Learning Test Long-Delay Free Recall slope (CVLT slope measured as CVLT scores over time) obtained from the linear mixed model.
Figure 4

Mediation analysis between hippocampal activation, longitudinal amyloid accumulation, and memory decline.
Mediation analysis with hippocampal activation at baseline (predictor, X), mediated by [11C] Pittsburgh Compound-B distribution volume ratio slopes (PIB Slope) (mediator, M), predicting California Verbal Learning Test Long-Delay Free Recall slope (CVLT Slope). Hippocampal activation positively predicted PIB Slope, PIB Slope negatively predicted CVLT Slope, which resulted in a significant mediation (see text for more details).
Tables
Table 1
Participant demographics (N = 27).
| Variable | Mean | Range |
|---|---|---|
Age (at MRI) (SD) | 76.5 (5.6) | 67–91 |
Sex (M: F) | 8: 19 | |
Education, years (SD) | 17.4 (1.8) | 14–20 |
ApoE4 carriers, n (%) | 8 (30) | |
Time since MRI (PIB), years (SD) | 3.4 (2.1) | 2.8–6 |
Time since MRI (CVLT), years (SD) | 2.7 (1.1) | 1.5–6.1 |
Two PIB scans, n | 19 | |
Three PIB scans, n | 8 |
-
Key: MRI = Magnetic resonance imaging, SD = Standard deviation, PIB = Pittsburgh Compound B, CVLT = California Verbal Learning Test.
Table 2
Linear mixed model results for hippocampal activation predicting longitudinal amyloid accumulation.
Parameter | Estimate (SE) | df | t | p |
|---|---|---|---|---|
Intercept | 1.00 (0.07) | 22 | 14.58 | <0.001 |
Age (at MRI, mc) | −0.001 (0.01) | 22 | −0.14 | 0.887 |
Sex (F) | 0.10 (0.08) | 22 | 1.27 | 0.216 |
Education (years, mc) | −0.02 (0.02) | 22 | −0.89 | 0.385 |
Hippocampal activation (baseline) | 0.004 (0.002) | 22 | 1.64 | 0.115 |
Time (PIB DVR) | 0.003 (0.003) | 12 | 0.87 | 0.399 |
Hippocampal activation * Time (PIB DVR) | 0.001 (0.0002) | 12 | 3.58 | 0.004 |
-
Dependent Variable: PIB DVR.
-
Key: SE = Standard Error, mc = mean-centered, PIB DVR= Pittsburgh Compound B Distributed Volume Ratio.
Table 3
Linear mixed model results for longitudinal amyloid accumulation predicting memory decline.
| Parameter | Estimate (SE) | df | t | p |
|---|---|---|---|---|
Intercept | 10.07 (0.89) | 18 | 11.27 | <0.001 |
Age (at MRI, mc) | −0.06 (0.09) | 16 | −0.69 | 0.499 |
Sex (F) | 2.54 (1.10) | 16 | 2.31 | 0.034 |
Education (years, mc) | −0.17 (0.28) | 17 | 0.59 | 0.562 |
Slope (PIB DVR) | 15.6 (28.32) | 21 | 0.55 | 0.587 |
Time (CVLT LD FR) | 0.41 (0.17) | 23 | 2.44 | 0.023 |
Slope (PIB DVR) * Time (CVLT LD FR) | −20.06 (8.26) | 25 | −2.43 | 0.023 |
-
Dependent Variable: CVLT LD FR.
-
Key: SE = Standard Error, mc = mean-centered, PIB DVR= Pittsburgh Compound B Distributed Volume Ratio, CVLT LD FR = California Verbal Learning Test - Long Delay Free Recall.
Download links
A two-part list of links to download the article, or parts of the article, in various formats.
Downloads (link to download the article as PDF)
Open citations (links to open the citations from this article in various online reference manager services)
Cite this article (links to download the citations from this article in formats compatible with various reference manager tools)
Hippocampal activation is associated with longitudinal amyloid accumulation and cognitive decline
eLife 6:e22978.
https://doi.org/10.7554/eLife.22978


