Spatiotemporal correlation of spinal network dynamics underlying spasms in chronic spinalized mice
- Karolinska Institutet, Sweden
Figures
Figure 1 with 1 supplement

Occurrence of spasms in a mouse model of spinal cord injury affecting just tail muscles.
(A) Resting position in acutely (upper picture) or chronically S2-transected (lower picture) mice. (B) Tail position in S2-transected mouse before (left) and during (right) the occurrence of a spontaneous spasm (see also Video 2). (C) Positions of the recording electrodes for EMGs along the tail. (D) Gross EMG recordings in three different segments of the tail (Co8, Co11 and Co14) in a chronically S2-transected mouse during a spasm. A period of no or little EMG activity (grey box) preceded the prolonged activation of motor units observed in different segments of the tail (‘on episode’, expanded in green box). The activity propagated in a proximal distal direction before it spontaneously terminates (‘off episode’ expanded in violet box). (E) Number of muscle spasms in S2-transected animals two months after transection (N = 5). (F) Frequency distribution histograms of time delay (s) between activation of rostral and caudal motor units (n = 46). (G) Four phenotypic firing profiles of motor units – long lasting, bimodal, high frequency, and low frequency – triggered during spontaneous spasms. Raw recordings and instantaneous firing frequencies. (GI) Respective frequency distribution histograms of the firing frequencies for motor units in G.
-
Figure 1—source data 1
Related to Figure 1.
- https://doi.org/10.7554/eLife.23011.003
-
Figure 1—source data 2
Related to Figure 1.
- https://doi.org/10.7554/eLife.23011.004
Figure 1—figure supplement 1
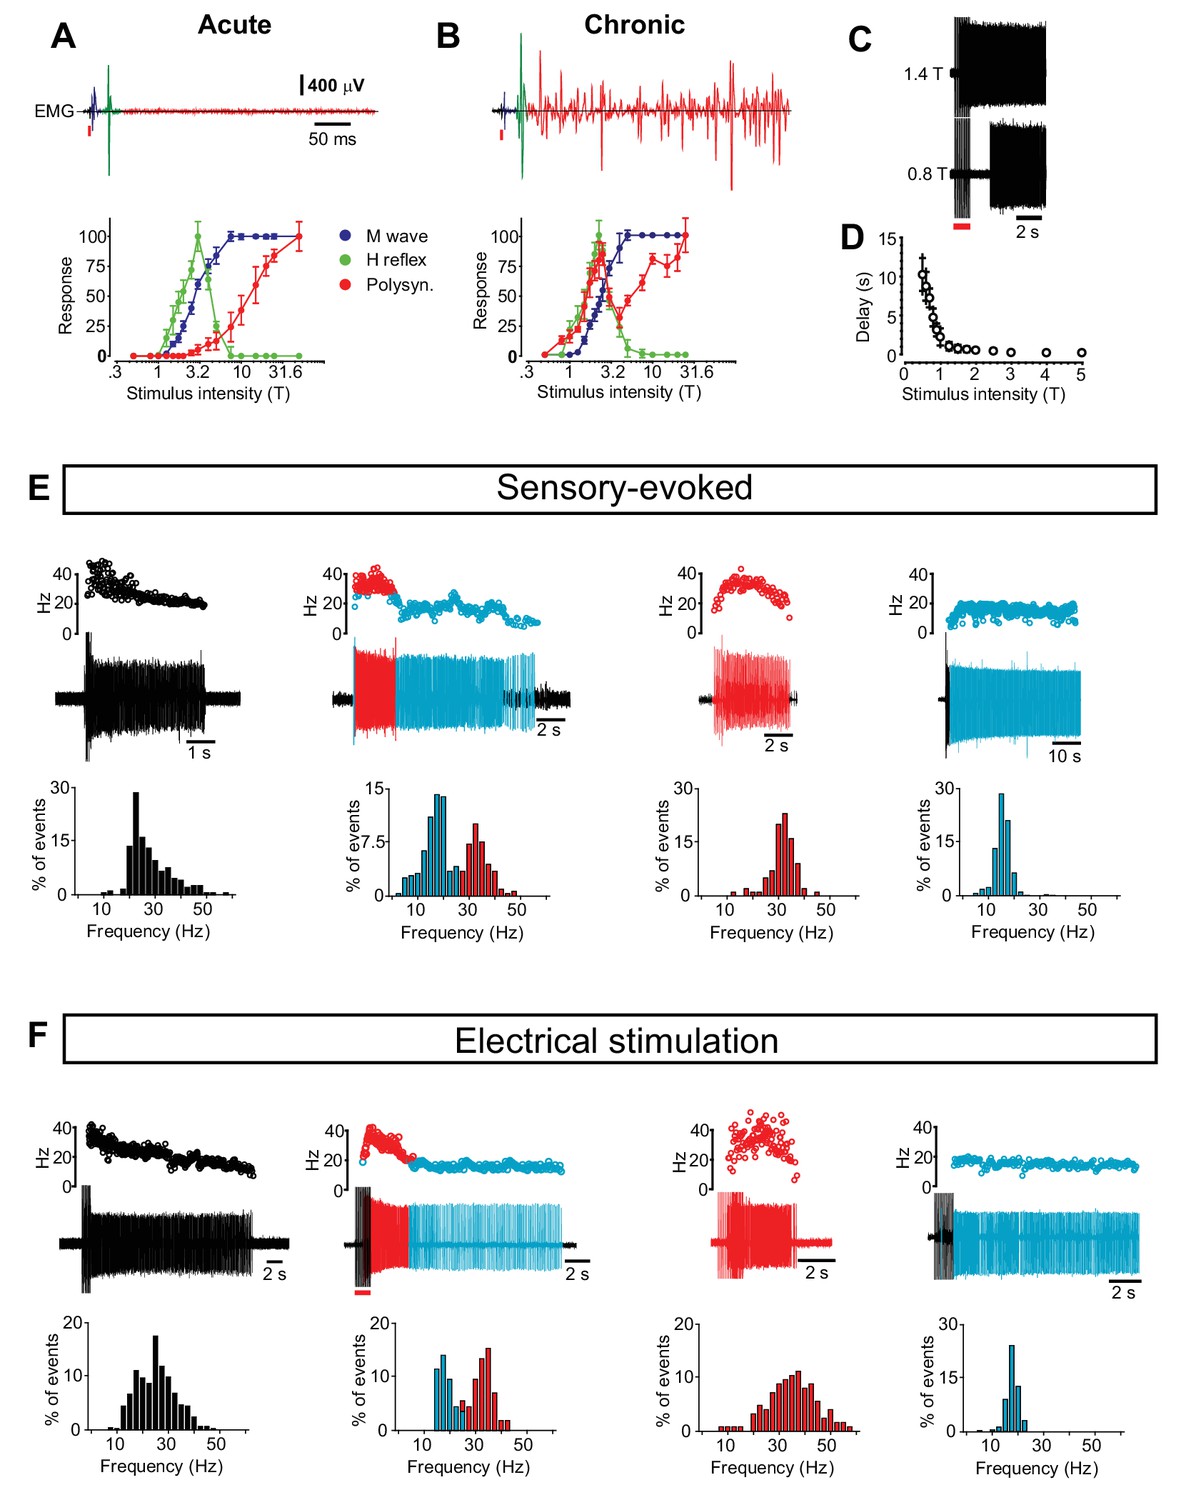
Motor neuron and interneuron hyper-excitability after chronic spinal cord transection assessed by reflex responses and prolonged firing.
(A–B) Motor neuron excitability evaluated by recording the monosynaptically evoked H-reflex in the tail muscles (upper panels, green) in response to a single electrical pulse of the tail nerve in acutely (A) and chronically spinal cord transected (B) mice. The relationship between the stimulus strength and the amplitude of the H-reflex is plotted in the two panels below (mean ± S.D). The threshold for the H-reflex (T) was estimated as the lowest stimulus strength necessary to elicit the monosynaptic response. All other stimulus strengths are expressed as multiples of this strength. In both acutely (N = 7) and chronically spinal cord transected mice (N = 10) the H-reflex (green trace) had a lower threshold than the M-wave (blue trace) caused by the direct antidromic activation of muscles. As the stimulus strength increased the H-reflex was smaller in both cases similar to what has been reported in H-reflex studies. Notably, in chronically spinal cord transected mice the rise of the H-reflex was steeper (slope of straight line to fit the rising part, chronically transected = 66.25 versus acutely transected = 47.93, Spearman r test, p<0.0001) suggesting that motor neurons were hyper-excitable. Moreover, in chronically spinal cord transected mice the polysynaptic responses (red traces) were shifted to much lower stimulus thresholds in chronically spinal cord transected than in acutely spinal cord transected mice (paired T-test, p<0.05), indicating hyper-excitability in interneuron circuits. (C–D) The relationship between stimulus strength and time to onset of prolonged firing in chronically spinal cord transected mice (N = 5). (E–F) Four phenotypic firing patterns during sensory-evoked spasm (E) and electrical stimulus-evoked spasm (F) with the respective frequency distribution of the firing frequency below (compare with data in Figure 1).
-
Figure 1—figure supplement 1—source data 1
Related to Figure 1—figure supplement 1.
- https://doi.org/10.7554/eLife.23011.006
-
Figure 1—figure supplement 1—source data 2
Related to Figure 1—figure supplement 1.
- https://doi.org/10.7554/eLife.23011.007
-
Figure 1—figure supplement 1—source data 3
Related to Figure 1—figure supplement 1.
- https://doi.org/10.7554/eLife.23011.008
Figure 2 with 2 supplements
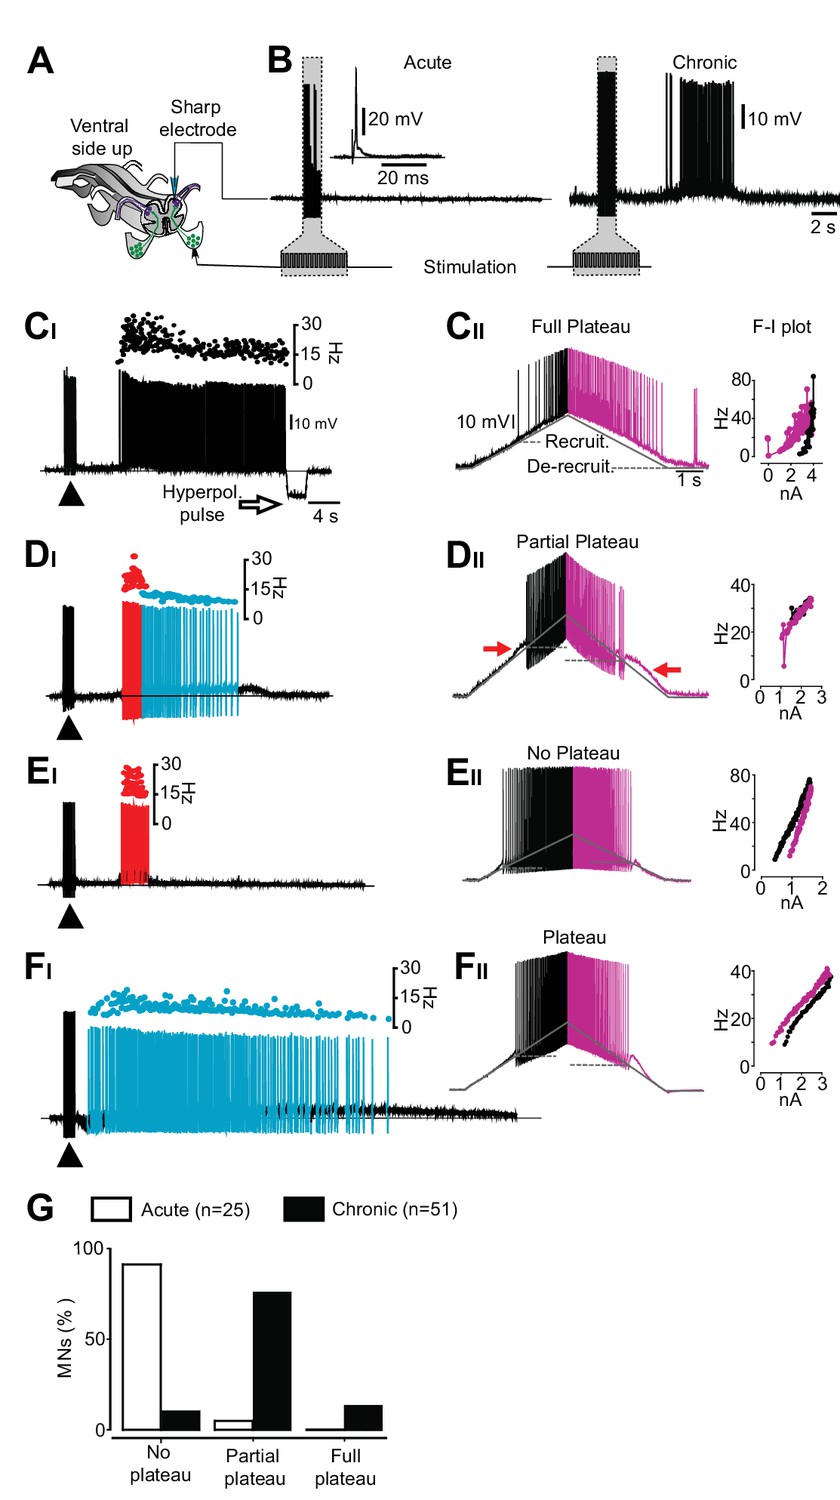
An exclusive relationship between firing pattern and expression of plateau properties in motor neurons after chronic spinal cord transection.
(A) Schematic of the isolated spinal cord with configuration of electrodes placed on dorsal and ventral roots and intracellular recording of motor neuron. (B) Examples of motor neuron activity in response to dorsal root stimulation in acutely (left trace) and chronically spinal cord transected mice (right trace). The grey box indicates the stimulation. (C–F) Expression of plateau properties as assessed by current ramps. Motor neurons with long-lasting firing after dorsal root stimulation (CI) exhibited strong plateau properties with typical counter-clockwise hysteresis in the f-I plot (CII). Motor neurons with bimodal firing patterns (Hartigan dip. test <0.05, DI) expressed partial plateau properties with linear f-I plot and activation and de-activation of the short-lasting plateau below the threshold for the action potentials (DII, red arrows). Motor neurons with high frequency firing (EI) exhibited linear f-I plot or clockwise hysteresis in the f-I plot indicative of no plateau potentials (EII). Motor neurons with slow firing (FI) may exhibit strong plateau properties and counter-clockwise hysteresis in the F-I plot (FII). (G) Summary of the expression of plateau properties in motor neurons in spinal cords from acutely and chronically spinal cord transected mice.
-
Figure 2—source data 1
Related to Figure 2.
- https://doi.org/10.7554/eLife.23011.012
Figure 2—figure supplement 1
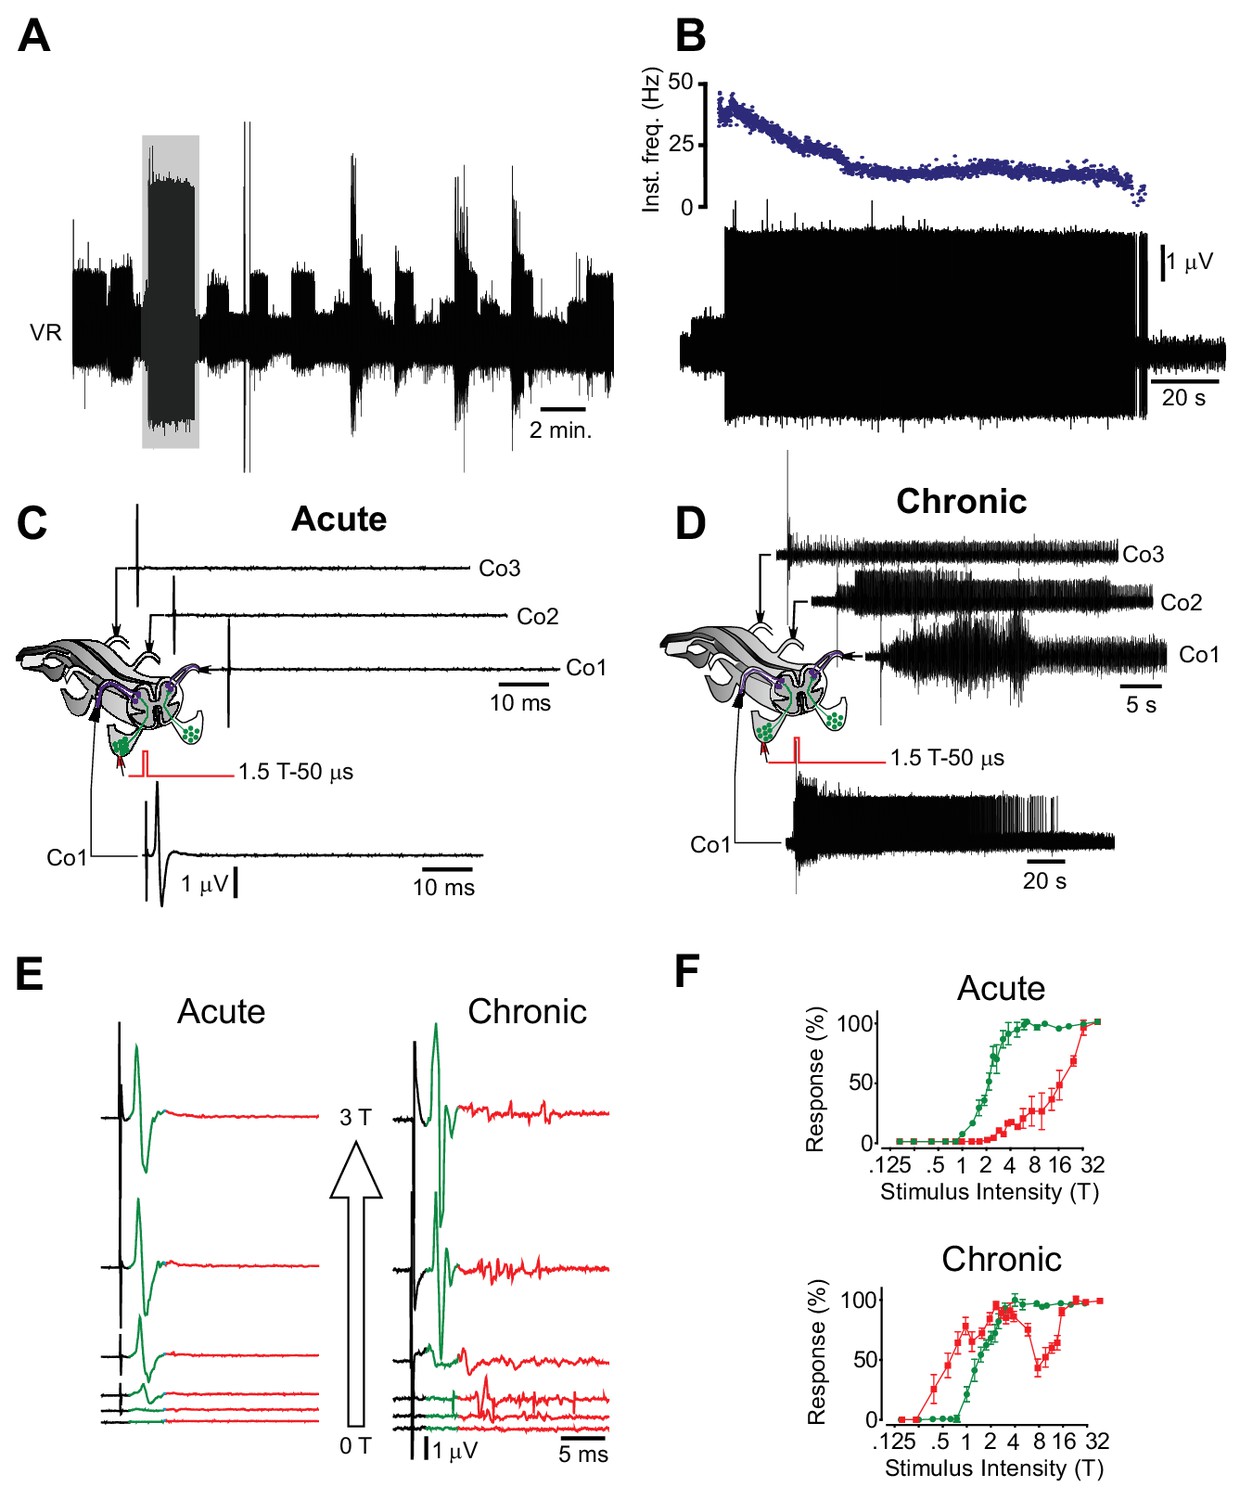
Motor neuron and interneuron hyper-excitability after chronic spinal cord transection assessed in vitro.
(A) Spontaneous prolonged motor activity recorded from the ventral root (VR) in isolated spinal cord from a chronically spinal cord transected mouse eight weeks after transection.( B) Expanded trace from A (gray area) showing the prolonged firing of a single motor unit. (C–D) Low threshold stimulation of the dorsal root (1.5 T, 50 µs) at the level of the coccygeal segment 1 (Co1) in isolated spinal cords from acutely (C) and chronically spinal cord transected (D) mice with simultaneous ventral root recordings of the homologues root as well as contralateral coccygeal ventral roots (Co1-Co3). Stimulation in acutely spinal cord transected animals evoked a monosynaptic response in the homologous ventral root with no activity in other ventral roots (N = 10). Note that the short-lasting ‘spikes’ are stimulus artifacts. A corresponding stimulation in chronically spinal cord transected mice elicited a sustained activity in the homologous ventral root as well as in contralateral ventral roots (N = 10). (E–F) Ventral root recordings showing the inverted stimulus-response relationship in isolated spinal cords from chronically spinal cord transected mice (right) as compared to acutely spinal cord transected mice (left) with the correspondent population graphs (F, mean ± S.D., N = 10). In acutely spinal cord transected mice the monosynaptic response (green) appeared at lower intensities than the polysynaptic response (red) while in chronically spinal cord transected mice the polysynaptic response appeared at lower intensity than the monosynaptic one.
-
Figure 2—figure supplement 1—source data 1
Related to Figure 2—figure supplement 1.
- https://doi.org/10.7554/eLife.23011.014
Figure 2—figure supplement 2
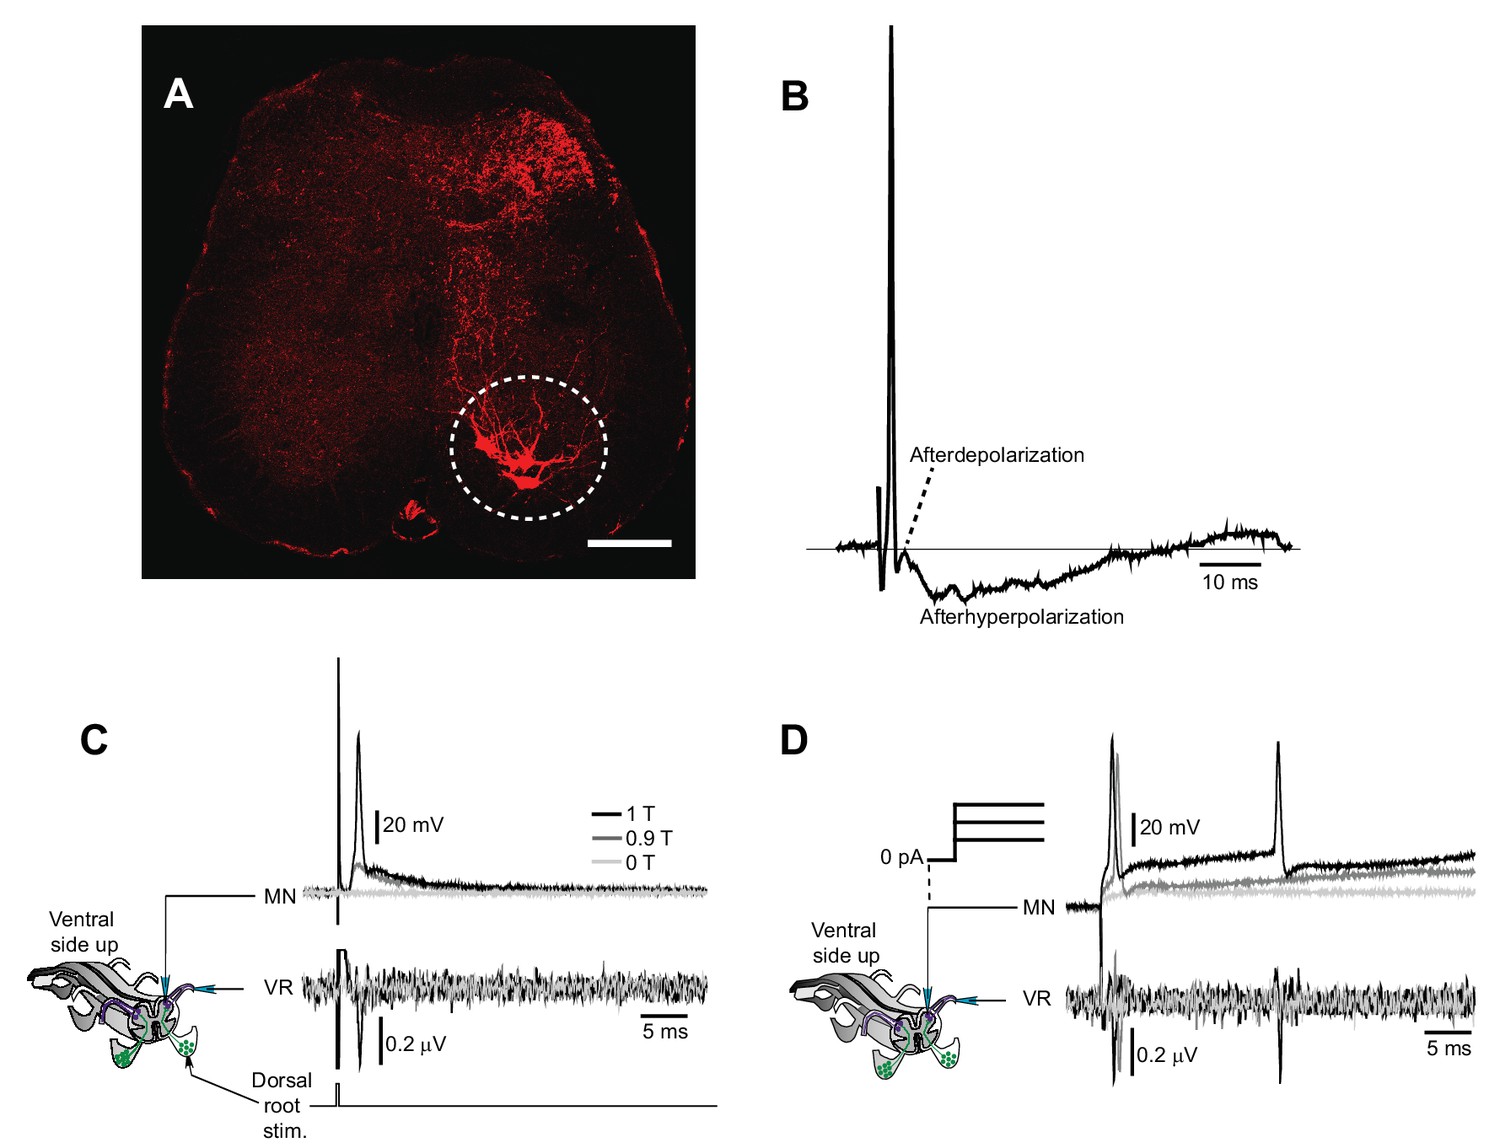
Motor neuron recordings in sacral spinal cord and their electrophysiological identification.
(A) Transverse section of the sacral spinal cord showing the location of motor neurons (white circle), retrogradely labeled by Cholera Toxin Subunit B (10 µg/µl, TermoFisher Scientific) injected in the most caudal half of the ventral tail. Scale bar is 100 µm. (B) Action potential of a motor neuron with the typically shaped afterdepolarization/afterhyperpolarization. (C–D) Schematic of the experiment with simultaneous recording of a motor neuron and the homologous ventral root. Activation of motor neuron by dorsal root stimulation (C) or current injection (D) evokes action potentials that are seen as orthodromic spikes in the homologous ventral root.
Figure 3 with 1 supplement
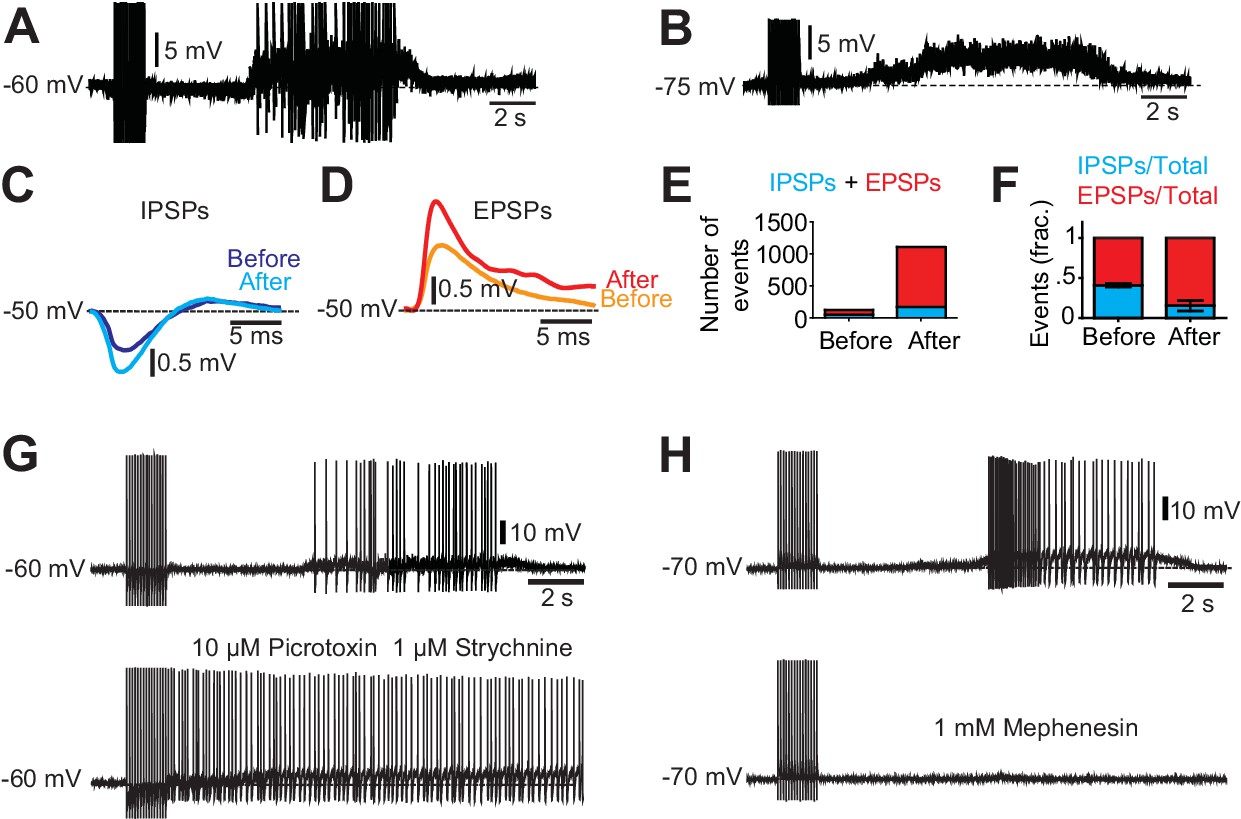
Excitatory and inhibitory inputs onto motor neurons after chronic spinal cord transection.
(A– B) Motor neuron response to low-threshold dorsal root stimulation (DRS) at resting membrane potential (A) and when hyperpolarized (B). Note the prolonged barrage of synaptic potentials. (C–D) Synaptic events divided in inhibitory post-synaptic potentials (IPSPs) and excitatory post-synaptic potentials (EPSPs) when the motor neuron was depolarized to −50 mV. Composite IPSPs and EPSPs before DRS (blue and orange respectively) were smaller than after DRS (cyan and red). Mean traces from all events before and after stimulation. (E) Number of events (IPSPs in blue and EPSPs in red) before and after DRS in a selected motor neuron. (F) Relative fraction of IPSPs and EPSPs before and after DRS (n = 10, N = 3). The relation between excitatory and inhibitory inputs shifted from being equally balanced before DRS to being dominated by excitation after DRS. Note that after DRS the synaptic events increases in number and in synchrony, allowing for summation. (G) The silent period following stimulation and preceding the spasm disappeared when GABAergic and glycinergic inhibitory circuits were blocked with picrotoxin (10 µM) and strychnine (1 µM, six out of six cells) (upper trace pre-drug). (H) Firing of a motor neuron in a chronically transected spinal cord before (upper trace) and after 1 mM Mephenesin (middle trace) which blocks polysynaptic transmission After Mephenesin, the spasm was severely reduced and was only revealed as a curtailed version when the cell was depolarized (lower trace). The direct activation of motor neurons from dorsal root stimulation was preserved. These effects were seen in all motor neurons tested (five out of five cells).
-
Figure 3—source data 1
Related to Figure 3.
- https://doi.org/10.7554/eLife.23011.017
-
Figure 3—source data 2
Related to Figure 3.
- https://doi.org/10.7554/eLife.23011.018
Figure 3—figure supplement 1
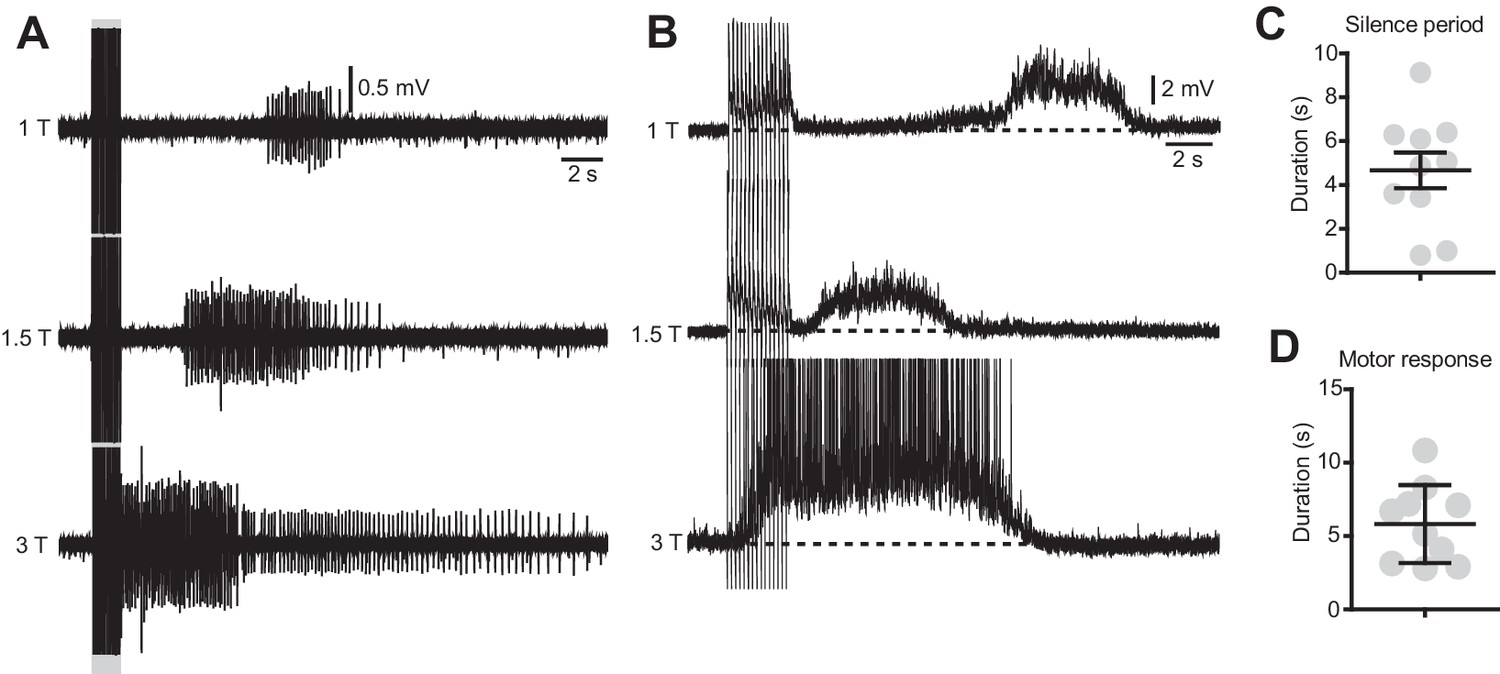
The duration of the silence period and the spasms are modulated by the stimulation intensity.
(A) Ventral root recordings during stimulation of the dorsal root at different intensities (15 pulses, 50 μs, 10 Hz). (B) Motor neuron recordings in response to dorsal root stimulation of increasing intensities (15 pulses, 50 μs, 10 Hz). (C–D) Quantification of the duration of the silent period (C) and the spasm (D) in 10 motor neurons of 3 chronically transected mice after dorsal root stimulation with the typical protocol used for in vitro experiments (15 pulses, 50 μs, 1.2 T, 10 Hz).
-
Figure 3—figure supplement 1—source data 1
Related to Figure 3—figure supplement 1.
- https://doi.org/10.7554/eLife.23011.020
-
Figure 3—figure supplement 1—source data 2
Related to Figure 3—figure supplement 1.
- https://doi.org/10.7554/eLife.23011.021
Figure 4 with 1 supplement
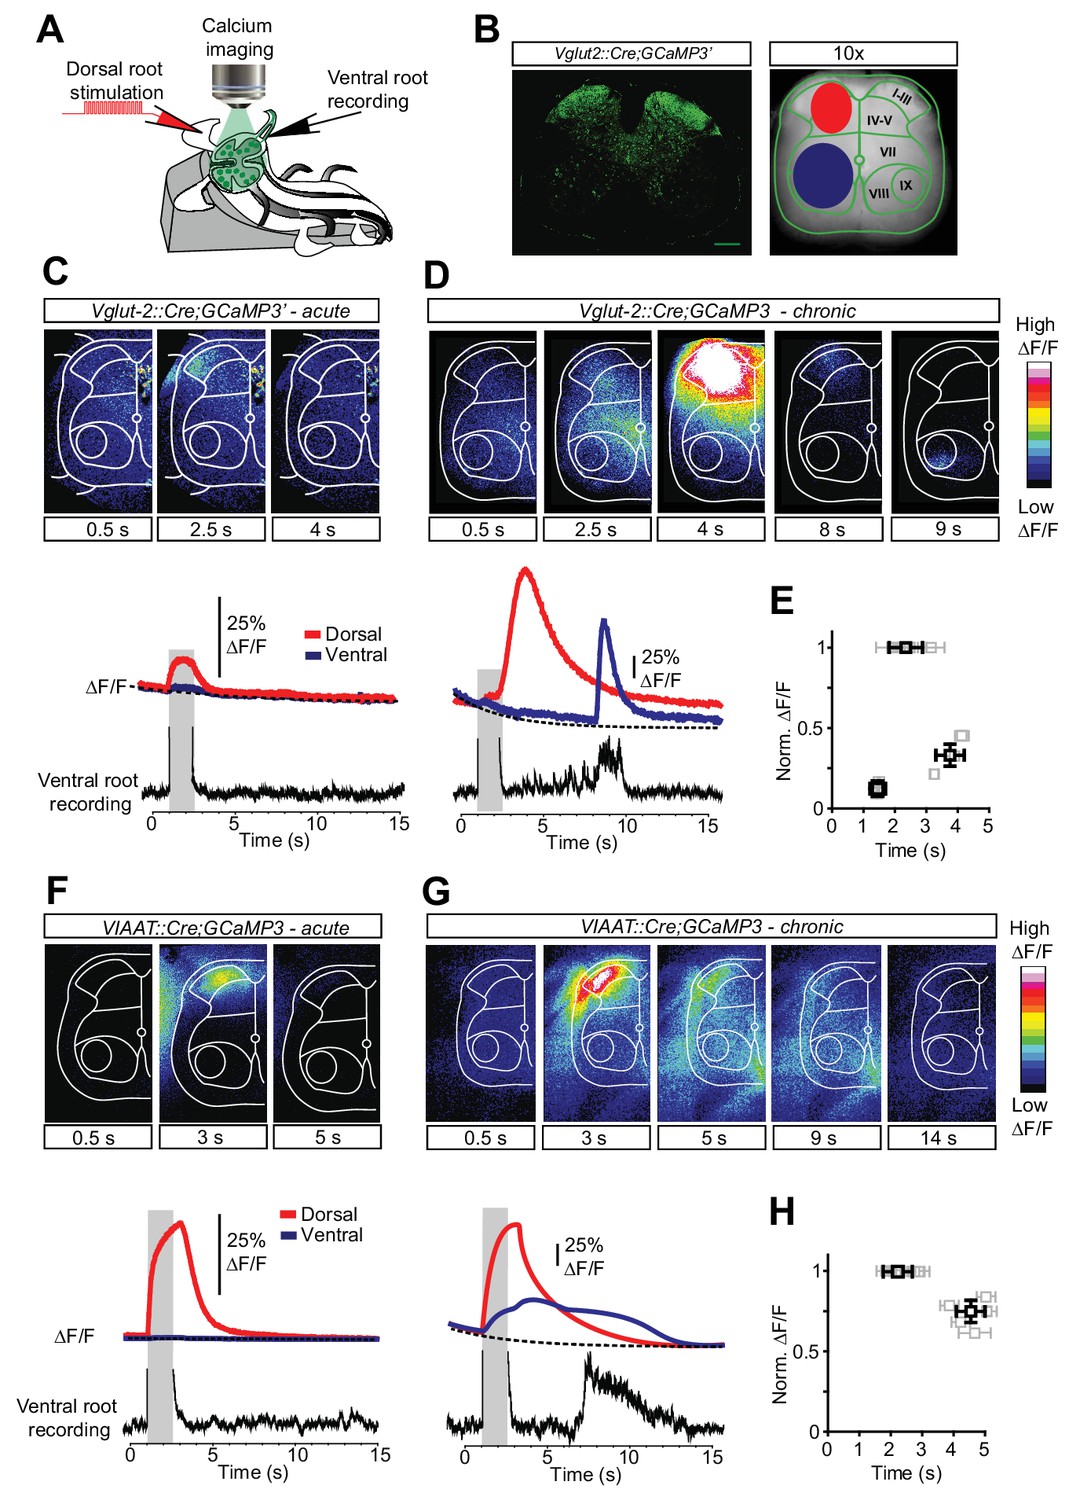
Increased activity in spinal interneurons after chronic spinal cord transection.
(A) Schematic of the set-up for calcium imaging. (B) Confocal image of a transverse section of a sacral spinal cord from Vglut2Cre;R26-GCaMP3 (left panel) and a snapshot of the spinal cord as seen with a 10x objective with the main areas of interest for detecting change in fluorescence indicated(dorsal horn in red and ventral horn in blue, right panel). (C–H) Spatial and temporal development of changes in fluorescence intensity in excitatory (C–E; Vglut2Cre;R26-GCaMP3) and inhibitory (F–H; VIAATCre;R26-GCaMP3) spinal neurons in acutely (C, F) and chronically spinal cord transected (D, G) mice. Upper panels show frames of fluorescence transients (ΔF/F) at specific time points after low-threshold dorsal root stimulation. Lower panels show change in fluorescence (ΔF/F) as a function of time in the dorsal (red) and ventral (blue) horns with the corresponding rectified ventral root recording. Grey bars represent stimulation. The plots summarize the time and the normalized intensity of the peaks for the eINs (E) and iINs (H) after acute and chronic transections (mean ± SD in black, N = 5 for each group).
-
Figure 4—source data 1
Related to Figure 4.
- https://doi.org/10.7554/eLife.23011.023
-
Figure 4—source data 2
Related to Figure 4.
- https://doi.org/10.7554/eLife.23011.024
Figure 4—figure supplement 1
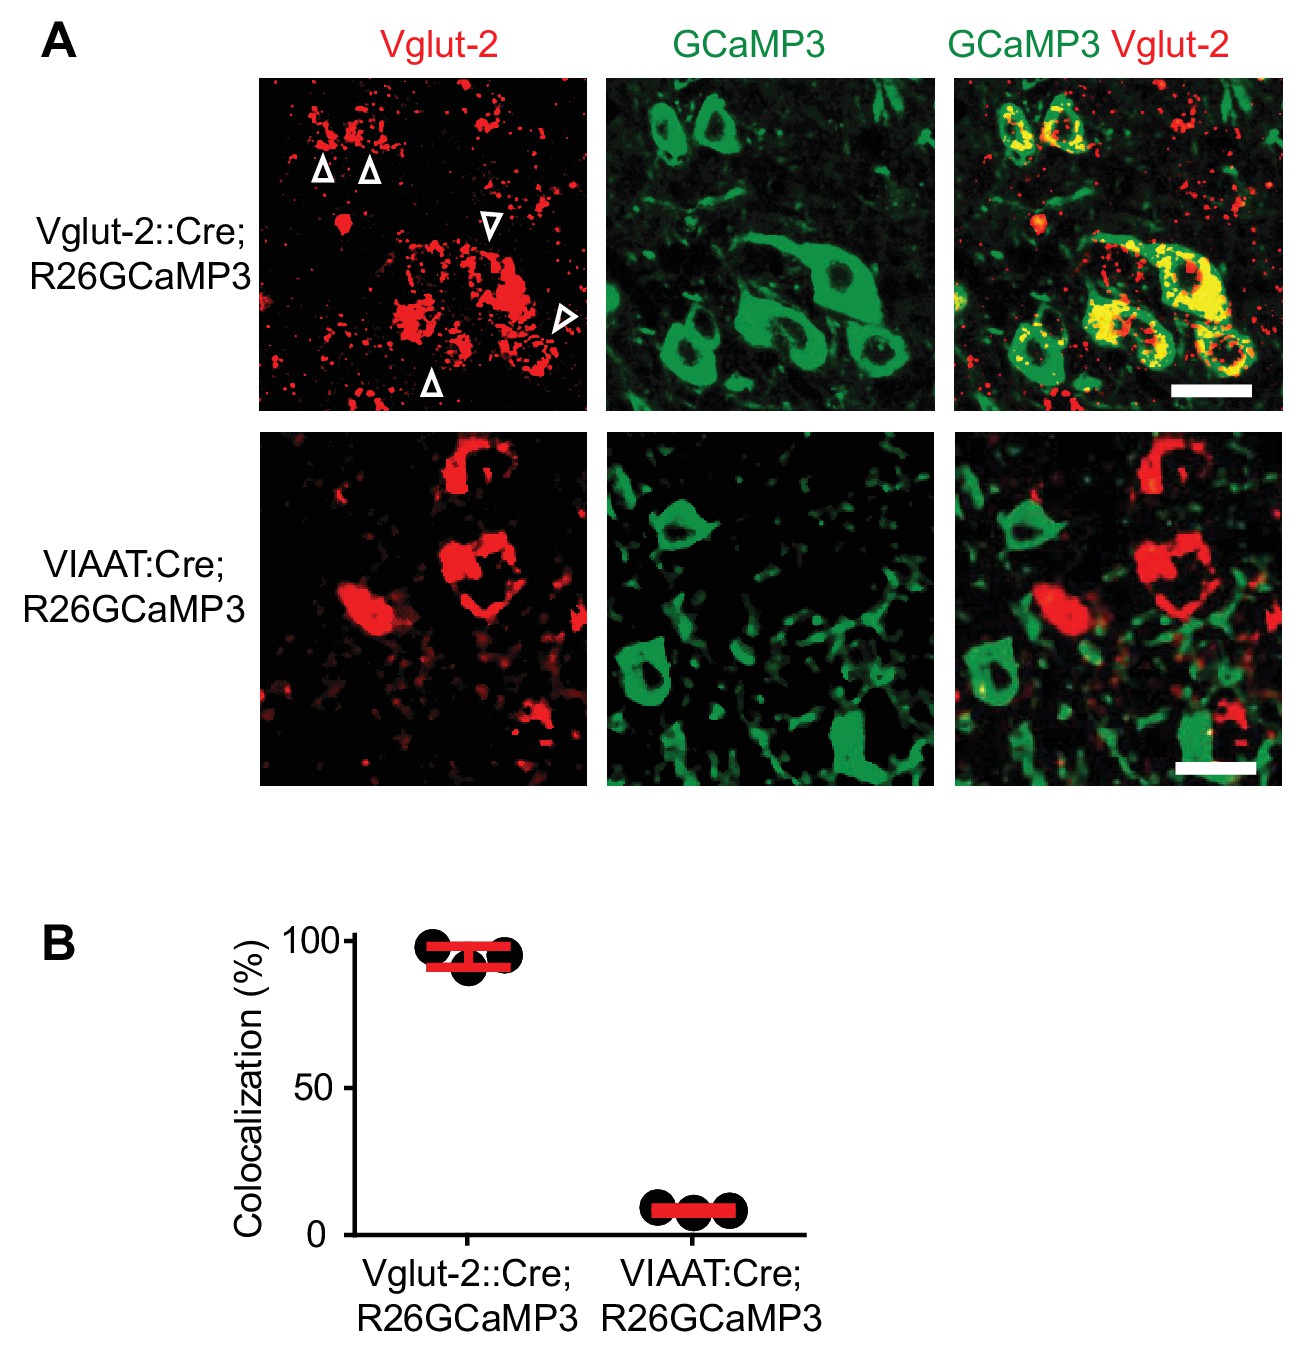
Specific expression of GCaMP3 in Vglut2Cre and VIAATCre mice.
(A) Confocal images of sacral spinal cords of a 4-month-old Vglut2Cre; R26GCaMP3 mouse (upper panels) and a VIAATCre; R26GCaMP3 mouse (lower panels) indicating Vglut2+ (left most panels) neurons (in situ hybridization for Vglut2 mRNA) and GCaMP3+ (middle panels). Co-localization is seen in the merged picture (right most panels). Scale bar 20 µm. White arrows indicate co-localization. (B) Percent of co-localization of Vglut2 mRNA with GCaMP3 in Vglut2Cre; R26GCaMP3 mice (93% ± 4.3%, red bar, mean ± SD, each black dot represents a mouse, N = 4) and in VIAATCre; R26GCaMP3 mice (4.1% ± 0.9%, N = 3).
-
Figure 4—figure supplement 1—source data 1
Related to Figure 4—figure supplement 1.
- https://doi.org/10.7554/eLife.23011.026
Figure 5
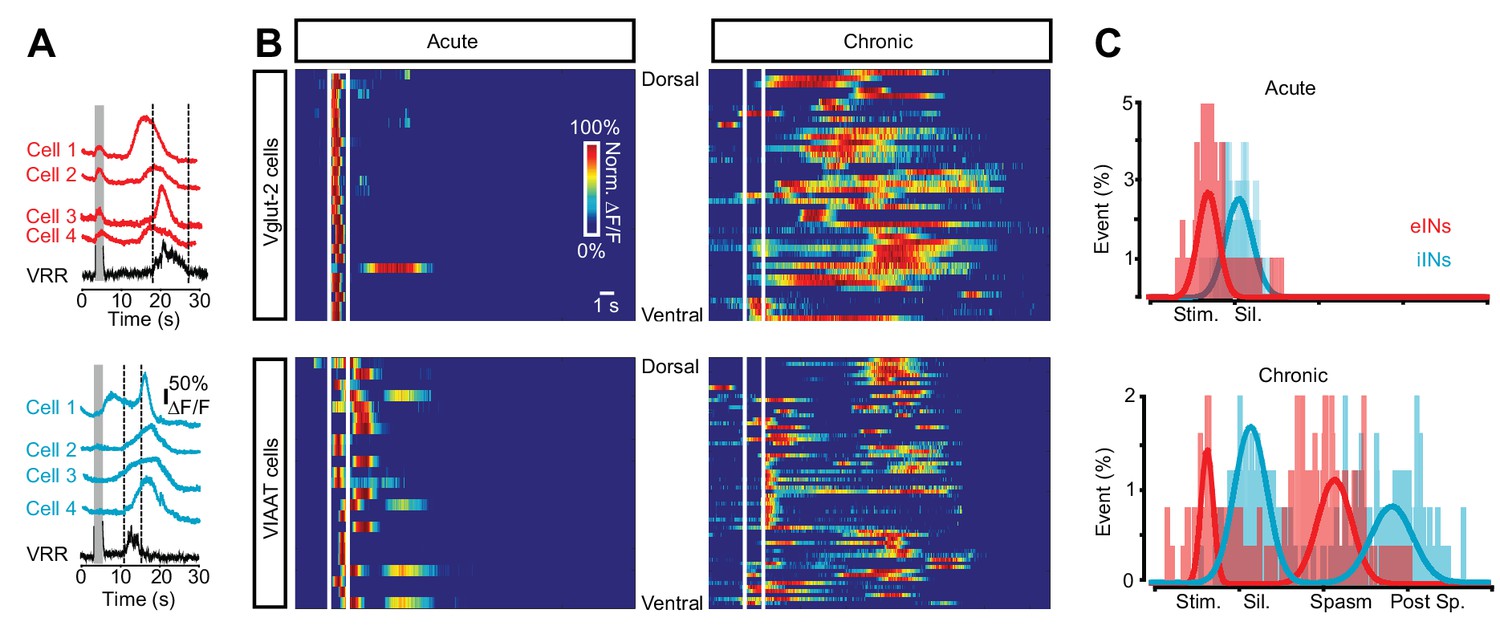
Sequential activation of spinal neurons generates persistent neural activity during spasms after chronic spinal cord transection.
(A) Example of Ca2+ signals (∆F/F) of different cells and the ventral root responses following dorsal root stimulation in Vglut2+ (red traces, upper panel) and VIAAT+ (blue traces, lower panel) cords of chronically spinal cord transected mice. (B) Color raster plot of normalized Ca2+ response following dorsal root stimulation of excitatory (eINs - upper panels) and inhibitory interneurons (iINs - lower panels) from acutely (left panels) and chronically spinal cord transected (right panels) mice, organized with respect to their dorso-ventral position. (C) Compiled frequency distribution of the timing of the peak of calcium activity for eINs (red) and iINs (blue) normalized to the ventral root recordings for acutely (eINs = 98, N = 5; iINs = 98, N = 5) and chronically spinal cord transected mice (eINs = 198, N = 5; iINs = 184, N = 5). Data were fitted with Gaussian distributions and compared using the Student’s t test. The x-axes indicate the normalized time: period of stimulation (Stim.), silent period following stimulation (Sil.), period of prolonged motor response (spasm), and period following the spasm (post-sp.). See Materials and methods for information about the time normalization.
-
Figure 5—source data 1
Related to Figure 5.
- https://doi.org/10.7554/eLife.23011.030
Figure 6 with 2 supplements
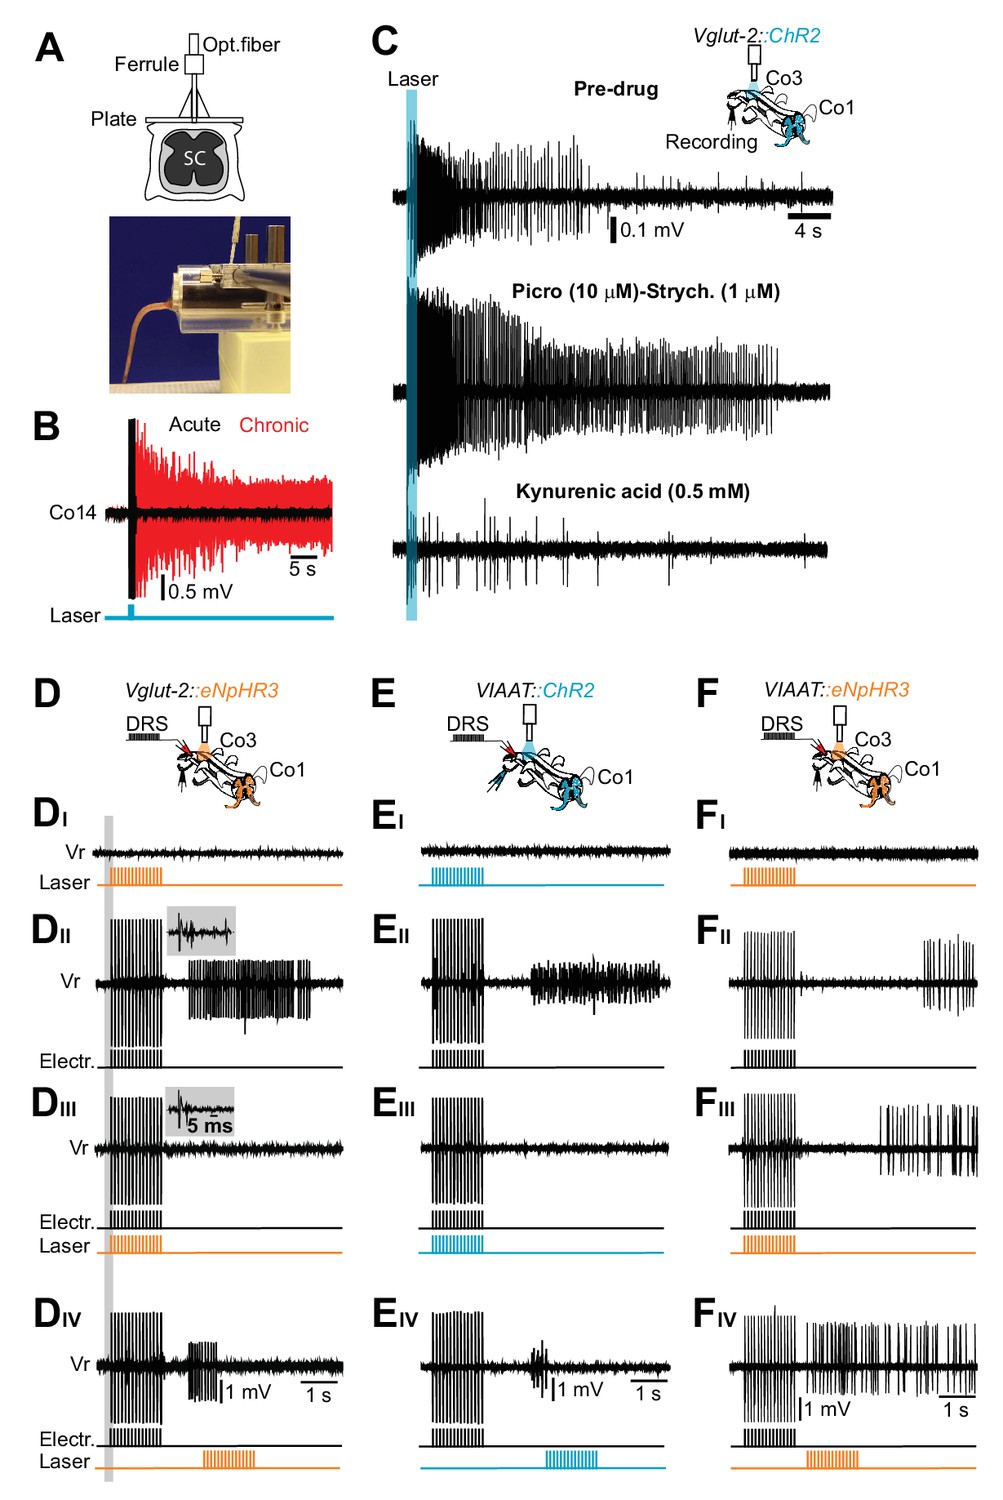
Excitatory, but not inhibitory, interneurons trigger the persistent neural activity underlying spasms after chronic spinal cord transection.
(A) Drawing of the optical fiber implant above the sacral spinal cord (upper panel). (B) Gross EMG recordings from tail muscles in acutely (black trace) and chronically spinalized (red trace) Vglut2Cre; R26ChR2 mice during light stimulation of the first coccygeal segment of the spinal cord (train of 15 pulses, 20 ms, 10 Hz). Stimulation of excitatory interneurons (eINs) in chronically spinalized mice always generated spasms (4 out of 4). See also Video 4. (C) Co3 ventral root recordings in isolated spinal cord from a chronically spinal cord transected Vglut2Cre; R26ChR2 mouse during optogenetic stimulation at the third coccygeal segment of the spinal cord (train of 15 pulses, 20 ms, 10 Hz, upper trace), after application of 10 μM of the GABAA antagonist picrotoxin in combination with 1 μM of the glycinergic antagonist strychnine (middle trace), and after application of a broad range glutamatergic antagonist, Kynurenic acid (0.5 mM, lower trace). (D–F) Schematics of the in vitro experiments with indication of dorsal root stimulation (DRS), ventral rootlets recordings and optical stimulation in chronically spinal cord transected Vglut2Cre; eNpHR3 (D, N = 5), VIAATCre; R26ChR2 (E, N = 10), and VIAATCre; eNpHR3 (F, N = 10) mice. Raw ventral root recordings with only optogenetic stimulation (DI–FI), only electric stimulation (DII–DII), simultaneous optogenetic and electric stimulation (DIII–FIII) and optogenetic stimulation delayed in time (DIV-FIV). Note that optogenetic activation of iINs (EI) does not evoke spasms while their activation during a spasm immediately terminates it (Eiii). Insets in DII–III show that the monosynaptic and polysynaptic inputs to motor neurons are similar with and without optogenetic stimulation during the electrical stimulation.
Figure 6—figure supplement 1
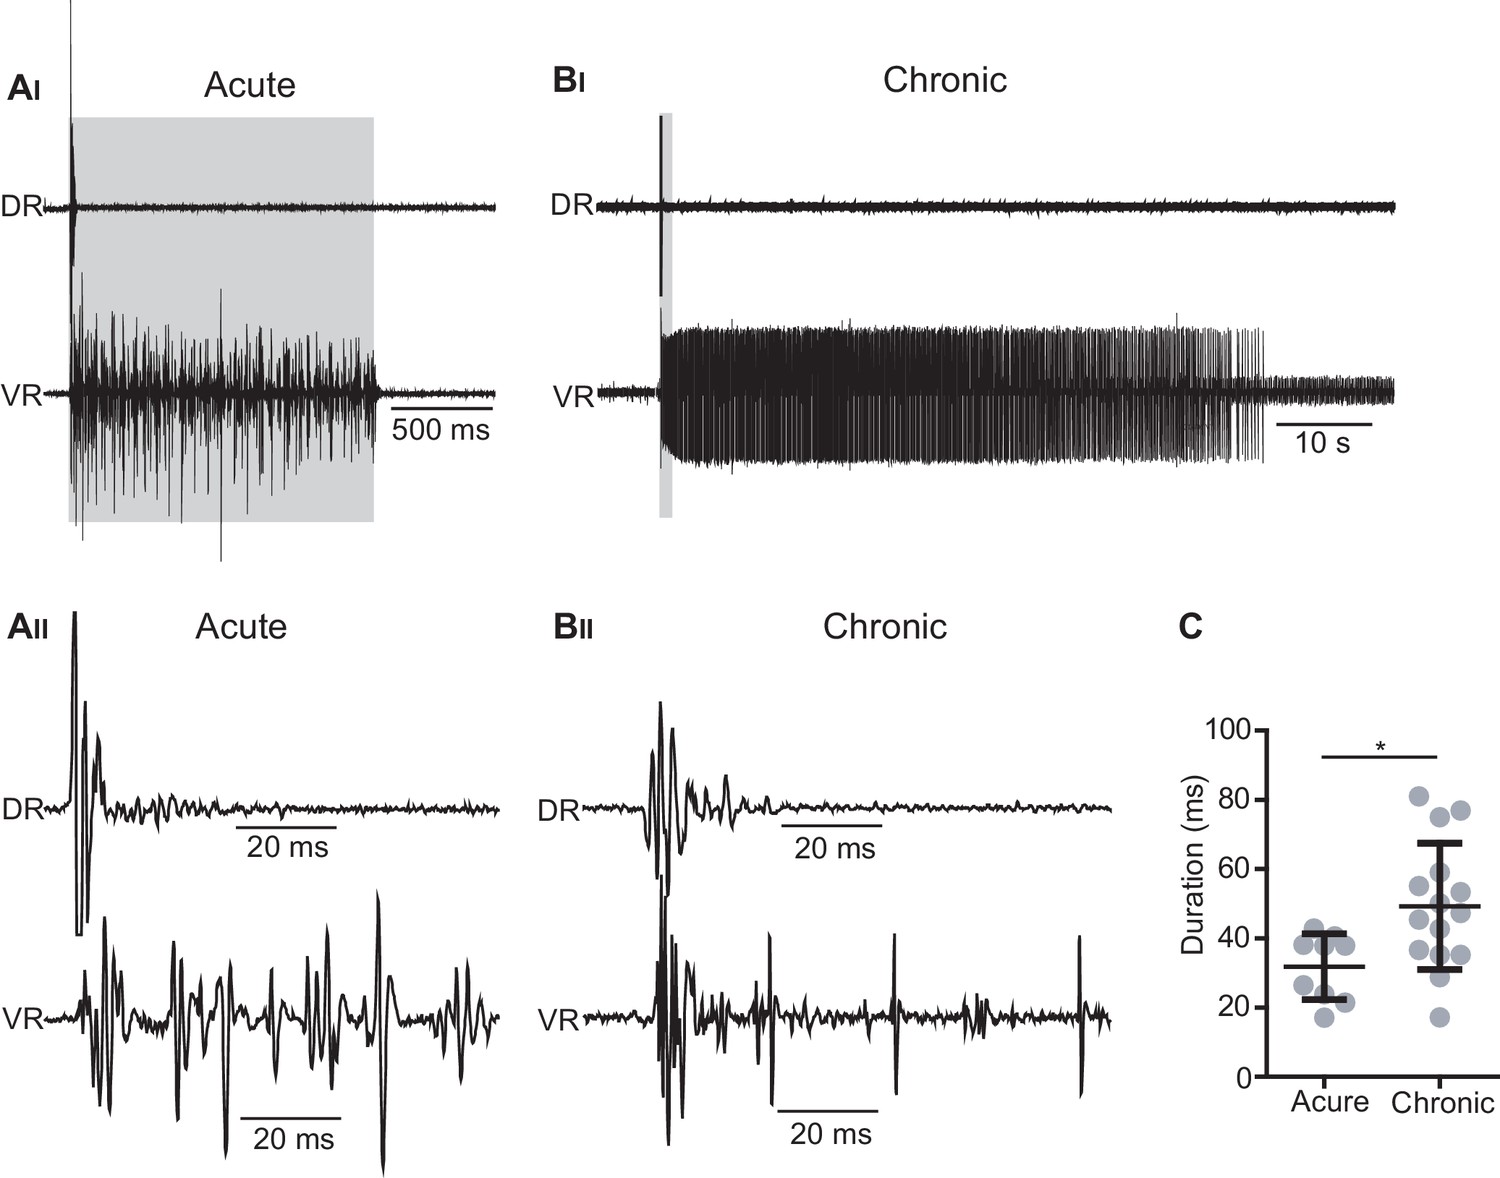
Optogenetic stimulation of Vglut2Cre; R26ChR2 mice generates short-lasting but not persistent activity in primary afferents.
(AI–BII) Dorsal (DR) and ventral root (VR) recordings in acutely (AI– AII) and chronically transected (BI–BII) Vglut2Cre; R26ChR2 mice during 1 s long light stimulation of the isolated spinal cord. Time expanded traces in AII–BII. In acutely transected spinal cord mice (AI–AII) the optogenetic stimulation caused motor responses during the stimulation accompanied by a short-lasting antidromic firing of afferents as recorded in the DR while a similar stimulation in chronically spinal cord transected (BI-BII) mice cause a prolonged spasm accompanied by a short-lasting antidromic firing of afferents as recorded in the DR. (C) Duration of DR responses in acutely and chronically spinal cord transected mice.
-
Figure 6—figure supplement 1—source data 1
Related to Figure 6—figure supplement 1.
- https://doi.org/10.7554/eLife.23011.033
Figure 6—figure supplement 2
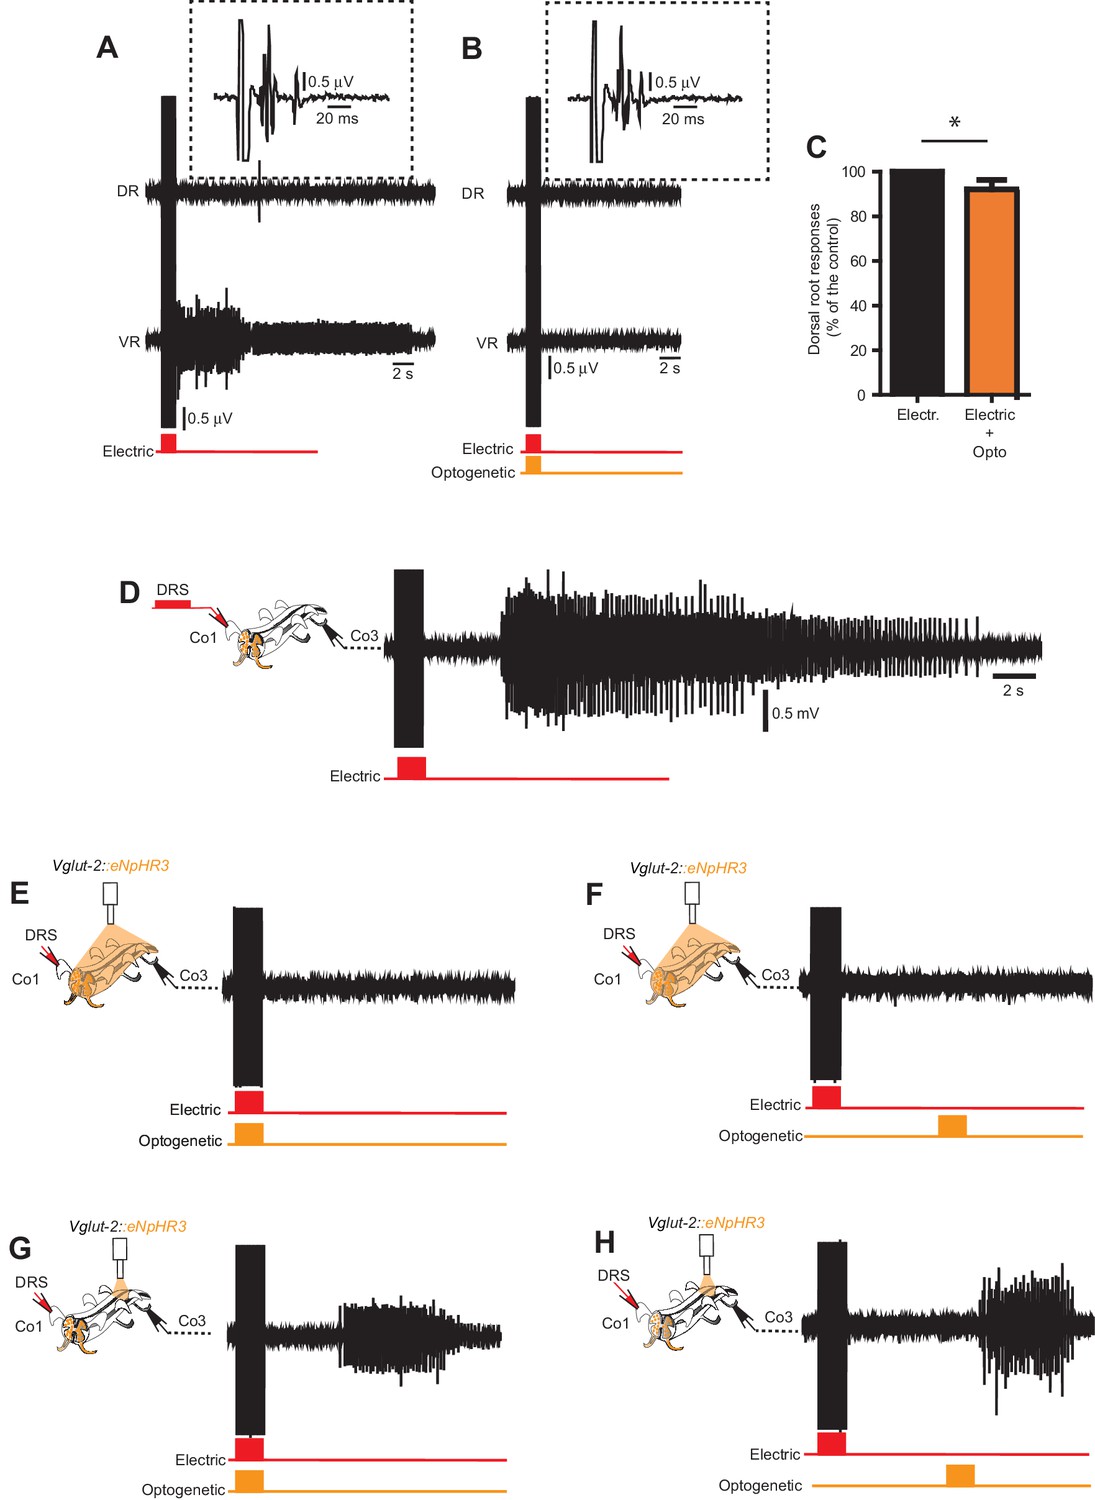
In vitro optogenetic inhibition of Vglu2Cre; R26eNpHR3 reveals intersegmental excitation supporting persistent neural activity underlying spasms.
(A–B) Dorsal and ventral root recordings during electric stimulation of the dorsal root (A) and simultaneous optogenetic stimulation of the entire spinal cord cord (B) in a Vglut2Cre; R26eNpHR3 mouse. Time-expanded traces from the dorsal root response in the dotted boxes. (C) Quantification of dorsal root responses (measured as rectified area, mV*ms) to electric stimulation with and without optogenetic inhibition Vglut2Cre; R26eNpHR3 mice revealing a small, but significant, decrease in dorsal root activation during optogenetic inhibition as compared to electrical stimulation alone (paired T-test, p=0.0005, n = 9, N = 3). (D–H) Ventral root recordings from the third coccygeal segment (Co3) in a chronically spinal cord transected Vglut2Cre; R26eNpHR3 mouse during electric stimulation of the dorsal root of the first coccygeal segment (Co1) with no optogenetic inhibition (D), simultaneous (E) and delayed (F) optogenetic stimulation of the entire spinal cord, and simultaneous (G) and delayed (H) optogenetic stimulation restricted to the Co3 segment.
-
Figure 6—figure supplement 2—source data 1
Related to Figure 6—figure supplement 2.
- https://doi.org/10.7554/eLife.23011.035
Videos
Video 1
Related to Figure 1.
Tail posture in acutely and chronically spinal cord transected mice. The Movie shows the natural posture of the tail during standing and over-ground locomotion in a acutely transected mouse and in a mouse two months after transection of the second segment of the sacral spinal cord.
Video 2
Related to Figure 1.
Spontaneous and light sensory-evoked spasms in chronically spinal cord transected mouse. The movie shows chronically S2-transected mouse in a restrainer with the tail free to move. A spontaneous spasm that curved the entire tail was followed by a spasm evoked by gentle stroking of the tail skin.
Video 3
Related to Figure 4.
Delayed activation of excitatory spinal interneurons during sensory-evoked spasm after chronic spinal cord transection. The movie shows the calcium response (ΔF/F) in excitatory spinal interneurons (marked in Vglut2Cre;R26-GCaMP3 animal) evoked by low threshold dorsal root stimulation in cords from acutely and chronically S2-transected mice. The transverse plane of a hemisection of the isolated sacral spinal cord was acquired with a 10x objective (see Figure 3a for a schematic of the experiment). Frequency of acquisition: 20 frame/s.
Video 4
Related to Figure 4.
Inhibitory spinal interneurons are strongly activated during spasms after chronic spinal cord transection. The movie shows the calcium response (ΔF/F) in inhibitory spinal interneurons (VIAATCre;R26-GCaMP3) evoked by low threshold dorsal root stimulation in cords from acutely and chronically S2-transected mice. The transverse plane of a hemisection of the isolated sacral spinal cord was acquired with a 10x objective. Frequency of acquisition: 20 frames/s.
Video 5
Related to Figure 6.
In vivo optogenetic activation of excitatory spinal interneurons triggers spasms in chronically spinal cord transected mice. The Movie shows a restrained Vglut2Cre; R26ChR2 mouse with the tail free to move. Short optogenetic stimulation (15 pulses of 20 ms duration at 10 Hz) of the first coccygeal segment of the spinal cord in acutely transected mice (control) generated a motor response during the stimulation. In contrast, a similar stimulation in chronically S2-transected mice induced a curling of the tail that lasted several minutes, similar to that seen during spontaneous or sensory-evoked spasms.
Video 6
Related to Figure 6.
Optogenetic activation of spinal inhibitory neurons completely suppresses motor responses and muscle tone in chronically spinal cord transected mice. The Movie presents the bottom and lateral views of a chronically spinal cord transected mouse expressing ChR2 in inhibitory interneurons with a chronic implant for optogenetic stimulation over the first coccygeal segment of the spinal cord. Before light stimulation the tail was curved with a posture typical of chronic spinal cord transection. During the light activation of inhibitory interneurons, the tail completely relaxed and became flaccid. The effect ceased as soon as the optogenetic stimulation ended.
Download links
A two-part list of links to download the article, or parts of the article, in various formats.
Downloads (link to download the article as PDF)
Open citations (links to open the citations from this article in various online reference manager services)
Cite this article (links to download the citations from this article in formats compatible with various reference manager tools)
Spatiotemporal correlation of spinal network dynamics underlying spasms in chronic spinalized mice
eLife 6:e23011.
https://doi.org/10.7554/eLife.23011


