Experience-dependent shaping of hippocampal CA1 intracellular activity in novel and familiar environments
- Janelia Research Campus, Howard Hughes Medical Institute, United States
Figures
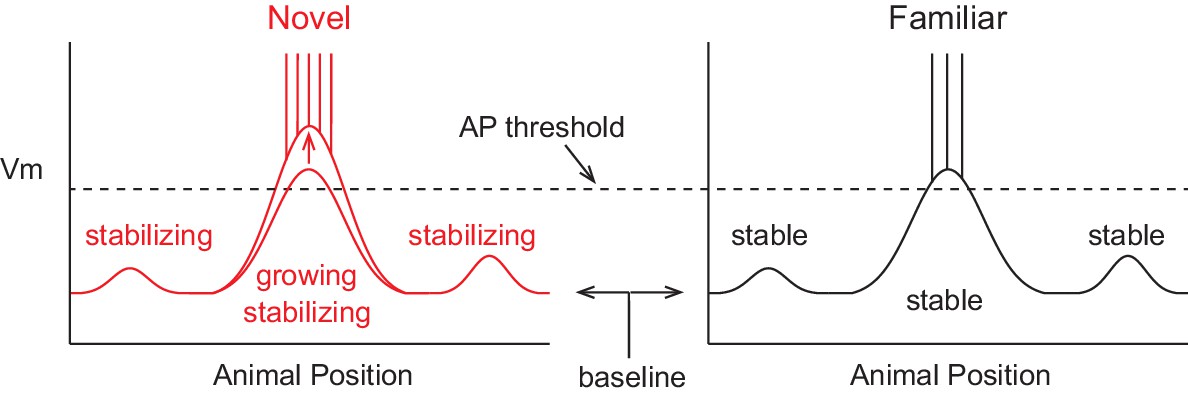
Figure 1

A model of intracellular changes underlying the formation of hippocampal CA1 place cell representations.
Hypothesized intracellular features underlying place field activity in novel and familiar environments that are consistent with previous studies. Each side represents the membrane potential (Vm) as a function of the animal’s location in a 1-dimensional environment. With repeated traversals of the environment, inputs underlying place field spiking are strengthened due to Hebbian or spike timing-dependent plasticity, which is reflected in a larger amplitude depolarization of the Vm from the baseline Vm level in familiar environments. The experimentally observed higher AP rate during novel experience is explained by a more depolarized baseline, which could result from the known reduction in CA1 inhibitory interneuron firing rates in novel environments. A lower AP threshold could potentially also contribute to higher AP rates in novel environments (lower, gray dotted line). The spatial tuning of inputs within the place field region is presumed to stabilize with experience, possibly due to plasticity triggered by intracellular complex spikes (CSs). Previous experimental data does not clearly inform what may occur regarding the stability of inputs outside of the field. Figure 7 shows our results from testing the features of this model with intracellular recordings.
Figure 2 with 2 supplements
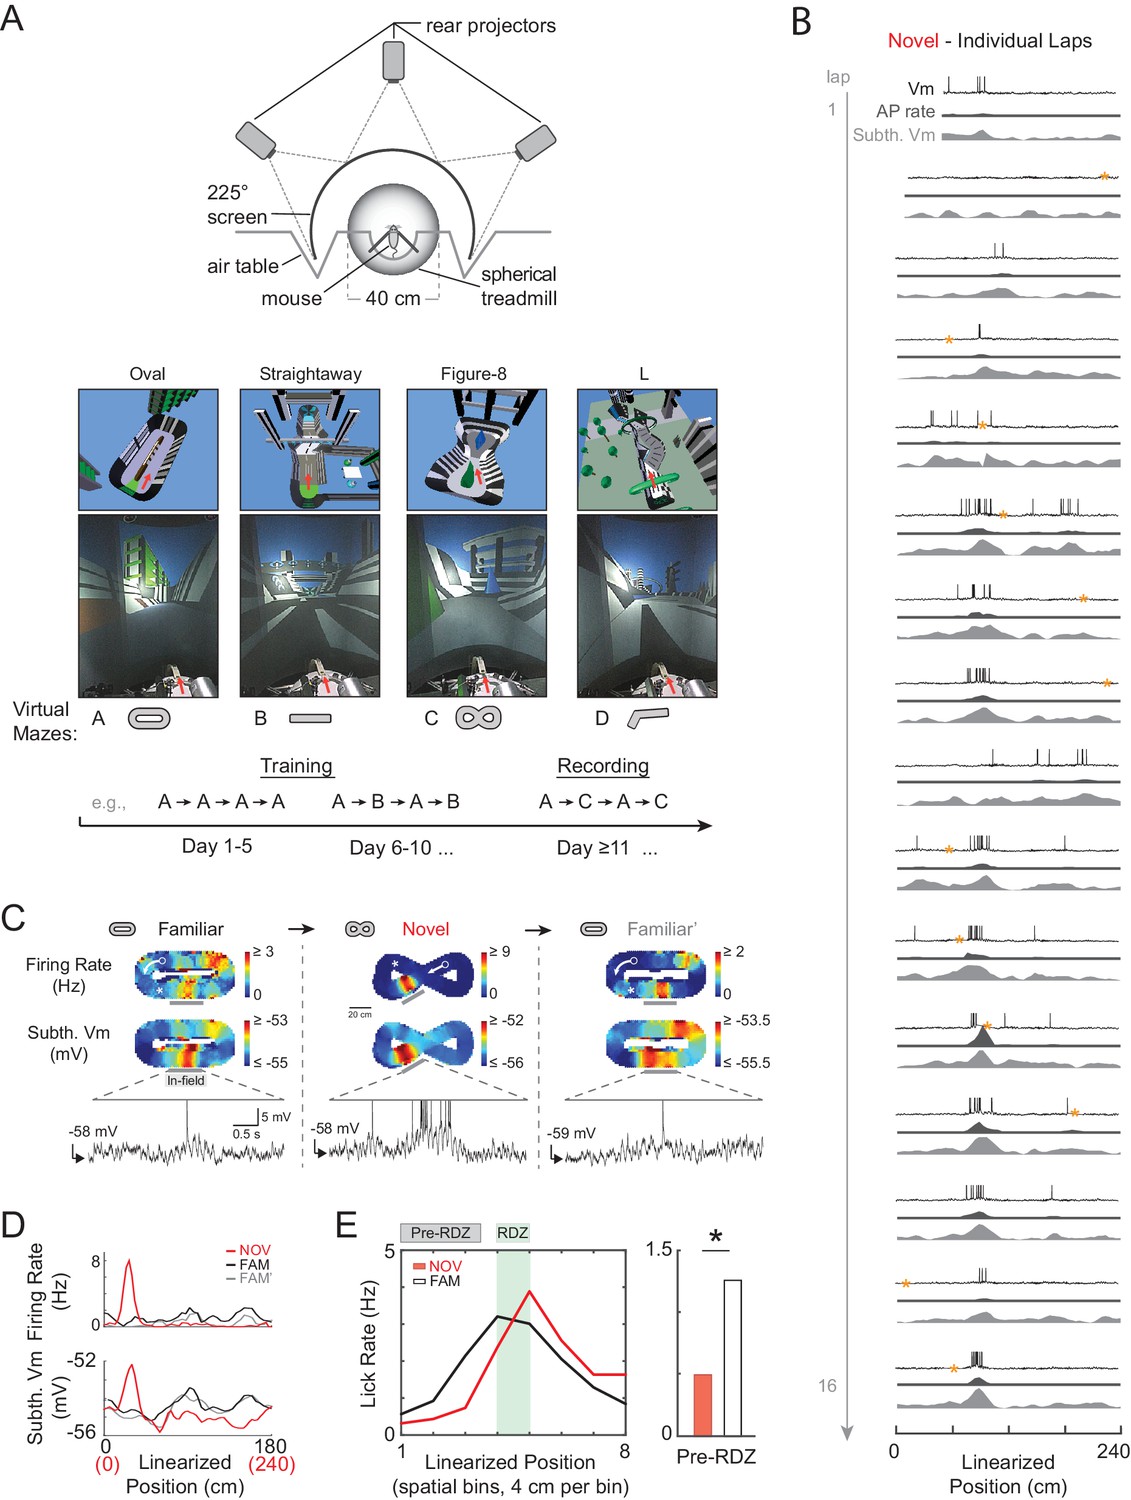
Whole-cell intracellular recording of mouse hippocampal CA1 neurons in novel and familiar virtual maze environments.
(A) Top: Top view of virtual reality apparatus showing mouse on a spherical treadmill surrounded by an image of a maze environment projected onto a cylindrical screen (225° arc). Middle: The four virtual maze environments used in the study. Overhead view of 3-D scene models of the mazes (above). Photos of the rear-projected virtual mazes on the cylindrical screen taken from above and behind the animal position (below). Arrow shows location and perspective of the animal in the virtual maze (above) and on the spherical treadmill (below). Bottom: Example behavioral training and recording protocol. (B) Example whole-cell intracellular recording in a novel maze. Vm (top), AP rate (middle), and subthreshold Vm (bottom) for the first 16 laps in linearized position coordinates. Yellow asterisks mark times (every 20 s) when current injection was applied to probe series and input resistance and evoked spiking response. Note: ‘Subthreshold Vm’ refers to the Vm after APs and CSs have been removed. (C) Activity of same cell shown in (B) as the animal first explored a familiar maze (left), then a novel maze (middle), then was re-exposed to the initial familiar maze (right). Overall AP rate (top) and subthreshold Vm (middle) in each of these three epochs. Note: ‘Epoch’ refers to the entire continuous period in a given maze. White arrow: Running direction. White asterisk: Primary reward location. Example Vm traces (bottom) from single traversals (gray bars) through place fields in each epoch (APs truncated). (D) Overall epoch activity from (C) in linearized coordinates. (E) Left: Lick rate in spatial bins immediately surrounding primary reward zone (RDZ) in novel and familiar mazes. Right: Predictive licking behavior in spatial bins immediately preceding RDZ (Pre-RDZ lick rate in Hz) in familiar versus novel mazes. *p<0.05.
Figure 2—figure supplement 1
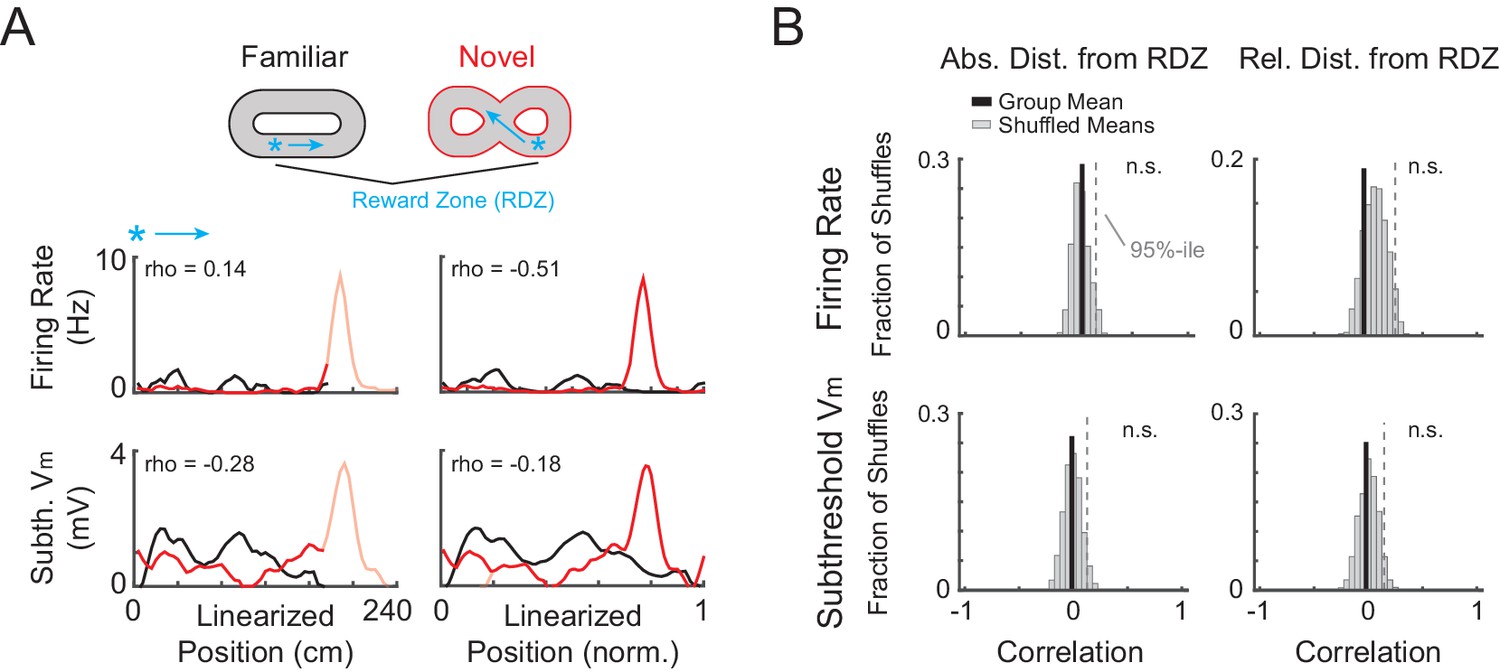
AP rate and subthreshold Vm activity aligned to the primary reward zone is not correlated between novel and familiar mazes.
(A) Example activity from the NOV-FAM maze pair shown in Figure 2C, but here the linearized activity is aligned to the primary reward zone (RDZ, asterisk) in each maze. The linear correlation (Pearson’s r) for each maze pair comparison (left: absolute position, right: relative position) is noted. Arrow: Running direction. (B) For all cells exposed to NOV-FAM maze pairs (and active in both epochs for the firing rate correlation, and active or silent for the subthreshold Vm correlation), the mean of the spatial correlation scores (Group Mean, solid black) for the overall epoch AP rate and subthreshold Vm profile across pairs of mazes is plotted in absolute (left) and relative (right) coordinates aligned to the primary reward location. Group mean scores were compared to distributions of shuffled mean values (Shuffled Means, n = 5000). Dashed line marks the 95%-ile value in the shuffled distributions, showing that the spatial profile of the firing rate or subthreshold Vm was not correlated with respect to absolute or relative distance from the primary reward location. The lack of correlation suggests that a rate remapping-like process did not occur between the familiar and novel virtual mazes, and therefore that the activity in the novel virtual mazes was new.
Figure 2—figure supplement 2
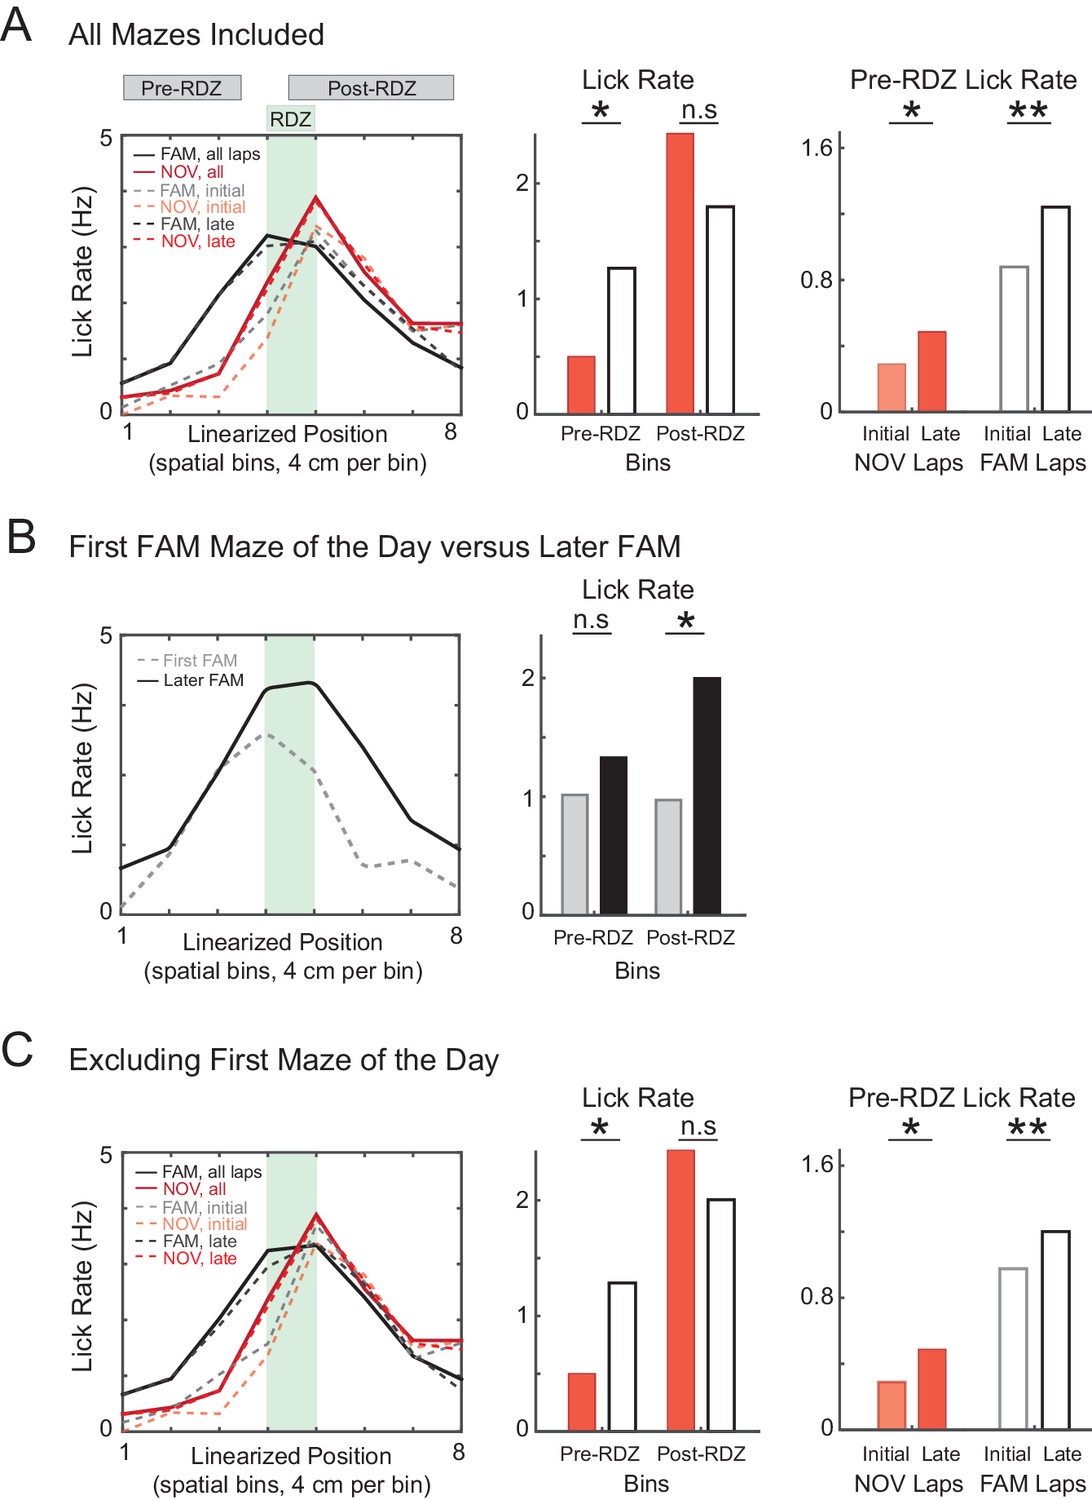
Increased predictive licking behavior with experience.
(A) Lick rate in the spatial bins immediately surrounding the primary reward zone (RDZ). The amount of predictive licking is greater in familiar compared to novel mazes, and also increases during novel and familiar epochs, indicating that animals learned the location of the reward zone. (B) Same as (A) for the subset of FAM mazes that were also the first maze experienced by the animal that day, and separately for all other FAM mazes. The amount of predictive licking was similar for both subsets of mazes, but the amount of licking in response to receiving the reward was reduced in first mazes of the day, suggesting a difference in behavioral engagement. (C) Same as (A) excluding all mazes that were also the first maze experienced by the animal that day. *p<0.05; **p<0.01.
Figure 3 with 2 supplements
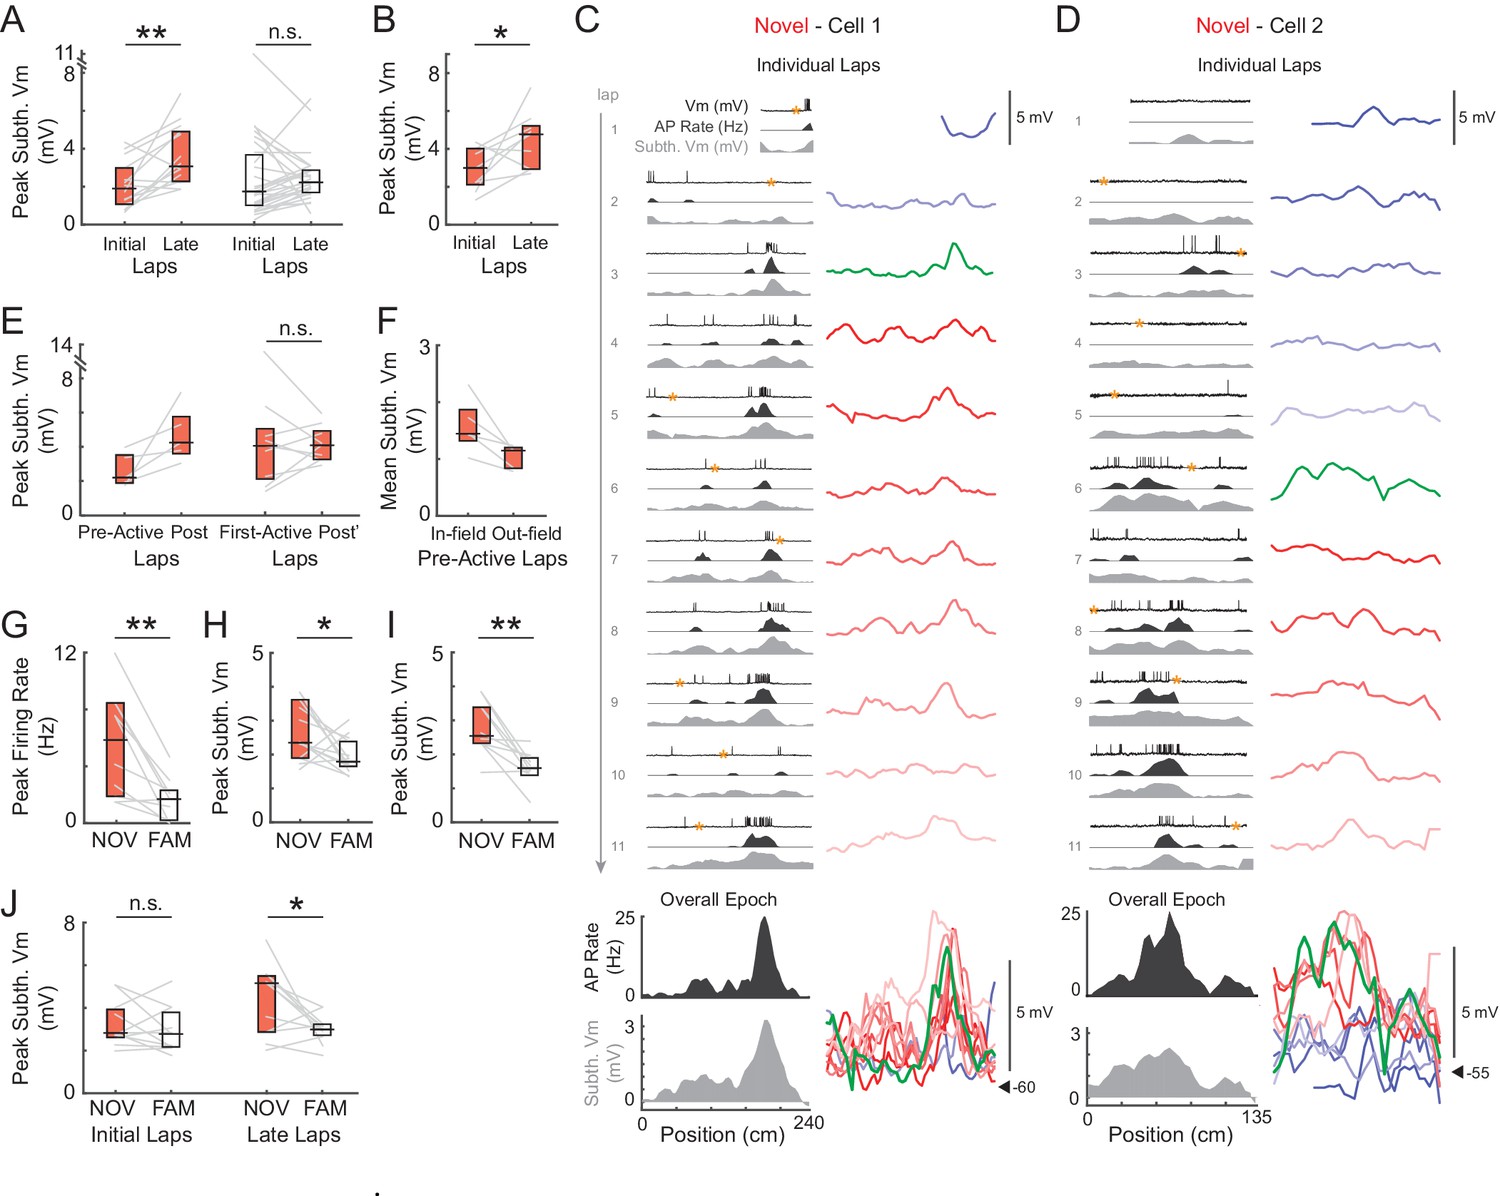
Subthreshold Vm depolarizations underlying hippocampal CA1 place fields grow in novel environments and are larger in novel compared to familiar mazes.
(A) Peak subthreshold Vm in the initial laps 1–2 versus the late laps 6-end for all novel (NOV, left) and familiar (FAM, right) mazes. The peak refers to the peak value within the field determined from the epoch-averaged subthreshold Vm as a function of location. Here and elsewhere: Box marks 25-75th percentile values, horizontal line marks median. (B) Peak subthreshold Vm within the (spiking) place field in the initial versus late laps for all place fields in novel mazes. (C)-(D) Examples of place fields that formed in a lap later than the first lap in a novel maze. Subthreshold Vm for each lap at expanded (and fixed) voltage scale (right) and overlaid (bottom right). (E) Left: Peak subthreshold Vm within the place field in the laps before (Pre-Active) versus after (Post) the first lap with spiking in the field. This includes only those place fields in novel mazes that formed in a lap later than the first lap. Note that Post includes the first lap with spiking in the field. Right: Peak subthreshold Vm within the place field in the first lap with spiking in the field (First-Active) versus in the laps afterwards (Post’). This includes all place fields in novel mazes, including those that first spiked within the field in lap 1. In (C, right) and (D, right): Pre-Active laps (shades of blue), First-Active lap (green), Post’ laps (shades of red), Post laps (green and shades of red). (F) Mean subthreshold Vm inside versus outside the field in the laps before place field spiking for the novel maze place fields in (E, Left). (G) Overall epoch peak firing rate for all recorded pairs of novel and familiar mazes (NOV-FAM maze pairs) in which cell was active in at least one of the mazes in the pair. (H) Overall epoch peak subthreshold Vm for all NOV-FAM maze pairs whether or not cell was active or silent in either maze. (I) Same as (H) except for NOV-FAM maze pairs in which the cell had a place field in at least one of the mazes in the pair. (J) Peak subthreshold Vm within the Vm-defined field in the initial laps 1–2 (left) and late laps 6-end (right) of all NOV-FAM maze pairs. P-values for paired comparisons from Wilcoxon signed-rank tests. *p<0.05; **p<0.01.
Figure 3—figure supplement 1
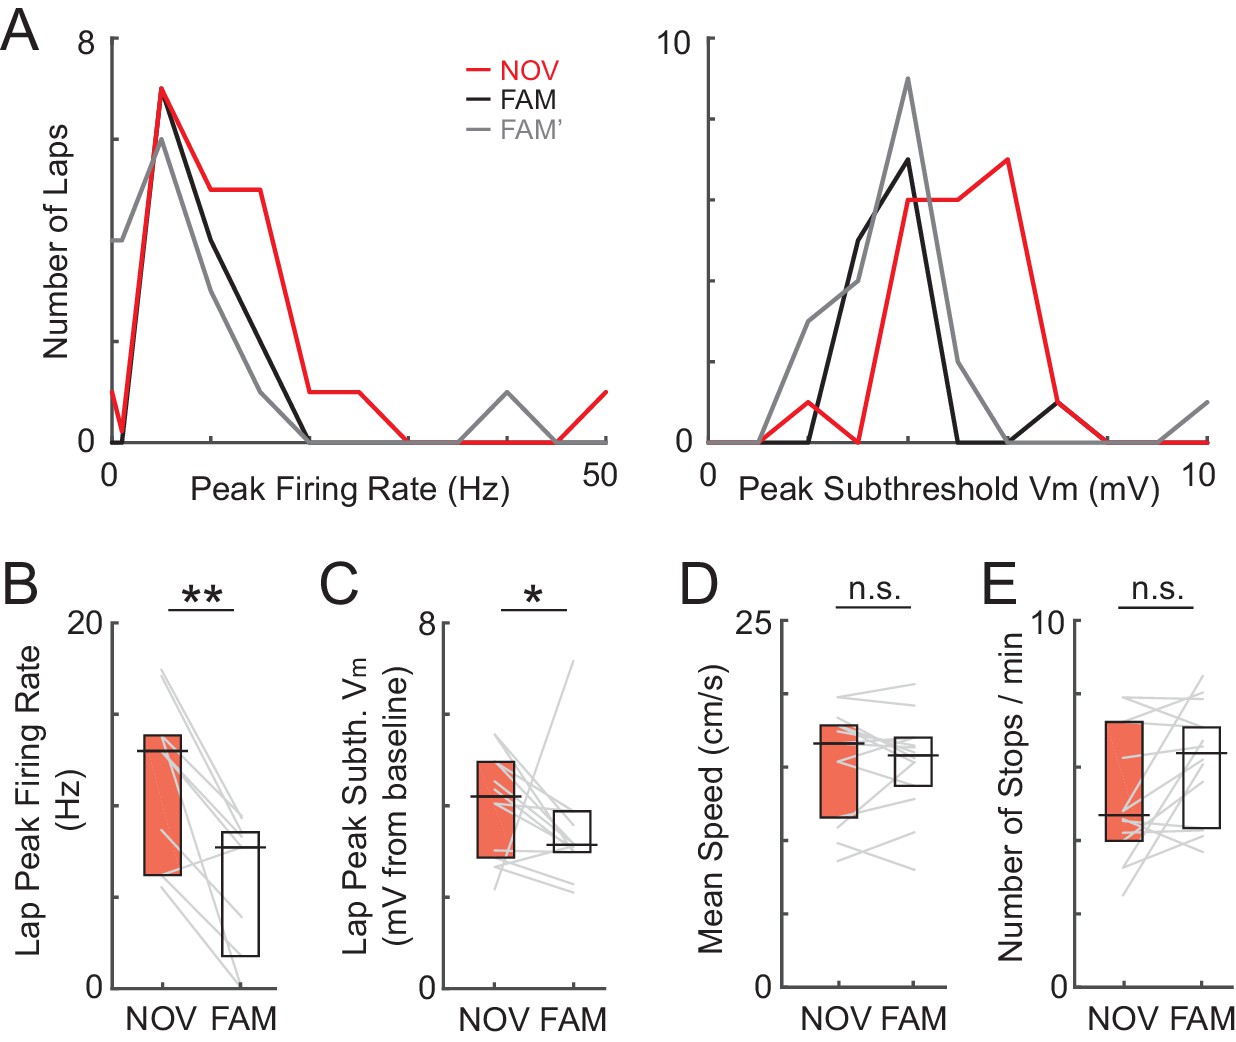
Higher AP rate and larger amplitude subthreshold Vm responses during novel exploration are not due to differences in running speed or stopping behavior.
(A) Peak AP firing rate and subthreshold Vm amplitude during each lap in the epochs shown in Figure 2B–C. Note the right-shifted distribution of the peaks in the novel (NOV) compared to the two familiar maze epochs (FAM/FAM’). (B) Mean of the peak AP rate values irrespective of position during individual laps in each maze epoch for NOV-FAM maze pairs. (C) Same as (B) for peak subthreshold Vm. (D) Overall epoch mean speed (cm/s) in the maze for all cells recorded during exposure to a NOV-FAM maze pair. (E) Same as (D) for overall epoch mean rate of stopping behavior (speed <2 cm/s for >1 s; number of stops/min). *p<0.05, **p<0.01.
Figure 3—figure supplement 2
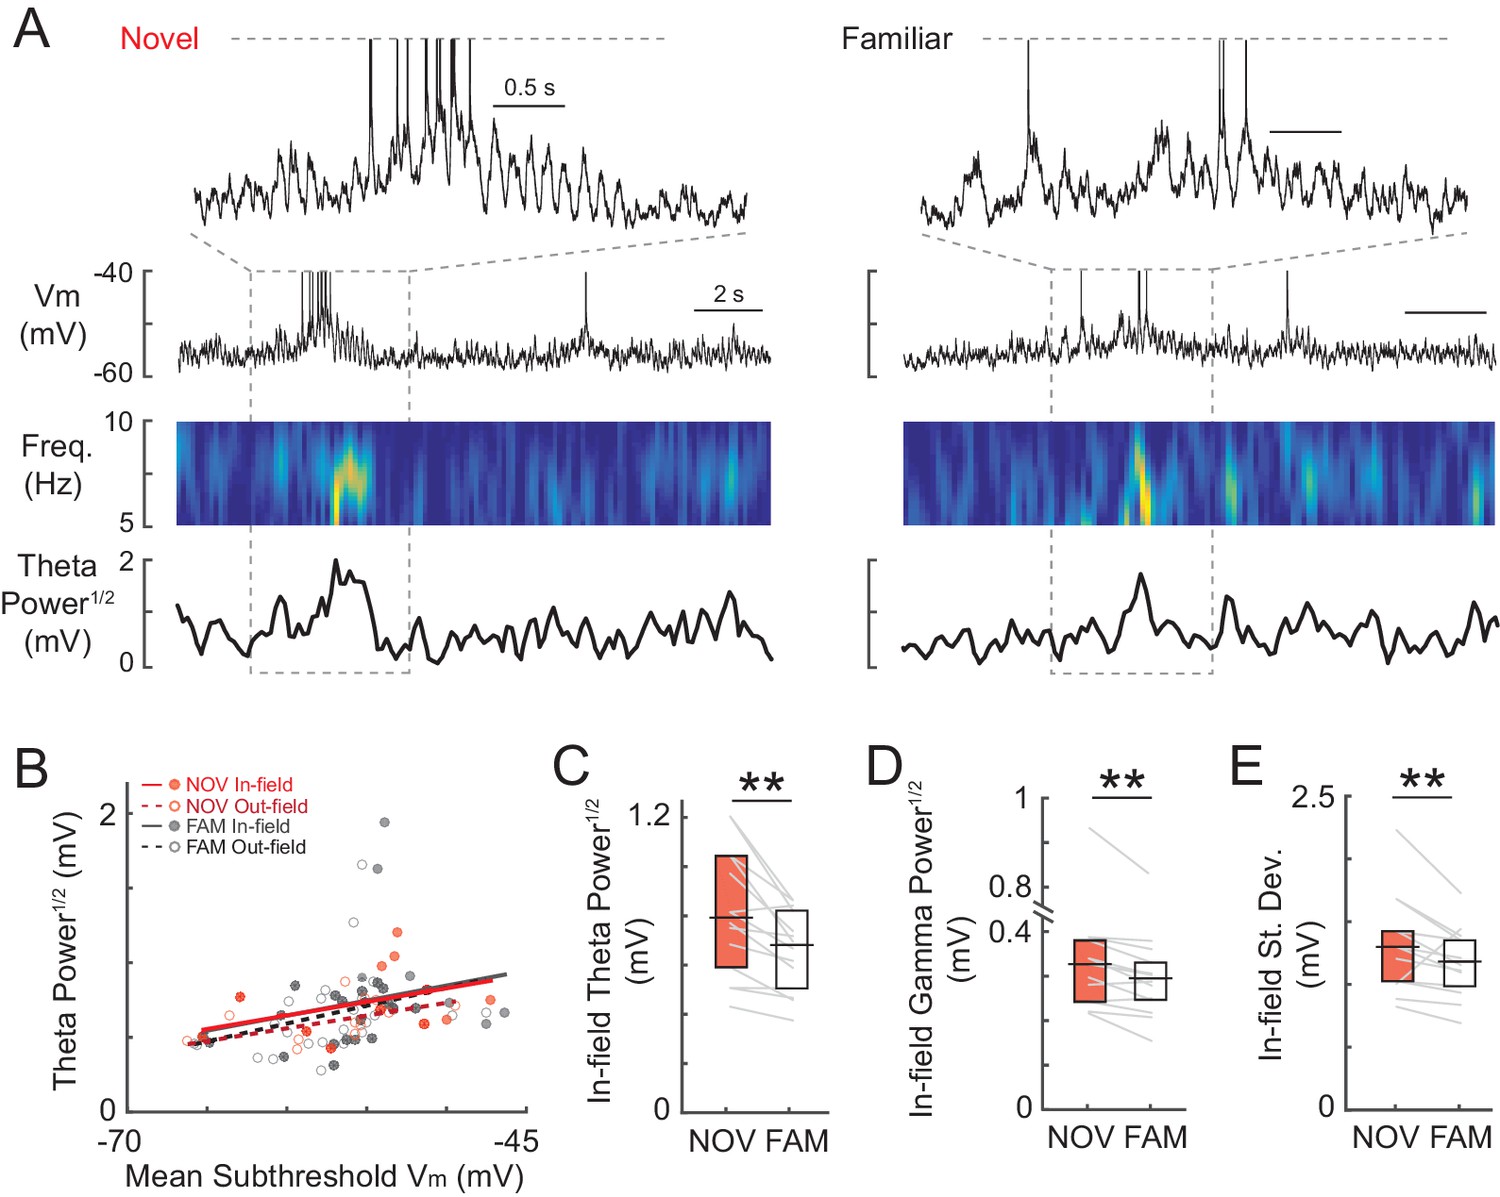
Intracellular membrane potential oscillations are larger during novel maze exploration.
(A) Example Vm activity from a single cell during one lap in a NOV (left) and FAM (right) maze of a maze pair. Top traces show a close-up of the Vm activity inside the place field. Lower panels from top to bottom show the Vm trace, theta-band spectrogram of the subthreshold Vm, and theta power1/2 of subthreshold Vm for the entire lap, respectively. (B) For all cells, theta power1/2 versus the mean subthreshold Vm inside (filled circles, solid lines) and outside (open circles, dashed lines) the field within NOV and FAM mazes. (C) Mean in-field theta power1/2 of subthreshold Vm for all cells recorded in a NOV-FAM maze pair. (D)-(E) Same as (C) for gamma power1/2 and standard deviation of subthreshold Vm. **p<0.01.
Figure 4 with 1 supplement
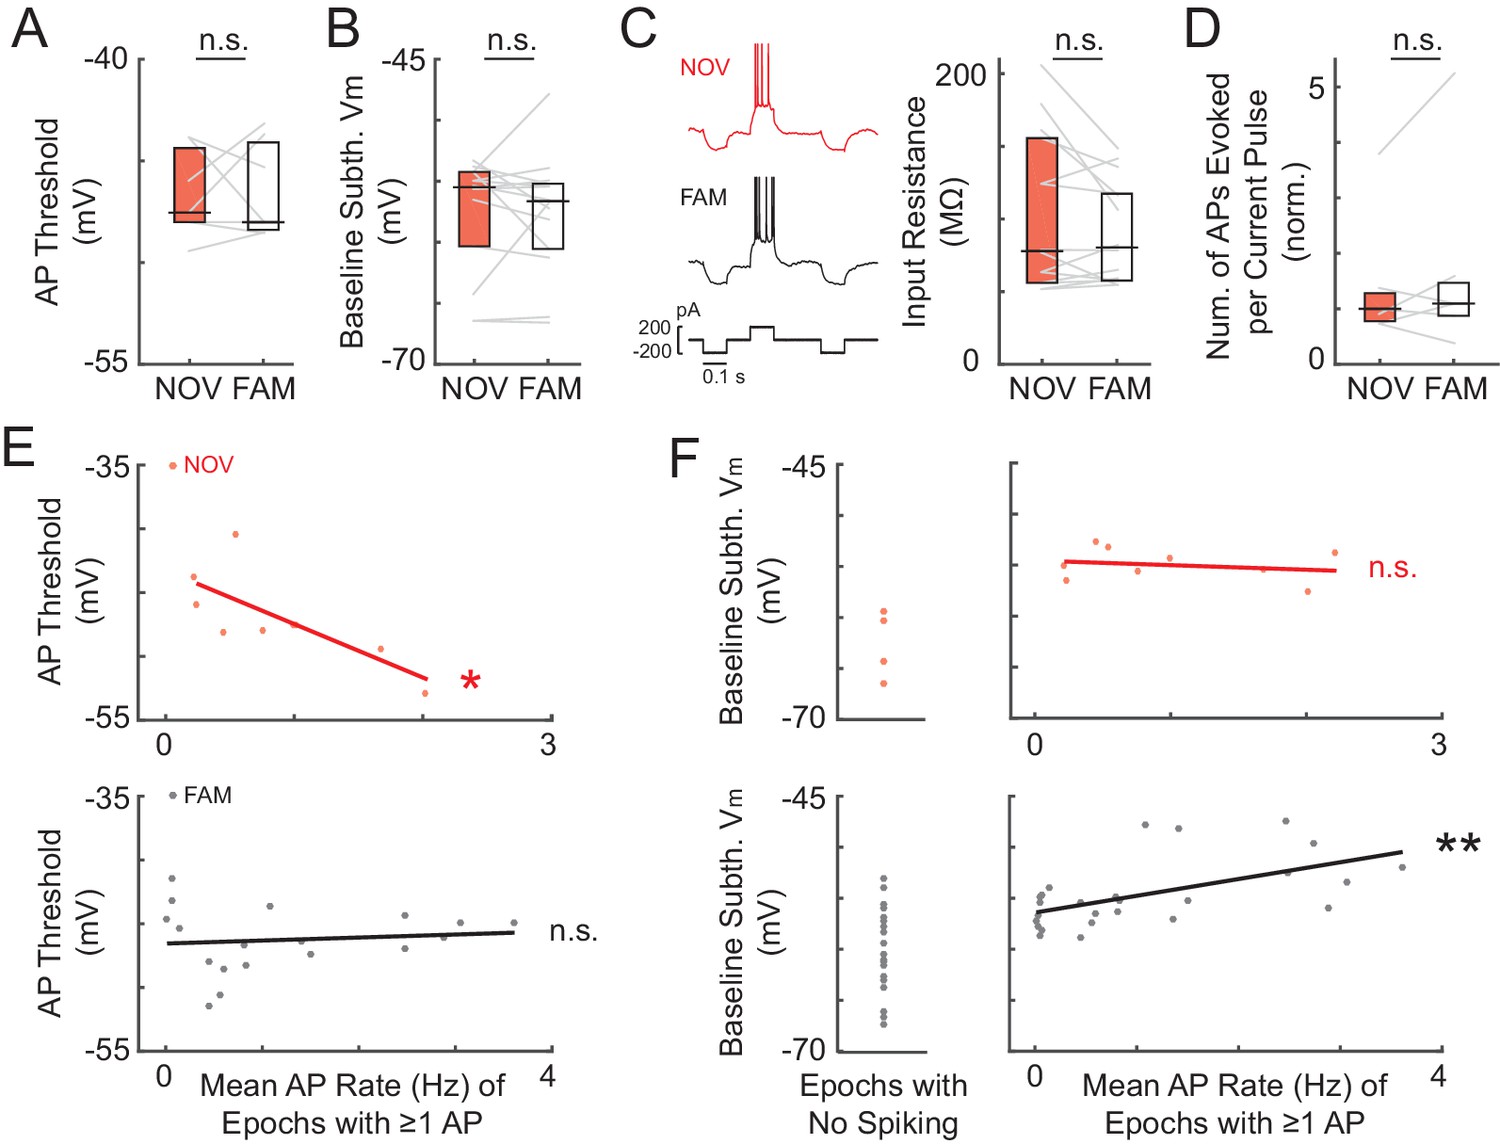
Somatic excitability does not differ between novel and familiar mazes.
(A) Mean AP threshold for all cells recorded in a NOV-FAM maze pair that were active in both mazes. (B) Overall epoch baseline subthreshold Vm for all cells recorded in a NOV-FAM maze pair. (C) Left: Example intracellular current injection sequence and responses (to probe RN and evoked firing) from a NOV-FAM maze pair. Right: Mean somatic RN for all cells recorded in a NOV-FAM maze pair. (D) Mean number of APs evoked by the positive step in the current injection sequence (normalized to median value for each step size). (E) Mean AP threshold (mV) versus AP rate (Hz) for all NOV (top) and FAM (bottom) maze epochs with ≥1 AP. (F) Left: Baseline subthreshold Vm (mV) for all NOV (top) and FAM (bottom) epochs with no spontaneous APs. Right: Baseline subthreshold Vm versus mean AP rate for all NOV (top) and FAM (bottom) epochs with ≥1 AP. The baseline Vm was more depolarized in epochs with ≥1 AP than completely silent epochs (NOV: p=0.002, FAM: p<0.001). *p<0.05; **p<0.01.
Figure 4—figure supplement 1
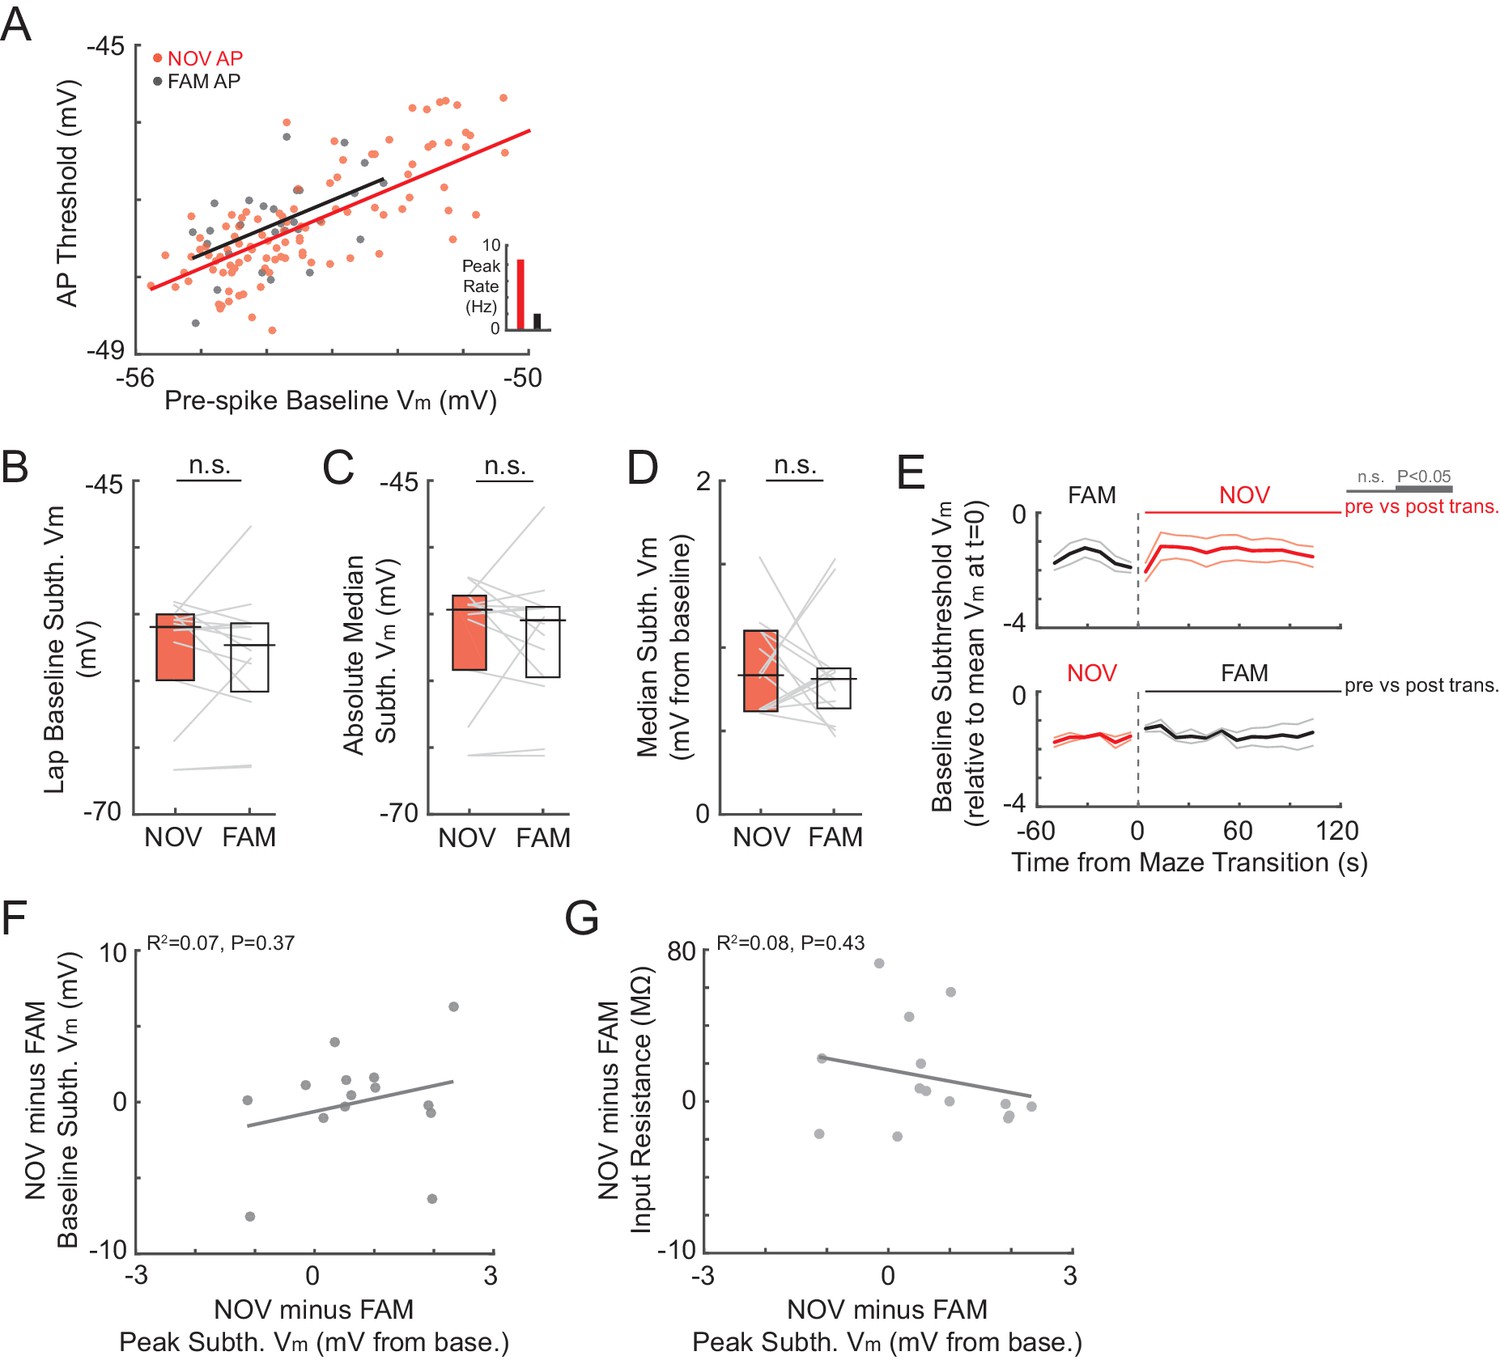
No differences in AP thresholds, somatic baseline Vm, or input resistance can account for the larger amplitude subthreshold Vm responses in novel environments.
(A) Example cell recorded in a NOV-FAM maze pair with a sufficient number of spikes for comparison of AP threshold (see Materials and methods). AP threshold versus the pre-spike subthreshold Vm (1000-to-50 ms before the AP) plotted for all isolated APs and/or first spikes in a high-frequency burst (excluding APs in CSs and those with shoulders) in the NOV and FAM maze. Insets: Overall epoch peak AP rates from the maze pairs. (B)-(E) Results using different methods of measuring baseline Vm and related quantities. (B) Mean of the baseline subthreshold Vm values during individual laps in each maze epoch for NOV-FAM maze pairs. (C) Overall epoch absolute median subthreshold Vm for all cells recorded in a NOV-FAM maze pair. (D) Same as (C) for baseline-subtracted median subthreshold Vm. (E) Baseline subthreshold Vm (bottom 10%-ile ± SE; subthreshold Vm values from 10 s sliding windows, 1 s sliding steps) in NOV-FAM maze pairs around maze transitions (t = 0). Top: FAM-to-NOV transitions; Bottom: NOV-to-FAM transitions. Horizontal lines indicate the significance of paired comparisons between activity after maze transition and from −60 to 0 s before maze transition; thick lines: p<0.05, thin lines: n.s. (F) Difference of overall epoch baseline subthreshold Vm versus peak subthreshold Vm responses for all NOV-FAM maze pairs. (G) Difference of mean somatic input resistance versus peak subthreshold Vm responses for all NOV-FAM maze pairs.
Figure 5 with 4 supplements

Spatial tuning of inputs throughout the entire environment stabilizes with experience.
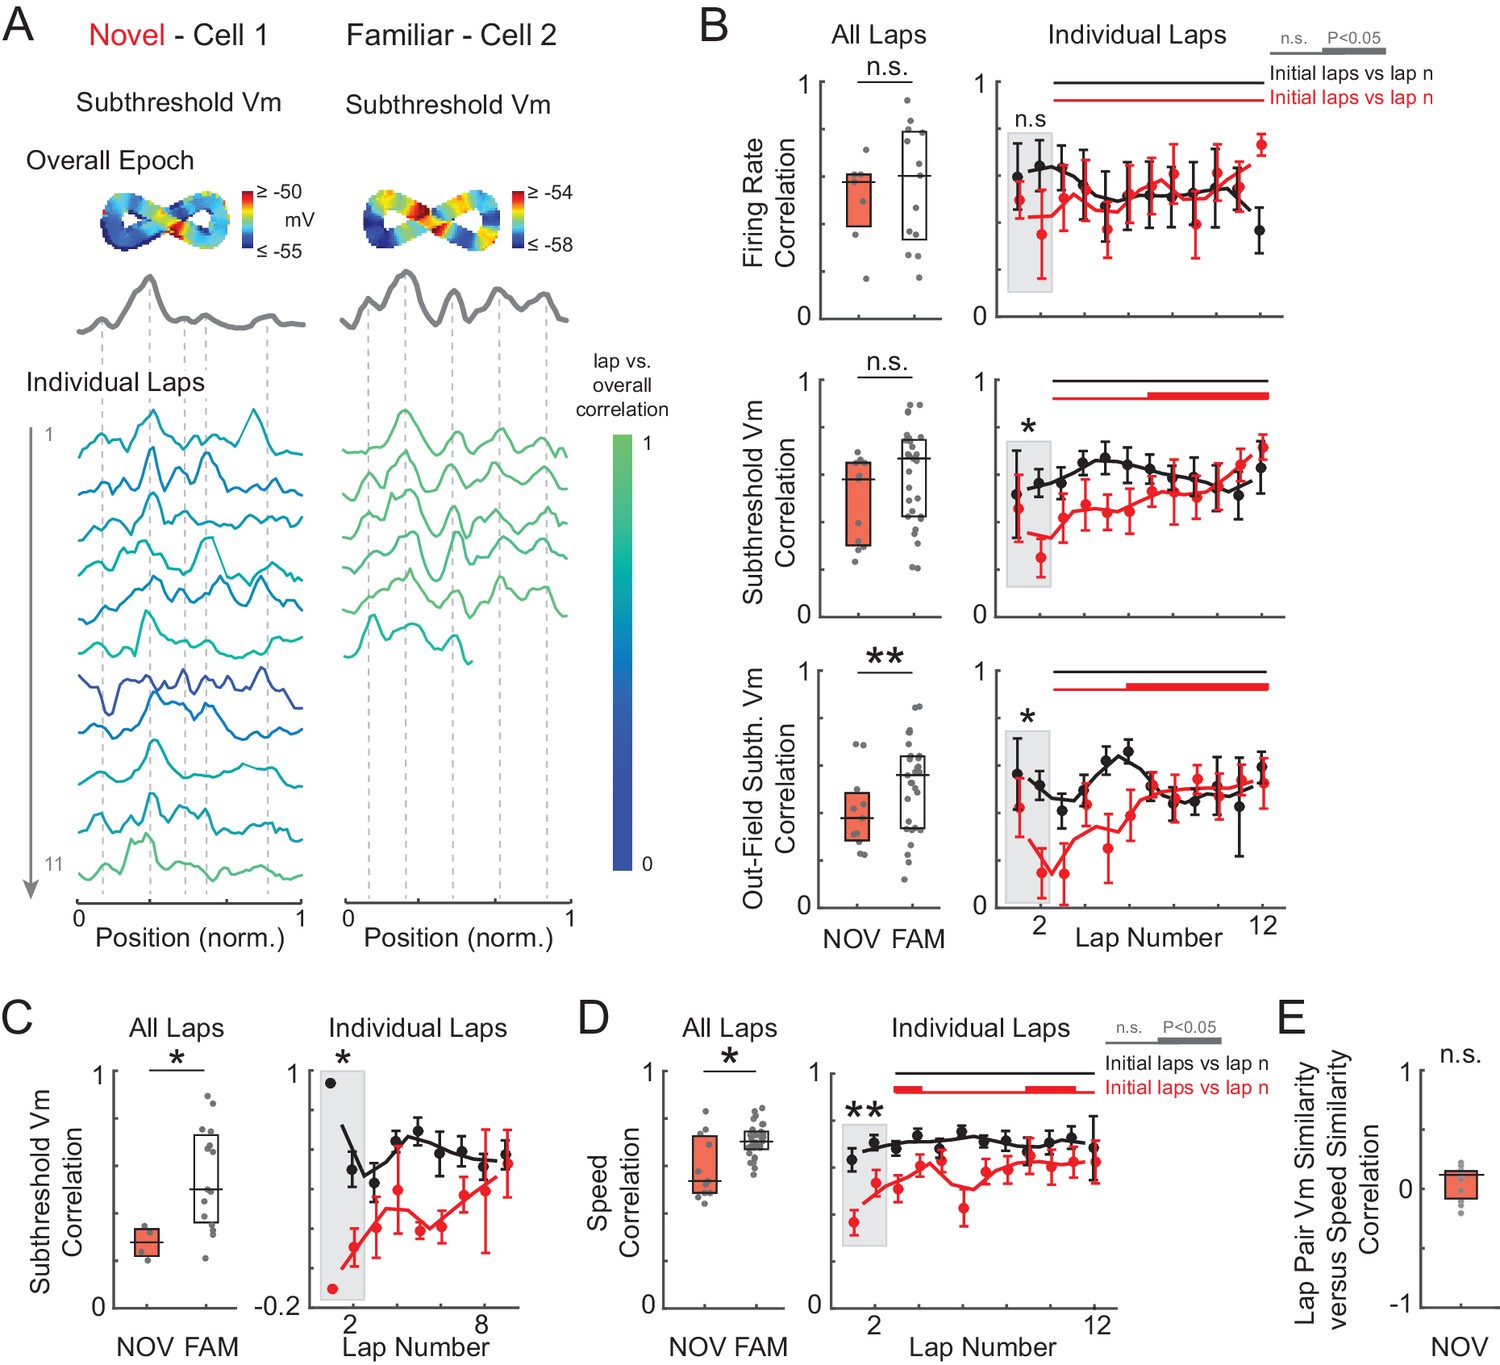
(A) Example of two cells recorded in a novel (left) and familiar (right) maze. AP rate (top) and subthreshold Vm (bottom) activity (normalized to the peak value in each lap) for each lap, color-coded based on the spatial correlation score (Pearson’s r) of the lap’s AP rate or subthreshold Vm profile with the overall epoch profile. (B) Left: Mean spatial correlation of the AP rate (top), subthreshold Vm in all locations (middle), and out-field (i.e., excluding the Vm-defined field region) subthreshold Vm (bottom), averaged across all individual laps shown in the corresponding panels on the right. This includes all cells recorded in a NOV or FAM maze (unpaired, minimum of 4 laps required). Right: Individual lap AP rate (top), subthreshold Vm (middle), and out-field subthreshold Vm (bottom) spatial correlation scores in NOV (red) and FAM (black) mazes (mean ± SE) versus lap number. Gray box highlights the comparison of NOV versus FAM within the initial laps (1-2). Black horizontal lines indicate the significance of unpaired comparisons (two lap smoothing) between the given FAM laps and the initial laps 1–2 in the FAM mazes; thick lines: p<0.05, thin lines: n.s. Similarly, red horizontal lines are for NOV mazes. Note that (B) excludes all first maze epochs experienced by the animal on that day (see text and Figure 5—figure supplements 1 and 3). *p<0.05; **p<0.01.
Figure 5—figure supplement 1
Spatial tuning as a function of experience—additional examples and analyses, including the analysis of silent cells only.
(A) Subthreshold Vm spatial tuning across laps in a novel (left) and familiar (right) epoch, similar to Figure 5A. Note the increase in spatial tuning within the novel epoch, whereas the spatial correlation scores were high from the initial laps in the familiar maze. The cell is silent in this familiar epoch example. (B) Same analysis as Figure 5B except all maze epochs are included. Results show the same trends as Figure 5B. (C) Same as (B, middle panels), but for the subset of epochs in which the cell is silent. Similar to the result including all epochs, the spatial correlation scores increase within novel epochs and are high from the initial laps in familiar mazes. (D) Left: Same as (B, middle panels), but for running speed. (E) Correlation of the running speed correlation score versus the subthreshold Vm correlation score for all pairs of laps in NOV epochs.
Figure 5—figure supplement 2

Stability of activity across laps in novel and familiar mazes, with examples of epochs that do and do not contain complex spikes.
(A–C) Four example epochs. Top: Overall epoch 2-D AP rate map (shown in linearized coordinates below in black) and subthreshold Vm (shown in linearized coordinates below in gray); Middle: Individual lap AP rate (black) and subthreshold Vm (gray); Bottom: Spatial correlation scores (Pearson’s r) for the AP rate (left) and subthreshold Vm (right) activity of each lap versus the corresponding overall epoch activity profiles. AP rate and subthreshold Vm lap activity is normalized to the peak activity value on each lap. Note that Cell 2 (B) expresses low and high mean spatial correlation scores in two different maze epochs (FAM and NOV, respectively). Green asterisk: Place field contains a CS in that lap. Note that the novel epoch shown (B) is the same as that shown in Figure 6A.
Figure 5—figure supplement 3

Excluding the initial maze epoch of the day does not alter the main findings of a novelty-induced enhancement of peak activity as well as other results.
(A)-(J) Excluding the initial maze of the day does not alter results for NOV, FAM, and NOV versus FAM maze epoch comparisons of peak (A)-(D) (where for (B, left) and (D) the peak is determined within the overall epoch Vm-defined field, and for (C) the peak is determined within the place field for NOV-FAM maze pairs in which there was a place field in at least one epoch of the pair) and baseline activity (E)-(F), AP threshold (G), input resistance (H), subthreshold Vm oscillatory power (I)-(K), or the relationship between AP threshold (L) and baseline subthreshold Vm (M) versus mean AP rate. *p<0.05; **p<0.01.
Figure 5—figure supplement 4

Position and shape of the subthreshold Vm hill as a function of experience.
Normalized subthreshold Vm (mean ± SE) for the initial laps 1–2 and late laps 6-end with respect to the normalized position of the overall epoch AP rate field (0–1) for NOV and FAM maze epochs. Center-of-mass (CoM) of each curve marked with vertical lines. Animal running direction from left to right. Note the leftward shift (the direction opposite to the animal’s movement) of the CoM from the initial to late laps within both NOV and FAM epochs, as well as from NOV to FAM epochs.
Figure 6 with 2 supplements
Complex spikes transiently boost spatial responses but are not required for place field formation in novel mazes.
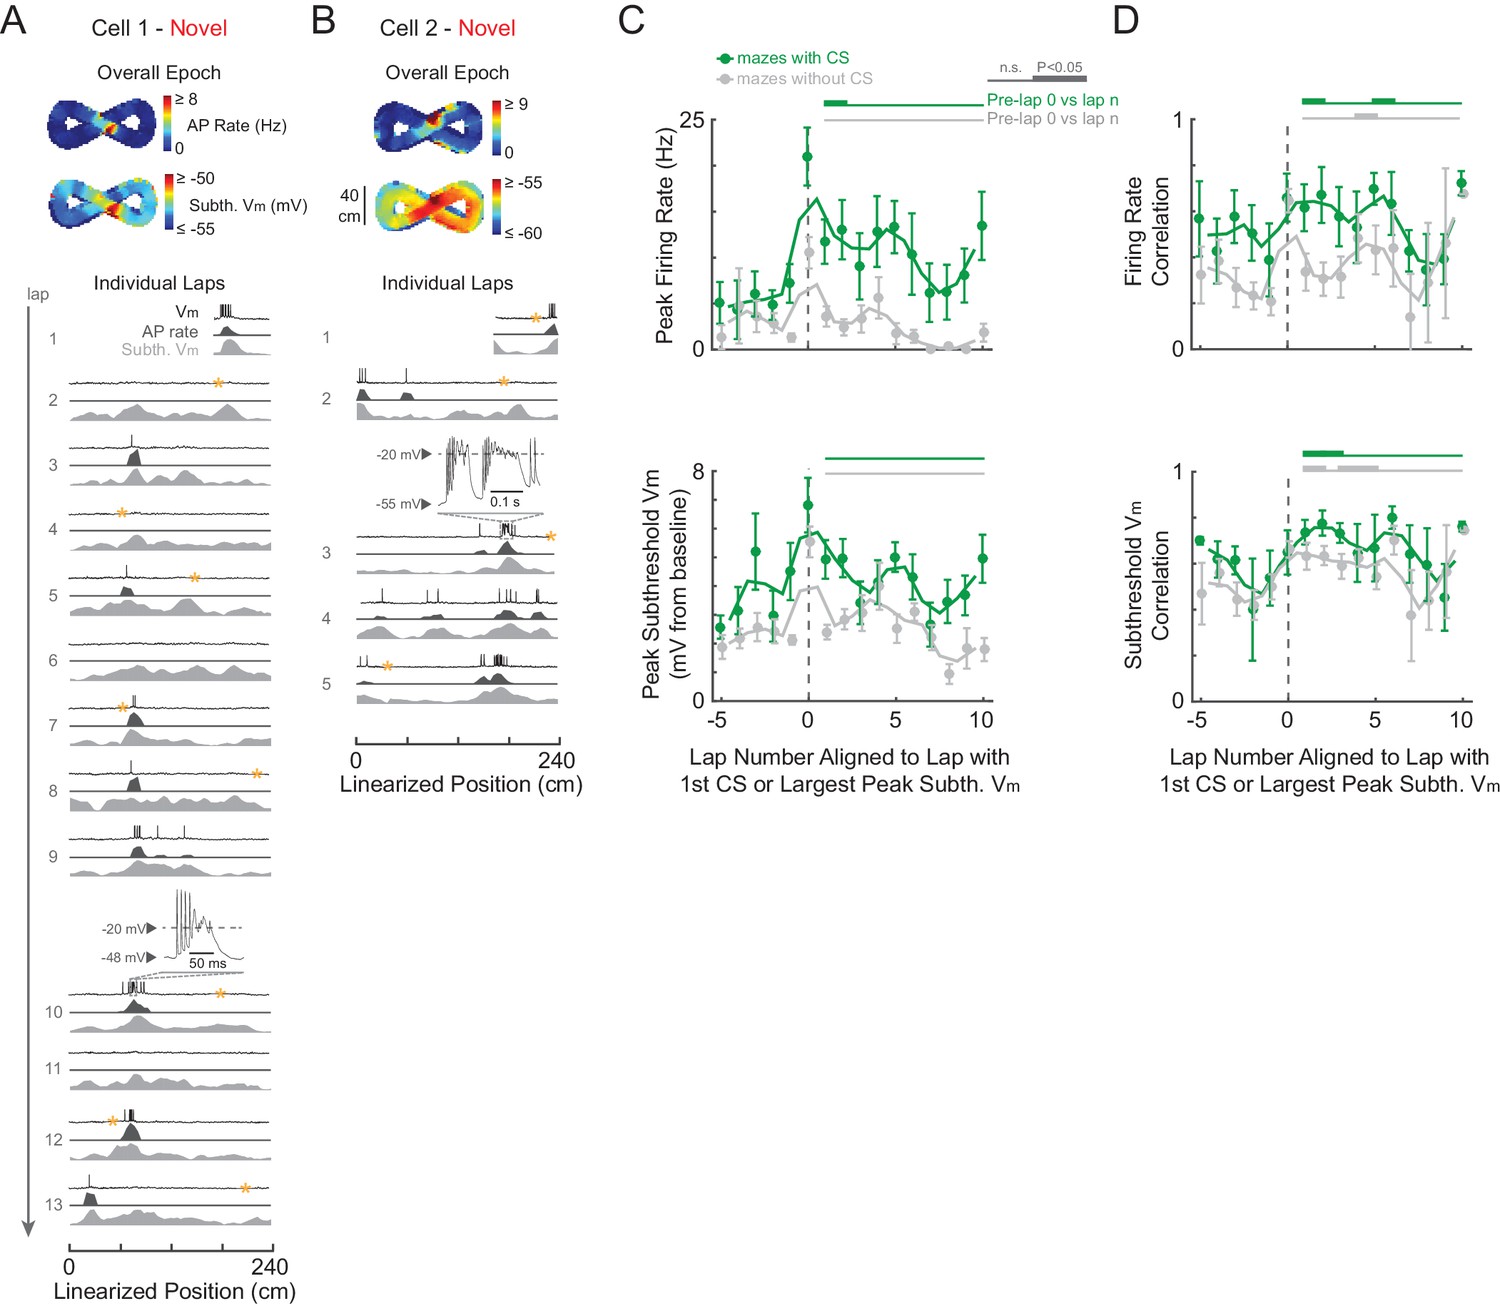
(A)-(B) Example novel maze recordings that contained ≥1 CS in the maze. Overall epoch 2-D AP rate map and subthreshold Vm (above). Individual laps are shown as three traces: Vm (top), AP rate (middle), and subthreshold Vm (bottom), with the location and trace of the first CSs in each maze epoch highlighted. AP rate and subthreshold Vm lap activity is normalized to the peak activity value in each lap. In no cases were CSs evoked by the current injections (asterisks) in (A)-(B). In (A), the place field had already formed before the first CS occurs. In (B), the CS occurs in the lap in which the place field first appears (same epoch as shown in Figure 3C). Note that there were no CSs in the novel maze place field recordings in Figure 2B or Figure 3D. (C) Peak AP rate (top) and subthreshold Vm (bottom) for individual laps aligned (lap = 0) to the lap containing the first CS in the maze epoch for those epochs with a CS (green) or containing the largest peak subthreshold Vm for those epochs without a CS (gray), then pooled across NOV and FAM maze epochs. Peak activity determined from the region (±3 spatial bins) surrounding the CS or peak subthreshold Vm location. Mean ± SE. Green horizontal lines indicate the significance of paired comparisons (two lap smoothing) between the given laps and the mean of the pre-CS (pre-lap 0) laps; thick lines: p<0.05, thin lines: n.s. Similarly, gray horizontal lines are for epochs without a CS. (D) Same as (C) for AP rate (top) and subthreshold Vm (bottom) spatial correlation scores (Pearson’s r).
Figure 6—figure supplement 1
Properties of intracellular complex spikes in novel and familiar mazes.
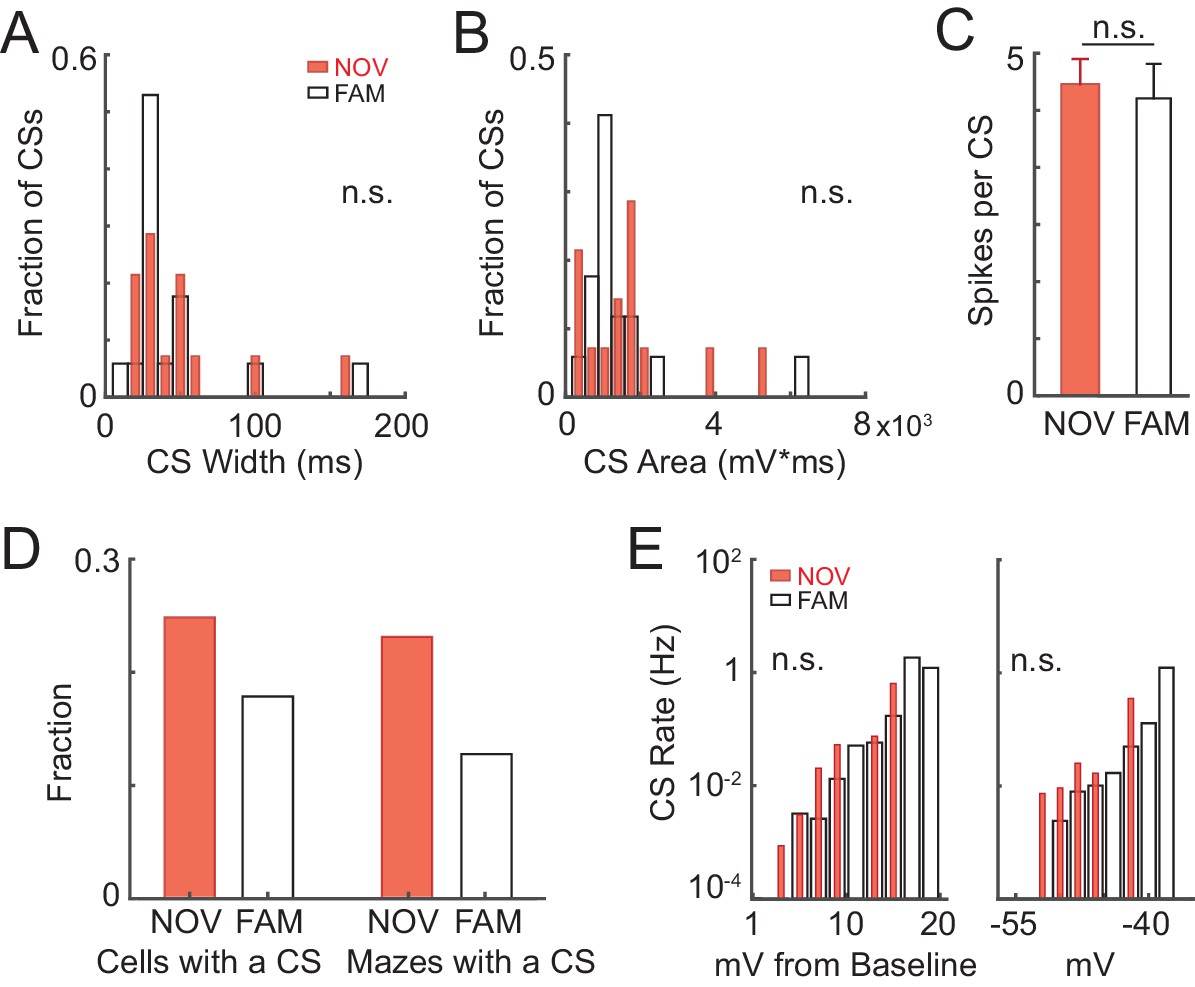
(A)-(C) CS width (at half-maximum, ms) (A), CS area (mV*ms) (B), and number of spikes per CS (C) (mean ± SE) for all CSs in NOV and FAM mazes. (D) Left: Fraction of cells recorded in NOV and FAM mazes that had at least one CS in a NOV or FAM maze. Right: Fraction of all NOV and FAM maze epochs in which at least one CS occurred in the maze. (E) CS rate as a function of relative (to lap baseline, left) and absolute (right) subthreshold Vm. Here, subthreshold Vm is computed as the mean value in 150 ms windows (sliding every 10 ms).
Figure 6—figure supplement 2
Complex spikes in a familiar maze.
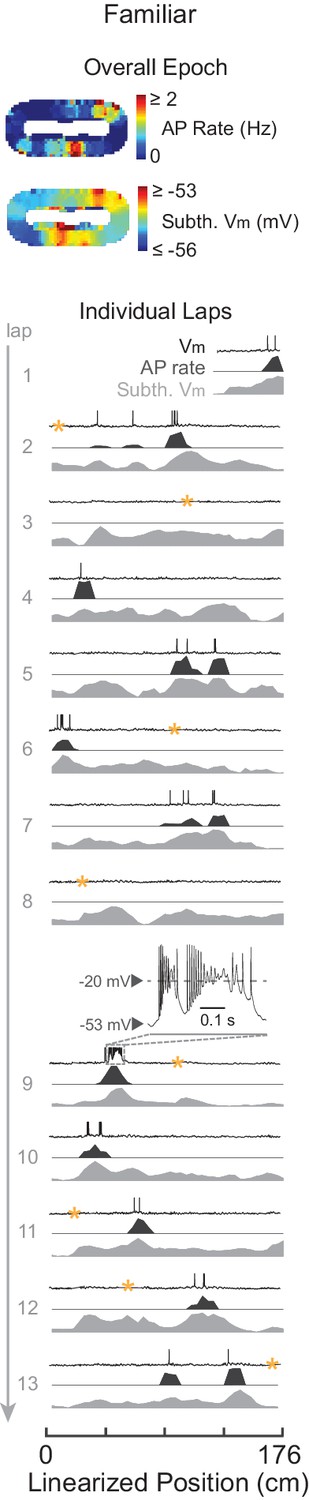
Example familiar maze recording that contained ≥1 CS in the maze. Overall epoch 2-D AP rate map and subthreshold Vm (above). Individual laps are shown as three traces: Vm (top), AP rate (middle), and subthreshold Vm (bottom), with the location and trace of the first CS in the maze epoch highlighted. AP rate and subthreshold Vm lap activity is normalized to the peak activity value in each lap. In this example, the CS did not stabilize the location of the place field. CSs occurred in five other familiar epochs (in four cases spiking activity was already stable before the CS, and in the other case the CS occurred in the first lap that the place field appeared).
Figure 7
Summary of intracellular features underlying the formation of hippocampal CA1 place cell representations.
Schematic based on findings from this study (compare to Figure 1). During novel exploration (left), the subthreshold Vm depolarization underlying place fields grows in amplitude. This increase in amplitude is not sustained as the environment becomes more familiar (right). However, the spatial tuning of inputs, which is initially lower in all locations of novel mazes, stabilizes during novel exploration, both inside and outside of the place field. The higher AP rate in novel environments is due to the larger amplitude subthreshold depolarizations, as no differences were observed in the baseline Vm or somatic excitability (e.g., AP threshold). CSs occur in a fraction of novel maze epochs and the appearance of place fields in novel environments does not require CSs. Thus, stable representations of familiar mazes are supported by the emergence of less strongly modulated, but more repeatable, spatially tuned subthreshold inputs.
Tables
Table 1
Details of the individual cells and maze epochs. The ‘P’ and ‘N’ for epochs in mazes which the animal explored in both directions denote the two directions (i.e. moving in the direction of positive and negative changes in position value). The ‘#” indicates epochs that were excluded from analysis because their place fields appear to have been attributable to experimenter manipulations (e.g. inadvertent triggering of a CS during a current step used to probe series and input resistance and evoked spiking response), and thus their place field properties could not be assumed to be those of spontaneously occurring place fields. These epochs were however included in the analysis of Figure 6C–D since one can still assess the effect of any spontaneous CSs they displayed. The ‘##” marks an epoch in which the AP threshold could not be measured because all APs in the epoch contained a shoulder (see Materials and methods).
| Cell # | Epoch # | Maze | # Prev. Maze Sessions | Rec. dur. (s) | # Laps | Subth. vm baseline (mV) | Subth. vm peak (mV) | AP rate peak (Hz) | AP rate mean (Hz) | AP threshold (mV) | Input R. (MOhm) | AP rate Infield-Outfield ratio | Place field (0=No, 1=Yes) |
|---|---|---|---|---|---|---|---|---|---|---|---|---|---|
| 1 | 1 | 'O' | ≥39 | 106.5 | 7 | −61.3 | 1.4 | 0.00 | 0.00 | N/A | 147.5 | N/A | N/A |
| 1 | 2 | '8' | 0 | 282.7 | 17 | −60.3 | 2.4 | 0.00 | 0.00 | N/A | 197.0 | N/A | N/A |
| 2 | 1 | 'O' | ≥39 | 99.7 | 5 | −56.9 | 1.2 | 0.00 | 0.00 | N/A | 88.8 | N/A | N/A |
| 2 | 3P | 'l' | ≥19 | 209.0 | 3 | −54.0 | 2.8 | 0.00 | 0.00 | N/A | N/A | N/A | N/A |
| 2 | 3N | 'l' | ≥19 | 2 | −53.7 | 2.1 | 0.00 | 0.00 | N/A | N/A | N/A | N/A | |
| 3 | 1 | 'O' | ≥39 | 171.5 | 6 | −56.5 | 1.9 | 2.32 | 0.59 | −48.5 | 77.7 | 6.1 | 1 |
| 3 | 2 | '8' | 1 | 124.3 | 5 | −55.4 | 1.7 | 4.14 | 1.68 | −49.4 | 195.3 | 1.7 | 0 |
| 4 | 2 | '8' | 0 | 807.7 | 13 | −52.8 | 1.1 | 1.35 | 0.44 | −48.1 | 58.1 | 2.1 | 0 |
| 5 | 1 | 'O' | ≥39 | 115.5 | 5 | −62.6 | 1.3 | 0.00 | 0.00 | N/A | 120.3 | N/A | N/A |
| 6 | 1 | 'O' | ≥39 | 103.1 | 8 | −57.2 | 2.0 | 0.00 | 0.00 | N/A | 83.6 | N/A | N/A |
| 6 | 2P | 'L' | 0 | 587.7 | 12 | −53.3 | 2.3 | 2.67 | 0.78 | −40.4 | 23.9 | 4.5 | 1 |
| 6 | 2N | 'L' | 0 | 12 | −53.6 | 1.7 | 0.89 | 0.38 | −40.4 | 23.9 | 7.1 | 1 | |
| 7 | 1 | 'O' | ≥39 | 96.6 | 8 | −66.1 | 1.4 | 0.00 | 0.00 | N/A | 83.4 | N/A | N/A |
| 7 | 2 | '8' | 1 | 147.7 | 9 | −66.4 | 1.9 | 0.00 | 0.00 | N/A | 86.8 | N/A | N/A |
| 7 | 3P | 'l' | ≥19 | 124.4 | 5 | −66.6 | 3.0 | 0.00 | 0.00 | N/A | 69.0 | N/A | N/A |
| 7 | 3N | 'l' | ≥19 | 5 | −65.6 | 2.0 | 0.00 | 0.00 | N/A | 69.0 | N/A | N/A | |
| 8 | 1 | 'O' | ≥39 | 174.9 | 6 | −54.7 | 1.6 | 0.80 | 0.07 | N/A | N/A | 32.6 | 0 |
| 9 | 2 | '8' | 0 | 121.0 | 6 | −59.4 | 1.1 | 0.00 | 0.00 | N/A | 68.9 | N/A | N/A |
| 10 | 1 | 'O' | ≥39 | 143.9 | 5 | −57.0 | 2.0 | 6.58 | 1.36 | N/A | 128.0 | 3.9 | 1 |
| 11 | 1 | 'O' | ≥39 | 57.5 | 6 | −57.8 | 1.1 | 0.00 | 0.00 | N/A | 117.3 | N/A | N/A |
| 11 | 2# | '8' | 0 | 1058.3 | 9 | −55.7 | 7.9 | 12.05 | 0.89 | −42.2 | 112.7 | 35.5 | 1 |
| 12 | 1 | 'O' | ≥39 | 248.1 | 16 | −55.3 | 2.2 | 2.89 | 1.51 | −47.3 | 83.8 | 14.5 | 1 |
| 12 | 2P | 'l' | ≥19 | 67.5 | 4 | −55.9 | 3.9 | 9.52 | 2.57 | −46.0 | 73.6 | 3.7 | 1 |
| 12 | 2N | 'l' | ≥19 | 3 | −55.6 | 3.4 | 14.08 | 4.14 | −46.0 | 73.6 | 3.3 | 1 | |
| 13 | 1 | '8' | 0 | 1012.1 | 27 | −57.5 | 3.3 | 11.26 | 2.02 | −52.8 | 145.1 | 6.7 | 1 |
| 14 | 1 | 'O' | ≥39 | 224.8 | 13 | −54.9 | 1.7 | 2.10 | 0.80 | N/A | 69.0 | 1.5 | 0 |
| 14 | 2 | '8' | 1 | 367.1 | 21 | −55.6 | 3.6 | 8.46 | 0.75 | −48.0 | 55.4 | 25.7 | 1 |
| 14 | 3 | 'O' | ≥39 | 250.2 | 19 | −55.4 | 1.7 | 1.69 | 0.45 | −48.0 | 45.1 | 3.3 | 1 |
| 14 | 4 | '8' | 2 | 428.4 | 25 | −55.0 | 2.3 | 1.49 | 0.22 | −43.8 | 55.3 | 6.6 | 1 |
| 14 | 5P | 'l' | ≥19 | 203.5 | 9 | −53.9 | 2.2 | 0.22 | 0.02 | −45.3 | 100.9 | 20.0 | 0 |
| 14 | 5N | 'l' | ≥19 | 9 | −53.9 | 1.7 | 2.31 | 0.22 | −45.3 | 100.9 | 34.3 | 1 | |
| 15 | 1 | 'O' | ≥39 | 37.6 | 4 | −60.5 | 1.5 | 0.00 | 0.00 | N/A | 40.4 | N/A | N/A |
| 15 | 2 | '8' | 0 | 505.6 | 26 | −54.2 | 3.8 | 7.56 | 1.00 | −47.5 | 49.9 | 15.3 | 1 |
| 15 | 3 | 'O' | ≥39 | 199.5 | 18 | −47.8 | 1.9 | 3.02 | 1.08 | −43.7 | 57.4 | 3.0 | 1 |
| 16 | 1 | 'O' | ≥39 | 99.7 | 6 | −58.8 | 2.5 | 0.50 | 0.04 | N/A | 59.8 | 29.4 | 0 |
| 16 | 2# | '8' | 1 | 302.6 | 20 | −57.0 | 3.2 | 8.86 | 2.48 | −50.4 | 56.8 | 3.2 | 1 |
| 16 | 3 | 'O' | ≥39 | 198.2 | 8 | −58.8 | 3.9 | 3.79 | 0.45 | −51.5 | 49.9 | 13.9 | 1 |
| 16 | 4# | '8' | 2 | 271.3 | 13 | −54.3 | 4.6 | 14.51 | 4.06 | −50.7 | 39.9 | 5.0 | 1 |
| 16 | 5 | 'O' | ≥39 | 306.0 | 7 | −57.4 | 3.0 | 2.67 | 0.55 | −50.6 | N/A | 5.5 | 1 |
| 16 | 6# | '8' | 3 | 421.1 | 17 | −61.5 | 2.9 | 3.45 | 0.42 | N/A | N/A | 23.3 | 1 |
| 17 | 1P | 'l' | ≥19 | 604.2 | 9 | −52.5 | 6.6 | 7.99 | 1.53 | −47.0 | 42.6 | 7.5 | 1 |
| 17 | 1N | 'l' | ≥19 | 10 | −52.3 | 3.6 | 21.46 | 4.64 | −47.0 | 42.6 | 11.4 | 1 | |
| 18 | 1 | 'O' | ≥39 | 47.3 | 4 | −61.2 | 1.7 | 0.00 | 0.00 | N/A | N/A | N/A | N/A |
| 19 | 1 | 'O' | ≥39 | 191.9 | 4 | −56.7 | 2.6 | 0.48 | 0.03 | N/A | N/A | Inf | 0 |
| 19 | 2 | '8' | 0 | 221.2 | 3 | −64.3 | 1.6 | 0.00 | 0.00 | N/A | N/A | N/A | N/A |
| 20 | 1 | 'O' | ≥39 | 154.7 | 9 | −61.6 | 1.2 | 0.00 | 0.00 | N/A | 140.6 | N/A | N/A |
| 20 | 2 | '8' | ≥19 | 65.2 | 3 | −63.8 | 3.0 | 0.00 | 0.00 | N/A | 196.1 | N/A | N/A |
| 21 | 1 | 'O' | ≥39 | 169.6 | 10 | −54.9 | 0.8 | 0.54 | 0.04 | N/A | 169.4 | 79.0 | 0 |
| 21 | 2 | '8' | ≥19 | 60.1 | 3 | −53.1 | 1.0 | 0.00 | 0.00 | N/A | N/A | N/A | N/A |
| 22 | 1 | 'O' | ≥39 | 149.2 | 9 | −57.2 | 1.6 | 0.23 | 0.01 | −44.6 | 76.8 | Inf | 0 |
| 22 | 2 | '8' | ≥19 | 137.9 | 5 | −55.6 | 1.7 | 0.00 | 0.00 | N/A | N/A | N/A | N/A |
| 23 | 1 | 'O' | ≥39 | 233.1 | 5 | −63.1 | 3.0 | 0.00 | 0.00 | N/A | N/A | N/A | N/A |
| 23 | 2 | '8' | ≥19 | 206.1 | 4 | −47.4 | 2.3 | 7.49 | 2.47 | −44.3 | 183.5 | 3.1 | 1 |
| 24 | 1 | 'O' | ≥39 | 295.6 | 8 | −48.2 | 1.6 | 3.96 | 1.41 | −46.4 | 159.3 | 2.7 | 0 |
| 24 | 2 | '8' | ≥19 | 384.7 | 5 | −49.6 | 5.8 | 14.50 | 2.73 | N/A | N/A | 5.4 | 1 |
| 25 | 1 | 'O' | ≥39 | 175.8 | 9 | −58.1 | 2.4 | 1.17 | 0.07 | −43.2 | 85.6 | Inf | 0 |
| 25 | 3P | 'L' | 0 | 1214.3 | 10 | −56.4 | 1.2 | 0.09 | 0.01 | −46.0 | 80.8 | Inf | 0 |
| 25 | 3N | 'L' | 0 | 11 | −56.5 | 3.4 | 1.90 | 0.46 | −46.0 | 80.8 | 31.5 | 0 | |
| 26 | 1 | 'O' | ≥39 | 53.2 | 3 | −60.6 | 2.5 | 0.00 | 0.00 | N/A | N/A | N/A | N/A |
| 27 | 1 | 'O' | ≥39 | 77.9 | 4 | −52.0 | 8.4 | 12.61 | 3.61 | −44.9 | 77.4 | 3.6 | 1 |
| 27 | 2 | '8' | ≥19 | 399.4 | 4 | −53.5 | 8.2 | 14.84 | 3.06 | −44.9 | N/A | 4.0 | 1 |
| 27 | 3 | 'O' | ≥39 | 105.2 | 8 | −56.4 | 3.8 | 4.26 | 0.81 | −46.6 | 67.1 | 4.3 | 1 |
| 27 | 4 | '8' | ≥19 | 112.8 | 6 | −57.8 | 3.9 | 0.57 | 0.03 | N/A | N/A | Inf | 0 |
| 28 | 2 | '8' | ≥19 | 217.2 | 4 | −55.4 | 2.5 | 0.76 | 0.06 | −41.4 | 145.7 | 23.3 | 1 |
| 29 | 1 | 'O' | ≥39 | 135.3 | 7 | −59.4 | 1.7 | 0.00 | 0.00 | N/A | 75.4 | N/A | N/A |
| 30 | 1 | 'O' | ≥39 | 141.7 | 6 | −60.9 | 1.2 | 0.00 | 0.00 | N/A | 43.4 | N/A | N/A |
| 31 | 2 | '8' | ≥19 | 82.4 | 3 | −56.0 | 1.5 | 0.00 | 0.00 | N/A | N/A | N/A | N/A |
| 32 | 2 | '8' | ≥19 | 159.9 | 5 | −55.2 | 2.5 | 4.66 | 0.82 | −48.3 | 124.4 | 4.6 | 1 |
| 32 | 3P | 'L' | 0 | 378.1 | 14 | −53.8 | 3.0 | 11.95 | 3.29 | N/A## | 145.1 | 3.1 | 1 |
| 32 | 3N | 'L' | 0 | 14 | −53.7 | 2.7 | 5.43 | 1.55 | N/A## | 145.1 | 3.1 | 1 |
Download links
A two-part list of links to download the article, or parts of the article, in various formats.
Downloads (link to download the article as PDF)
Open citations (links to open the citations from this article in various online reference manager services)
Cite this article (links to download the citations from this article in formats compatible with various reference manager tools)
Experience-dependent shaping of hippocampal CA1 intracellular activity in novel and familiar environments
eLife 6:e23040.
https://doi.org/10.7554/eLife.23040


