Ambra1 spatially regulates Src activity and Src/FAK-mediated cancer cell invasion via trafficking networks
- University of Edinburgh, United Kingdom
- Royal Free Hospital Campus, United Kingdom
- University of Glasgow, United Kingdom
- University College Dublin, Ireland
- University of Tor Vergata, Via della Ricerca Scientifica, Italy
- Danish Cancer Society Research Center, Denmark
- IRCSS Bambino Gesu Children's Hospital, Italy
Figures
Figure 1 with 2 supplements
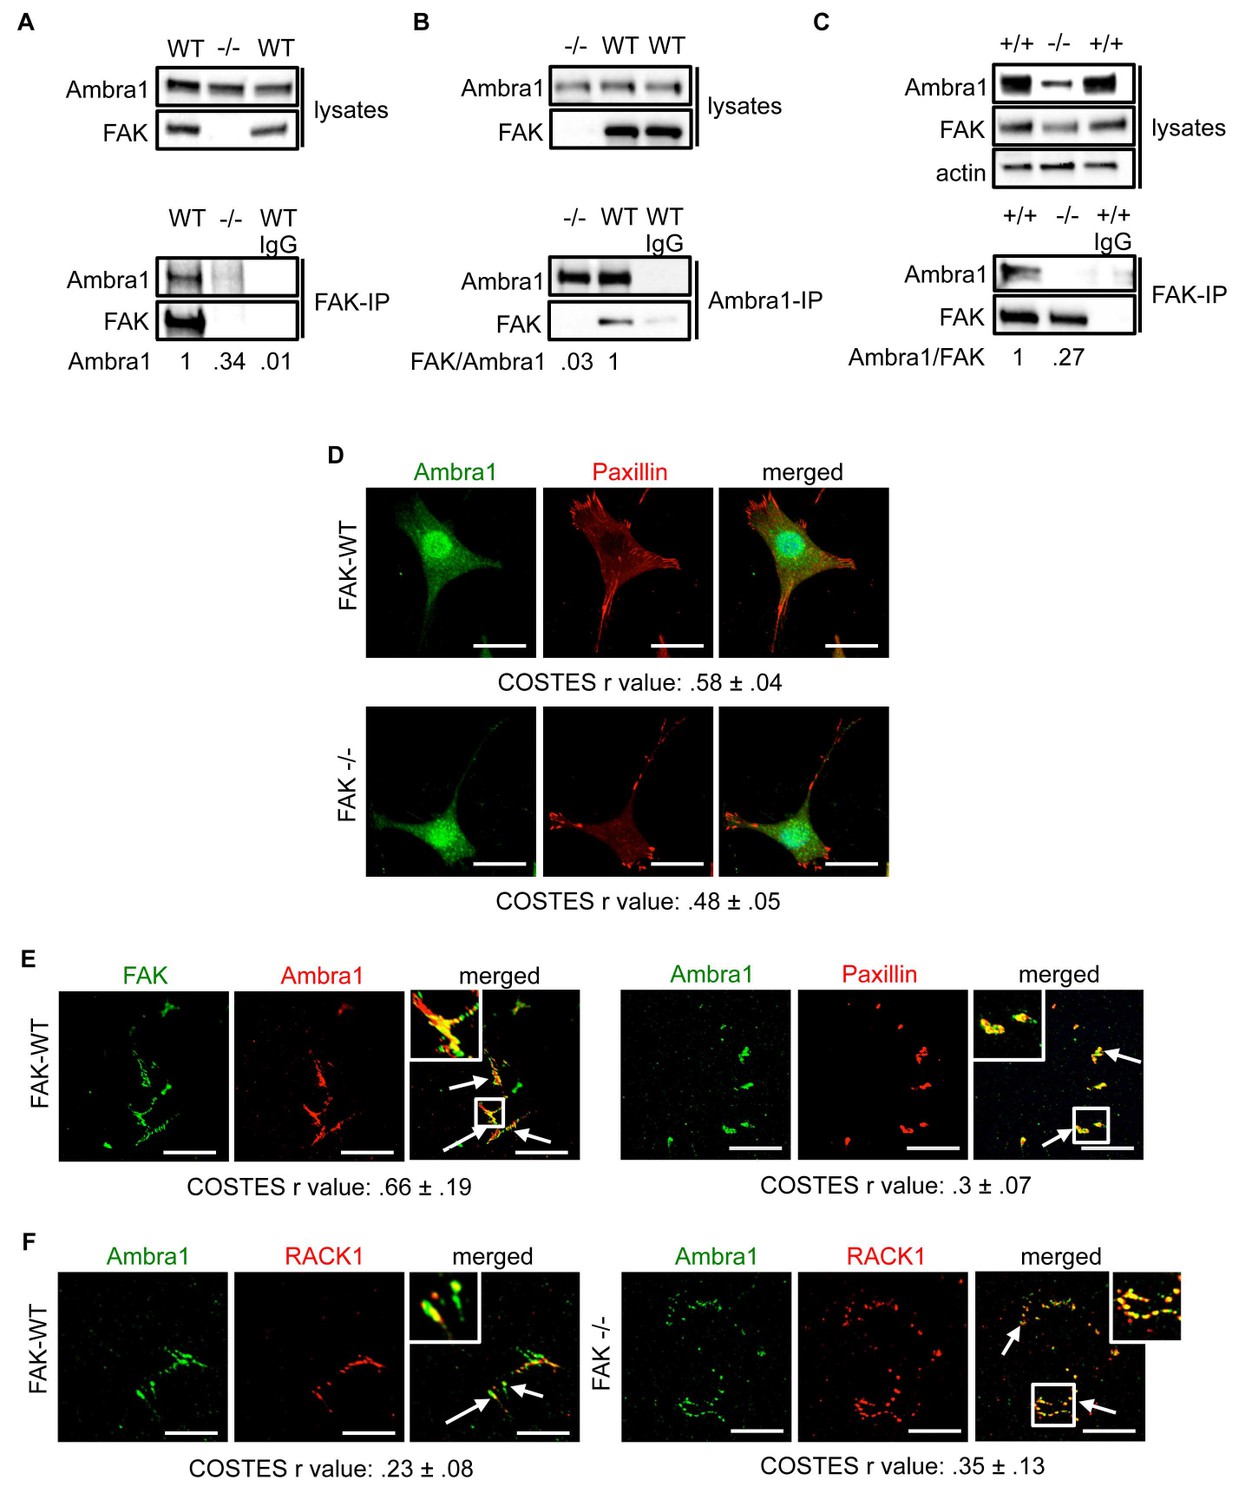
Ambra1 interacts with FAK at focal adhesions.
FAK or Ambra1 were immunoprecipitated from FAK-WT and FAK -/- cell lysates using (A) anti-FAK 4.47 agarose or (B) anti-Ambra1, followed by western blot analysis with anti-FAK and anti-Ambra1. (C) FAK was immunoprecipitated from Ambra1 +/+ and Ambra1 -/- MEF cell lysates using anti-FAK 4.47 agarose, followed by western blot analysis with anti-FAK and anti-Ambra1. Anti-β-actin was used as a loading control. Relative ratios of Ambra1, FAK/Ambra1 and Ambra1/FAK interactions were calculated by densitometry. (D) FAK-WT and FAK -/- cells were seeded onto glass coverslips, fixed and stained using anti-Ambra1 and anti-Paxillin. Scale bars, 20 μm. (E, F) Focal adhesions were isolated from FAK-WT and FAK -/- cells using hydrodynamic force. (E) Focal adhesions (solid arrows) were stained with anti-FAK and anti-Ambra1 (left panels) and with anti-Ambra1 and anti-Paxillin (right panels). (F) Focal adhesions (solid arrows) were stained with anti-Ambra1 and anti-Rack1 in SCC FAK-WT (left panels) and SCC FAK -/- cells (right panels). Scale bars, 20 μm. Colocalisation (Costes r value from five cells) was analysed using the ImageJ plugin JaCoP (Bolte and Cordelières, 2006).
-
Figure 1—source data 1
COSTES r values for immunofluorescence images.
COSTES mean and s.d. values for Figure 1D–F are shown.
- https://doi.org/10.7554/eLife.23172.004
Figure 1—figure supplement 1
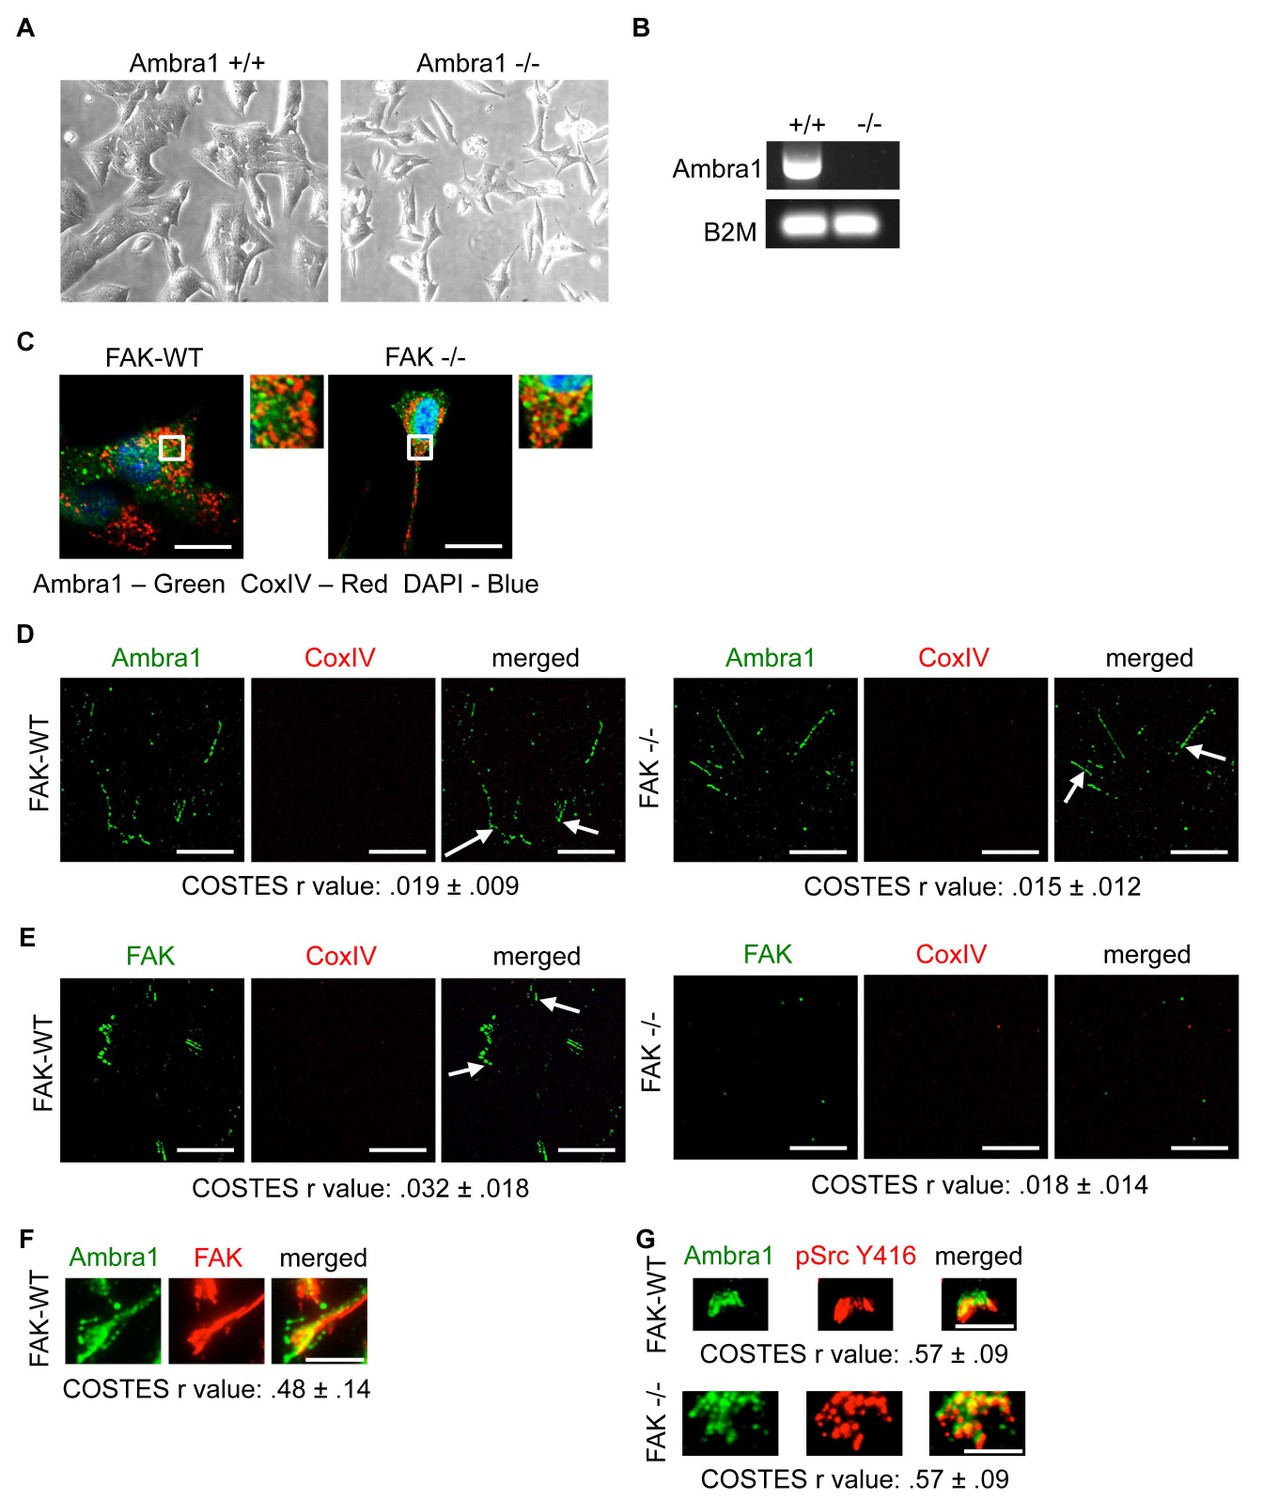
Ambra1 +/+ and -/- mouse embryonic fibroblasts (MEFs).
(A) Representative images of Ambra1 +/+ and Ambra1 -/- MEFs. (B) PCR of Ambra1 +/+ and Ambra1 -/- MEFs. B2M served as a control for equal input. (C) SCC FAK-WT and FAK -/- cells were grown on glass coverslips for 24 hr, fixed and stained with anti-Ambra1, anti-CoxIV and DAPI. (D, E) Focal adhesions were isolated from FAK-WT and FAK -/- cells using hydrodynamic force. Focal adhesions (solid arrows) were stained with anti-Ambra1 and anti-CoxIV (D) or anti-FAK and anti-CoxIV (E) in SCC FAK-WT (left panels) and SCC FAK -/- cells (right panels). Scale bars, 20 μm. Colocalisation (Costes r value from five cells) was analysed using the ImageJ plugin JaCoP. (F, G) Total Internal Reflection Fluorescence (TIRF) microscopy of SCC FAK-WT and -/- cells stained with anti-Ambra1 and anti-FAK (F) or anti-Ambra1 and anti-pSrc Y416. (G) Colocalisation (COSTES r value of five cells) was analysed using the ImageJ plugin JaCoP. Scale bars, 10 μm.
Figure 1—figure supplement 2
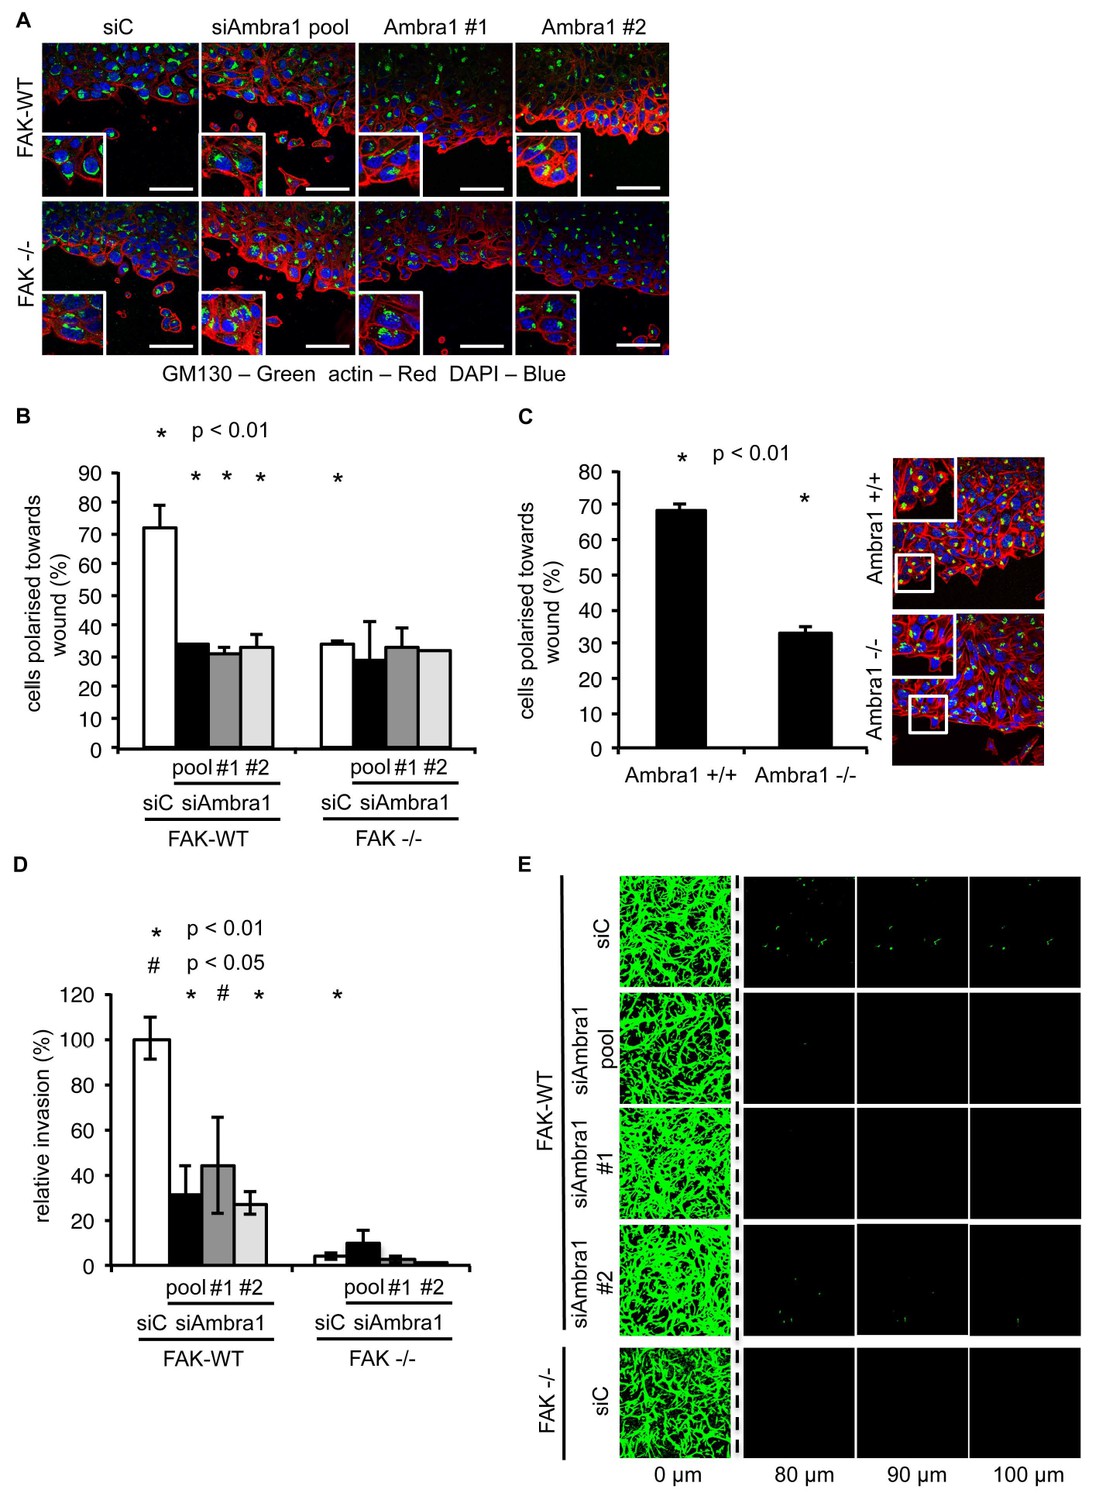
Knockdown of Ambra1 suppresses FAK phenotypes.
(A) Polarity assay: FAK-WT and FAK -/- cells were transiently transfected with either a pool or two independent Ambra1 siRNAs. A confluent monolayer of cells plated on fibronectin was wounded using a pipette tip, fixed 1.5 hr later and stained with anti-GM130 (Golgi), TRITC-phalloidin and DAPI. The orientation of the Golgi towards to wound edge was used to score polarisation. Scale bars, 20 μm. (B) Quantification of the polarity assay in SCC FAK-WT and -/- cells. n = 3. Error bars, s.d. p<0.01. (C) Polarity assay in Ambra1 +/+ and -/- MEFs. n = 3. Error bars, s.d. p<0.01. (D, E) Invasion assay: Cells were seeded on growth factor-reduced Matrigel in serum-free conditions. After 72 hr invasion towards a serum gradient, cells were visualised by staining with calcein. (D) Quantification of the invasion assay. n = 5. Error bars, s.e.m. p<0.01 (*) and p<0.05 (#). (E) Representative images of the invasion assay.
Figure 2 with 1 supplement
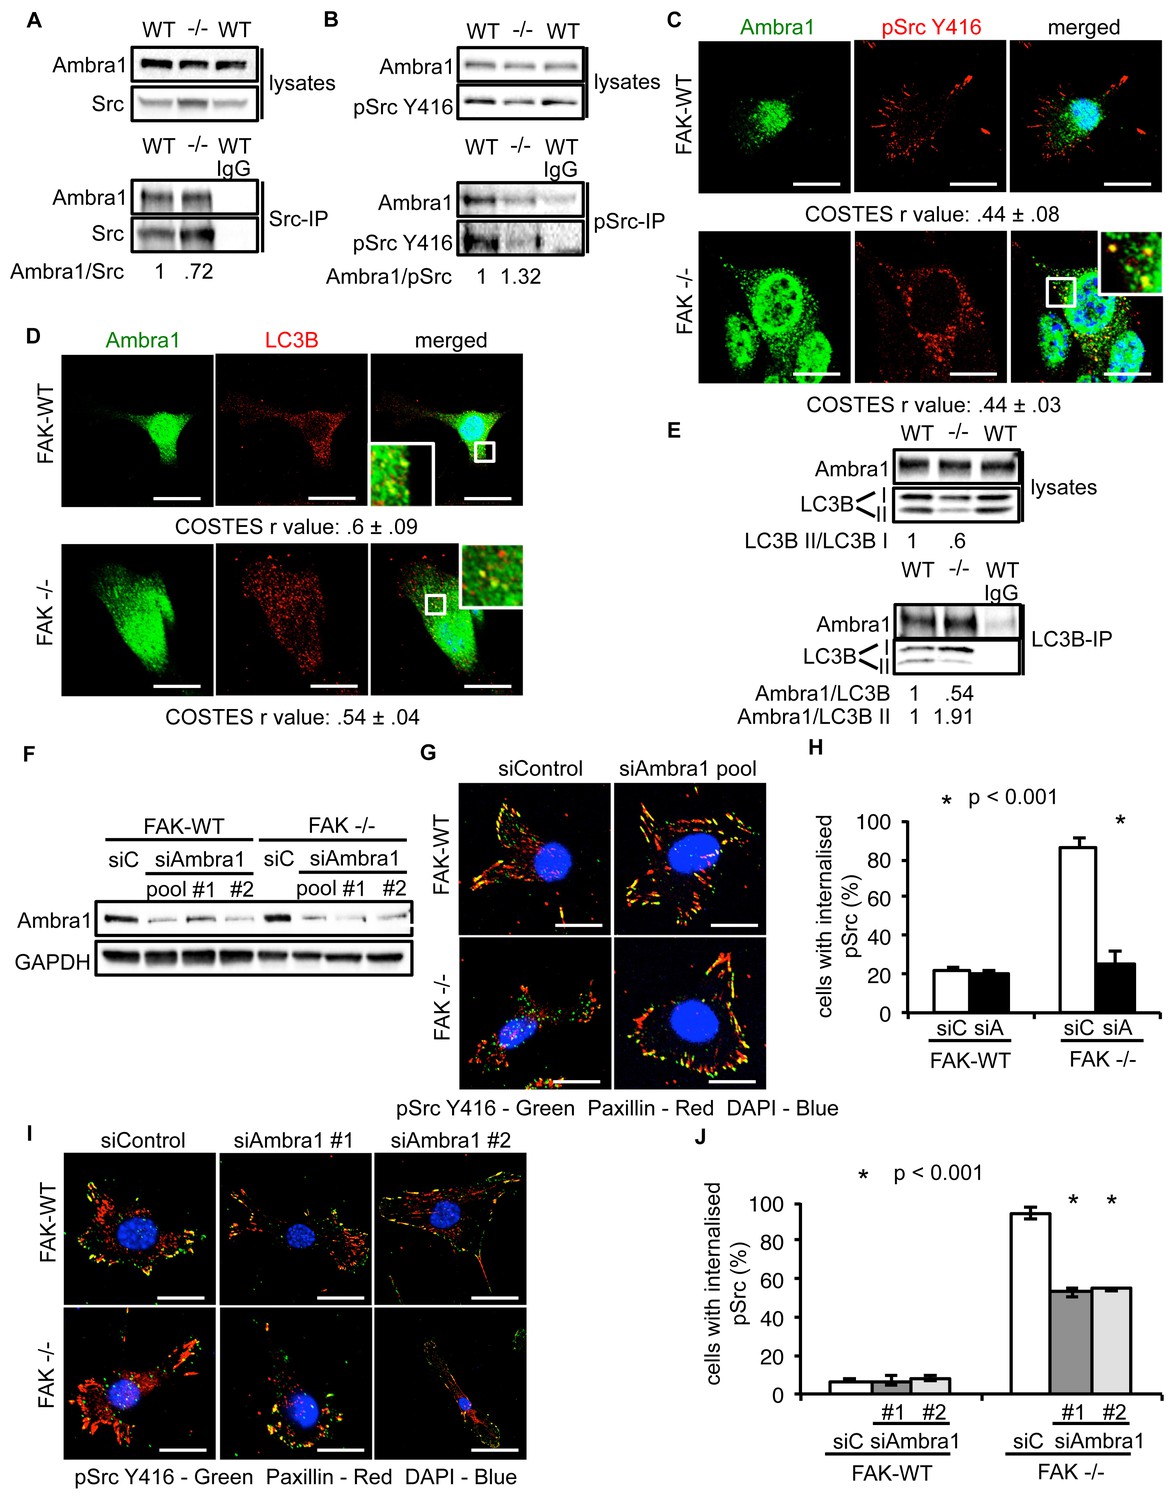
Ambra1 interacts with Src and mediates trafficking of active Src to autophagosomes.
(A, B) Src (A) or pSrc Y416 (B) were immunoprecipitated from FAK-WT and FAK -/- cell lysates using anti-Src agarose or anti-pSrc Y416 antibody, followed by western blot analysis with anti-Ambra1, anti-pSrc Y416 and anti-Src. Relative ratios of Ambra1/Src and Ambra1/pSrc interactions were calculated by densitometry. (C) FAK-WT and FAK -/- cells were seeded onto glass coverslips, fixed and stained using anti-pSrc Y416, anti-Ambra1 and DAPI. Scale bars, 20 μm. (D) SCC FAK-WT and FAK -/- cells were grown on glass coverslips, fixed and stained with anti-Ambra1, anti-LC3B and DAPI. Scale bars, 20 μm. (E) LC3B was immunoprecipitated from SCC FAK-WT and FAK -/- cell lysates using anti-LC3B, followed by western blot analysis with anti-Ambra1 and anti-LC3B. Relative ratios of LC3B II/LC3B I as well as the Ambra1/LC3B and Ambra1/LC3B II interactions were calculated by densitometry. (F–J) SCC FAK-WT and FAK -/- cells were transiently transfected with either a pool (F–H) or two individual siAmbra1 siRNAs (F, I, J). The cells were grown on glass coverslips, fixed and stained with anti-pSrc Y416, anti-Paxillin and DAPI. (G, I) Representative immunofluorescence images. Scale bars, 20 μm. (H, J) Quantification of internalised active Src. n = 3. Error bars, s.d. p<0.001. Colocalisation (Costes r value from five cells) was analysed using the ImageJ plugin JaCoP.
-
Figure 2—source data 1
COSTES r values for immunofluorescence images and percentage of cells with internalised pSrc.
COSTES mean and s.d. values for Figures 2C and D are shown. Mean percentage and s.d. values of cells with internalised pSrc upon transient Ambra1 knockdown by siRNA in SCC FAK-WT and -/- cells are shown (Figures 2H,J).
- https://doi.org/10.7554/eLife.23172.008
Figure 2—figure supplement 1
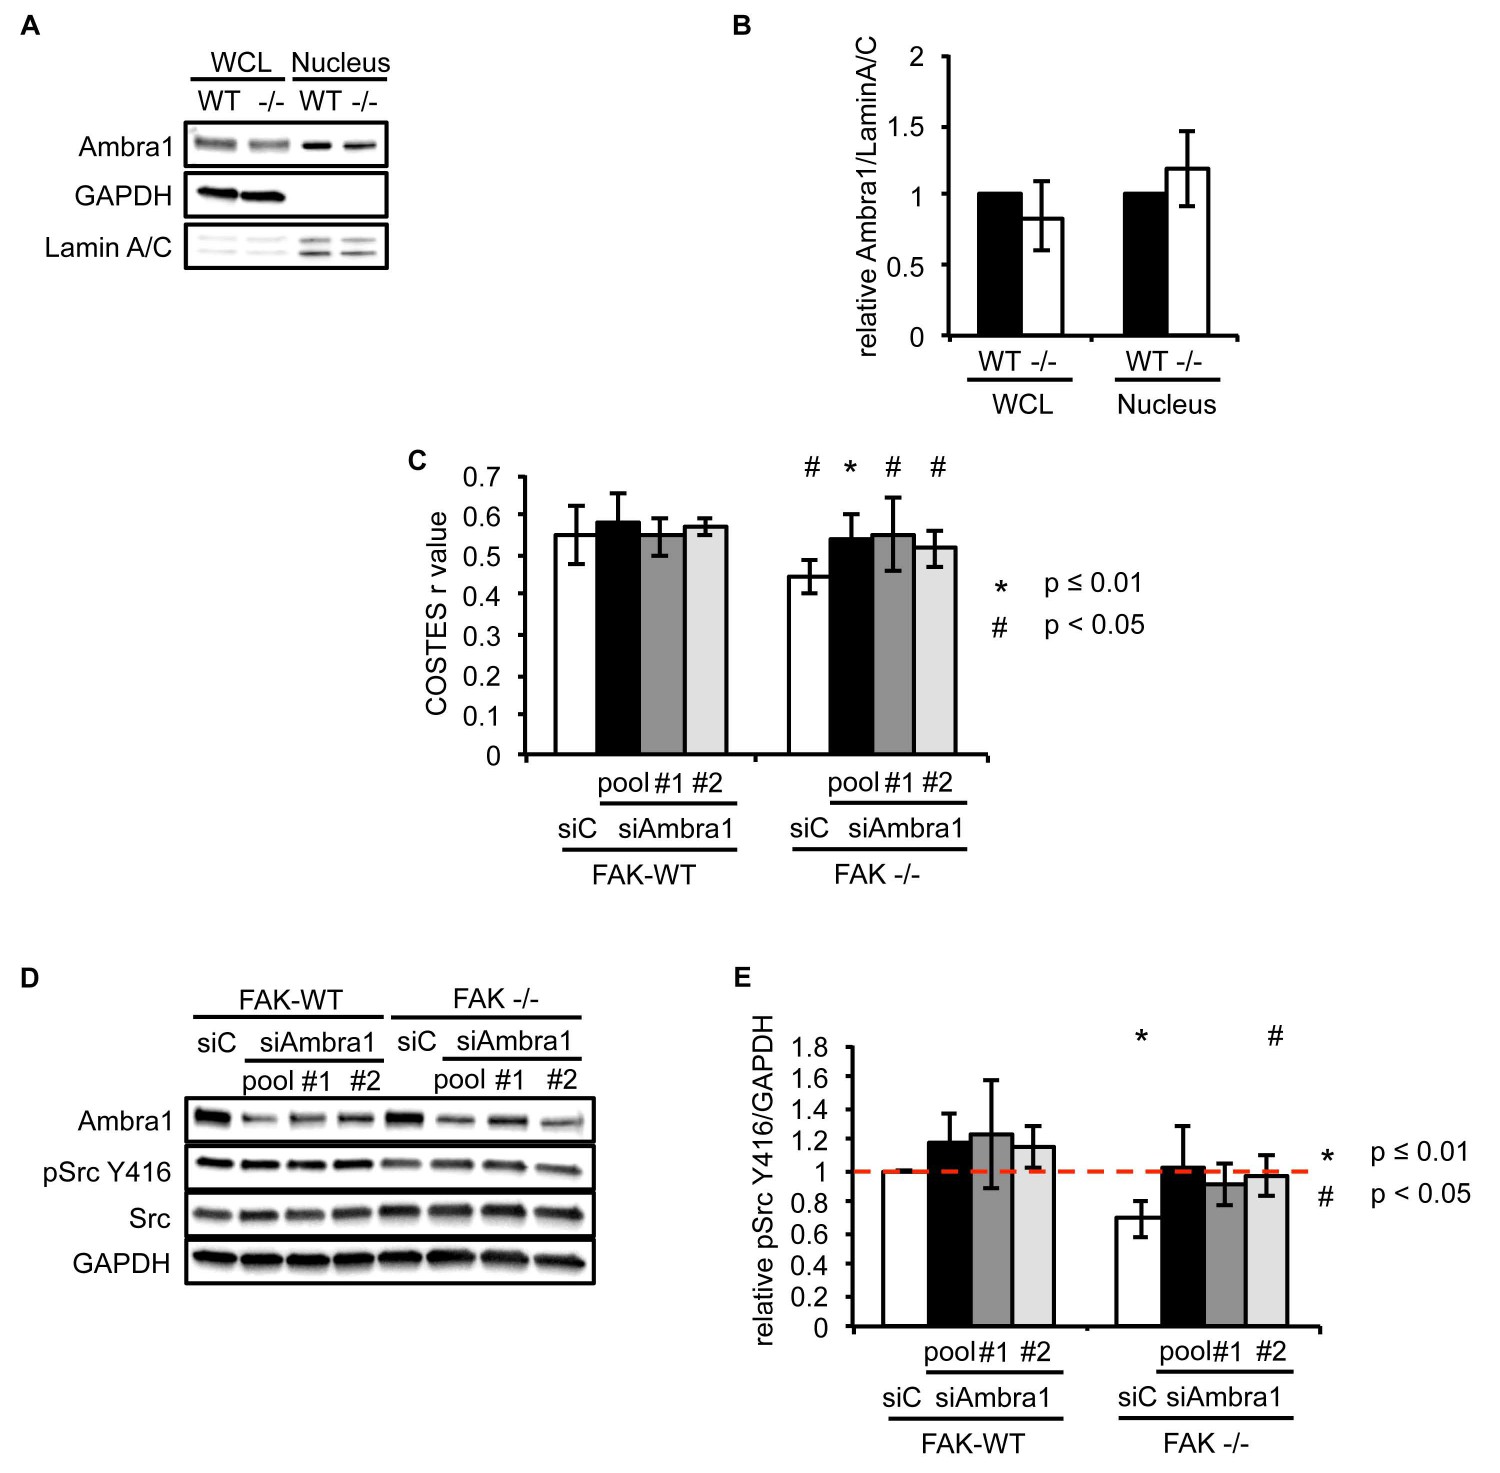
Ambra1 interacts with Src and mediates pSrc trafficking.
(A) Nuclei from SCC FAK-WT and FAK -/- cells were isolated using sucrose gradient centrifugation. Lysates were immunoblotted for Ambra1, GAPDH (cytosolic marker) and Lamin A/C (nuclear marker). (B) Relative ratio of Ambra1/Lamin A/C was calculated by densitometry. WCL, whole cell lysate. Error bars, s.d. (C) Colocalisation (Costes r value from five cells) of pSrc Y416/Paxillin upon Ambra1 knockdown by siRNAs was analysed using the ImageJ plugin JaCoP. Error bars, s.d. p<0.01 (*) and p<0.05 (#). (D) FAK-WT and FAK -/- cells were transiently transfected with either a pool or two independent Ambra1 siRNAs. Cell lysates were subjected to western blot analysis using anti-Ambra1, anti-pSrc Y416 and anti-Src. Anti-GAPDH was used as a loading control. (E) The relative ratios of pSrc/GAPDH were calculated using densitometry. n = 3. Error bars, s.d. p<0.01 (*) and p<0.05 (#).
Figure 3 with 1 supplement
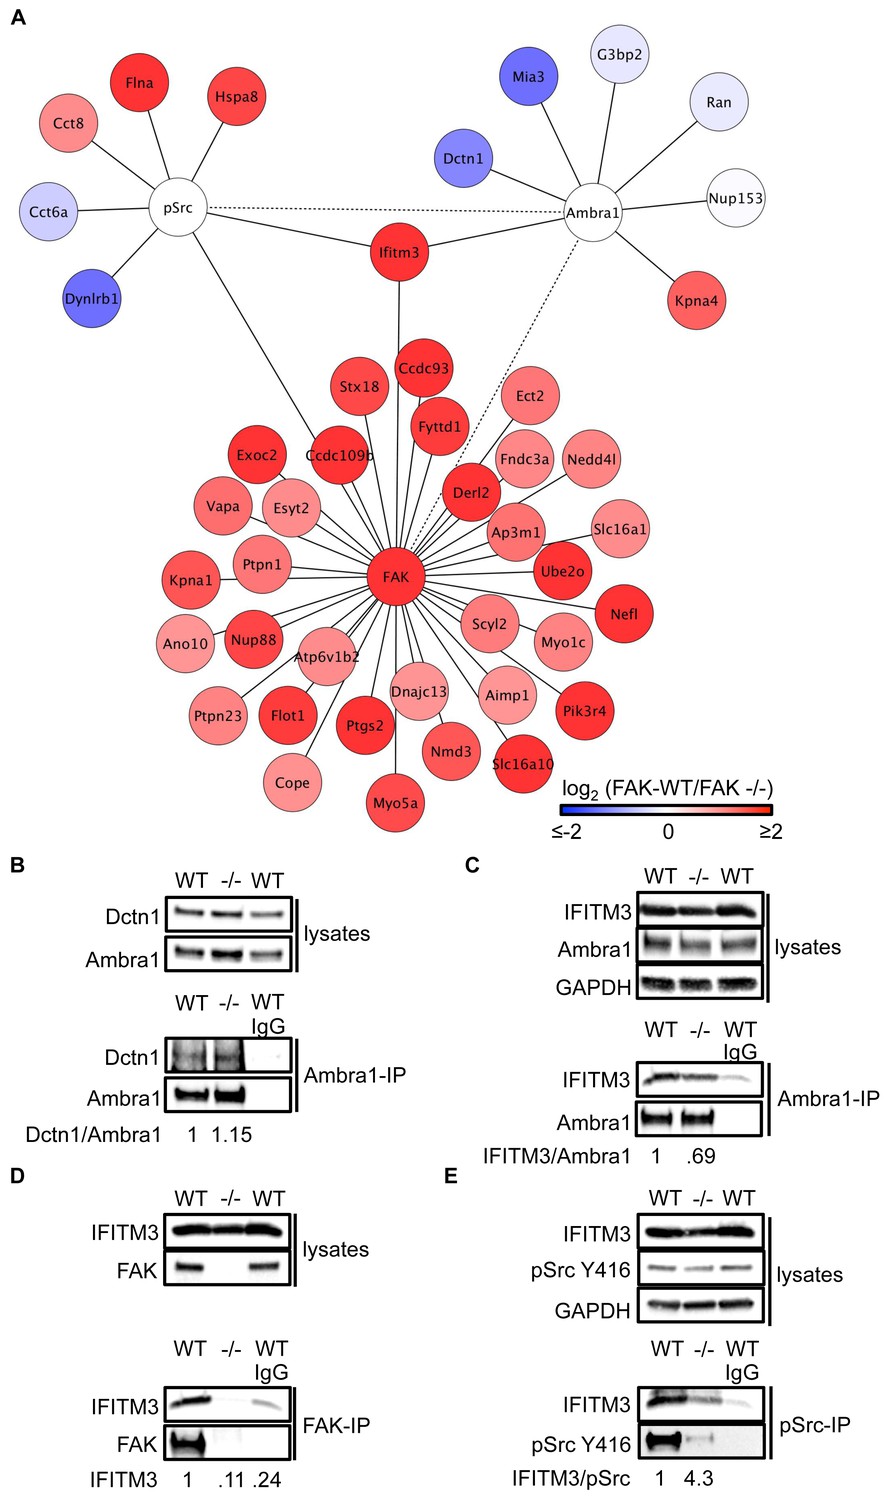
IFITM3 is in the centre of an Ambra1, FAK and pSrc trafficking network.
(A) Network analysis of Ambra1-, FAK- and pSrc Y416-interacting proteins that are involved in trafficking processes. Solid lines indicate protein-protein interactions identified in the mass spectrometry datasets used for the interaction map. Dotted lines indicate Ambra1–FAK/pSrc interactions, which have been previously identified and verified by immunoprecipitation. (B) Ambra1 was immunoprecipitated from FAK-WT and FAK -/- cell lysates using anti-Ambra1 antibody, followed by western blot analysis with anti-Dctn1 and anti-Ambra1. (C–E) Ambra1 (C), FAK (D) or pSrc Y416 (E) were immunoprecipitated from FAK-WT and -/- cell lysates, followed by western blot analysis with anti-IFITM3, anti-Ambra1, anti-FAK and anti-pSrc Y416. Anti-GAPDH served as a loading control. Relative ratios of Dctn1/Ambra1, IFITM3/Ambra1, IFITM3 and IFITM3/pSrc interactions were calculated by densitometry.
Figure 3—figure supplement 1
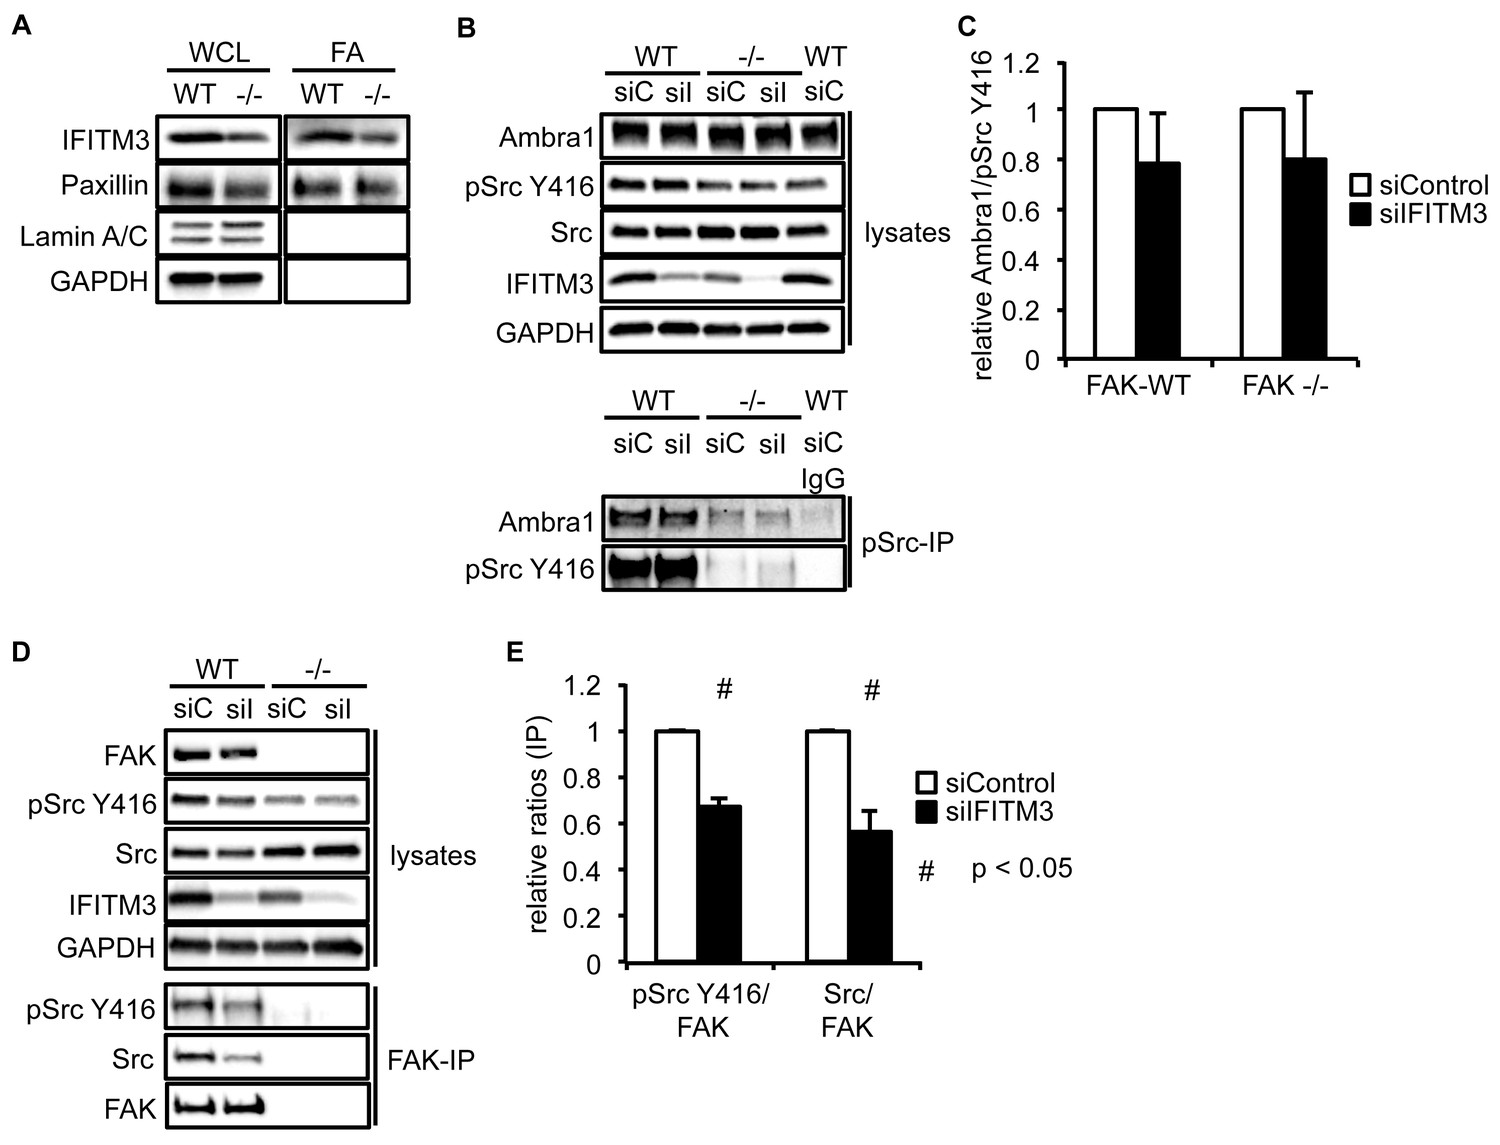
IFITM3 influences the Src-FAK complex.
(A) Focal adhesions from SCC FAK-WT and FAK -/- cells were crosslinked and isolated for western blot analysis with the indicated antibodies. Paxillin served as a marker for focal adhesions, Lamin A/C was used as a nuclear marker and GAPDH represented a cytosolic marker. WCL, whole cell lysate; FA, focal adhesions. SCC FAK-WT and -/- cells were transiently transfected with siIFITM3 and pSrc Y416 (B) and FAK (D) were immunoprecipitated from FAK-WT and FAK -/- cell lysates using anti-pSrc Y416 and anti-FAK 4.47 agarose, followed by western blot analysis with anti-Ambra1, anti-FAK, anti-IFITM3, anti-pSrc Y416 and anti-Src. Anti-GAPDH served as a loading control. (C, E) Relative ratios of Ambra1/pSrc (C) as well as pSrc/FAK and Src/FAK (E) interactions were calculated by densitometry. n = 3. Error bars, s.d. p<0.05 (#).
Figure 4 with 1 supplement
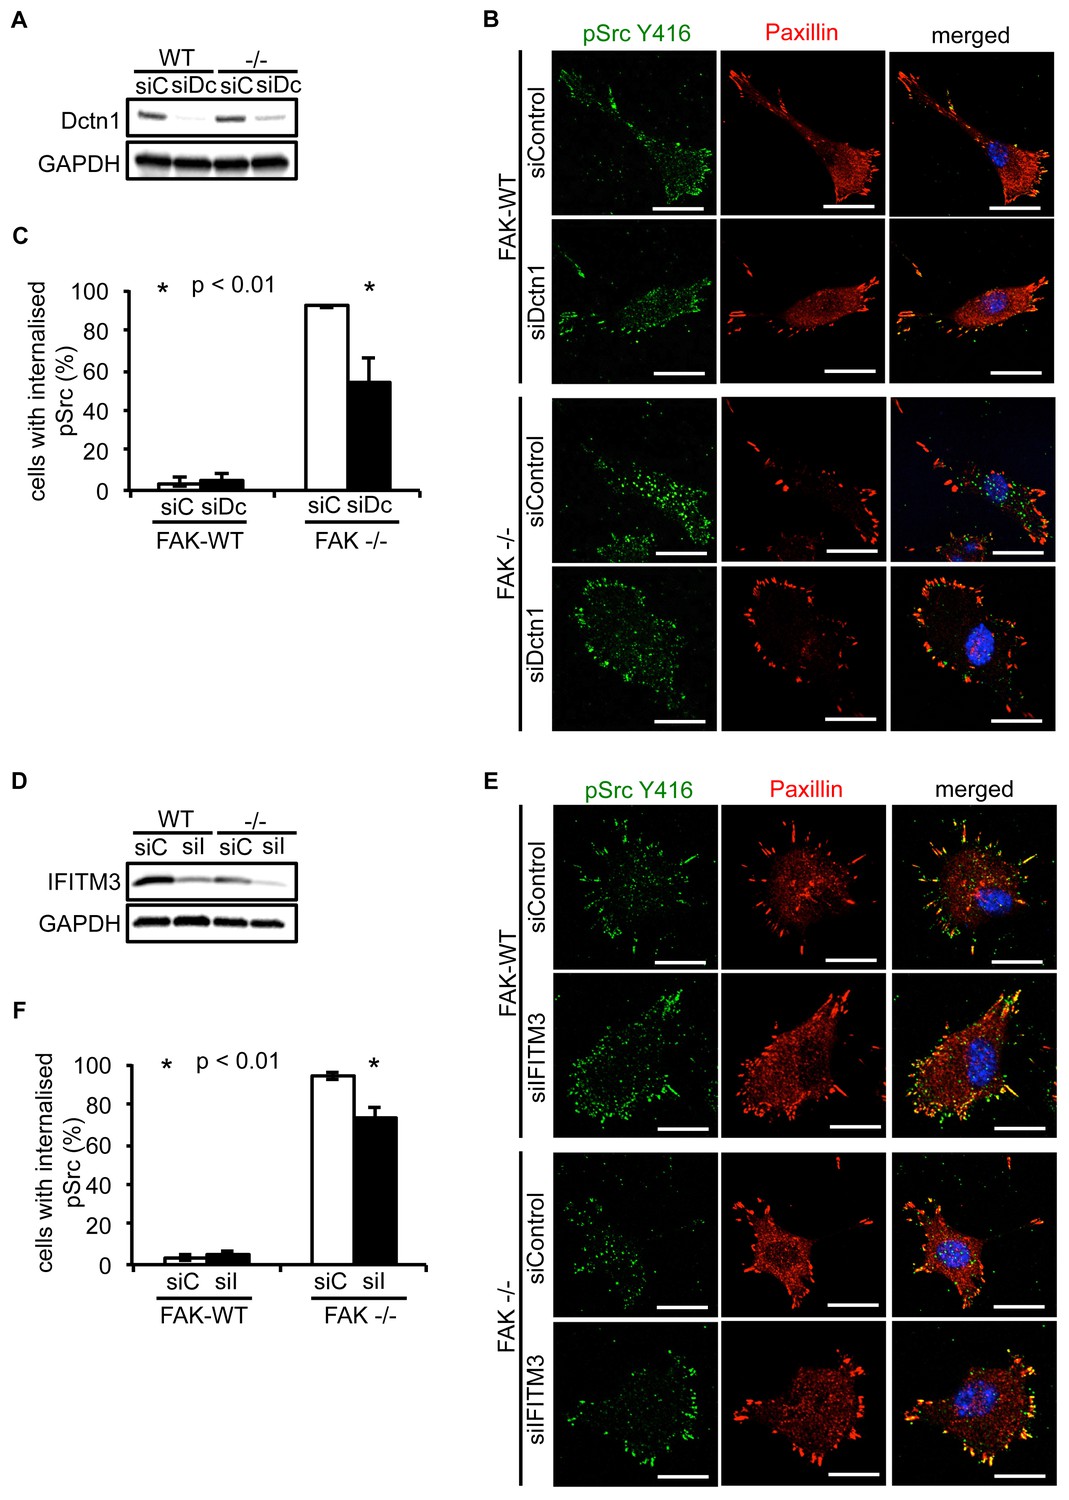
Knockdown of Dynactin 1 and IFITM3 suppresses trafficking of active Src to autophagic puncta.
(A) FAK-WT and FAK -/- cells were transiently transfected with a pool of Dynactin 1 (Dctn1) siRNAs and lysed 48 hr post transfection. Dynactin 1 expression was determined by western blotting using anti-Dctn1. Anti-GAPDH was used as a loading control. (B) SCC FAK-WT and FAK -/- cells transiently transfected with Dctn1 siRNA were grown on glass coverslips, fixed and stained with anti-pSrc Y416, anti-Paxillin and DAPI. Scale bars, 20 μm. (C) Quantification of internalised active Src. n = 3. Error bars, s.d. p<0.01. (D) FAK-WT and FAK -/- cells were transiently transfected with a pool of IFITM3 siRNAs and lysed 48 hr post transfection. IFITM3 expression was determined by western blotting using anti-IFITM3. Anti-GAPDH was used as a loading control. (E) SCC FAK-WT and FAK -/- cells transiently transfected with IFITM3 siRNA were grown on glass coverslips, fixed and stained with anti-pSrc Y416, anti-Paxillin and DAPI. Scale bars, 20 μm. (F) Quantification of internalised active Src. n = 3. Error bars, s.d. p<0.01.
-
Figure 4—source data 1
Percentage of cells with internalised pSrc.
- https://doi.org/10.7554/eLife.23172.013
Figure 4—figure supplement 1
Knockdown of Dynactin 1 and IFITM3 suppress pSrc trafficking to autophagic puncta.
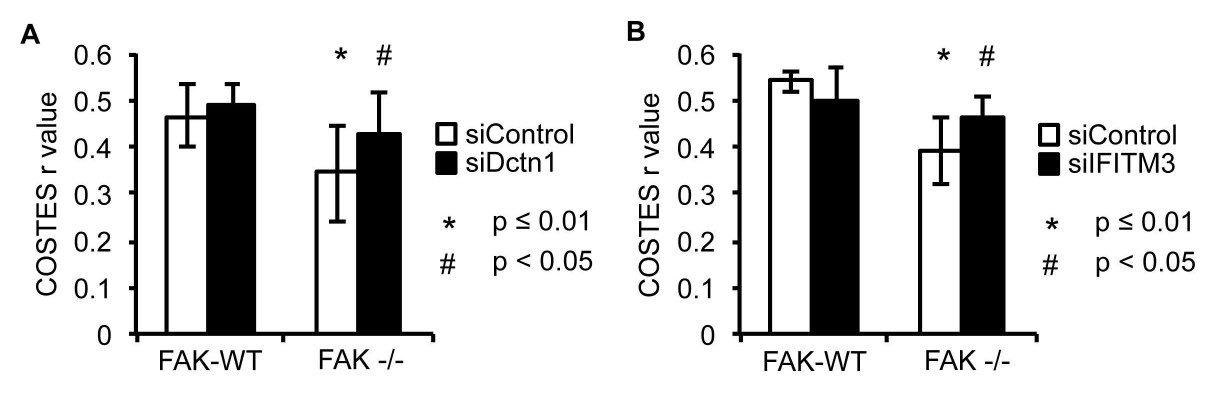
SCC FAK-WT and FAK -/- cells transiently transfected with siDctn1 (A) or siIFITM3 (B) were grown on glass coverslips, fixed and stained with anti-pSrc Y416, anti-Paxillin and DAPI. Colocalisation (Costes r value from nine or five cells respectively) of pSrc/Paxillin was analysed using the ImageJ plugin JaCoP. Error bars, s.d. p<0.01 (*) and p<0.05 (#).
Figure 5 with 2 supplements
Ambra1 binding impaired FAK increases cell adhesion and pSrc at focal adhesions.
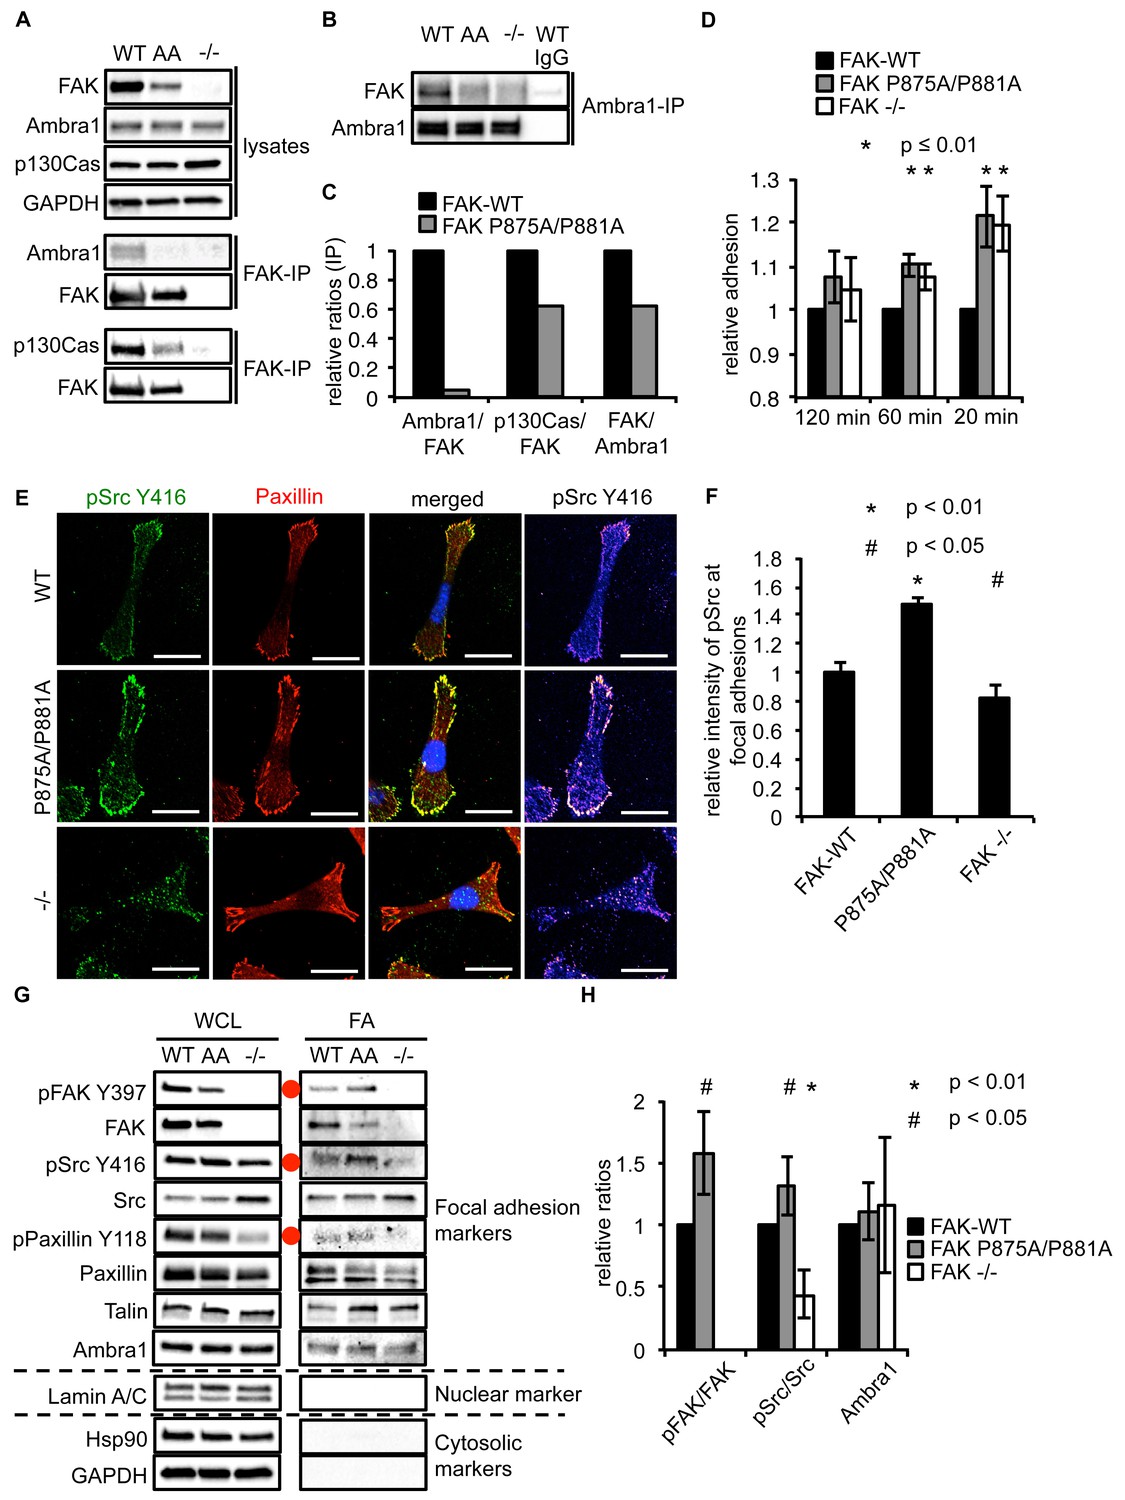
(A, B) FAK (A) or Ambra1 (B) were immunoprecipitated from FAK-WT, FAK P875A/P881A (AA) and FAK -/- cell lysates using anti-FAK 4.47 agarose or anti-Ambra1, followed by western blot analysis with anti-FAK, anti-Ambra1 and anti-p130Cas. Anti-GAPDH was used as a loading control. (C) Relative ratios of Ambra1/FAK and p130Cas/FAK interactions were calculated by densitometry. (D) Adhesion assay: SCC FAK-WT, FAK P875A/P881A and FAK -/- cells were plated in serum-free conditions on fibronectin-coated plates. Samples were normalised to the 6 hr time point and relative adhesion was calculated by setting the FAK-WT values to 1. n = 3. Error bars, s.d. p≤0.01. (E, F) SCC FAK-WT, FAK P875A/P881A and FAK -/- cells were grown on glass coverslips for 24 hr, fixed and stained with anti-pSrc Y416, anti-Paxillin and DAPI. Scale bars, 20 μm. The relative intensity of pSrc staining at focal adhesions from five cells (at least 10 focal adhesions/cell) was measured using ImageJ. (E) Representative immunofluorescence images are shown. (F) Quantification of the relative pSrc intensity at focal adhesions. n = 5. Error bars, s.e.m. p<0.01 (*) and p<0.05 (#). (G) Focal adhesions from SCC FAK-WT, FAK P875A/P881A (AA) and FAK -/- cells were crosslinked and isolated for western blot analysis with the indicated antibodies. Paxillin and Talin served as markers for focal adhesions and Lamin A/C was used as a nuclear marker. Hsp90 and GAPDH represented cytosolic markers. WCL, whole cell lysate; FA, focal adhesions. The purity of the isolated focal adhesions was determined by the absence of nuclear proteins like Lamin A/C and cytosolic markers like Hsp90 and GAPDH. There was less active Src at focal adhesions in the FAK-deficient SCC cells due to Src’s internalisation to autophagic structures. Additionally, increased pPaxillin Y118 and Talin levels could be detected in the FAK Ambra1-binding mutant compared to SCC FAK-WT and FAK -/- cells. No changes in Ambra1 levels at focal adhesions could be detected. (H) The relative ratios of pFAK/FAK, pSrc/Src and Ambra1 at focal adhesions were calculated using densitometry. n = 3. Error bars, s.d. p<0.01 (*) and p<0.05 (#).
-
Figure 5—source data 1
Relative mean values of adhesion, pSrc intensity at focal adhesions and relative ratios at focal adhesions.
Mean and s.d. values of relative adhesion on fibronectin of SCC FAK-WT, P875A/P881A and -/- cells are shown (Figure 5D). The relative mean intensity and s.e.m. of pSrc at focal adhesions are shown (Figure 5F). Relative ratios (mean and s.d.) of pFAK/FAK, pSrc/Src and Ambra1 of isolated focal adhesions are shown (Figure 5H).
- https://doi.org/10.7554/eLife.23172.016
Figure 5—figure supplement 1
FAK Ambra1-binding mutant promotes adhesion and invasion.
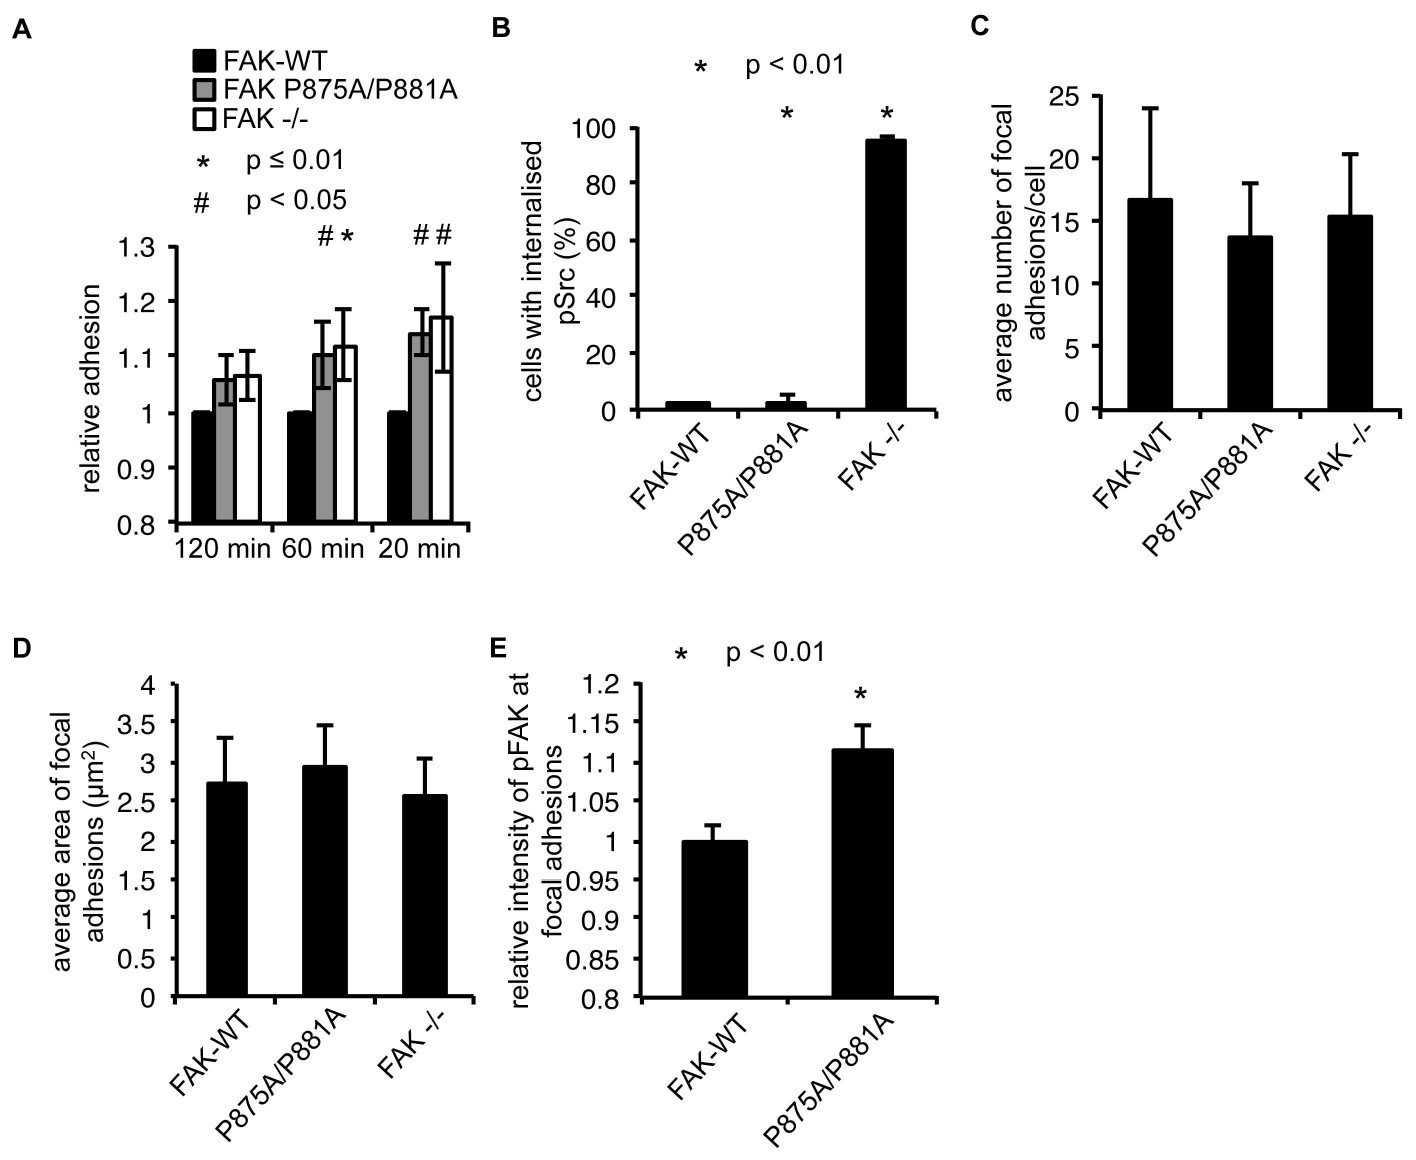
(A) Adhesion assay: SCC FAK-WT, FAK P875A/P881A and FAK -/- cells were plated in serum-free conditions on uncoated plates (plastic). Samples were normalised to the 6 hr time point and relative adhesion was calculated by setting the FAK-WT values to 1. n = 3. Errors bars, s.d. p≤0.01 (*) and p<0.05 (#). (B) Quantification of internalised active Src. n = 3. Error bars, s.d. p<0.001. (C) The average number of focal adhesions per cell was counted. n = 3. Error bars, s.d. (D) The average size of focal adhesions was measured using ImageJ. n = 3. Error bars, s.d. (E) The relative intensity of pFAK Y397 staining at focal adhesions from five cells (at least 10 focal adhesions/cell) was measured using ImageJ. n = 3. Error bars, s.e.m. p<0.01.
Figure 5—figure supplement 2
FAK Ambra1-binding mutant promotes adhesion and invasion.
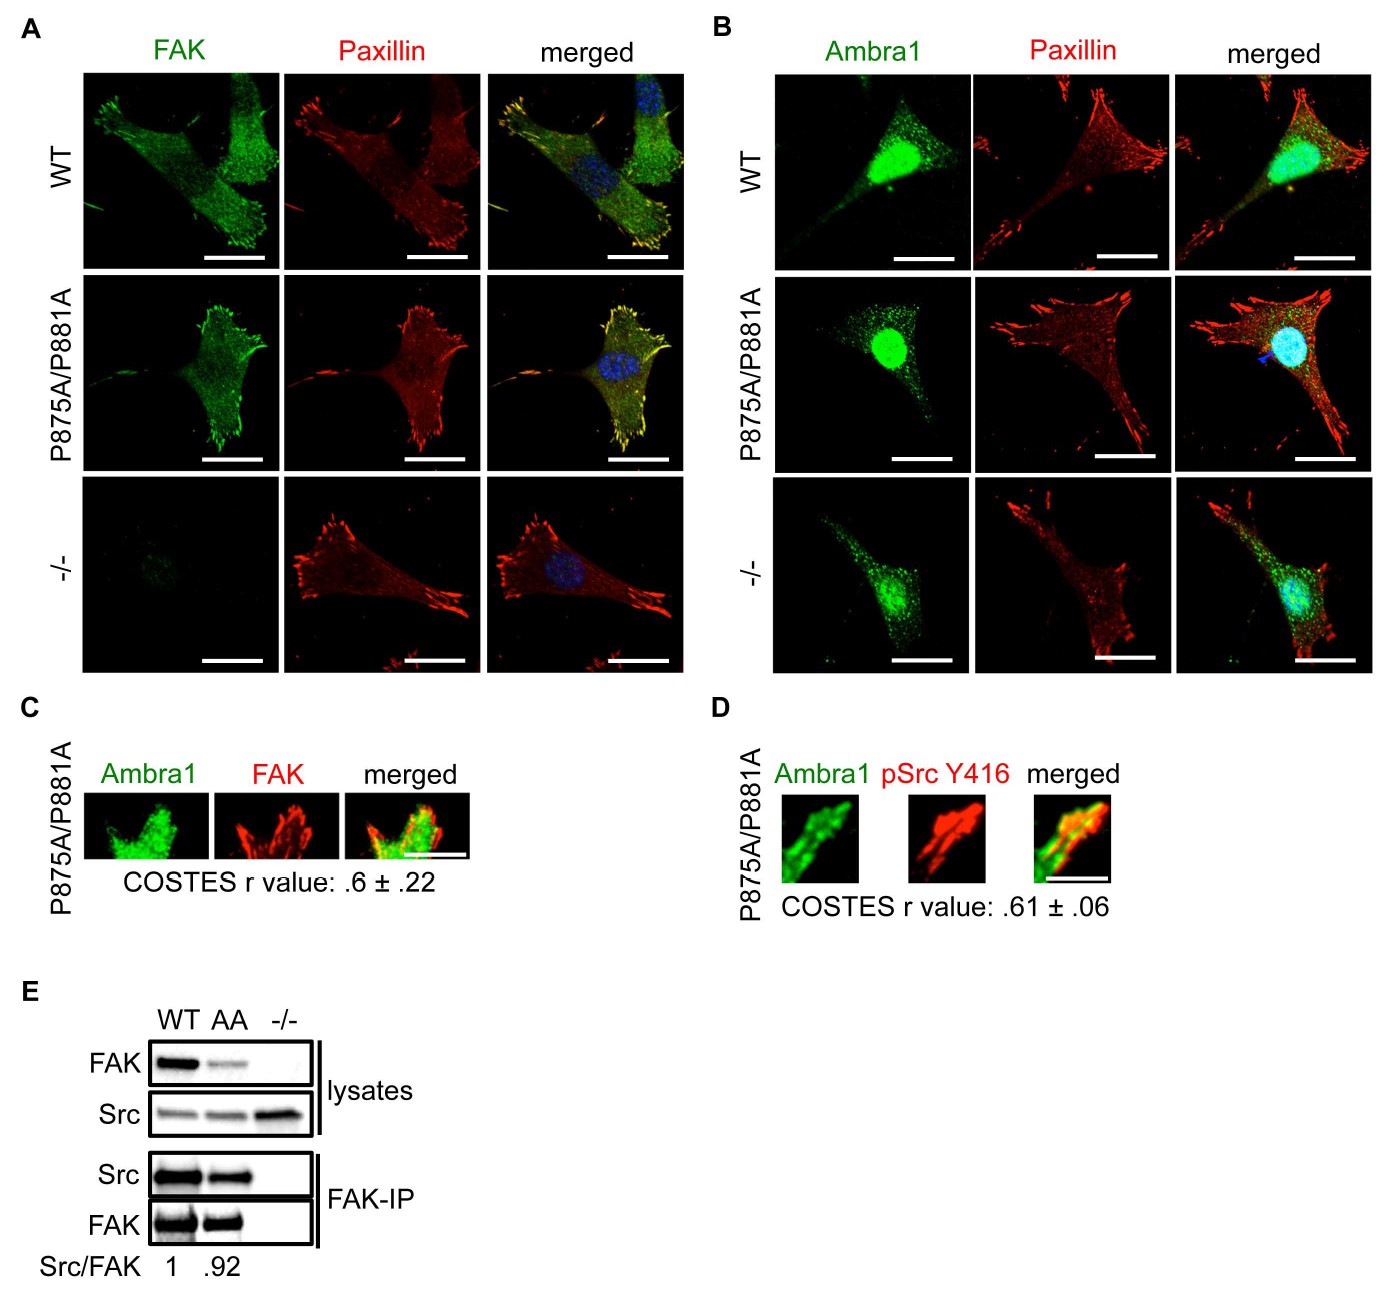
(A, B) SCC FAK-WT, FAK P875A/P881A (AA) and FAK -/- cells were grown on glass coverslips, fixed and stained with anti-FAK, anti-Paxillin and DAPI (A) and anti-Ambra1, anti-Paxillin and DAPI (B), respectively. Scale bars, 20 μm. There were no visible differences between total FAK or Ambra1 intensity staining. (C, D) Total Internal Reflection Fluorescence (TIRF) microscopy of SCC FAK P875A/P881A cells stained with anti-Ambra1 and anti-FAK (C) or anti-Ambra1 and anti-pSrc Y416 (D). Colocalisation (COSTES r value of five cells) was analysed using the ImageJ plugin JaCoP. Scale bars, 10 μm. (E) FAK was immunoprecipitated from FAK-WT, FAK P875A/P881A (AA) and FAK -/- cell lysates using anti-FAK 4.47 agarose, followed by western blot analysis with anti-FAK and anti-Src. The relative ratio of Src/FAK interaction was calculated by densitometry.
Figure 6
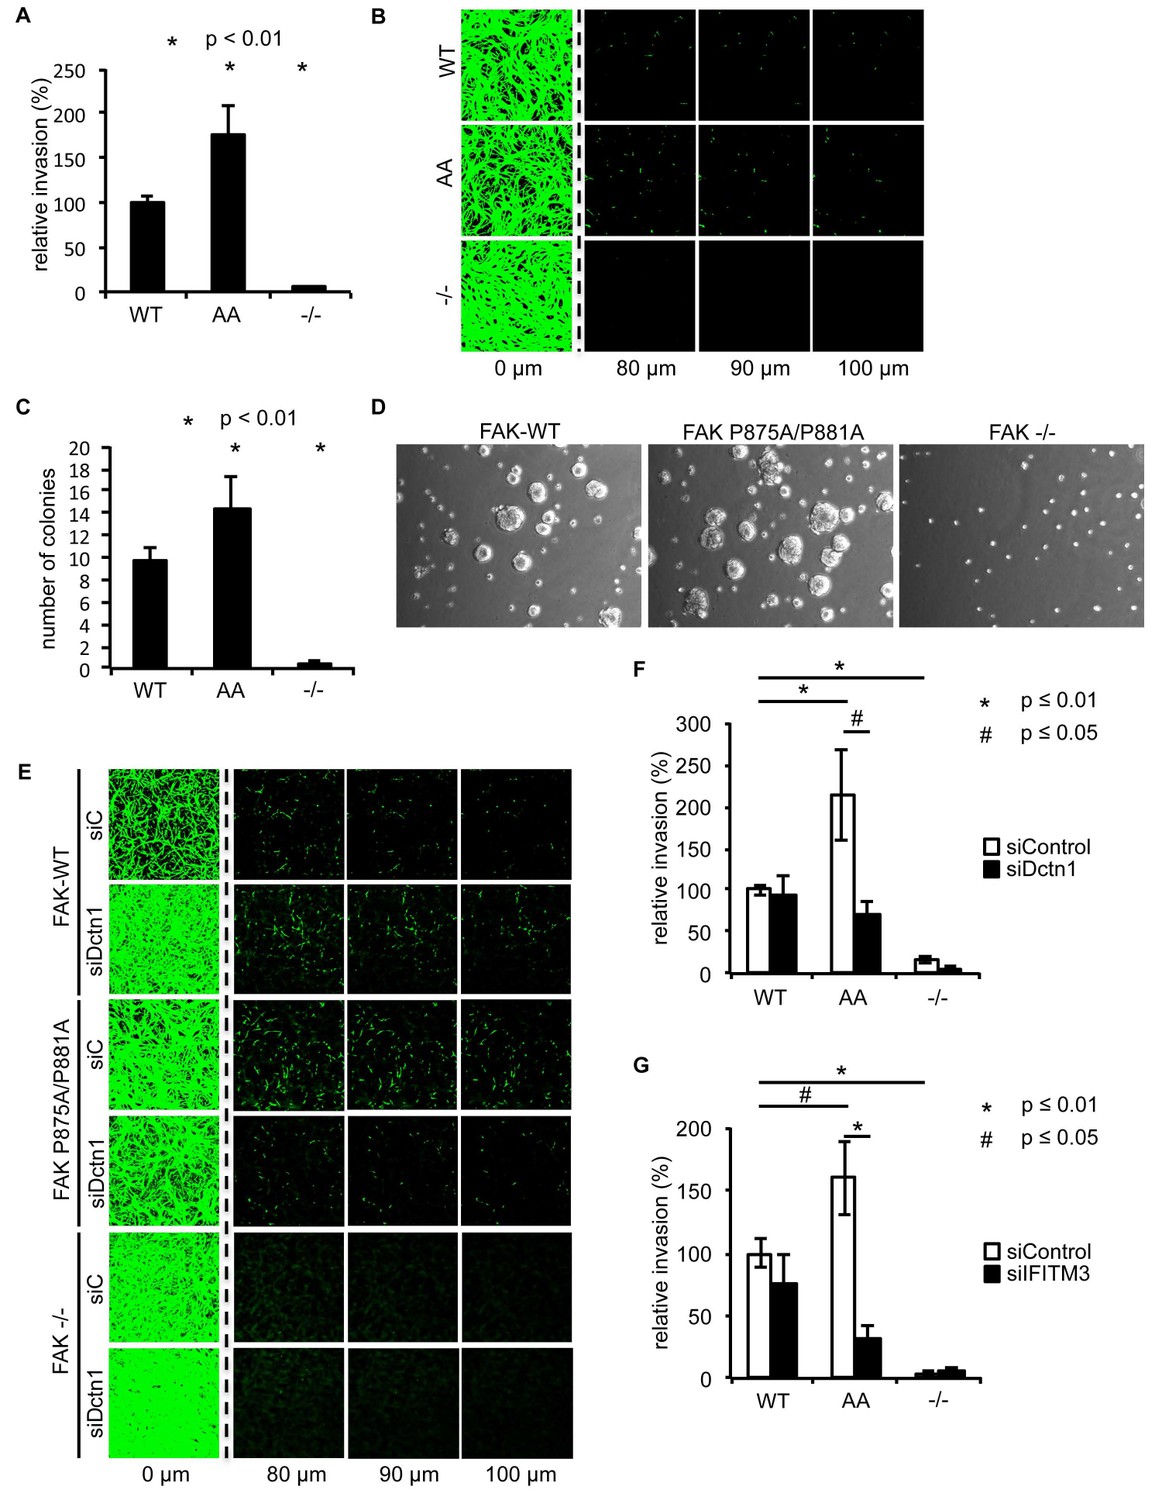
Ambra1 binding-impaired mutant FAK increases invasion and 3D proliferation, which is rescued by reducing Dynactin 1 or IFITM3 expression levels.
(A) Invasion assay: SCC FAK-WT, FAK P875A/P881A (AA) and FAK -/- cells were seeded on growth factor-reduced Matrigel in serum-free conditions. After 72 hr, invasion towards a serum gradient was visualised by staining the cells with calcein. n = 8. Error bars, s.e.m. p≤0.01. (B) Representative images of the invasion assay. (C, D) 3D proliferation assay: SCC FAK-WT, FAK P875A/P881A and FAK -/- cells were resuspended in methylcellulose solution in growth medium on a layer of agarose. After nine days, images were taken from 6–10 random fields and colonies were counted. (C) Quantification of the 3D proliferation assay. n = 3. Error bars, s.d. p<0.01. (D) Representative images of the 3D proliferation assay. (E–G) Invasion assay: SCC FAK-WT, FAK P875A/P881A and FAK -/- cells transiently transfected with Dctn1 siRNA were seeded on growth factor-reduced Matrigel in serum-free conditions. After 72 hr, invasion towards a serum gradient was visualised by staining the cells with calcein. (E) Representative images of the invasion assay. (F) Quantification of the invasion assay. n = 6. Error bars, s.e.m. p≤0.01. (G) Quantification of the invasion assay with cells transiently transfected with IFITM3 siRNA. n = 6. Error bars, s.e.m. p≤0.01 (*) and p<0.05 (#).
-
Figure 6—source data 1
Mean values of invasion and number of colonies.
- https://doi.org/10.7554/eLife.23172.020
Figure 7
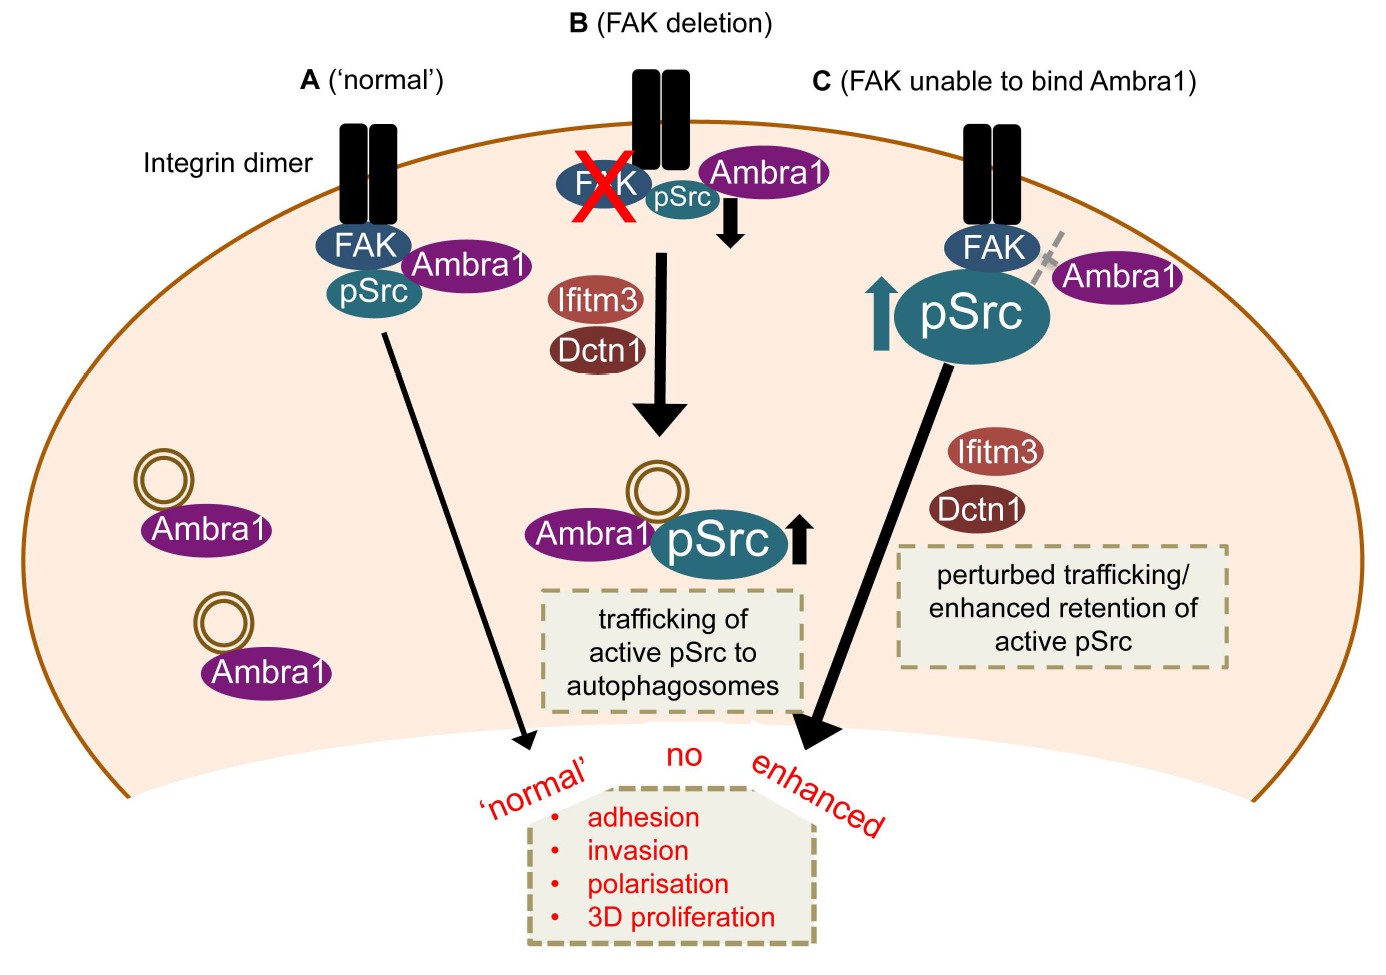
Model for Ambra1’s role in pSrc trafficking and cancer cell phenotypes.
In mouse SCC cells, Ambra1 is localised at autophagosomes and focal adhesions. (A) In FAK-WT expressing (‘normal’) SCC cells, Ambra1 binds to FAK and Src, regulating Src/FAK-mediated cancer processes like adhesion, invasion, polarisation and 3D proliferation. (B) In FAK -/- SCC cells, Ambra1 regulates the trafficking of active Src from focal adhesions to autophagosomes. Dynactin 1 (Dctn1) and IFITM3 are involved in this Ambra1-regulated trafficking process. (C) In cells expressing the FAK P875A/P881A mutant, Ambra1 binds to a lesser extent to FAK, but still to Src. This impaired FAK–Ambra1 interaction results in increased active Src levels at focal adhesions, resulting in enhanced adhesion, invasion, polarisation and 3D proliferation. Most likely this is due to perturbed trafficking of focal adhesion components, as knockdown of proteins involved in trafficking processes, like Dynactin 1 and IFITM3, rescues the phenotypes in FAK P875A/P881A expressing SCC cells.
Author response image 1
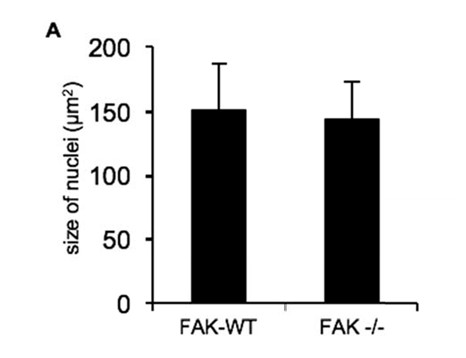
Nuclear size comparisons in FAK-WT and FAK -/- cells.
https://doi.org/10.7554/eLife.23172.025Additional files
-
Supplementary file 1
Ambra1 interacting proteins involved in trafficking.
SCC FAK-WT and -/- cell lysates (in triplicates) were used for Ambra1-IP in order to determine specifically interacting proteins by quantitative label-free mass spectrometry. IgG served as a negative control. Mean mass spectrometry intensities of technical duplicate data acquisitions for each biological replicate are shown. Mean intensities for proteins not detected in either technical duplicate run were imputed with 1000. Peptide and protein false discovery rates were set to 1%. The mean intensities of Ambra1/IgG as well as Ambra1-IP SCC FAK-WT/SCC FAK -/- ratios were log2-transformed. The significance of enrichment (Ambra1/IgG) was determined using two-tailed unequal variances t-test. Proteins were filtered according to their annotations with traffic-related gene ontology terms (transport, trafficking, vesicle, actin, tubulin and protein localisation).
- https://doi.org/10.7554/eLife.23172.022
-
Supplementary file 2
FAK interacting proteins involved in trafficking.
SCC FAK-WT and -/- cell lysates (in triplicates) were used for FAK-IP in order to determine specifically interacting proteins by quantitative label-free mass spectrometry. Mean mass spectrometry intensities of technical duplicate data acquisitions for each biological replicate are shown. Mean intensities for proteins not detected in either technical duplicate run were imputed with 1000. Peptide and protein false discovery rates were set to 1%. The mean intensities of FAK-IP SCC FAK-WT/SCC FAK -/- ratio were log2-transformed and the significance of enrichment (FAK-IP SCC FAK-WT/SCC FAK -/-) was determined using two-tailed unequal variances t-test. Proteins were filtered according to their annotations with traffic-related gene ontology terms (transport, trafficking, vesicle, actin, tubulin and protein localisation).
- https://doi.org/10.7554/eLife.23172.023
-
Supplementary file 3
pSrc Y416 interacting proteins involved in trafficking.
SCC FAK-WT and -/- cell lysates (in triplicates) were used for pSrc Y416-IP in order to determine specifically interacting proteins by quantitative label-free mass spectrometry. IgG served as a negative control. Mean mass spectrometry intensities of technical duplicate data acquisitions for each biological replicate are shown. Mean intensities for proteins not detected in either technical duplicate run were imputed with 1000. Peptide and protein false discovery rates were set to 1%. The mean intensities of pSrc/IgG as well as pSrc-IP SCC FAK-WT/SCC FAK -/- ratios were log2-transformed. The significance of enrichment (pSrc/IgG) was determined using two-tailed unequal variances t-test. Proteins were filtered according to their annotations with traffic-related gene ontology terms (transport, trafficking, vesicle, actin, tubulin and protein localisation).
- https://doi.org/10.7554/eLife.23172.024
Download links
A two-part list of links to download the article, or parts of the article, in various formats.
Downloads (link to download the article as PDF)
Open citations (links to open the citations from this article in various online reference manager services)
Cite this article (links to download the citations from this article in formats compatible with various reference manager tools)
Ambra1 spatially regulates Src activity and Src/FAK-mediated cancer cell invasion via trafficking networks
eLife 6:e23172.
https://doi.org/10.7554/eLife.23172


