Corrupted adipose tissue endogenous myelopoiesis initiates diet-induced metabolic disease
- Université de Toulouse, CNRS ERL 5311, EFS, INP-ENVT, Inserm U1031, UPS, France
- Université de Toulouse, EFS, INP-ENVT, Inserm U1031, UPS, France
Figures
Figure 1 with 2 supplements
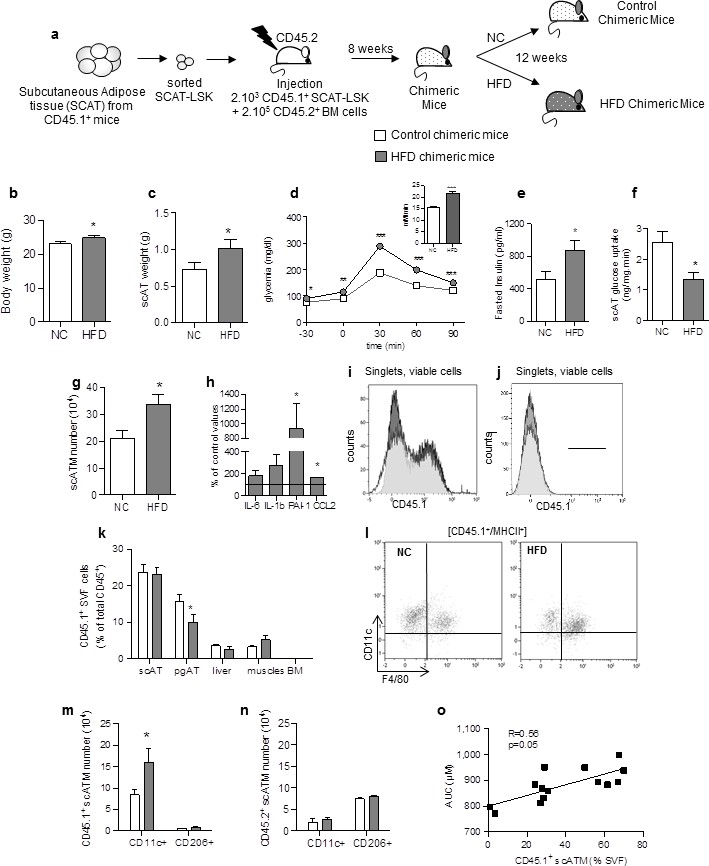
Accumulating subcutaneous Adipose Tissue Macrophages (scATM) in HFD-chimeric mice originate from scAT-LSK.
(a) Schematic representation of experimental procedure: lethally irradiated CD45.2+ recipients mice were co-injected with sorted scAT-LSK and total BM cells isolated respectively from CD45.1 and CD45.2 expressing donor mice, and were then fed a normal Chow (NC) or a high fat diet (HFD) for 12 weeks. Metabolic profile was investigated in chimeric mice by (b) body weight, (c) scAT weight, (d and insert) IPGTT and AUC, (e) quantification of fasted insulin and (f) scAT-glucose uptake (ng/mg.min). (g) Quantification of ATM identified as F4/80+/MHCII+ in the scAT. (h) Expression of genes encoding for inflammatory cytokines analyzed by qRT-PCR in the scAT and expressed as a percent of control values obtained in NC mice. (i–n) Flow cytometry was performed on SVF and BM cells from NC and HFD mice to identify CD45.1+ populations. Representative histograms of CD45.1+ cells in the scAT (i), and the BM (j). (k) Total chimerism in the scAT, pgAT, liver, muscles and BM expressed as percent of total CD45+ cells. (l) Representative dot plots of flow cytometry analysis showing CD11c+/F4/80+/MHCII+ cells in a CD45.1+ cell population gated on singlet live cells. Quantification of scAT-LSK-derived (m) and BM-derived (n) pro-inflammatory (MHCII+/F4/80+/CD11c+) and anti-inflammatory scATM populations (MHCII+/F4/80+/CD206+) expressed in absolute numbers. (o) Correlation between CD45.1+ ATM content (expressed in % of SVF) and AUC. Results are expressed as mean ± sem of 4 to 26 individual animals in control (white symbols) and HFD (grey symbols) groups. Comparisons between groups were made with the nonparametric Mann-Whitney test. *p<0.05; **p<0.01; ***p<0.001.
Figure 1—figure supplement 1
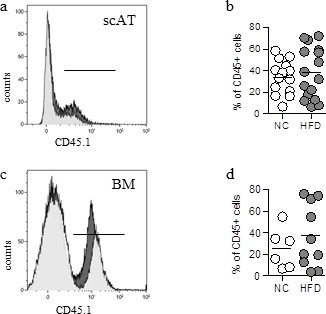
Validation of the animal model of hematopoietic reconstitution.
Chimeric mice were obtained after transplantation of 2.103 sorted BM-LSK mixed with 2.105 congenic BM cells isolated from congenic CD45 variants, and fed a normal chow (NC) or high fat diet (HFD) for 12 weeks. Flow cytometry was performed on SVF and BM cells from NC or HFD mice to identify CD45.1+ populations. (a, c) Representative histograms of CD45.1+ cells in the scAT (a) and the BM (c) isolated from HFD (grey histograms) and NC (white histograms) chimeric mice. (b, d) Total chimerism in the scAT (b) and the BM (d) expressed as percent of total CD45+ cells. Comparisons between groups were made with the nonparametric Mann-Whitney test.
Figure 1—figure supplement 2
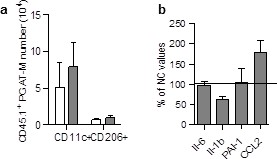
Absence of accumulation of LSK-derived ATM in the pgAT of chimeric HFD mice.
(a) Quantification of LSK-derived pro-inflammatory (MCHII+F4/80+/CD11c+) and anti-inflammatory (MCHII+F4/80+/CD206+) pg-ATM populations expressed in absolute numbers. (c) Expression of genes encoding for inflammatory cytokines analyzed by qRT-PCR in the pgAT of HFD mice and expressed as a percent of control values obtained in NC mice. Results are expressed as mean ± sem of 4 to 26 individual animals in control (white symbols) and HFD (grey symbols) groups. Comparisons between groups were made with the nonparametric Mann-Whitney test.
Figure 2 with 1 supplement
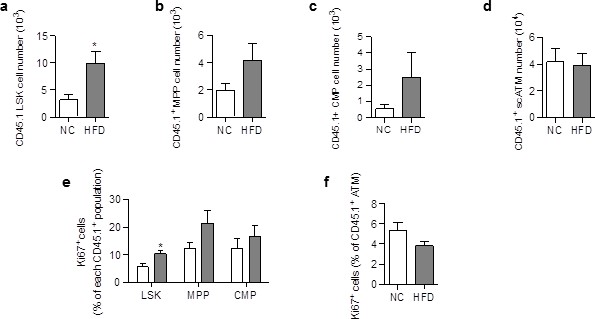
ATM accumulation in the scAT of HFD mice is due to enhanced proliferation of myeloid progenitors at the onset of the disease.
Flow cytometry was performed on SVF cells from mice fed a NC or a HFD for 3 to 6 days, to identify myeloid progenitors and ATM. Quantification of LSK cells (a); Lin−/Sca-1+/c-Kit+), Multipotent Progenitors (b); MPP; Lin−/Sca-1+/c-Kit+/CD34+); Common Myeloid Progenitors (c); CMP; Lin-/Sca-1−/c-Kit+/CD34+) and ATM (d); MHCII+/F4/80+) within the CD45.1+ population, expressed in absolute numbers. Proliferation was assessed by Ki67 staining in CD45.1+ LSK and myeloid progenitors (e) as well as in CD45.1+ ATM (f), and expressed as percent of each CD45.1+ population. Results are expressed as mean ± sem of 4 to 8 individual animals in control (white symbols) and HFD (grey symbols) groups. Comparisons between groups were made with the nonparametric Mann-Whitney test. *p<0.05.
Figure 2—figure supplement 1

Differentiation and proliferation of ATM are unchanged in the scAT of chimeric mice after 3 months of HFD.
Quantification of CD45.1+ LSK cells (a), CD45.1+ multipotent myeloid progenitors (MPP; Lin-/Sca-1+/CD117+/CD34+) (b), and CD45.1+ common myeloid progenitors (CMP; Lin-/Sca-1-/CD117+/CD34+) (c) by flow cytometry, expressed in absolute numbers. Quantification of proliferating (Ki67+) CD45.1+ ATM (d) in the scAT, expressed in percent of total CD45.1+ ATM. Results are expressed as mean ± sem of 4 to 18 individual animals in control (white symbols) and HFD (grey symbols) groups. Comparisons between groups were made with the nonparametric Mann-Whitney test.
Figure 3
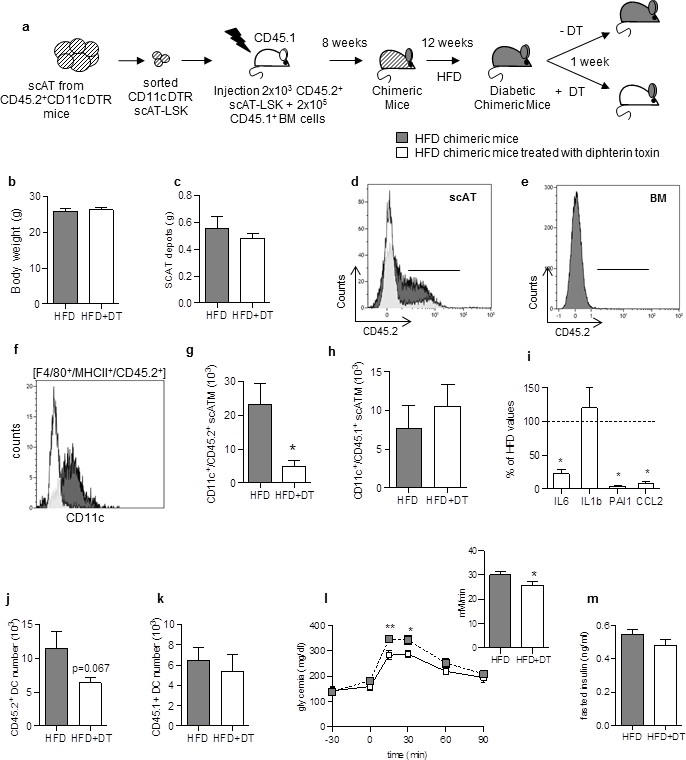
Specific depletion in inflammatory macrophages derived from scAT-LSK improves glucose metabolism in HFD mice.
(a) Schematic representation of experimental procedure: lethally irradiated CD45.1+ recipient mice were co-injected with sorted scAT-LSK and total BM cells isolated respectively from CD45.2+ CD11c-DTR and CD45.1+ donor mice, and were then fed a high fat diet (HFD) for 12 weeks, before treatment with diphtheria toxin (DT) for 1 week. (b) Body weight and (c) scAT weight of chimeric mice measured at the end of the DT treatment. (d, e) Representative histograms of CD45.2 expression in the scAT and the BM of chimeric mice. (f–h) Representative histogram (f) and quantification of the numbers of inflammatory ATM derived from scAT-LSK (g) or BM (h) identified as CD45.2+ or CD45.1+ F4/80+/MHCII+/CD11c+ cells respectively in HFD untreated (grey histogram) and DT-treated (white histogram) mice. (i) Expression of genes encoding for inflammatory cytokines analyzed by qRT-PCR in the scAT and expressed as a percent of control values obtained in untreated mice (dotted line). (j, k) Quantification of dendritic cells (F4/80-/CD11c+/MHCII+) derived from scAT-LSK (j) or the BM (k). Metabolic phenotype determined with (l) GTT and AUC and (m) insulin levels. Results are expressed in mean ± sem of 4 to 8 individual animals in HFD untreated (grey symbols) or DT treated (white symbols) groups. *p<0.05; **p<0.01, nonparametric Mann-Whitney test.
Figure 4
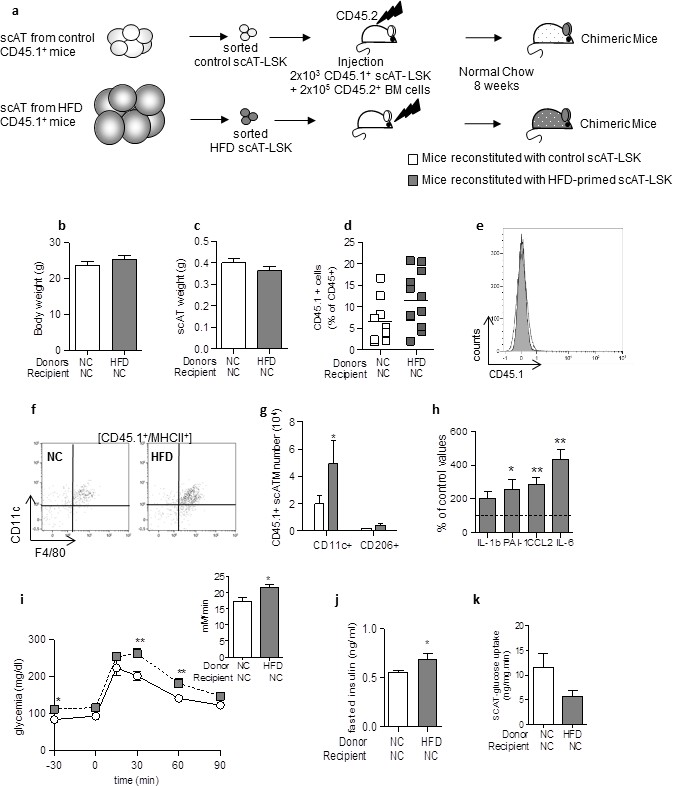
Adoptive transfer of metabolic disease with injection of scAT-LSK sorted from HFD mice into control animals.
(a) Schematic representation of experimental procedure: lethally irradiated CD45.2+ recipient mice were co-injected with sorted scAT-LSK isolated from control or HFD CD45.1+ donor mice and total BM cells isolated from control CD45.2+ mice. Chimeric mice were then maintained on normal chow for 8 weeks. Body (b) and scAT weights (c) measured in chimeric mice. (d) chimerism was quantified in the scAT and expressed as percent of total CD45+ cells. (e) Representative histogram showing the absence of CD45.1+ cells in the BM. (f) Representative dot plots showing scATM identified as CD11c+/F4/80+/MHCII+ cells in a CD45.1+ cell population gated on singlet live cells. (g) Quantification of CD45.1+ pro-inflammatory (CD11c+) or anti-inflammatory (CD206+) ATM expressed in absolute numbers. (h) Expression of genes encoding for inflammatory cytokines analyzed by qRT-PCR in the scAT, and expressed as a percent of values obtained in mice reconstituted with control scAT-LSK (dotted line). Metabolic phenotype was determined with (i) GTT and AUC, (j) fasted insulin level and (k) scAT-glucose uptake. Results are expressed in mean ± sem of 5–8 individual mice transplanted with scAT-LSK sorted from either control (white symbols) or HFD (grey symbols) mice. *p<0.05, **p<0.01; nonparametric Mann-Whitney test.
Figure 5
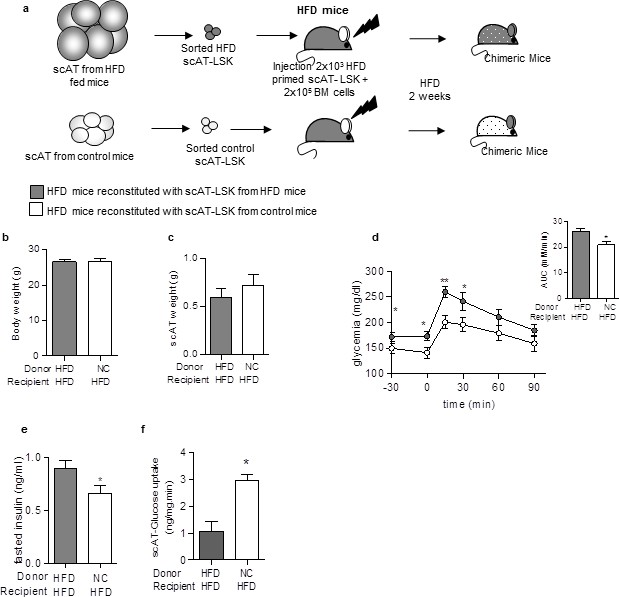
Beneficial effect of scAT-LSK transplantation in HFD mice.
(a) Schematic representation of experimental procedure: HFD lethally irradiated CD45.2+ recipients mice were co-injected with sorted scAT-LSK isolated from HFD or control CD45.1+ donor mice and total BM cells from NC CD45.2+ mice, and maintained on HFD for 2 additional weeks. (b) Body weight and (c) scAT weight were measured in chimeric mice at the end of the diet period. Metabolic phenotype was determined with (d) GTT and AUC, (e) fasted insulin levels and (f) scAT-glucose uptake. Results are expressed in mean ± sem of 4–14 individual animals transplanted with scAT-LSK sorted from either HFD (grey symbols) or control (white symbols) mice. *p<0.05, **p<0.01; Comparisons between groups were made with the unpaired two-sided Student's t-test (b, d–f) or the nonparametric Mann-Whitney test.
Additional files
-
Supplementary file 1
Antibody (Supplementary file 1a) and Primer (Supplementary file 1b) lists.
- https://doi.org/10.7554/eLife.23194.010
Download links
A two-part list of links to download the article, or parts of the article, in various formats.
Downloads (link to download the article as PDF)
Open citations (links to open the citations from this article in various online reference manager services)
Cite this article (links to download the citations from this article in formats compatible with various reference manager tools)
Corrupted adipose tissue endogenous myelopoiesis initiates diet-induced metabolic disease
eLife 6:e23194.
https://doi.org/10.7554/eLife.23194


