Simultaneous measurement of chromatin accessibility, DNA methylation, and nucleosome phasing in single cells
- University of Chicago, United States
Figures
Figure 1 with 3 supplements
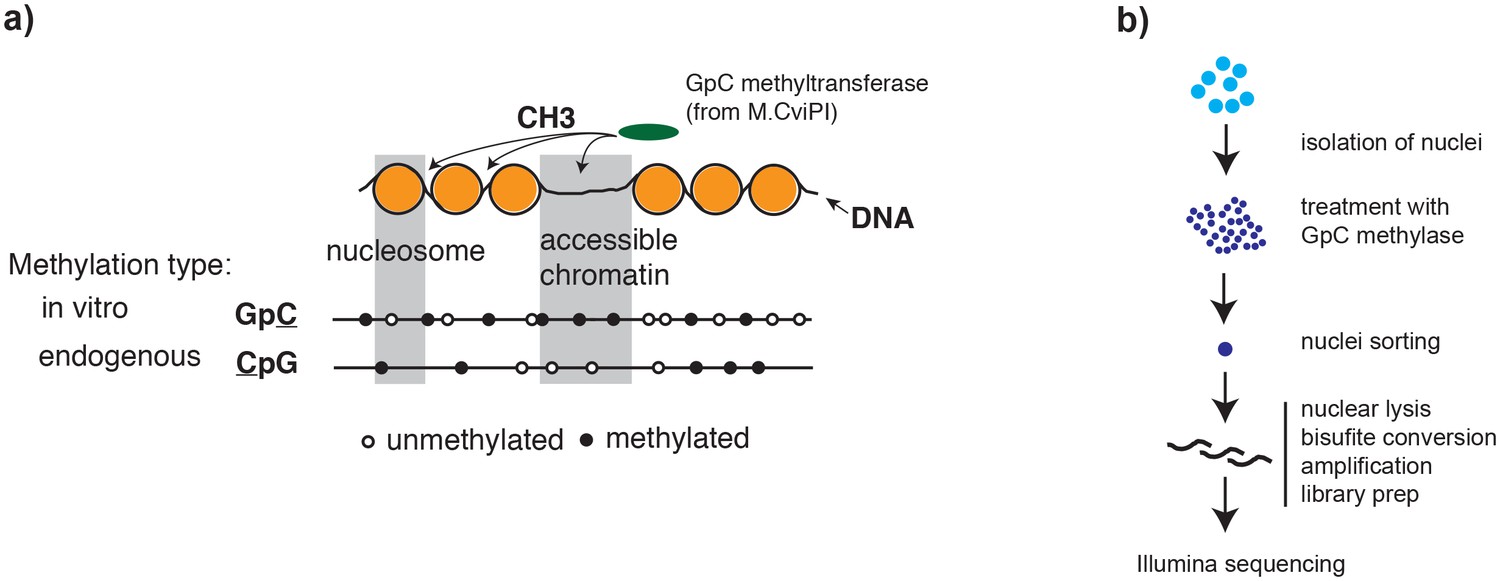
Overview of scNOMe-seq procedure.
(a) Schematic of GpC methyltransferase-based mapping of chromatin accessibility and simultaneous detection of endogenous DNA methylation. (b) Schematic of scNOMe-seq procedure introduced in this study.
Figure 1—figure supplement 1
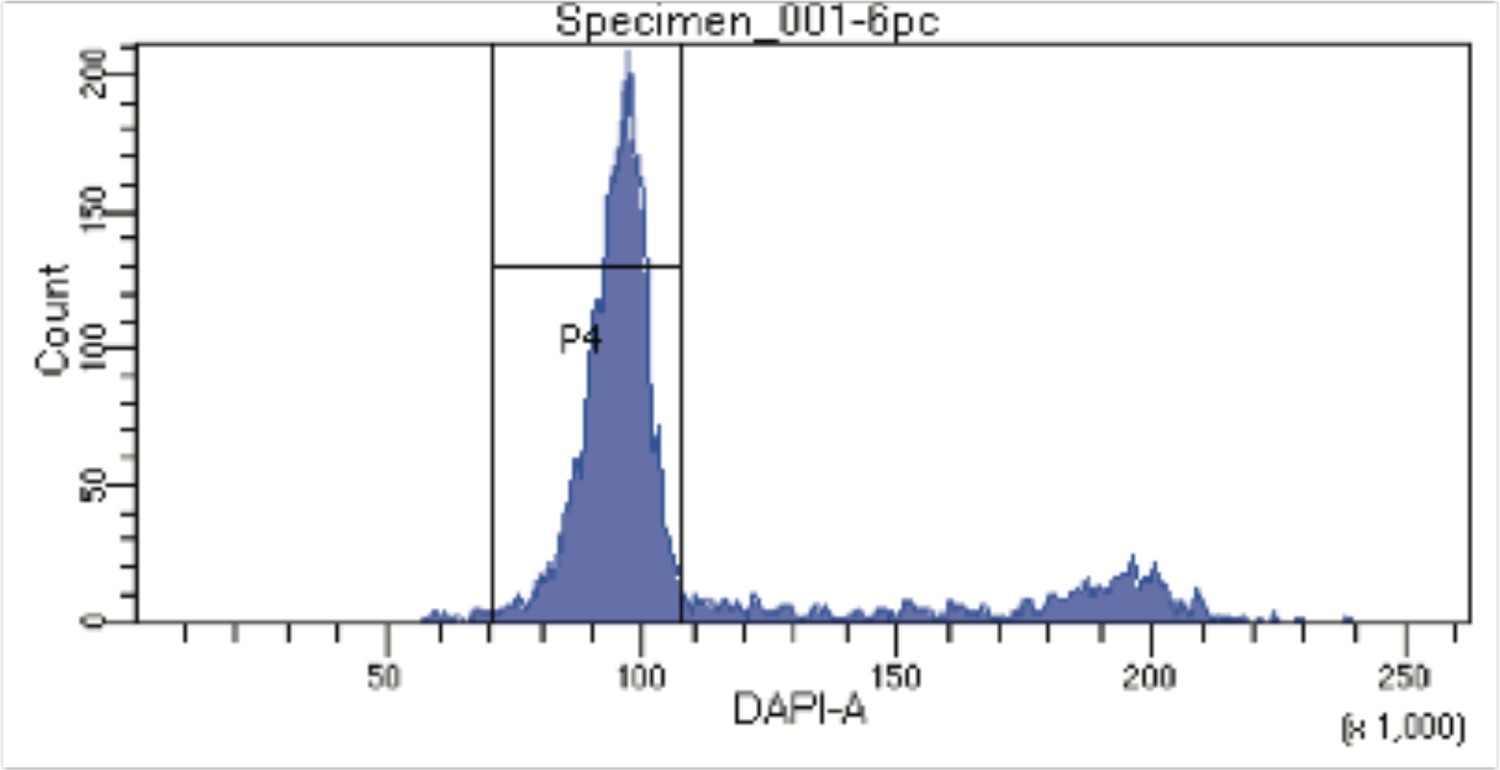
FACS profile from Hoechst stained nuclei to assess DNA content.
Nuclei were stained with Hoechst 33342 DNA dye and nuclei with DNA content corresponding to the G1-phase of the cell cycle were sorted into individual wells in a 96 well plate. Aggregates and debris were removed using gates on forward and side scatter.
Figure 1—figure supplement 2
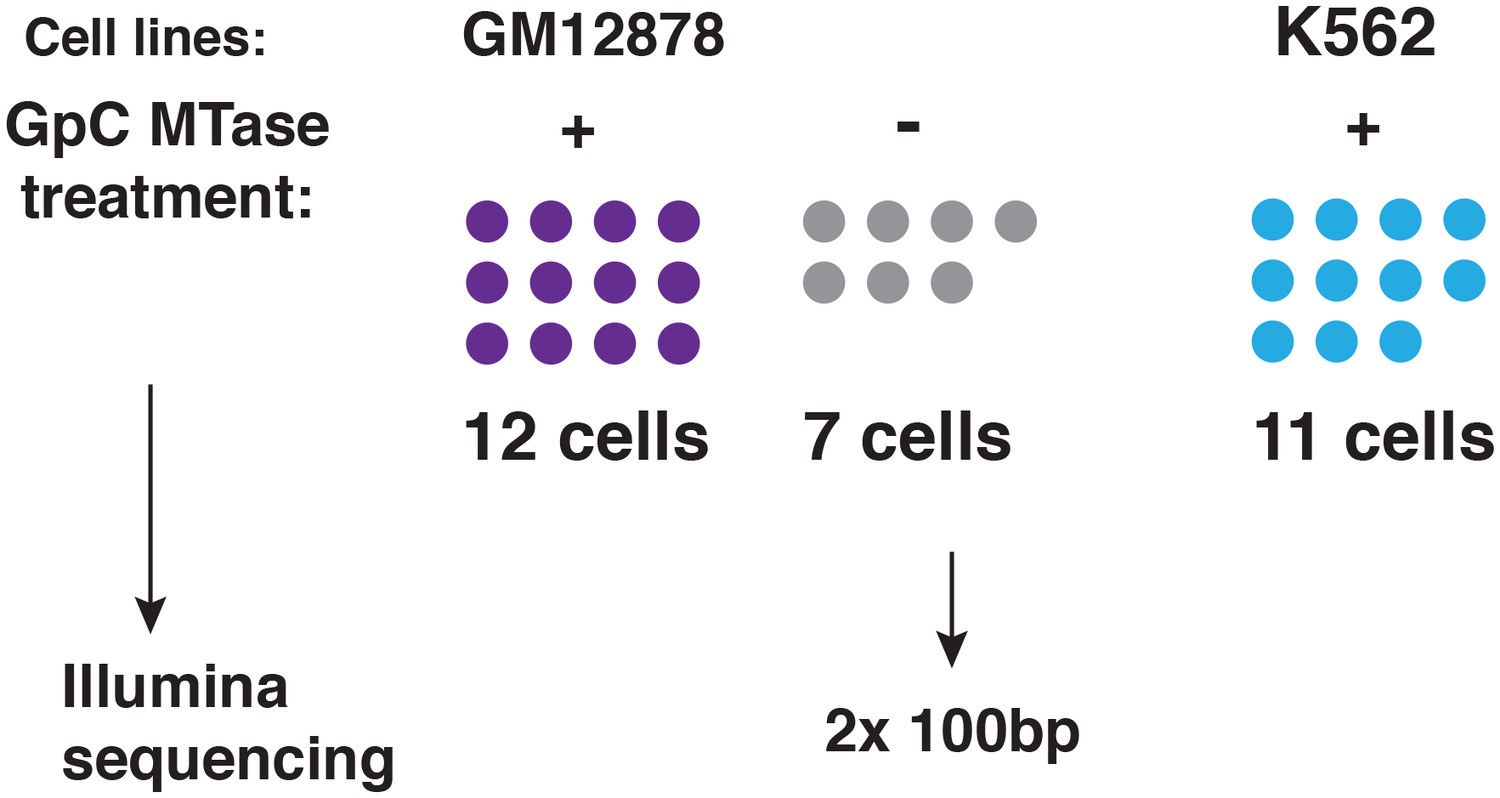
Schematic of experimental set up.
A total of 19 individual cells from GM12878 were profiled in this study, 12 of these cells were exposed to GpC MTase and seven were subjected to the same process without exposure to MTase. For K562 11 cells were profiled all of which were subjected to GpC MTase treatment.
Figure 1—figure supplement 3
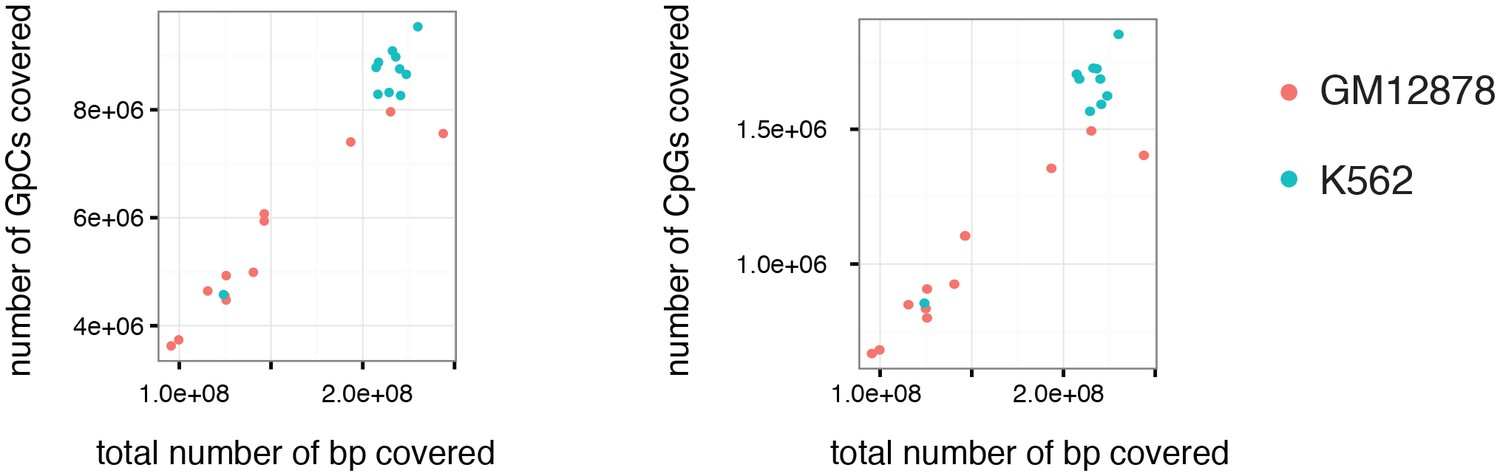
Number of covered GpC and CpG dinucleotides is proportional to the number of total bases covered.
Number of covered cytosines in GpC and CpG dinucleotides plotted against the total number of nucleotides covered per sample. This comparison suggests that there is no strong bias towards or against GpC and CpG dinucleotides. This plot also shows that the coverage was about 2-fold higher for K562 cells compared to GM12878.
Figure 2 with 15 supplements
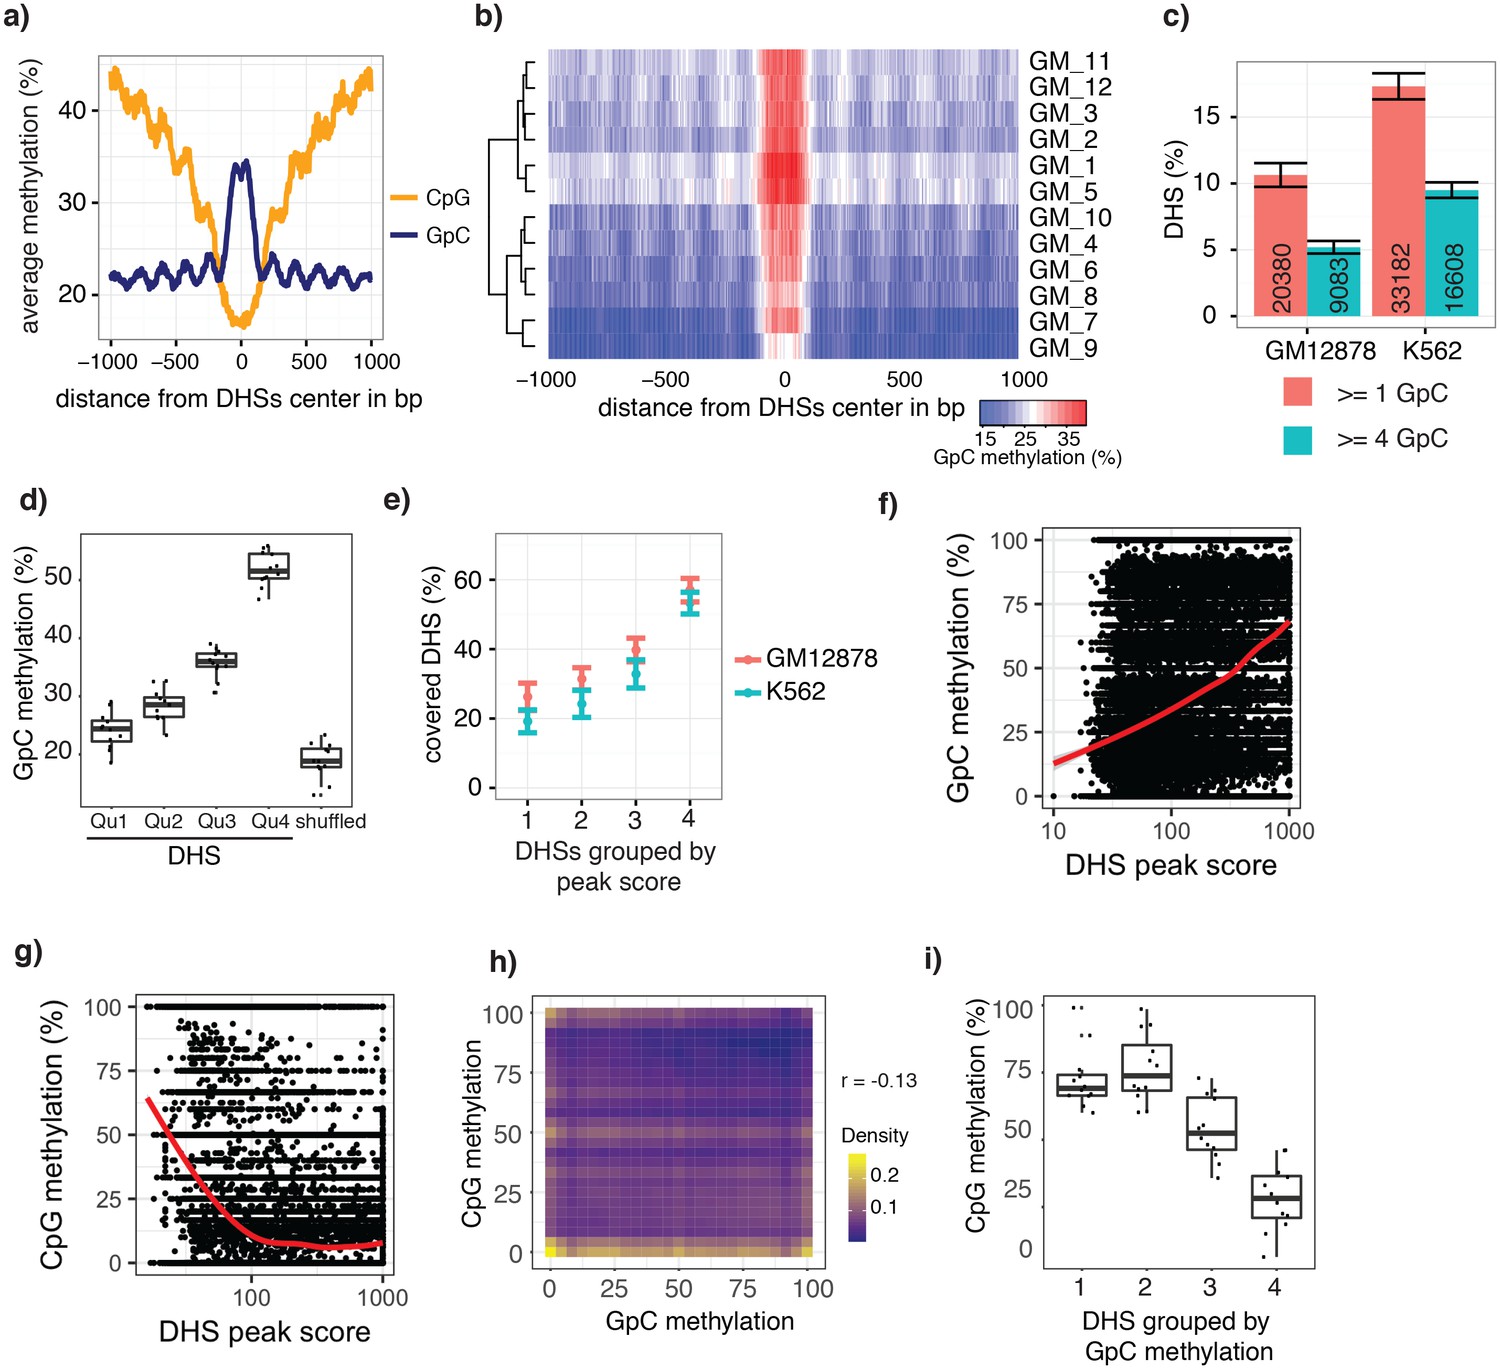
scNOMe-seq data reveal how accessibility in single cells underlies observed DNaseI hypersensitivity in a population of cells.
(a) Average GpC methylation level (blue) and CpG methylation level (orange) at DHSs in GM12878 cells. Regions are centered on the middle of DNase-seq peak locations. Shown is the average methylation across a 2 kb window of 12 GM12878 cells. (b) Heatmap displaying the average GpC methylation level across the same regions as in a). Each row corresponds to an individual GM12878 cell. Cells were grouped by similarity. (c) Proportion of DHSs covered by scNOMe-seq sequencing reads in each cell. The proportion displayed corresponds to the fraction of DHSs covered by at least 1 or 4 GpCs in a given cell. Only DHSs with at least 1 GpC (red) or 4 GpCs (cyan) within their primary sequence were taken in consideration. Error bars represent standard deviation. (d) Average GpC methylation at DHSs grouped into quartiles based on associated DNase-seq peak scores from lowest to highest scores. ‘Shuffled’ represents methylation data in genomic regions obtained by random placements of DHS peak intervals. Data shown are from GM12878 cells. (e) Fraction of accessible sites in individual GM12878 cells (red) and K562 cells (cyan). Shown are the means and standard deviation based on all cells. (f) Scatter plot showing relationship between GpC methylation levels and DHS peaks score for each covered DHS. Plot shows data from all individual GM12878 cells. Red trend line is shown to visualize the relationship between GpC methylation and endogenous CpG methylation. (g) Scatter plot showing relationship between CpG methylation levels and DHS peaks score for each covered DHS. Plot shows data from all individual GM12878 cells. Red trend line is shown to visualize the relationship between CpG methylation and peak scores. (h) Plot illustrates the relationship between endogenous CpG methylation and GpC methylation at DHS loci. Plot shows combined data from all GM12878 cells. Correlation was calculated based on Pearson correlation (r = −0.13) i) Average CpG methylation at DHS loci grouped based on GpC scores within single cells. Each dot represents the average CpG methylation level for a single cell.
Figure 2—figure supplement 1
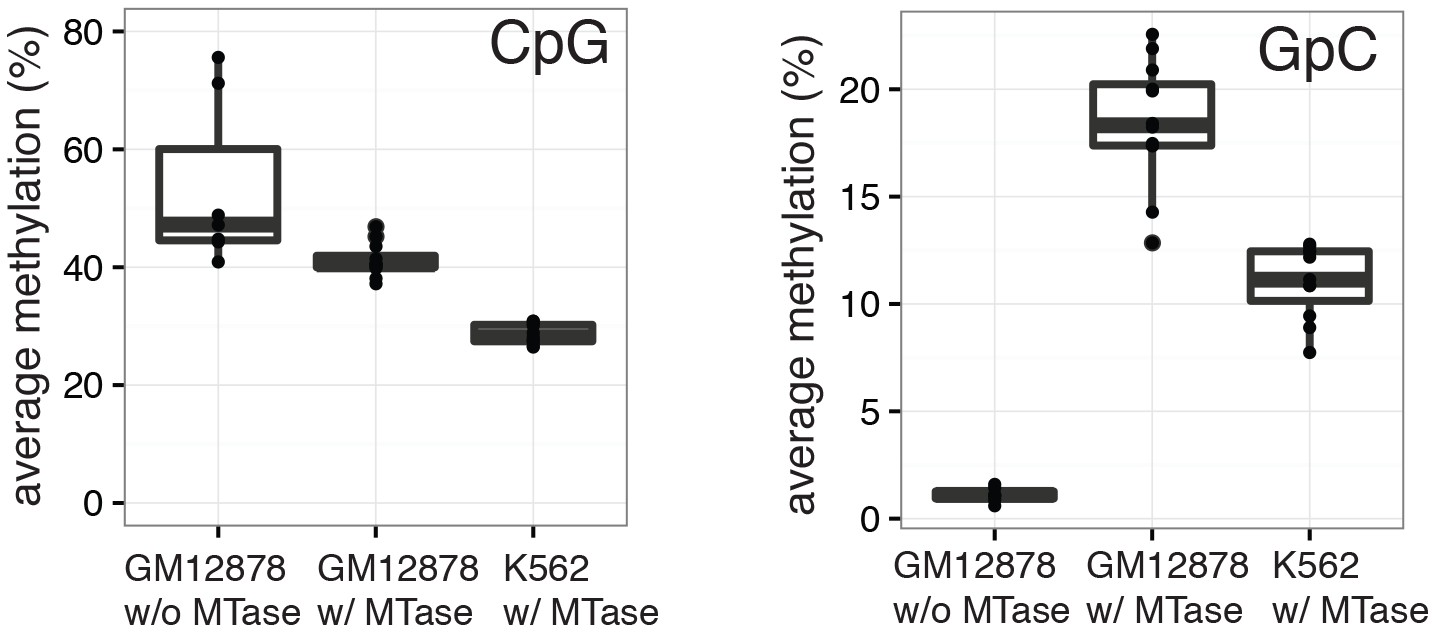
Average CpG and GpC methylation levels in single cells.
Boxplots representing the methylation level at CpG and GpC dinucleotides for groups of cells (GM12878 w/ and w/o MTase,K562 w/ MTase). GM12878 and K562 cells show different levels of CpG methylation. The difference in CpG methylation between GM12878 w/o MTase and GM12878 w/ MTase treatment was largely driven by two cells. These cells were kept as no other criterion suggested their removal. GpC MTase treated cells shows a clear enrichment of GpC methylation while GM12878 cells not exposed to MTase do not show levels above 1%. These might reflect incomplete conversion, minimal cross-contamination during the parallel preparation, or activity of endogenous methyltransferases.
Figure 2—figure supplement 2
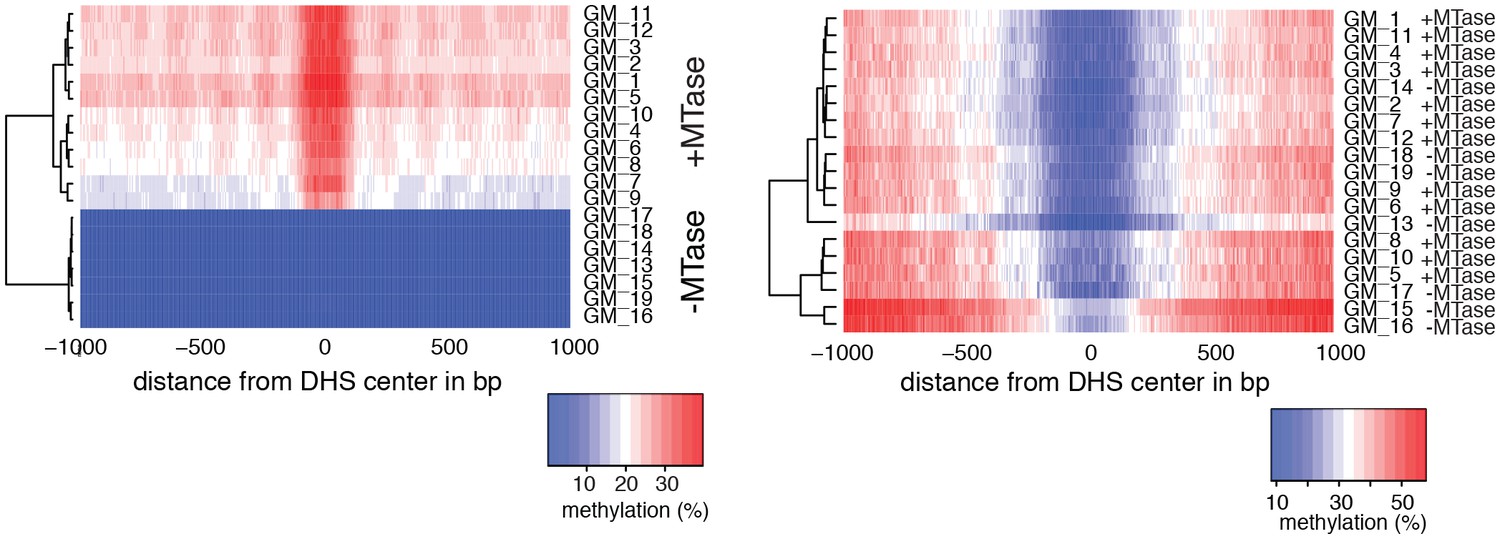
Heatmaps of average GpC and CpG methylation across DHS regions in GM12878 cells.
Each row represents data from an individual cell, both treated and control samples are plotted together. Cells were grouped using hierarchical clustering based on GpC methylation (left) and CpG methylation (right) within 2 kb regions around DHSs. As expected GpC methylation clearly separates MTase treated and untreated samples. Endogenous CpG methylation does not differ systematically between MTase treated and untreated samples.
Figure 2—figure supplement 3
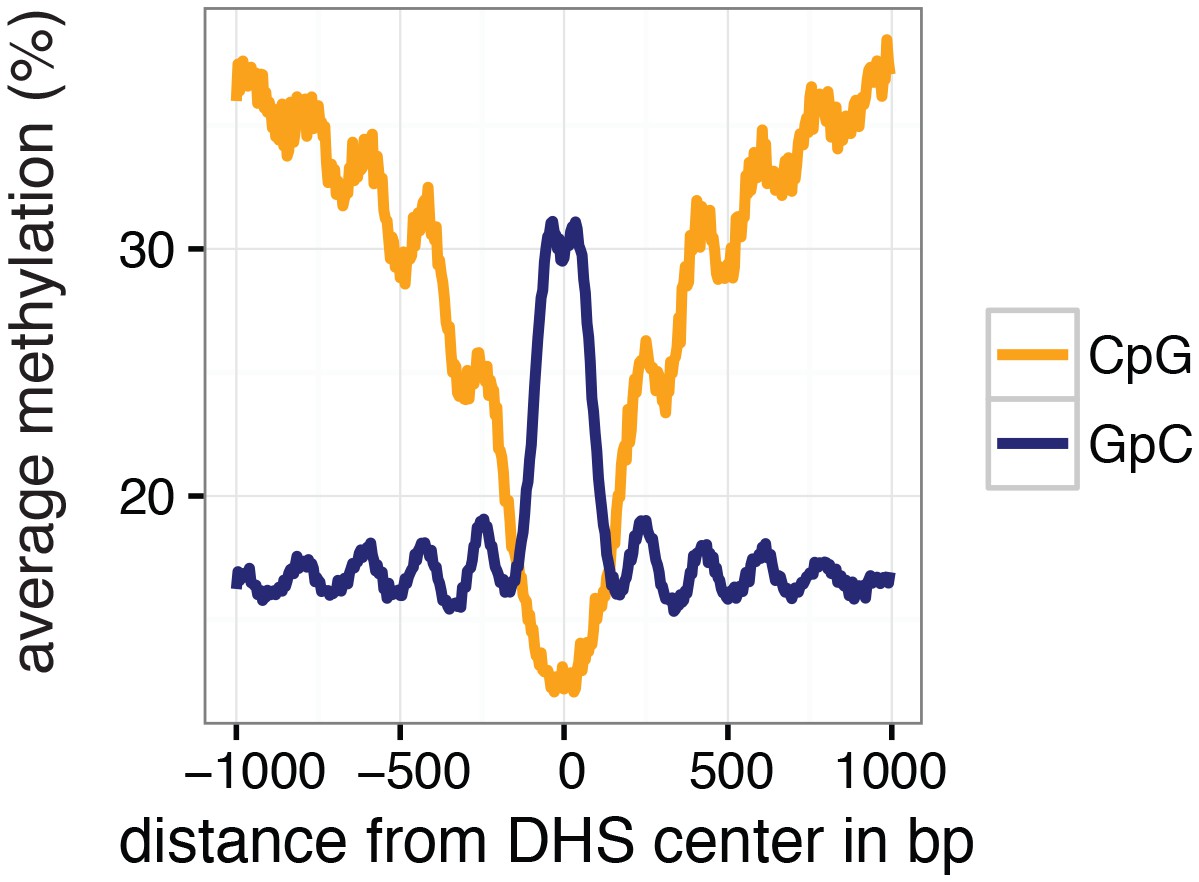
Average GpC and CpG methylation across DHS regions in K562 cells.
Average GpC methylation level (blue) and CpG methylation level (orange) at DNase Hypersensitive sites (DHSs) in K562 cells. Regions are centered on the middle of DNase-seq peak locations. Shown is the average methylation across a 2 kb window of the pool of 11 K562 cells.
Figure 2—figure supplement 4
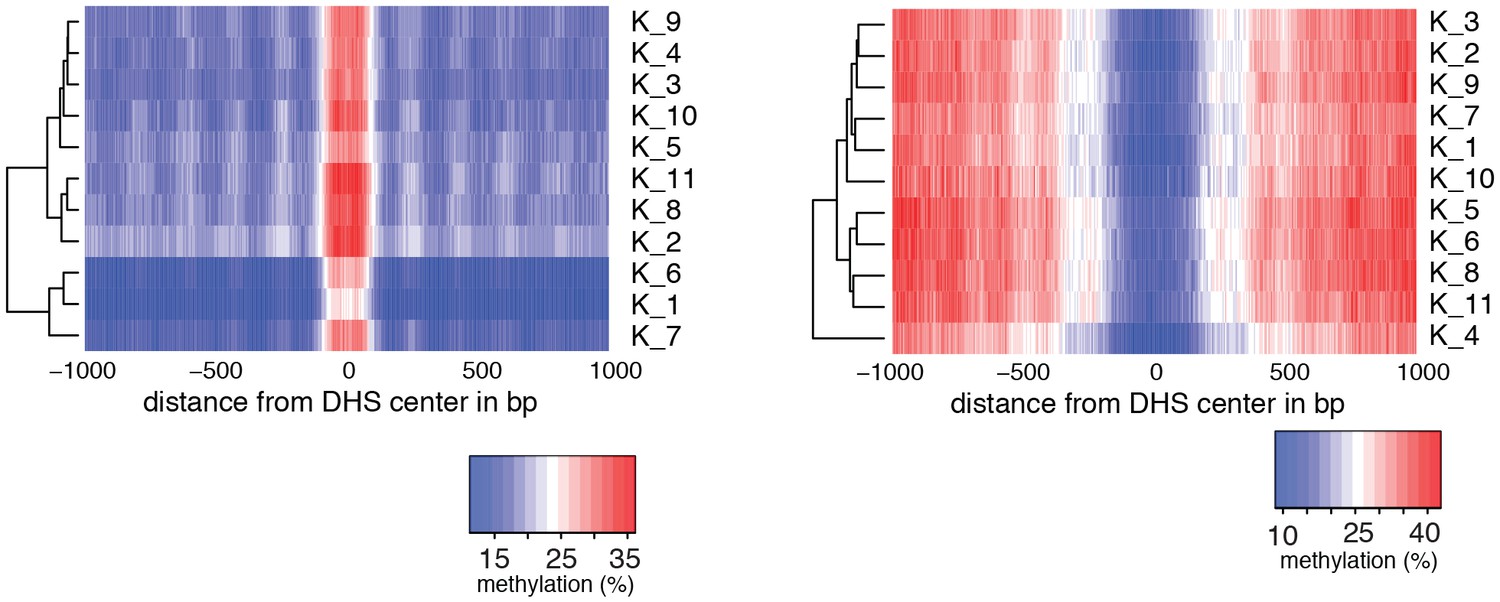
Heatmaps of average GpC and CpG methylation across DHS regions in K562 cells.
Each row represents data from an individual cell. Cells were grouped using hierarchical clustering based on GpC methylation (left) and CpG methylation (right) within 2 kb regions around DHSs.
Figure 2—figure supplement 5
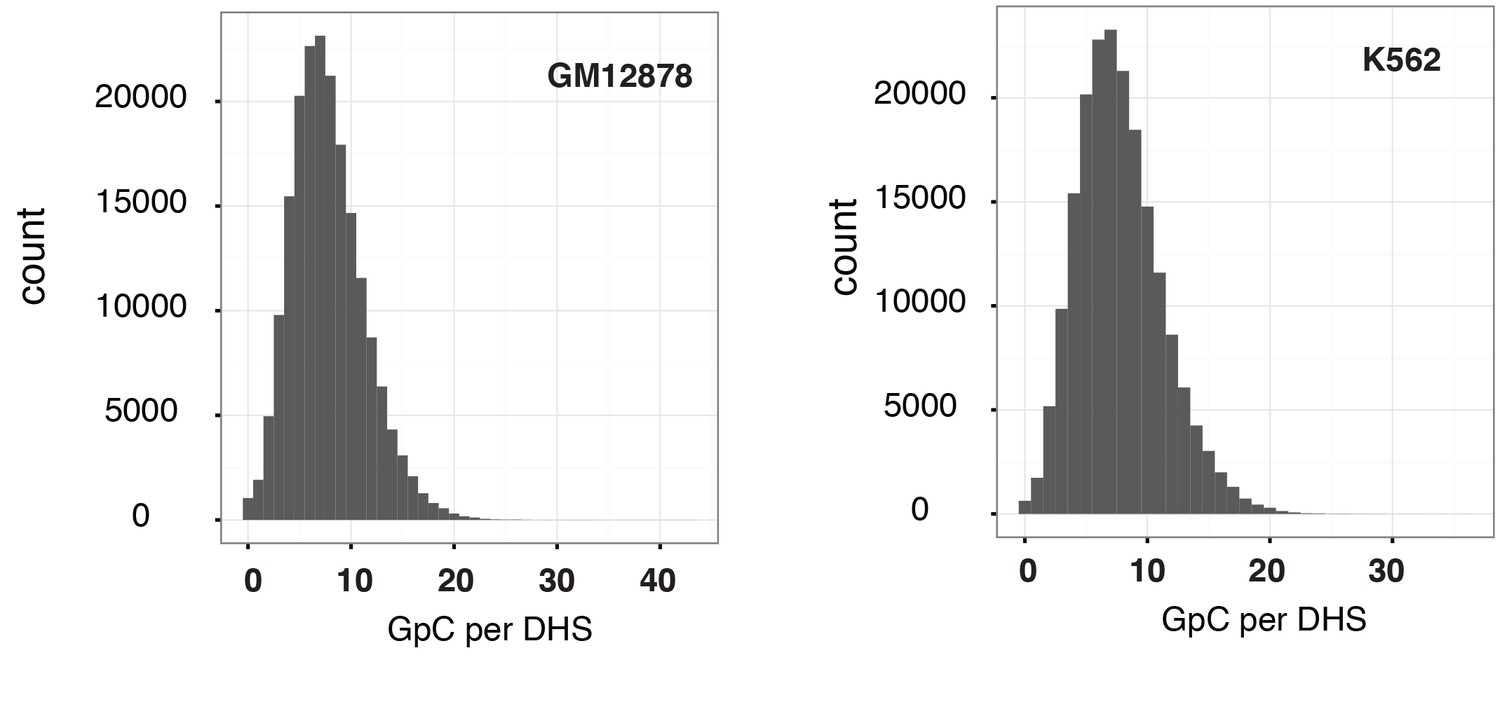
Distribution of counts of GpCs within DHSs in GM12878 and K562 cells.
Histogram shows the number of GpCs per DHS in GM12878 cells (left) and K562 cells (right). While each GpC dinucleotide can be measured on both strands and would therefore yield a count of two cytosines this histogram only displays counts per GpC (using the cytosines on the forward strand). This is to account for the fact that in single cells DHSs will be covered at most by one or two reads that originate from the same fragment.
Figure 2—figure supplement 6
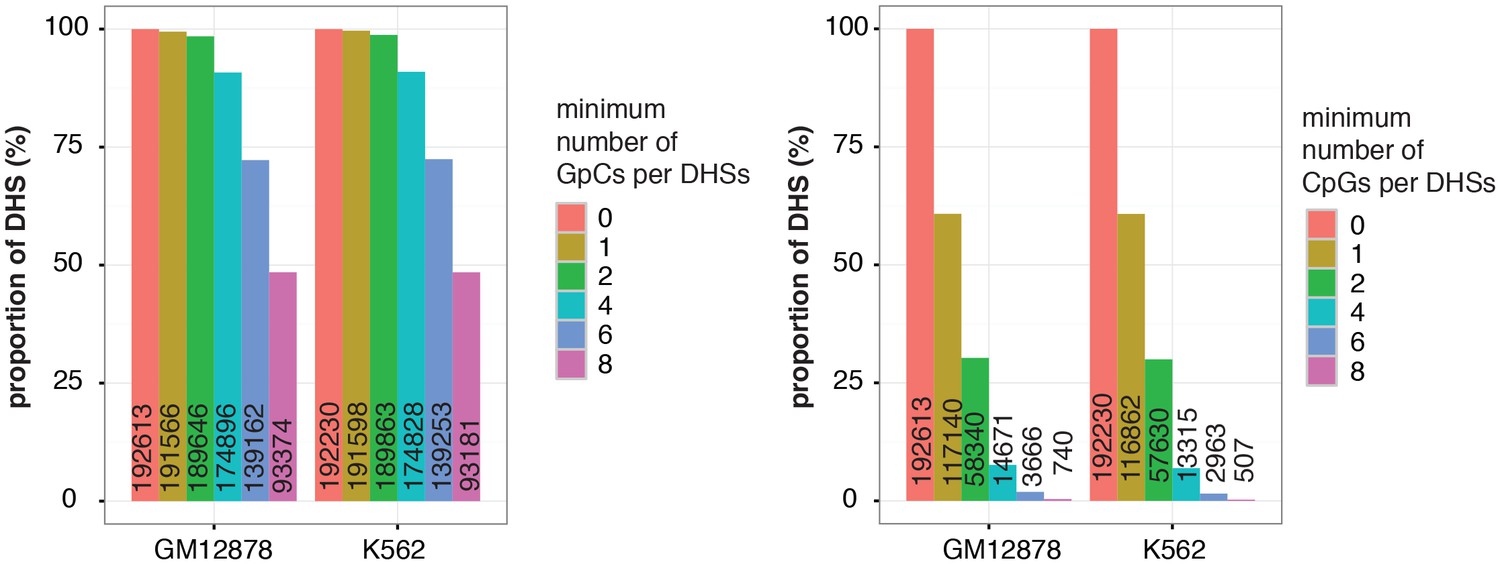
Proportion of DHSs at different cutoffs for GpCs and CpGs.
Bar graphs display proportion of DHSs that contain at least the number of GpCs (left) and CpGs (right) indicated. The proportions are given in relation to the total number of DHSs in each cell line. Numbers in the bars refer to the number of DHSs at that GpC and CpG threshold. As described in Figure 2—figure supplement 5 and methods, only cytosines in GpC and CpG di–nucleotides on the forward strand were counted for this analysis.
Figure 2—figure supplement 7
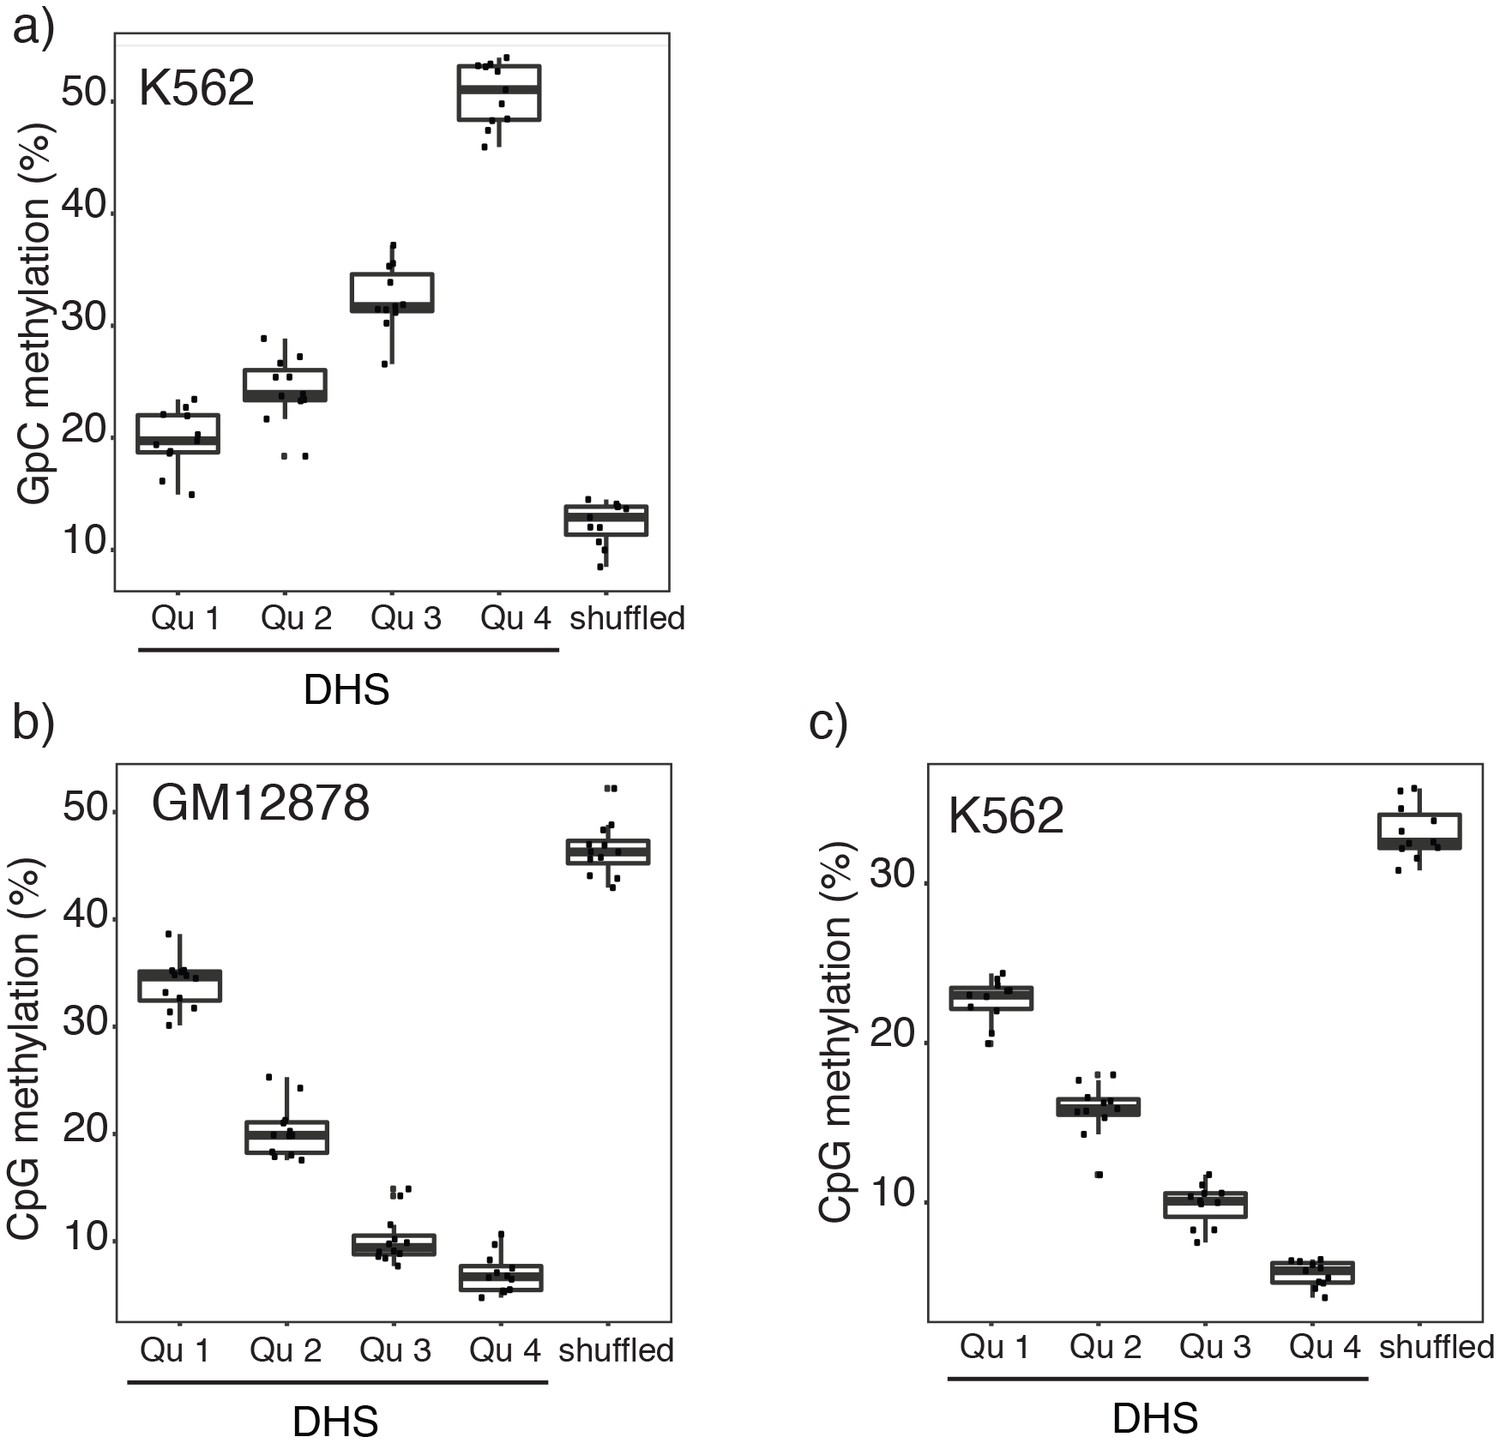
Relationship between DNase-seq peak score and GpC and CpG methylation in GM12878 and K562 cells.
(a) Average GpC methylation and (b), (c) endogenous CpG methylation at DHSs grouped into quartiles based on associated DNase-seq peak scores from lowest to highest scores. ‘Shuffled’ represents methylation data in genomic regions obtained by random placements of DHS peak intervals. (a) and (c) show data for 11 K562 cells and (b) shows data for 12 GM12878 cells. Each point represents average score from a single cell.
Figure 2—figure supplement 8
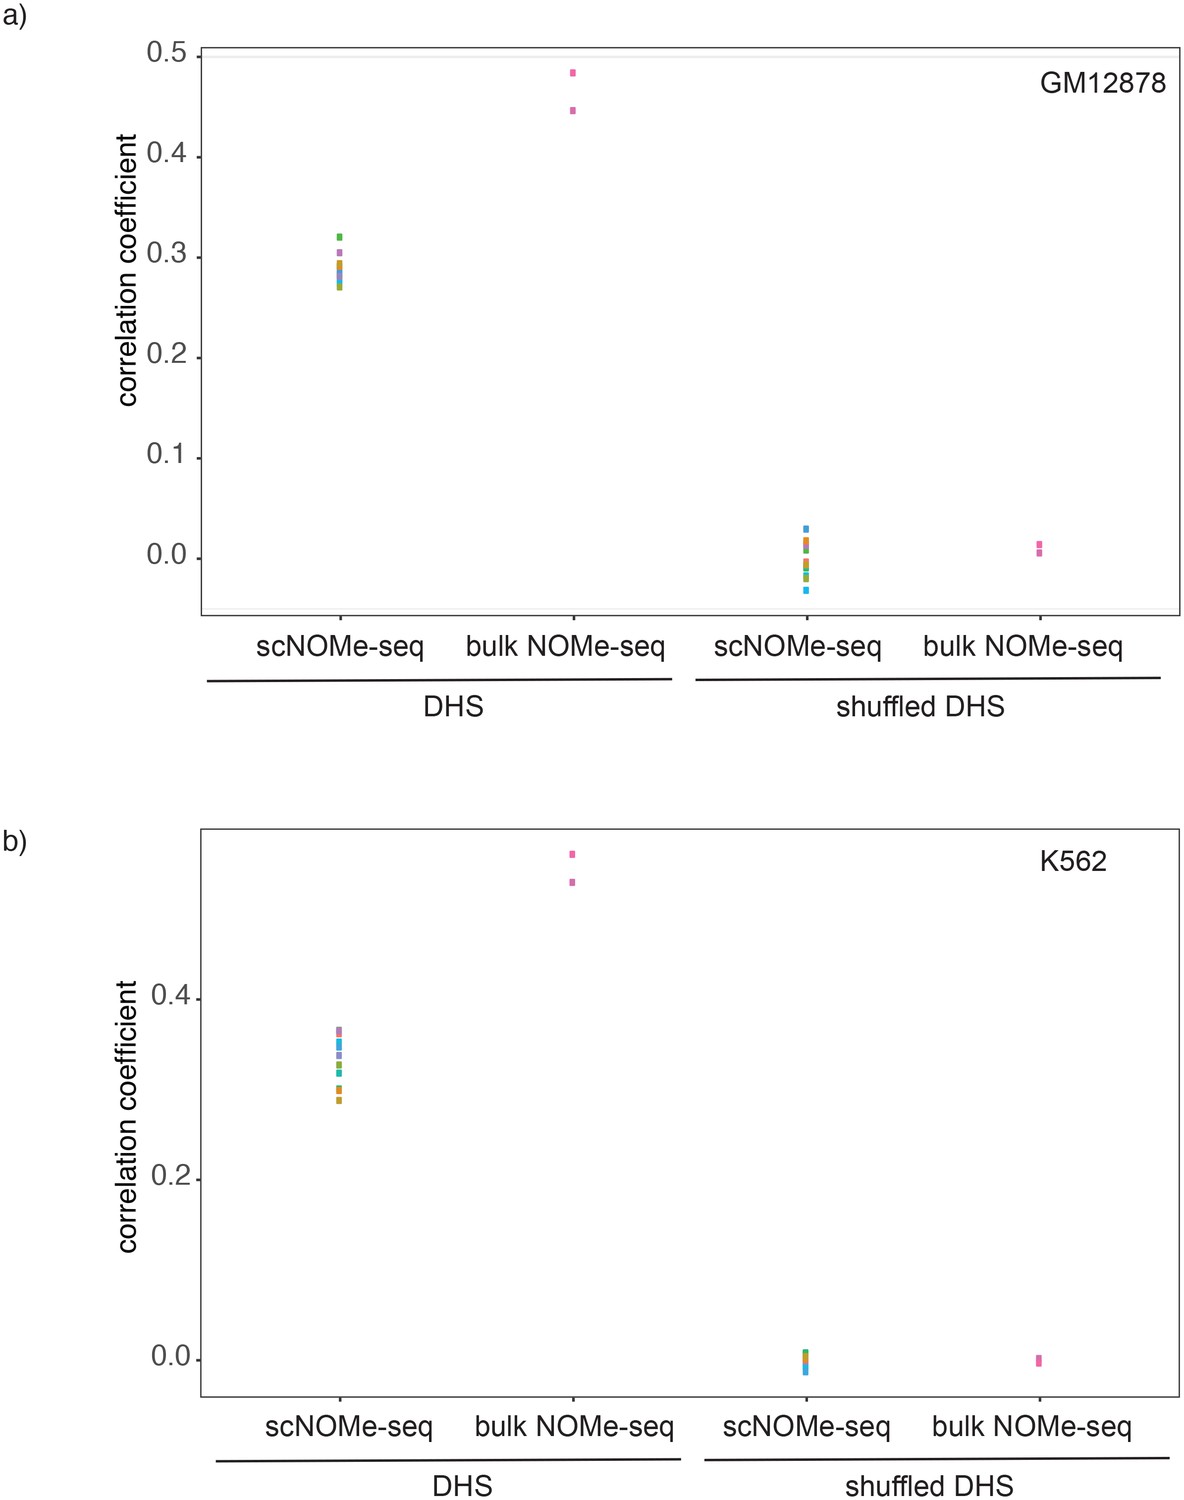
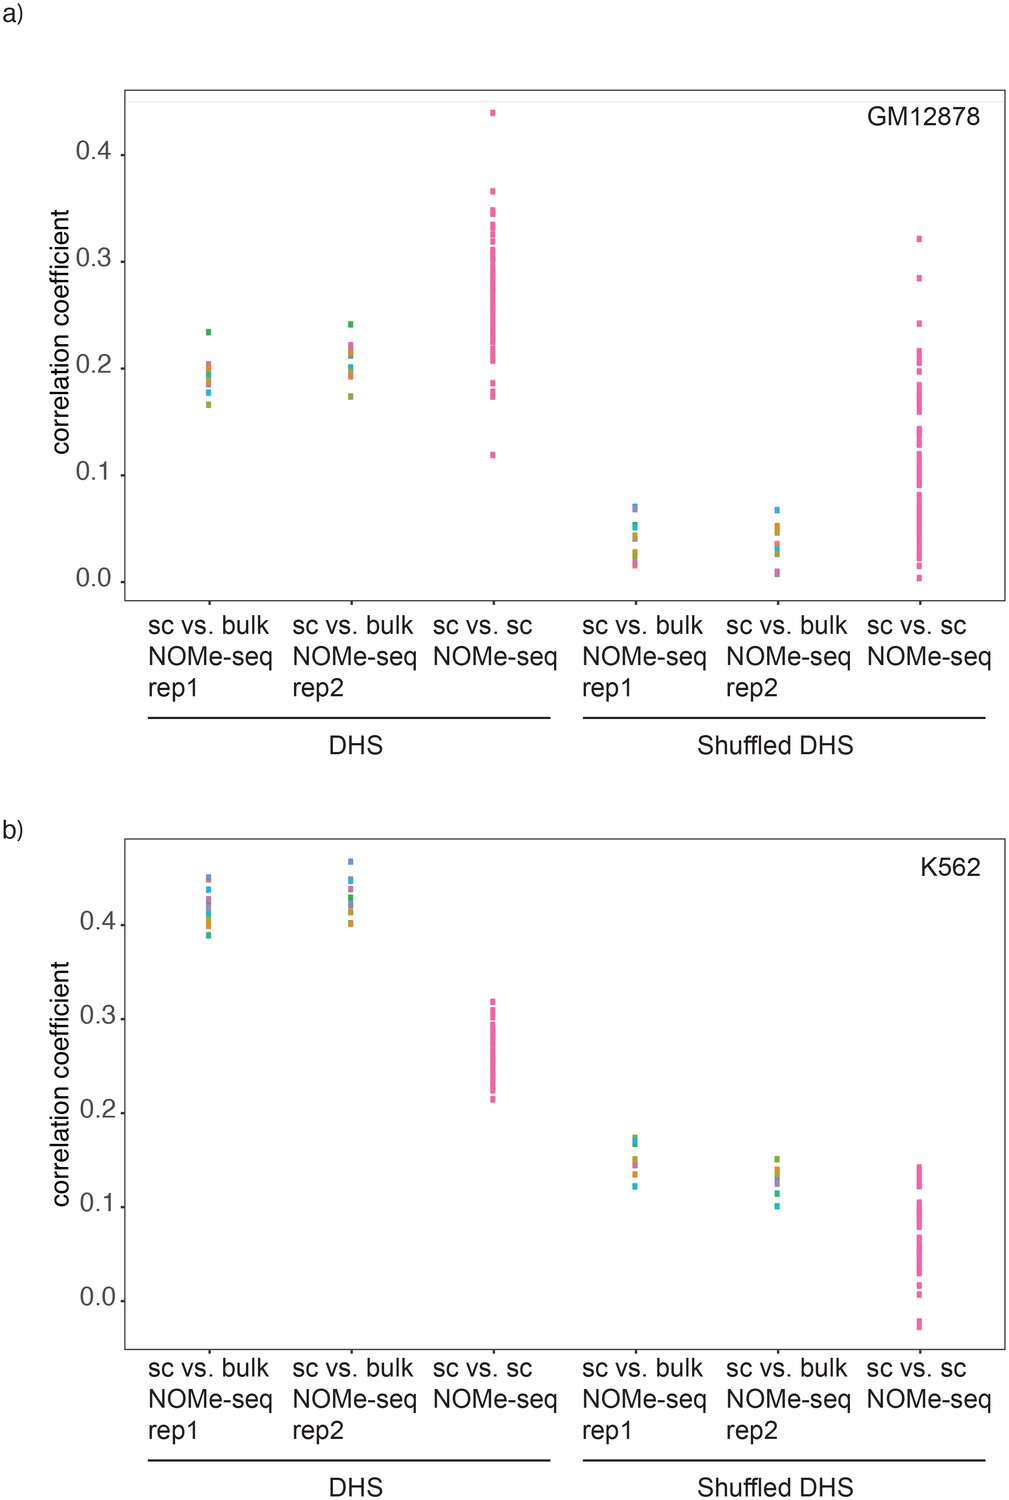
Correlation between GpC methylation and DHS peak score.
Shown are correlation coefficients for comparisons between single cell and bulk NOMe-seq data with DNase-seq peak score for each covered location for (a) GM12878 and (b) K562. Each dot represents value for a single Pearson correlation. The correlation between GpC methylation and DHS peaks scores was significantly lower in single cells compared to bulk NOMe-seq data. No correlation was observed between GpC methylation and DHS peak score using randomized DHS locations.
Figure 2—figure supplement 9
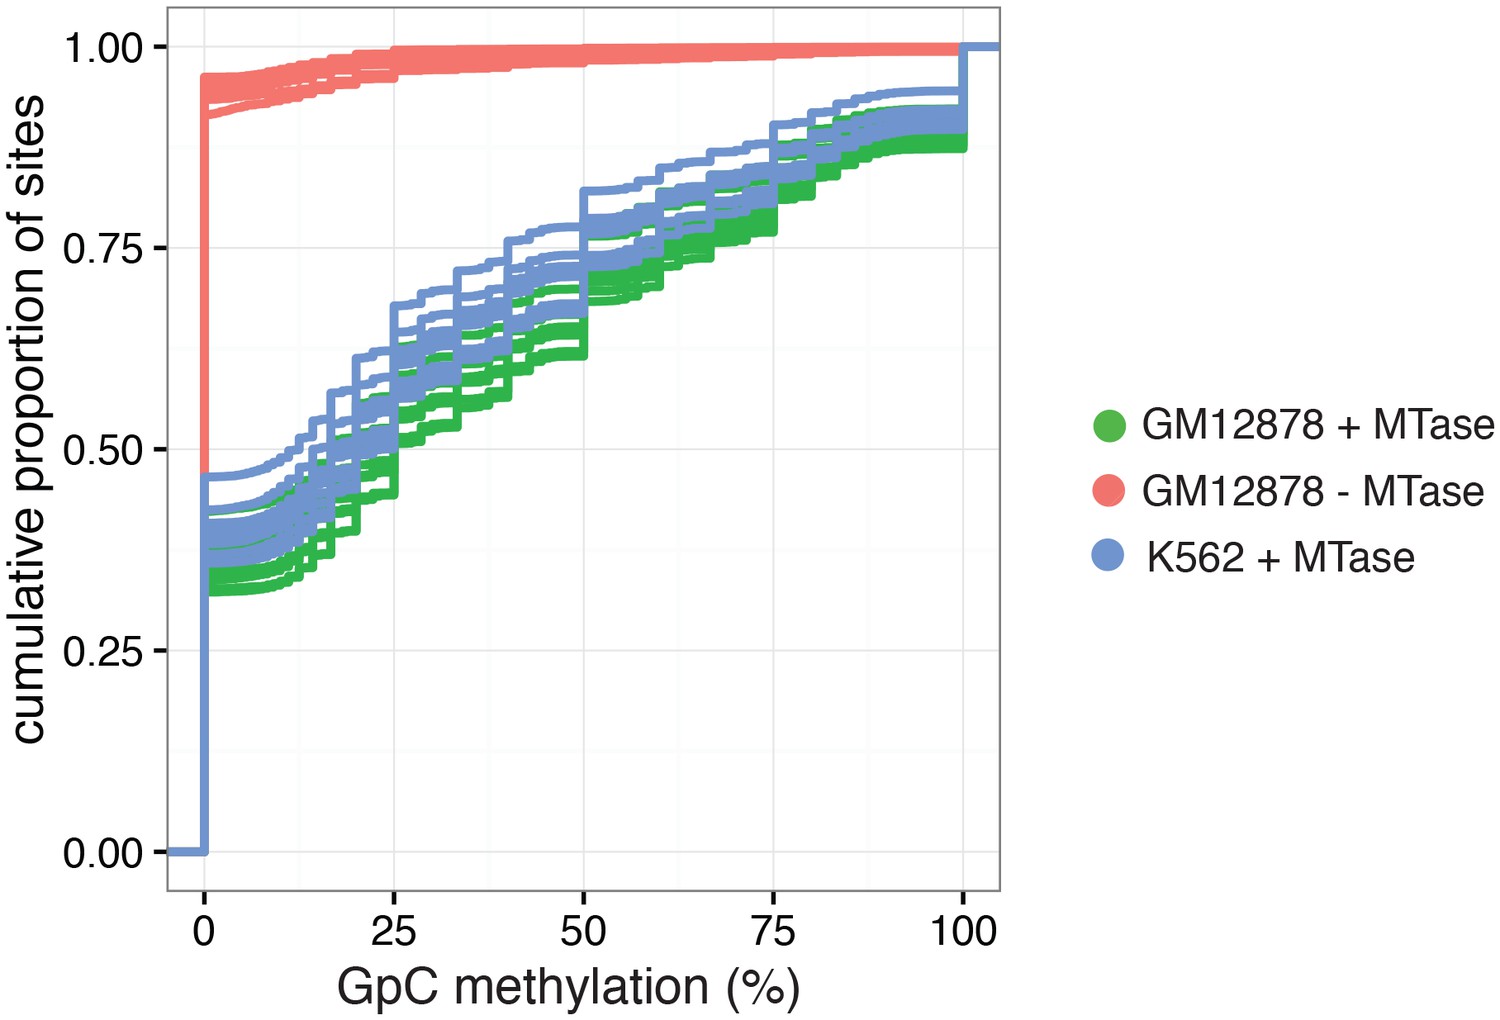
Cumulative distribution of average GpC methylation in DHSs in GM12878 and K562 cells.
Plot of cumulative distribution of GpC methylation for individual GM12878 and K562 cells at DHSs with at least four covered GpC. GM12878 and K562 cells exposed to GpC MTase show similar distributions. About 50% of all cells show no or low methylation (< = 25%). GM12878 cells not exposed to GpC MTase do not show any significant number of DHSs with GpC methylation.
Figure 2—figure supplement 10
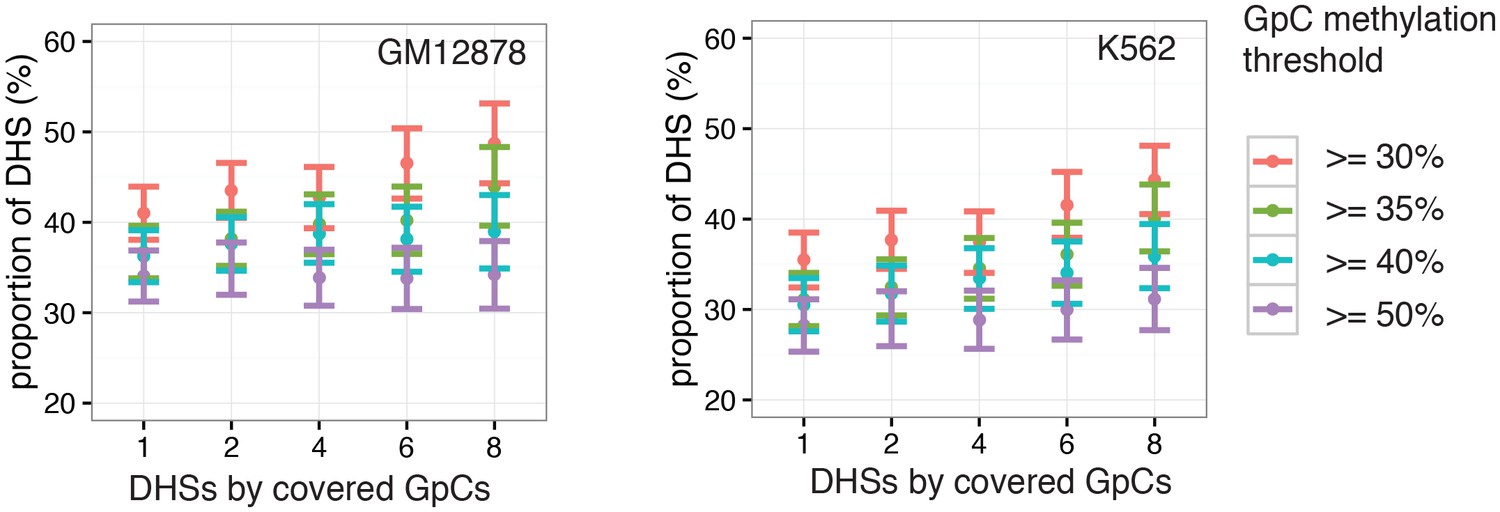
Proportion of accessible DHSs remains stable across range of thresholds for methylation levels and covered GpCs per site.
Different thresholds for GpC methylation and number of covered GpC required per individual DHS were used to test how much the number of resulting ‘accessible’ DHSs depended on these parameters. Threshold for GpC methylations was varied between 25% and 50% while the number of required GpCs for a DHSs to be considered in this analysis was varied between 1 and 8. The proportion of accessible sites is plotted for each set of parameters in GM12878 cells (left) and K562 cells (right). Proportion of accessible sites remained relatively stable across the range of parameters. Note that the categories with low GpCs count thresholds contain all sites above this threshold.
Figure 2—figure supplement 11
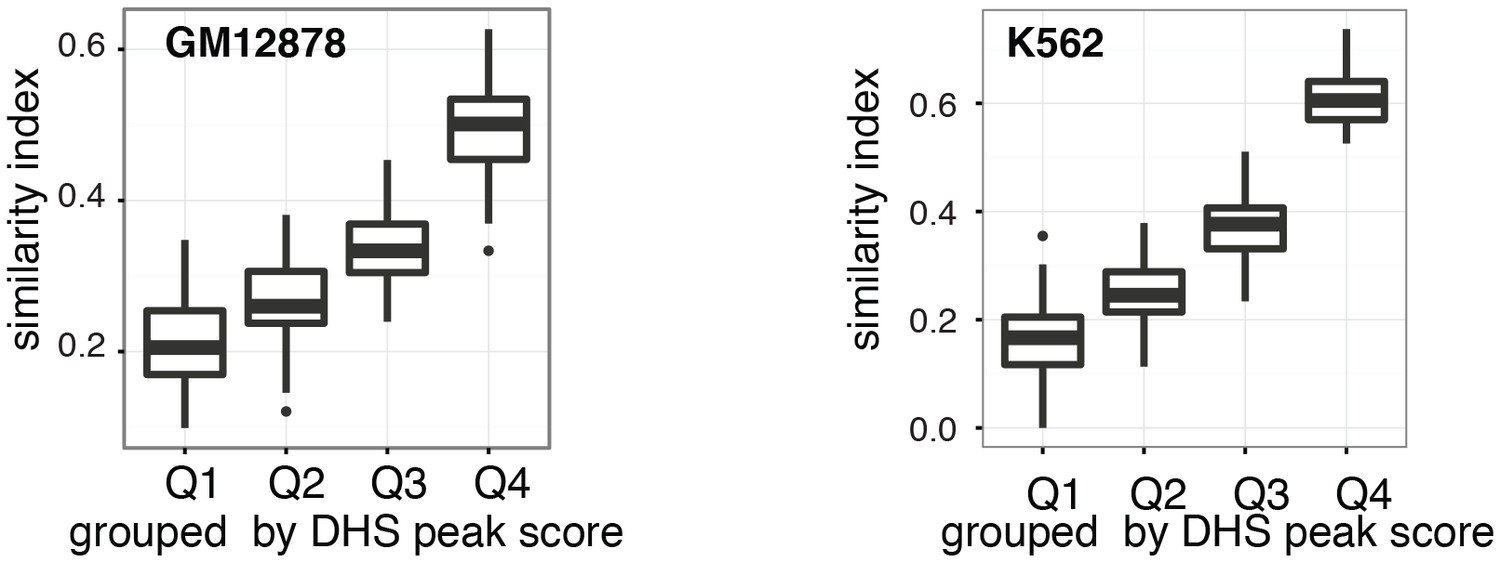
Cell-to-cell variability in DHSs accessibility reflects DNaseI hypersensitivity of the region.
Pair-wise jaccard distances between GM12878 (a) and K562 (b) cells, respectively, were calculated based on DHSs accessibility in individual cells. DHSs were grouped by DNase-seq peak scores and DHSs were considered accessible if the average methylation for that locus was above 40%. Only DHSs with at least four covered GpCs were included in this analysis.
Figure 2—figure supplement 12
Comparison of correlations between single cell NOMe-seq and bulk NOMe-seq data sets.
Shown are the correlation coefficients for comparisons between GpC methylation in single cell and bulk NOMe-seq data within DNase-seq peak location for a) GM12878 and b) K562. Each dot represents value for a single Pearson correlation. Comparison was performed on original DHS loci (left) and on randomized DHS loci (right).
Figure 2—figure supplement 13
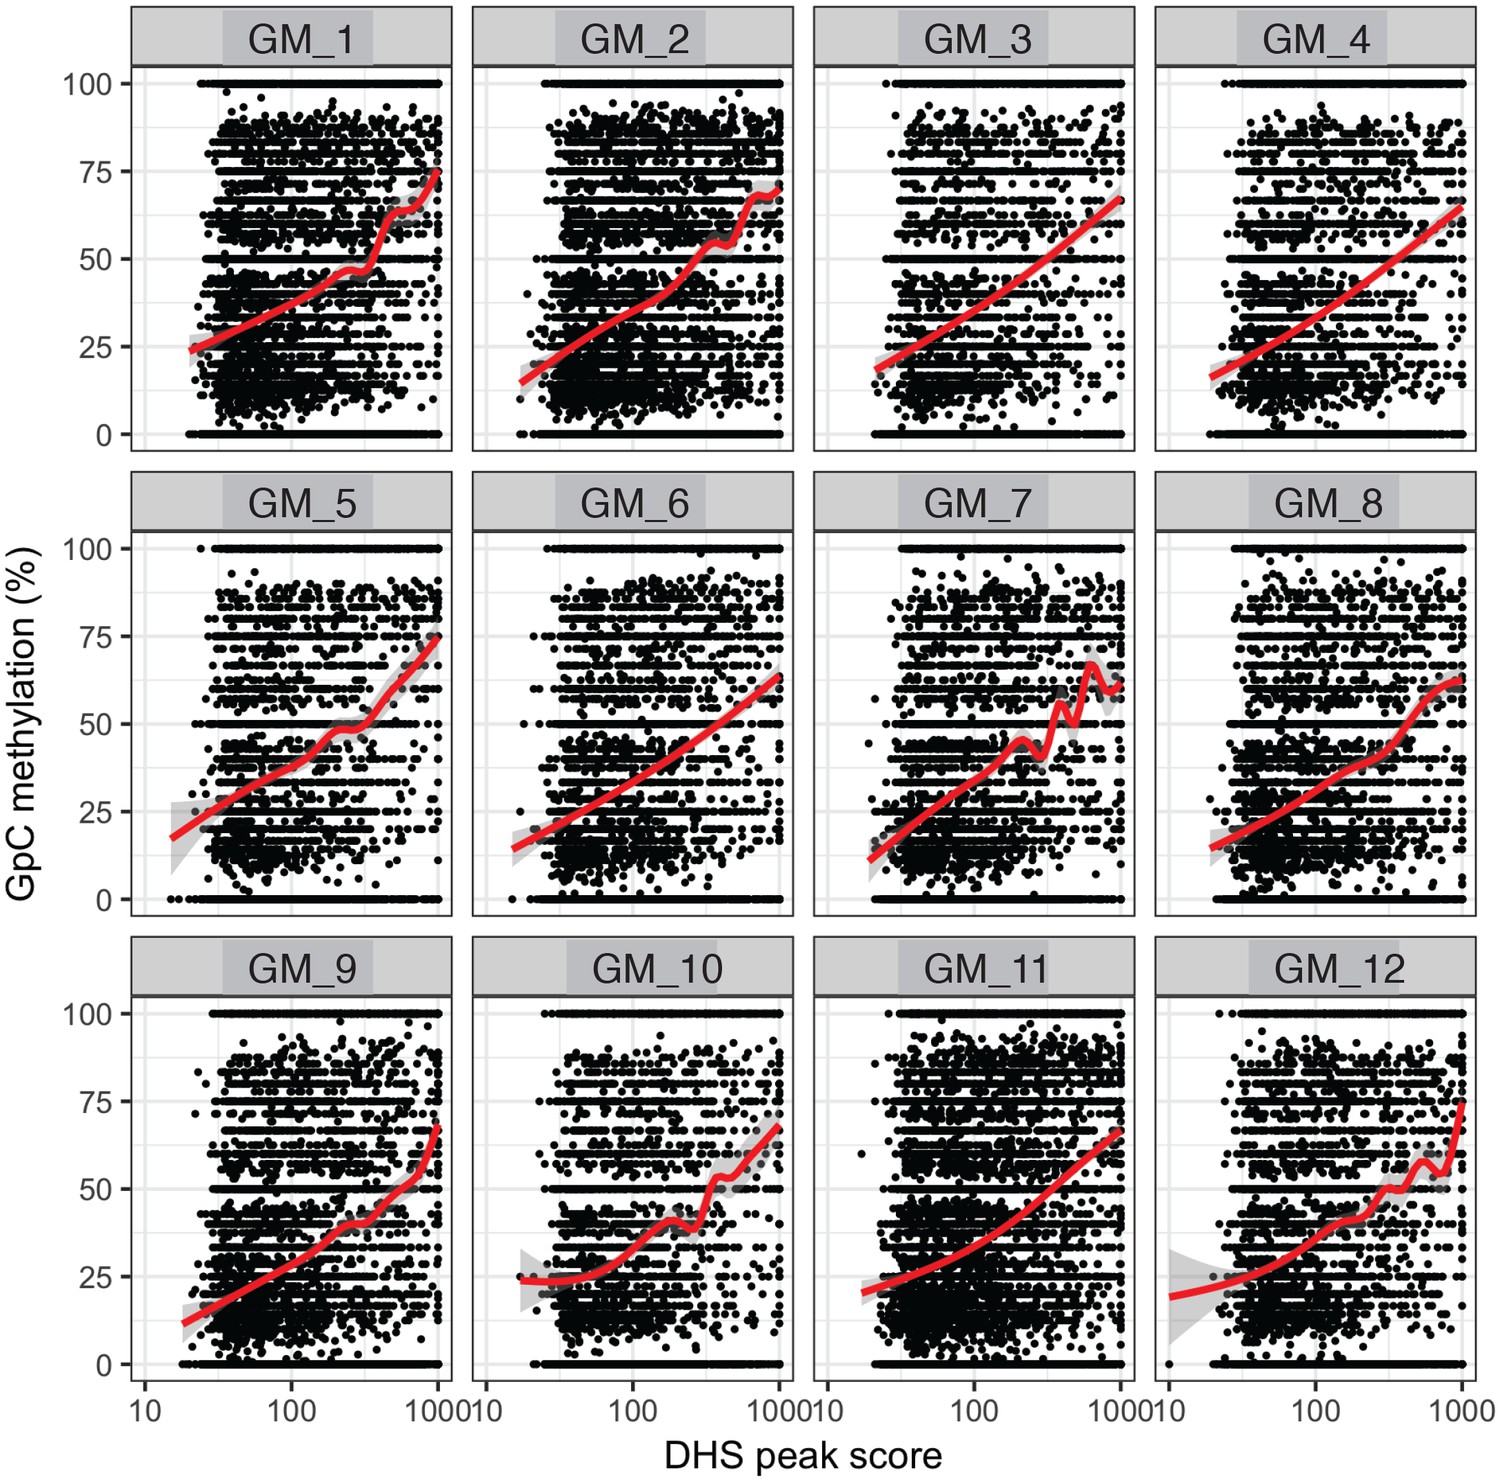
GpC methylation correlates with DHS peaks scores in individual cells.
High DHS peak scores are associated with higher GpC methylation in single cells. Scatter plot showing relationship between GpC methylation levels and DHS peaks scores for each covered DHS. Each plot shows data from an individual GM12878 cell. Red trend line to aid visualization of the relationship between GpC methylation and peak scores.
Figure 2—figure supplement 14
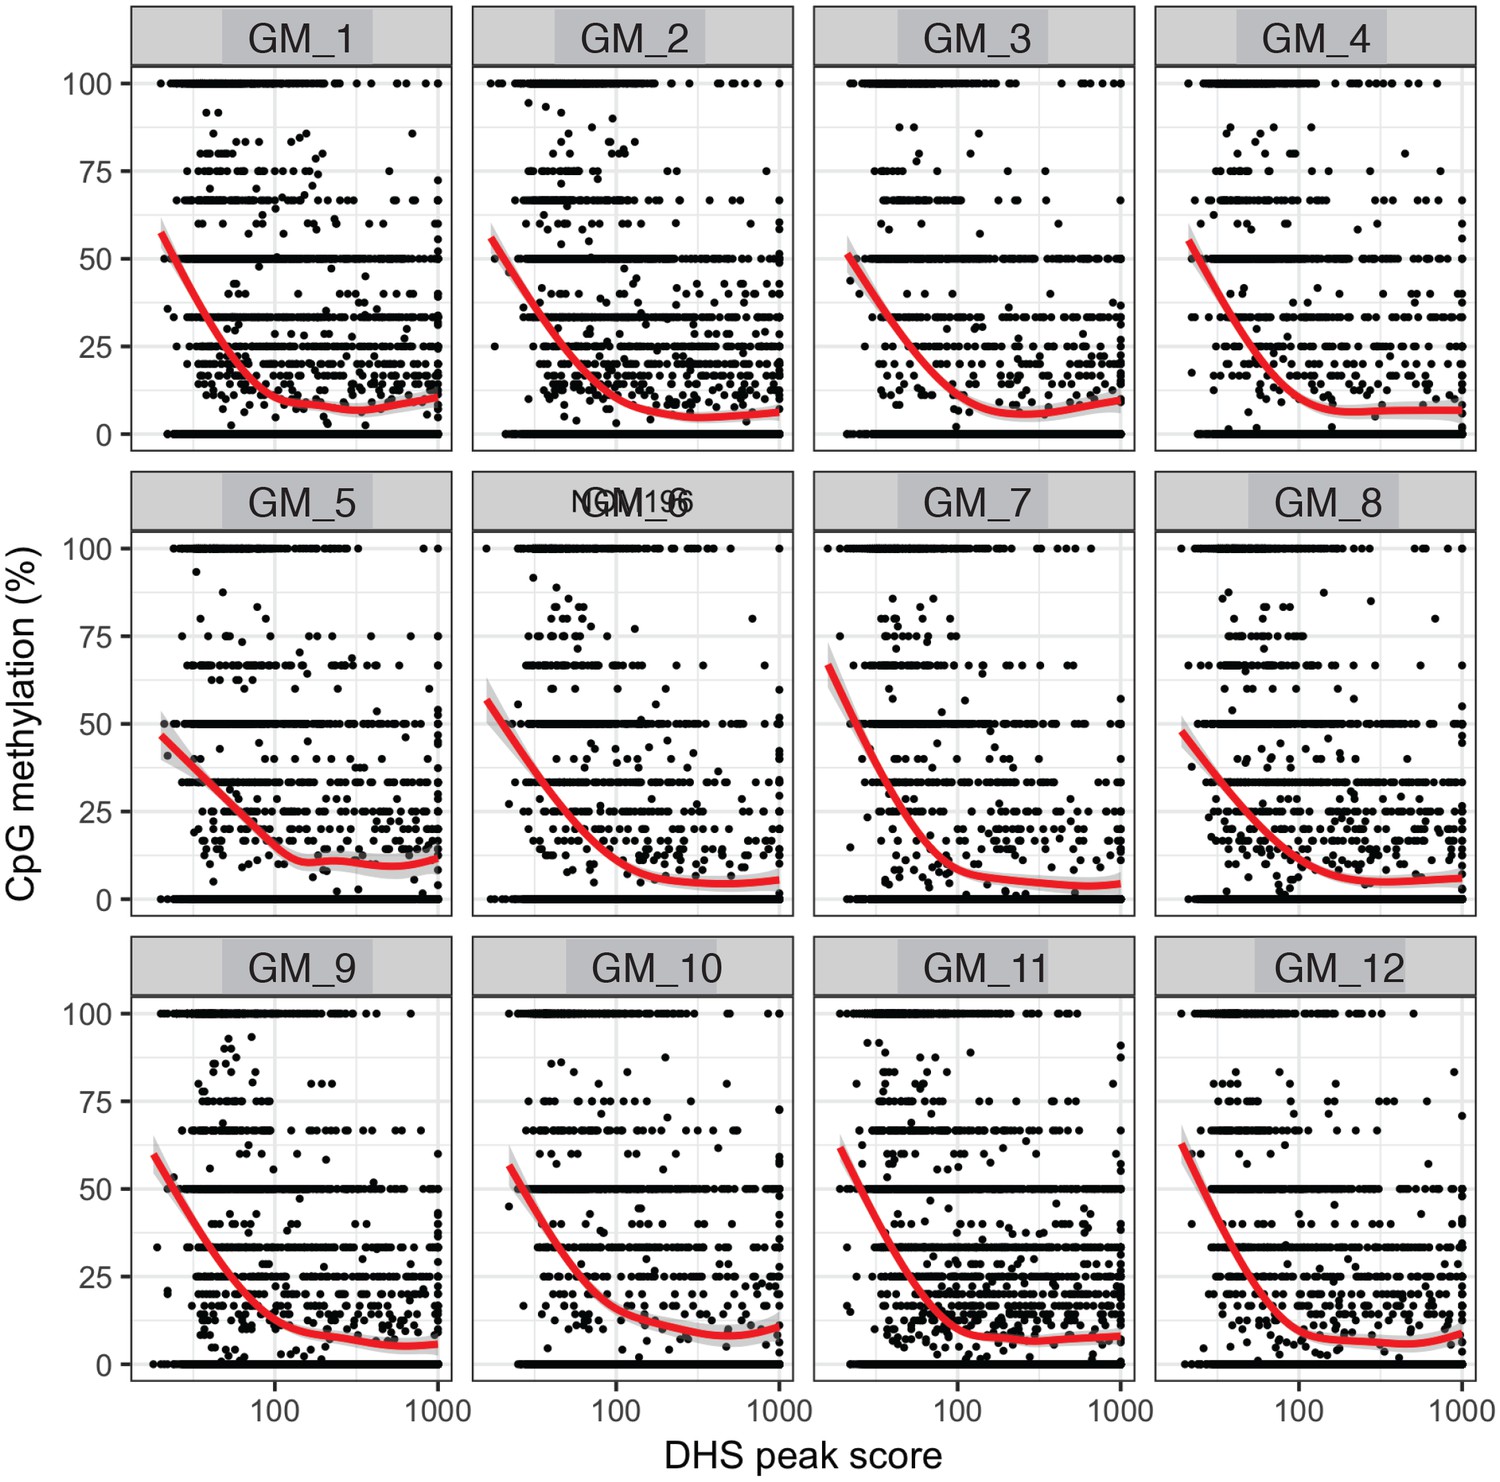
Endogenous CpG methylation is inversely correlated with DHS peak scores in individual cells.
High DHS peak scores are associated with lower endogenous CpG methylation in single cells. Scatter plot showing relationship between CpG methylation levels and DHS peaks score for each covered DHS. Each plot shows data from an individual GM12878 cell. Red trend line to aid visualization of the relationship between GpC methylation and peak scores.
Figure 2—figure supplement 15
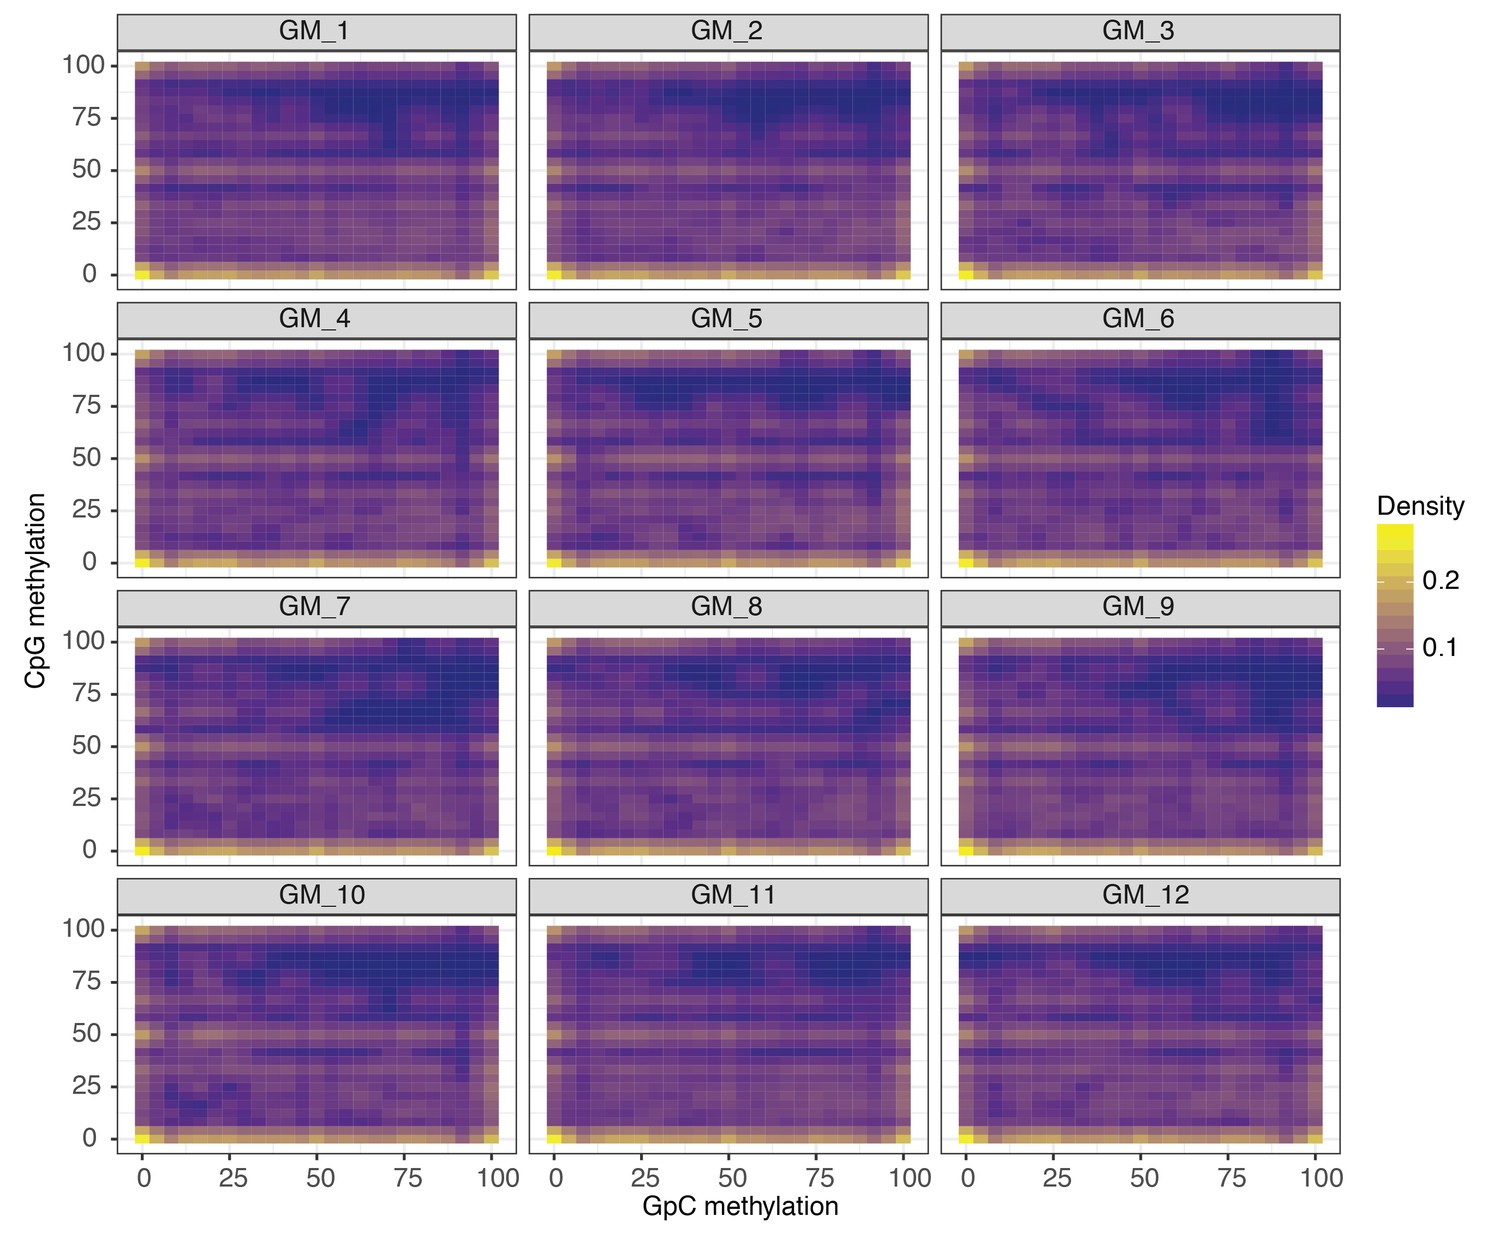
Comparison of CpG and GpC methylation status at individual DHS in single GM12878 cells.
Smoothened scatterplot illustrates the relationship between endogenous CpG methylation and GpC methylation at DHS loci. Each plot shows data from a single GM12878 cell.
Figure 3 with 2 supplements
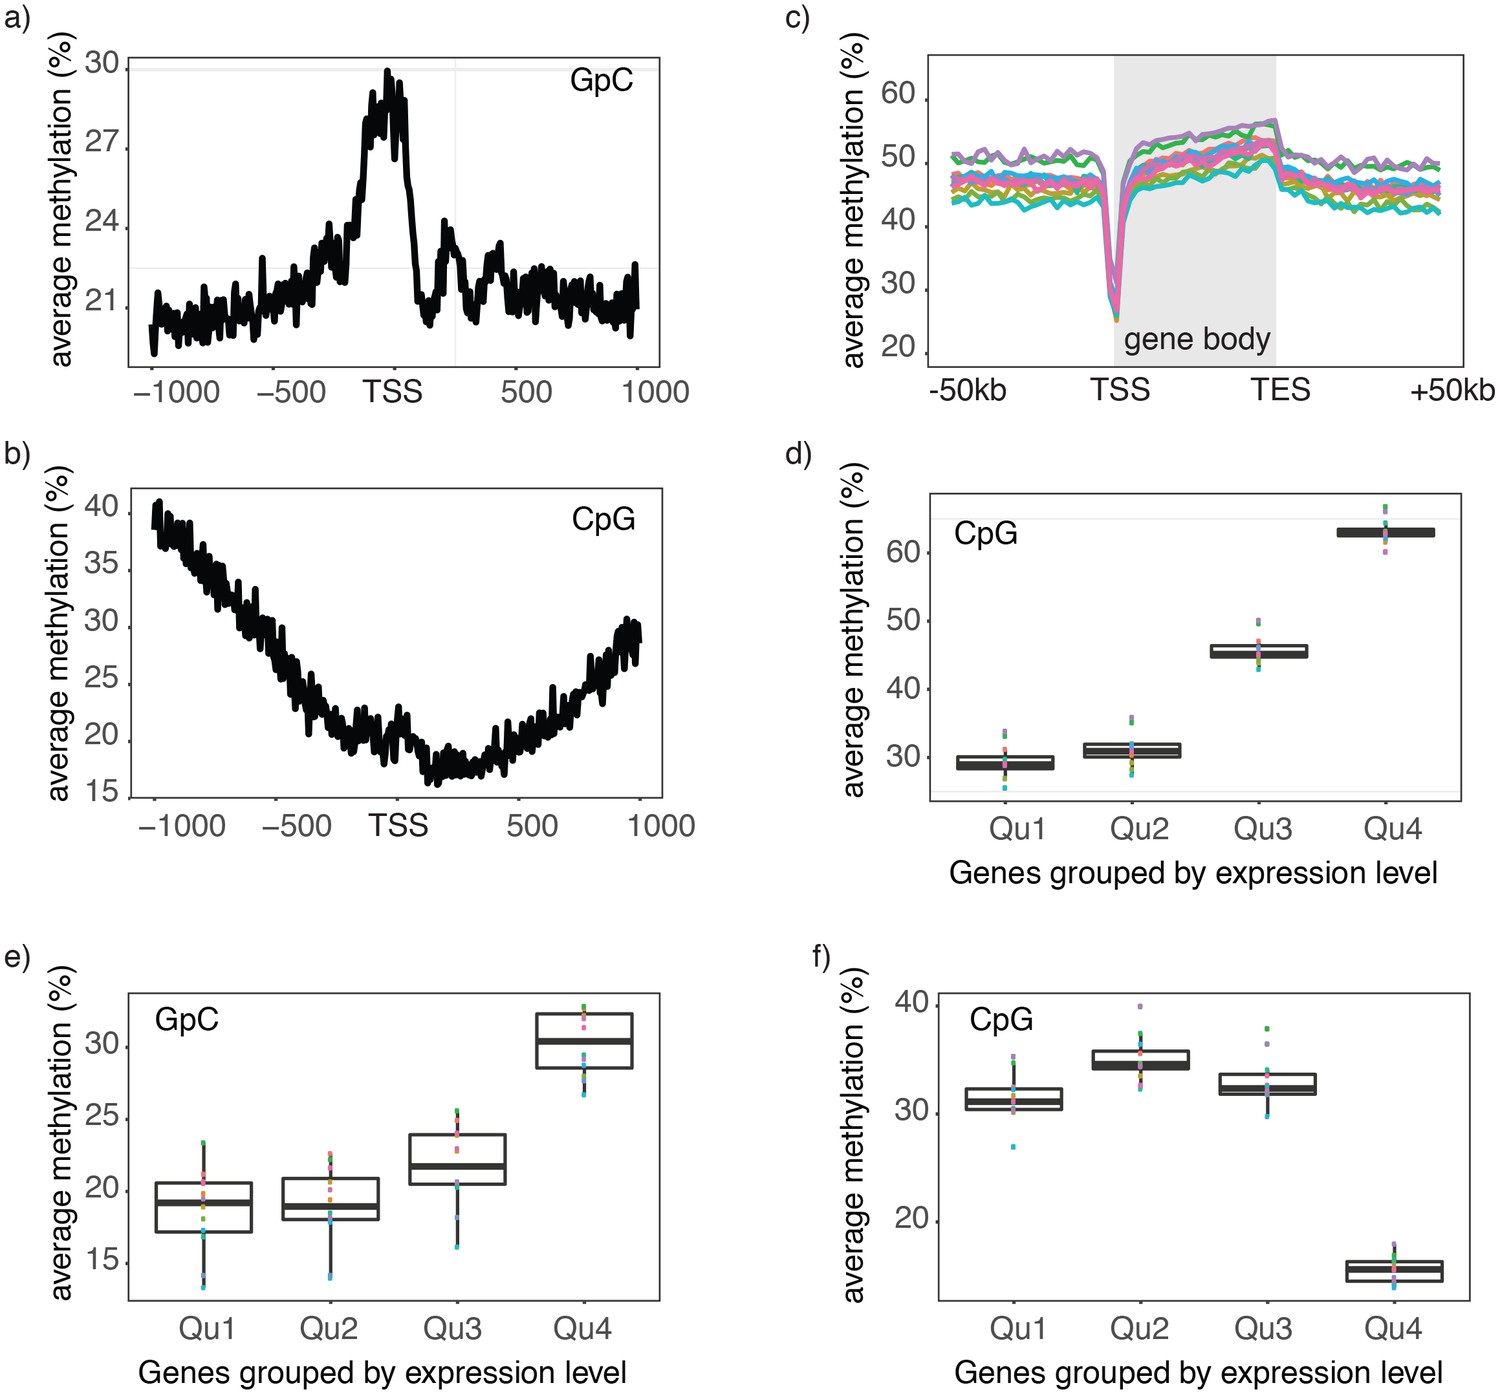
Single cell NOMe-seq reveals chromatin features closely linked to gene expression.
(a) Average GpC methylation level at TSS in GM12878 cells. Regions are centered on the TSS locations. Shown is the average methylation across a 2 kb window of 12 GM12878 cells. (b) Same as in a) but displaying the endogenous CpG methylation level. (C) Average endogenous CpG methylation at gene loci in individual GM12878 cells. Shown is the average methylation across gene bodies (represented as meta genes) and 50 kb regions upstream and downstream of each gene. Each line represents the aggregated CpG methylation data for a single GM12878 cell (TES: transcription end site). (d) Boxplot displays average CpG methylation in gene bodies. Genes were grouped into quartiles based on their transcript levels in bulk. Dots represent the average CpG methylation value for individual cells. (e) Boxplot displays average GpC methylation in promoter regions (−500 bp to +150 bp). Genes were grouped into quartiles based on their transcript levels in bulk. (f) Similar to (e) but displayed are the levels of endogenous CpG methylation.
Figure 3—figure supplement 1
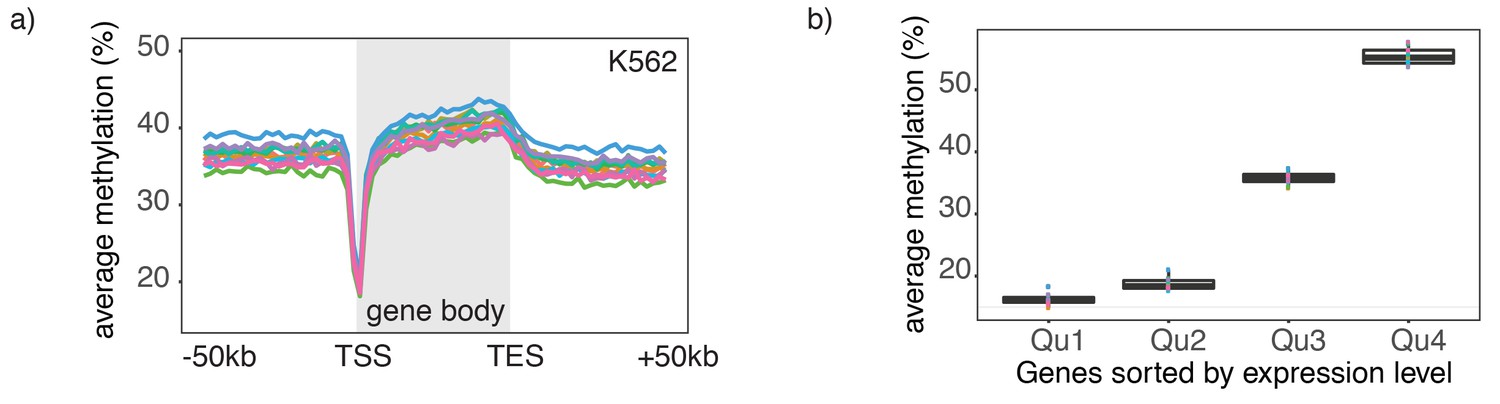
Endogenous methylation in gene bodies of single K562 cells.
(a) Average endogenous CpG methylation at gene loci in individual K562 cells. Shown is the average methylation across gene bodies (represented as meta genes) and 50 kb regions upstream and downstream of each gene. Each line represents the aggregated CpG methylation data for a single K562 cell (TES: transcription end site). (b) Boxplot displays average CpG methylation in gene bodies. Genes were grouped into quartiles based on their transcript levels in bulk. Dots represent the average CpG methylation value for individual cells.
Figure 3—figure supplement 2
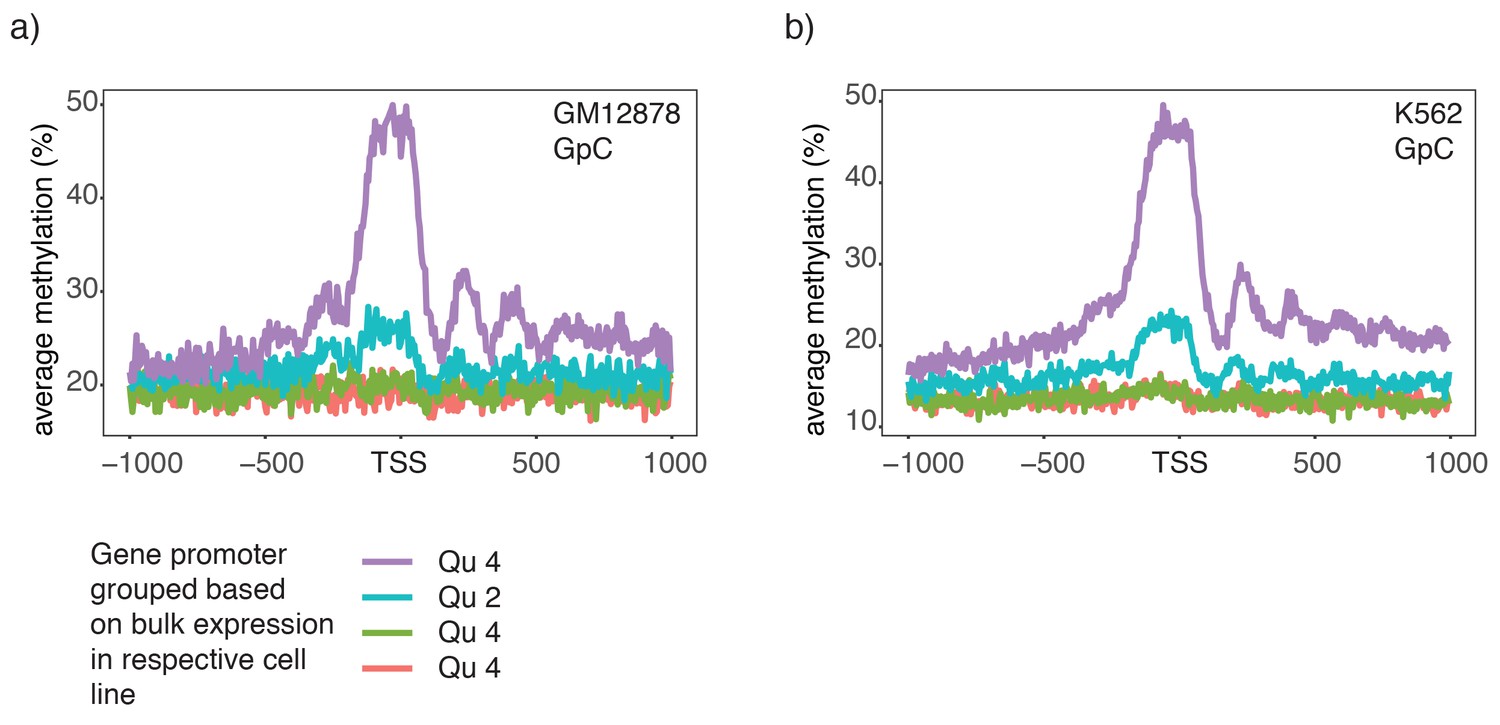
Chromatin accessibility in promoters correlates with transcript levels of adjacent genes.
(a) Average GpC methylation level at TSS genes in GM12878 cells. Regions are centered on the TSS locations and genes were grouped into quartiles based on their transcript levels in bulk GM12878 cells. (b) The same plot as in (a) based on scNOMe-seq data from K562 cells and, correspondingly, transcript levels in K562 cells.
Figure 4 with 1 supplement

single cell GpC and CpG methylation signal is sufficient to group GM12878 and K562 cells according to their origin.
(a) Heatmap shows similarity scores (pair-wise Jaccard distances) for accessibility between all GM12878 and K562 cells measured on the union set of DHSs from GM12878 and K562 cells. Cells were grouped based on unsupervised hierarchical clustering. (b) Average GpC methylation at the DHSs from GM12878 cells and K562 cells, respectively, was calculated for all individual GM12878 and K562 cells. The resulting two values for GpC methylation are displayed for each cell. While the average methylation levels at K562 DHSs for both cell types appear similar, GM12878 and K562 are separable based on these data when accounting for different levels of genome-wide GpC methylation in GM12878 and K562 cells. Importantly, for cells from either cell type the methylation levels are higher in the DHSs of the cell type of origin than in the DHSs of the other cell type. (c) Heatmap shows correlation coefficients between all GM12878 and K562 cells for pair-wise comparison of CpG methylation levels. Genome was divided into 10 kb bins and only bins with sufficient coverage in both cells were used for a given pair (> = 20 covered CpGs). Cells were grouped based on unsupervised hierarchical clustering.
Figure 4—figure supplement 1
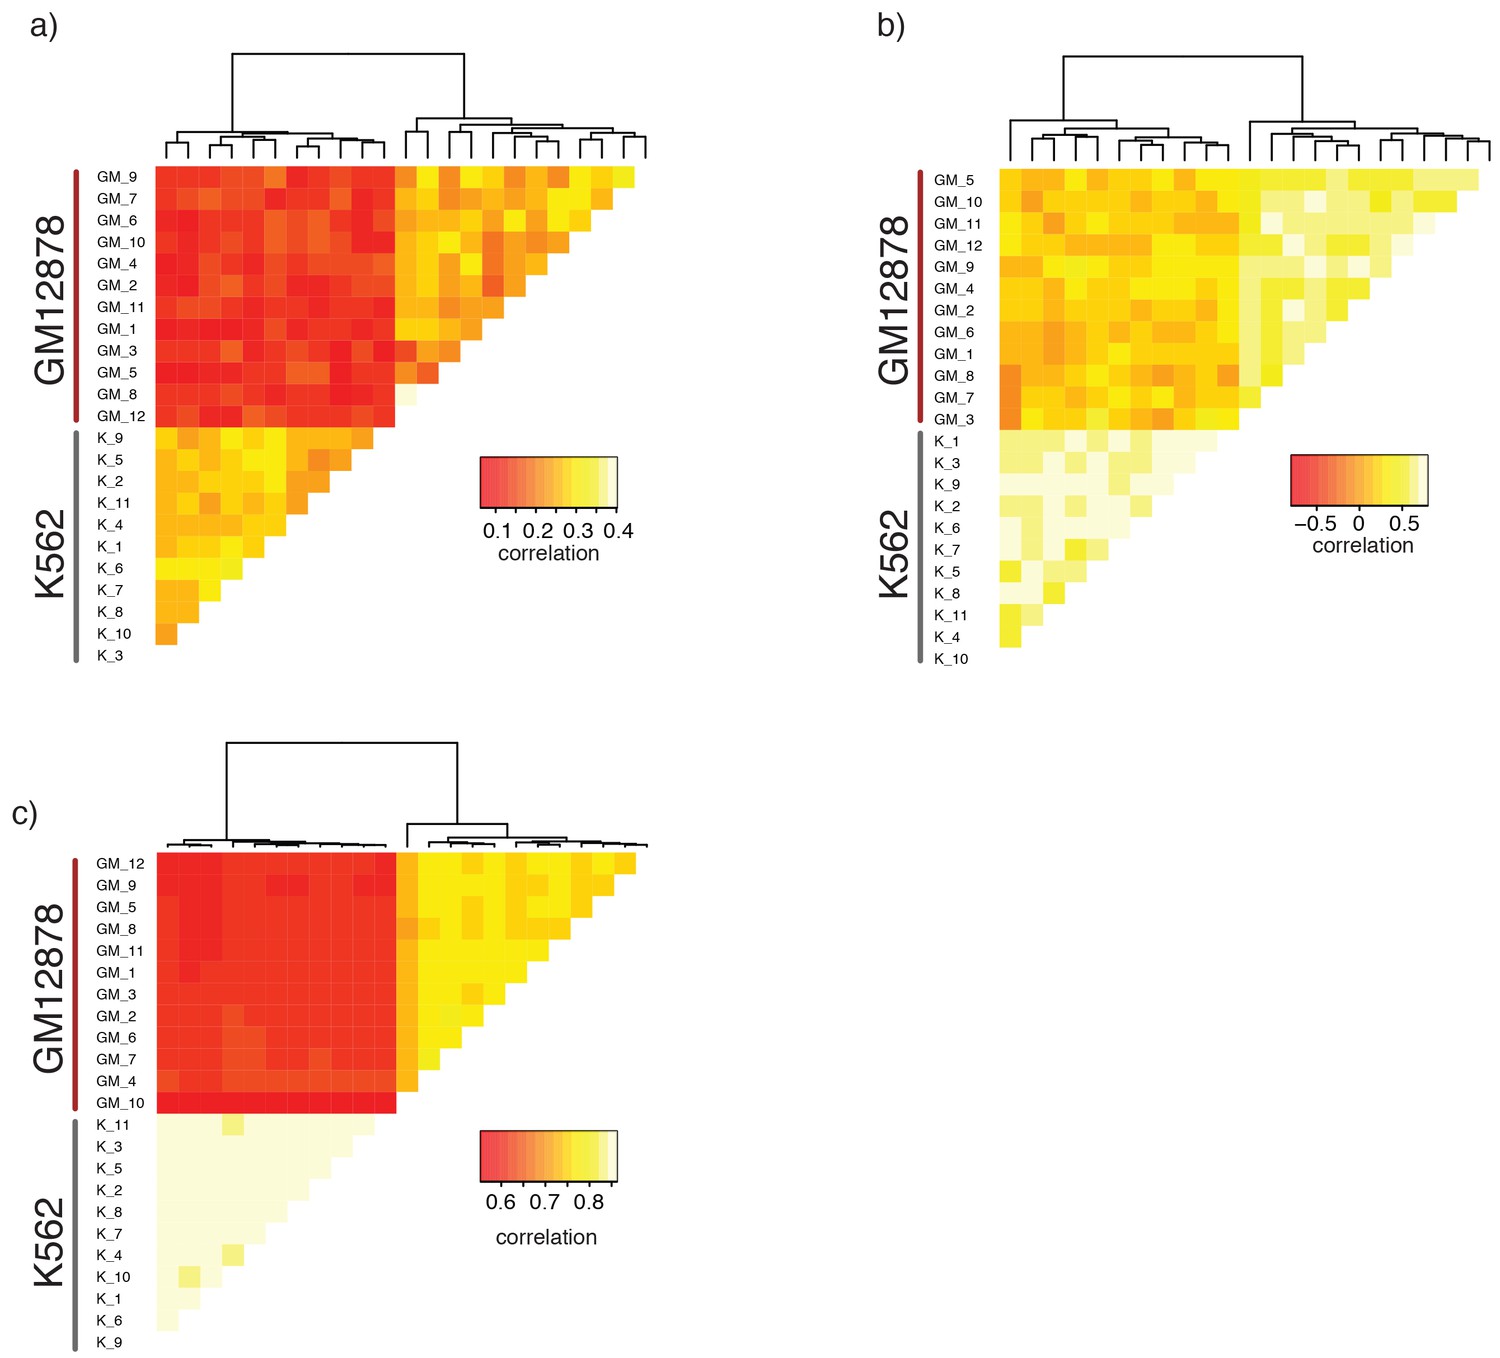
Single GM12878 and K562 cells can be grouped based on GpC methylation and endogenous methylation.
(a) Heatmap shows correlation coefficients for GpC methylation between all GM12878 and K562 cells measured on the union set of DHSs from GM12878 and K562 cells. Cells were grouped based on unsupervised hierarchical clustering. Only DHS with at least four covered GpCs in both cells were used for pair-wise comparison. (b) Same as in (a) but based on CpG methylation level in the union set of DHSs, at least two covered CpGs in both cells were required to include a DHS in the pair-wise comparison. (c) Heatmap shows correlation coefficients between all GM12878 and K562 cells for pair-wise comparison of CpG methylation levels in gene bodies. Only loci with sufficient coverage in both cells were used for a given pair (> = 10 covered CpGs). Cells were grouped based on unsupervised hierarchical clustering. All correlation coefficients were calculated using Pearson correlation.
Figure 5 with 5 supplements

scNOMe-seq detected characteristic accessibility patterns at CTCF transcription factor binding sites and measured CTCF footprints at individual loci.
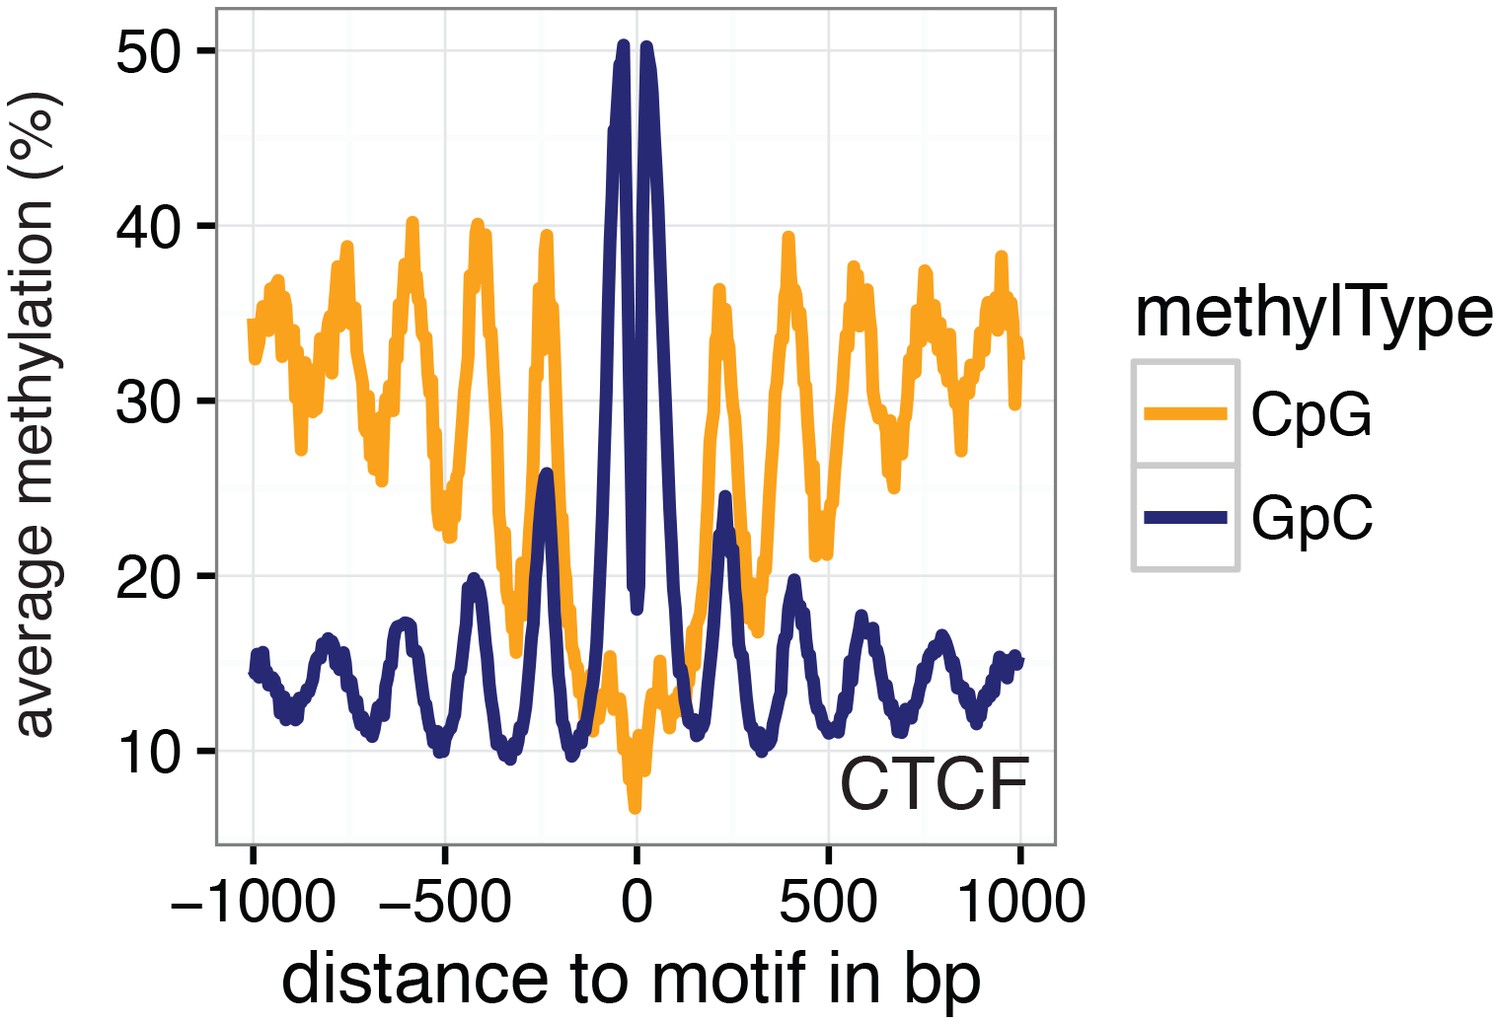
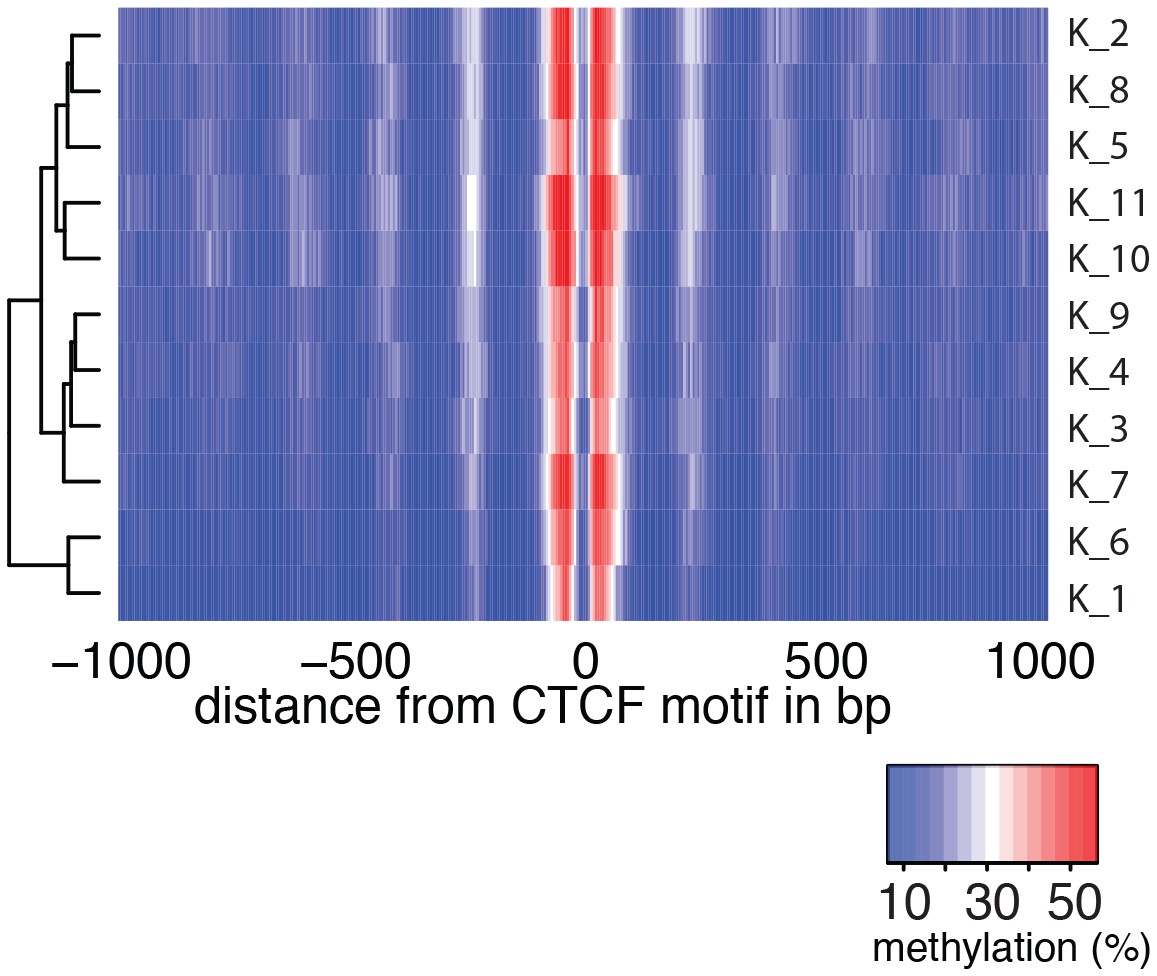
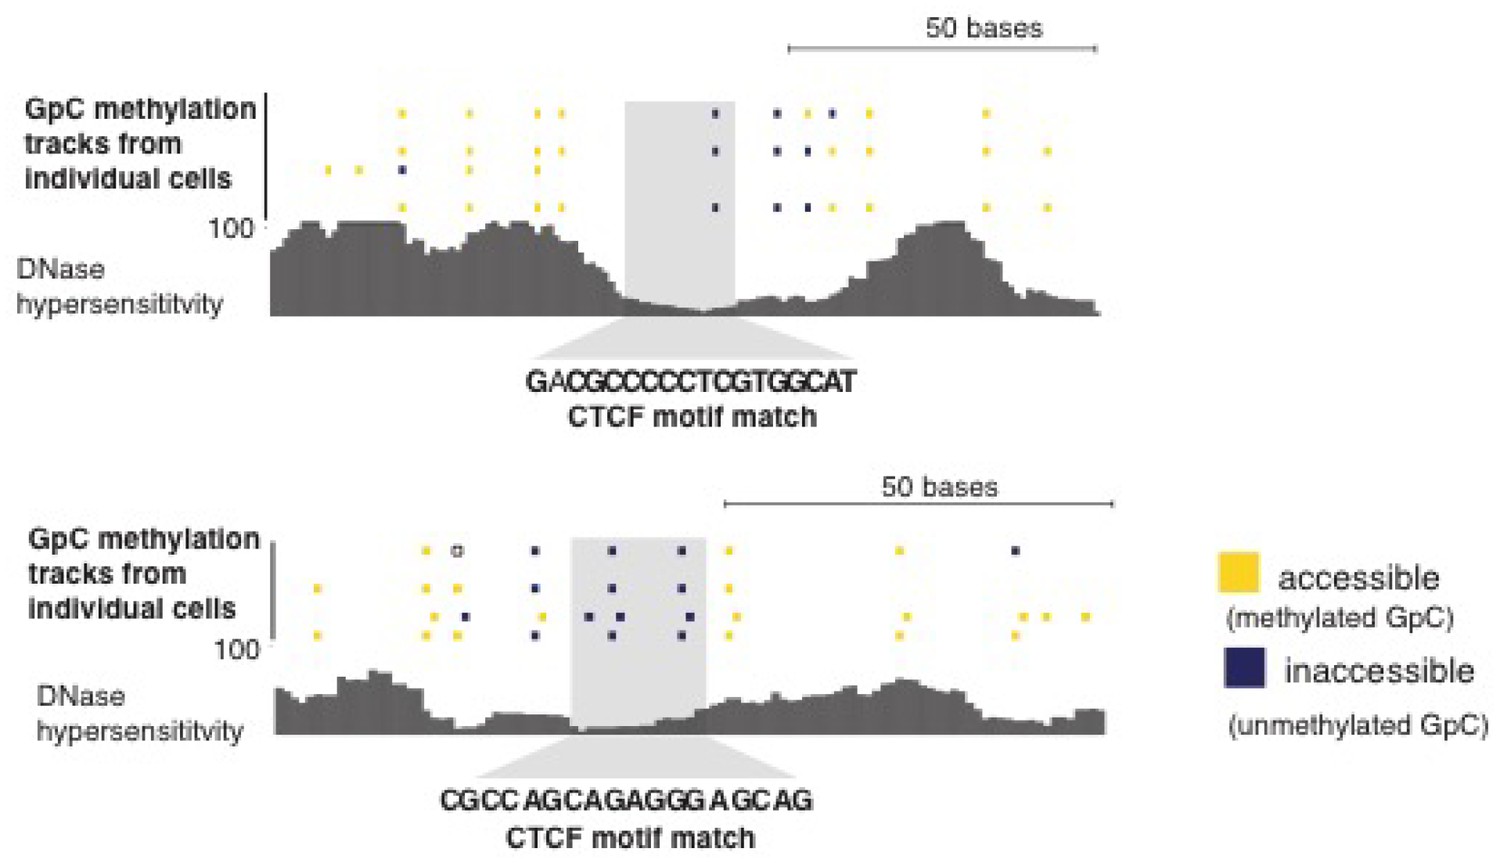
(a) Average GpC methylation level (blue) and CpG methylation level (orange) at CTCF binding sites in GM12878 cells. Regions are centered on motif locations. Shown is the average methylation across a 2 kb window of the pool of 12 GM12878 cells. (b) Heatmap displaying the average GpC methylation across CTCF binding sites. Each row corresponds to an individual GM12878 cell and rows are grouped by similarity. (c) Schematic outline the measurement of CTCF footprints in accessible regions. M denotes CTCF binding motifs within CTCF ChIP-seq regions and U and D indicate 50 bp upstream and downstream flanking regions. footprint score was determined by subtracting the average GpC methylation in the flanking regions from the GpC methylation at the motif. (d) Heatmap displays GpC methylation in accessible regions found in a representative GM12878 cell (GM_1). Each row represents a single CTCF motif instance within a CTCF ChIP-seq region. Average methylation values for the motif and the 50 bp upstream and downstream regions are shown separately. Regions are sorted based on the footprint score. Displayed are only regions that had sufficient GpC coverage and that were considered accessible based on the methylation status of the flanking regions. (e) Heatmap reporting the CTCF motif scores for the motif regions in (d). Regions are sorted in the same order as in (d). (f) Average number of accessible regions at CTCF motifs and the average number of those with a detectable footprint per individual GM12878 cell. Error bars reflect standard deviation. (g) Average CTCF motif scores in regions with and without CTCF footprint for all 12 GM12878 cells. Each line connects the two data points from an individual cell. Regions with footprint are associated with higher motif scores (p= 5.429e-12, paired t-test). (h) Combined display of scNOMe-seq data from this study and DNase hypersensitivity data, nucleosome occupancy, and CTCF ChIP-seq data from ENCODE. Upper panel shows a ~10 kb region containing a CTCF binding site. DNaseI hypersensitivity data and nucleosome density show characteristic distribution around CTCF binding sites in GM12878 cells. Lower panel shows the GpC methylation data of 5 individual cells that had sequencing coverage in this region, 4 of the cells provide GpC data covering the CTCF motif located in the region. scNOMe-seq data tracks show methylation status of individual GpCs. Each row corresponds to data from a single cell. These data indicate that binding of CTCF is detected in all 4 cells. Data are displayed as tracks in the UCSC genome browser (http://genome.ucsc.edu).
Figure 5—figure supplement 1
Average GpC methylation and endogenous CpG methylation at CTCF sites in pooled K562 cells.
Average GpC methylation level (blue) and CpG methylation level (orange) at CTCF binding sites in K562 cells. Regions are centered on motif locations. Shown is the average methylation across a 2 kb window of the pool of 11 K562 cells.
Figure 5—figure supplement 2
Average GpC methylation level at CTCF binding sites in individual K562 cells.
Heatmap shows the average GpC methylation across a 2 kb window centered on the CTCF motif location. Each row corresponds to an individual K562 cell and rows are grouped by hierarchical clustering.
Figure 5—figure supplement 3
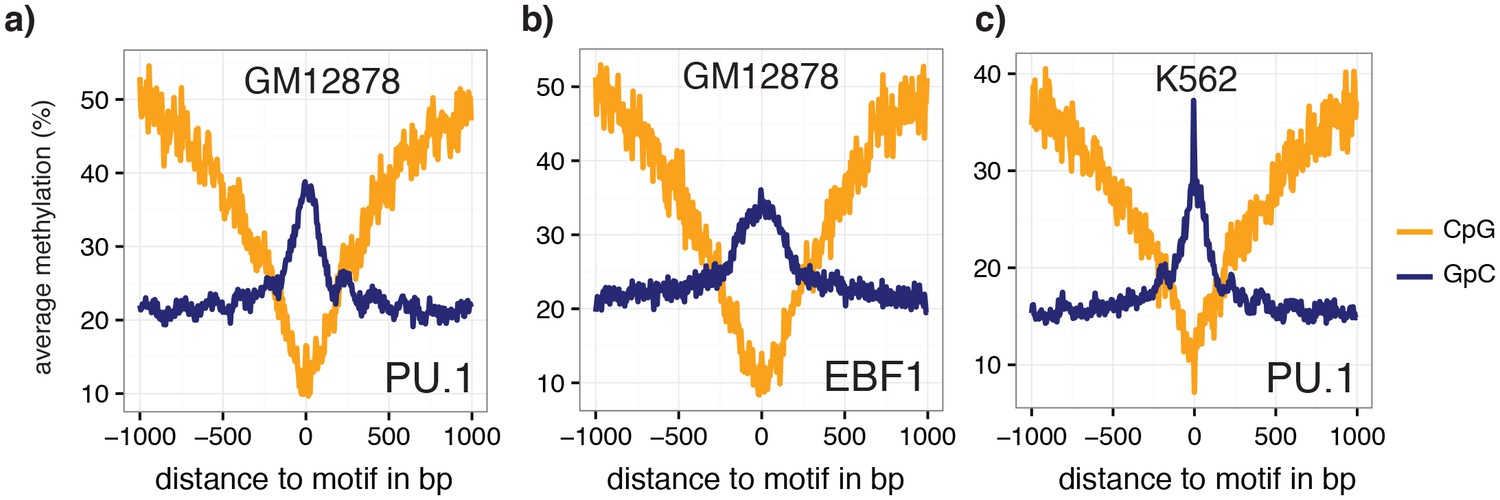
Average GpC methylation and endogenous CpG methylation at additional transcription factor binding sites in pools of GM12878 and K562 cells.
Average GpC methylation level (blue) and CpG methylation level (orange) at (a) PU.1 binding sites in GM12878 cells and b) EBF1 binding sites. Regions are centered on motif locations. Shown is the average methylation across a 2 kb window of the pool of 12 GM12878 cells. (c) Same plot as in (a) but based on PU.1 binding sites in K562 cells. Regions are centered on motif locations. Shown is the average methylation across a 2 kb window of the pool of 11 K562 cells.
Figure 5—figure supplement 4
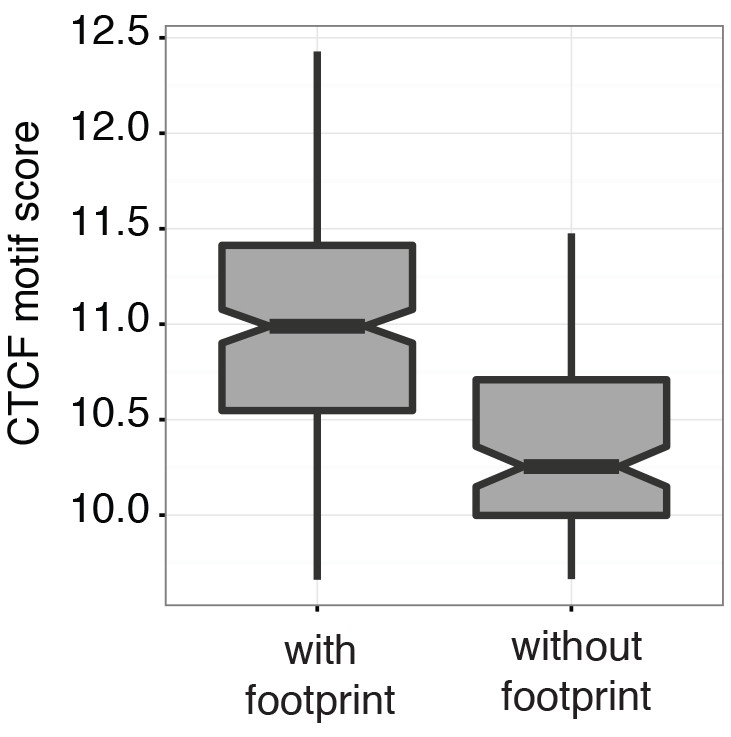
Scores at CTCF motifs with footprints are significantly higher than those without.
Boxplot representing the CTCF motif scores in regions with and without CTCF footprint of an individual GM12878 cell (GM_1, the same cell as shown in Figure 3d and e). Within individual cells regions with footprint are associated with higher motif scores (p < 2.2 e-16, t-test).
Figure 5—figure supplement 5
Loci with CTCF footprint in single cells.
At each locus scNOMe-seq data from this study and DNase hypersensitivity data from ENCODE are shown. scNOMe-seq data tracks show methylation status of individual GpCs. Each row corresponds to data from a single cell, Colors indicate the methylation status of each GpC (yellow: methylated; blue: unmethylated). Data are displayed as tracks in the UCSC genome browser.
Figure 6 with 2 supplements
Nucleosome phasing in single cells.
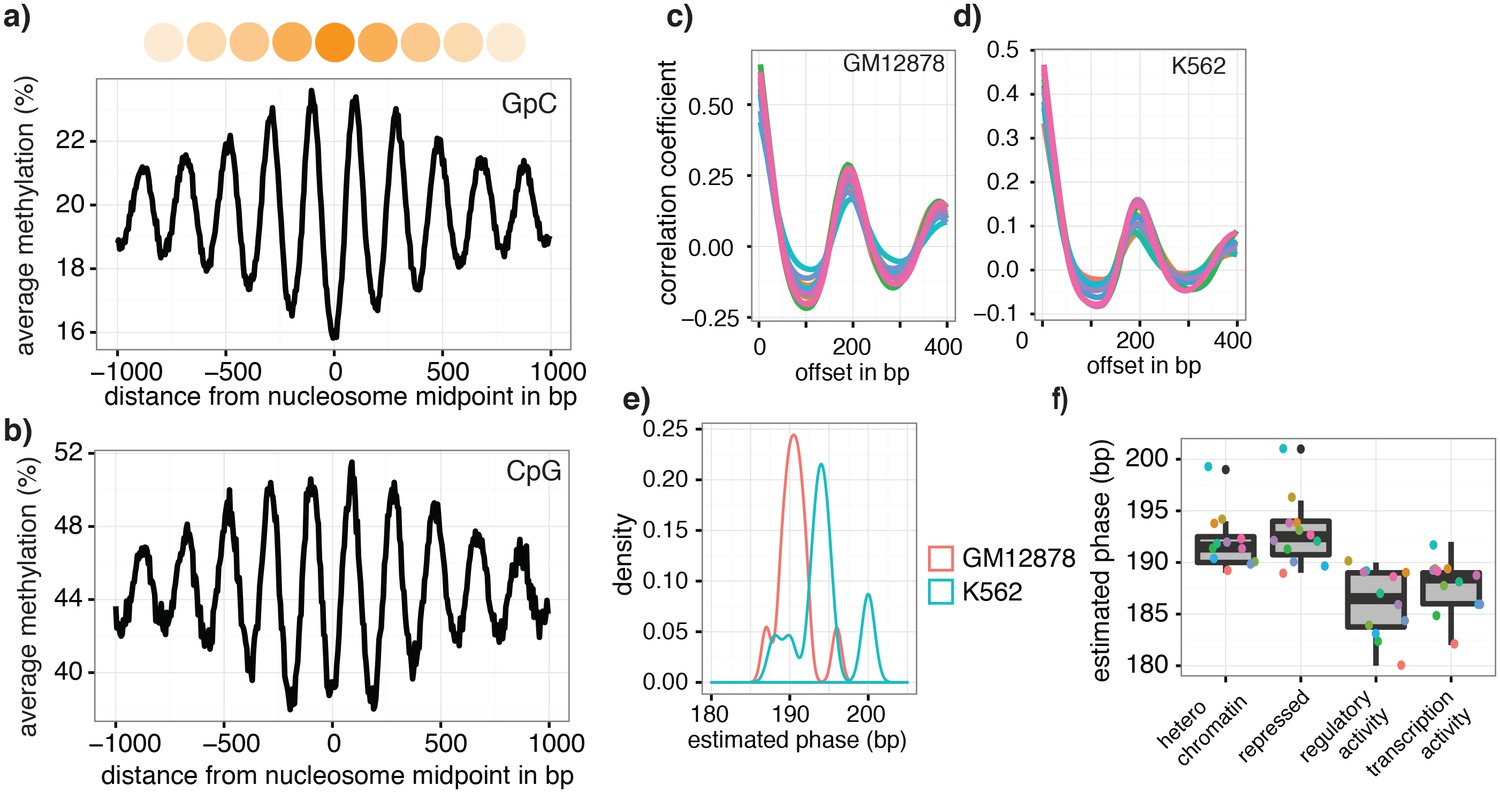
(a) Average GpC methylation level and (b) CpG methylation level at well-positioned nucleosomes in GM12878 cells. Regions are centered on midpoints of top 5% of positioned nucleosomes. Shown is the average methylation across a 2 kb window of the pool of 12 GM12878 cells. (c), (d) Correlation coefficients for the comparison in methylation status between GpCs separated by different offset distances for GM12878 (c) and K562 (d) cells. Each line represents a single cell. Data are smoothened for better visualization. (e) Distribution of estimated phase lengths for GM12878 and K562 cells. (f) Nucleosome phasing in GM12878 in genomic regions associated with different chromatin states defined by chromHMM (ENCODE). Boxplot represents the distribution of estimated phase lengths from all 12 GM12878 cells and overlaid points indicate values of each individual cells.
Figure 6—figure supplement 1
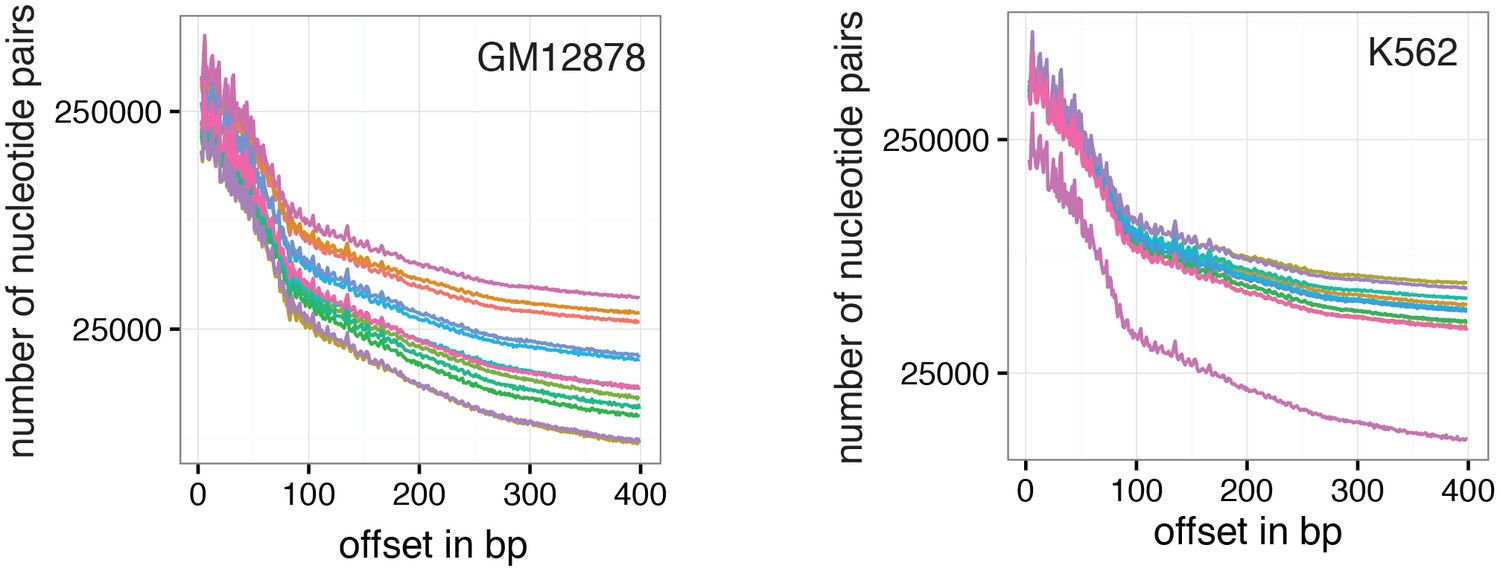
Number of nucleotide pairs used for correlation at each offset distance.
Plotted is the number of nucleotide pairs that are found at each offset distance and used to calculate the correlation coefficient at that distance. The number of comparison declines precipitously. While each read has a maximum of 100 bp all samples were sequenced in paired-end mode and even though the alignment was performed in single end mode additional comparisons can therefore be made in most cases based on GpCs covered in the read from the opposite side of a fragment. In many cases, the data become too sparse beyond 400 bp. Each line represents data from an individual cell. Data from GM12878 and K562 cells are plotted on the left and right, respectively.
Figure 6—figure supplement 2
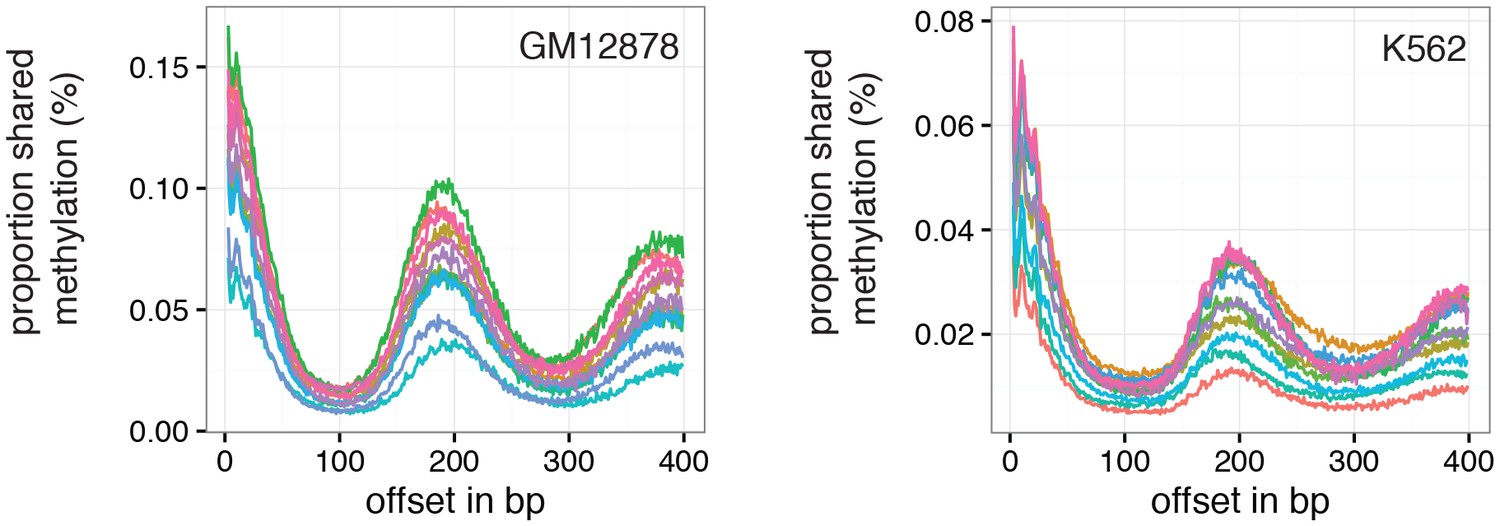
Offset distances with a high proportion of GpC pairs that share methylation status indicate average phasing distance.
Shown is the proportion of nucleotide pairs at each offset distance in which both cytosines are methylated. These measurements yield curves very similar to the distribution of Pearson correlation coefficients (Figure 6c and d).
Additional files
-
Supplementary file 1
Table 1: scNOMe-seq libraries used in this paper and their technical details and alignment summary statistics. Table 2: Primer sequences of primers used for amplification and barcoding of sequencing library. Table 3: Additional datasets used in this study and their sources.
- https://doi.org/10.7554/eLife.23203.037
-
Source code 1
Script to calculate autocorrelation between GpCs at offset distances from 3–400bp.
- https://doi.org/10.7554/eLife.23203.038
Download links
A two-part list of links to download the article, or parts of the article, in various formats.
Downloads (link to download the article as PDF)
Open citations (links to open the citations from this article in various online reference manager services)
Cite this article (links to download the citations from this article in formats compatible with various reference manager tools)
Simultaneous measurement of chromatin accessibility, DNA methylation, and nucleosome phasing in single cells
eLife 6:e23203.
https://doi.org/10.7554/eLife.23203


