Plasmodium falciparum parasites deploy RhopH2 into the host erythrocyte to obtain nutrients, grow and replicate
- Deakin University, Australia
- Burnet Institute, Australia
- Monash University, Australia
- University of Melbourne, Australia
Figures
Figure 1 with 1 supplement
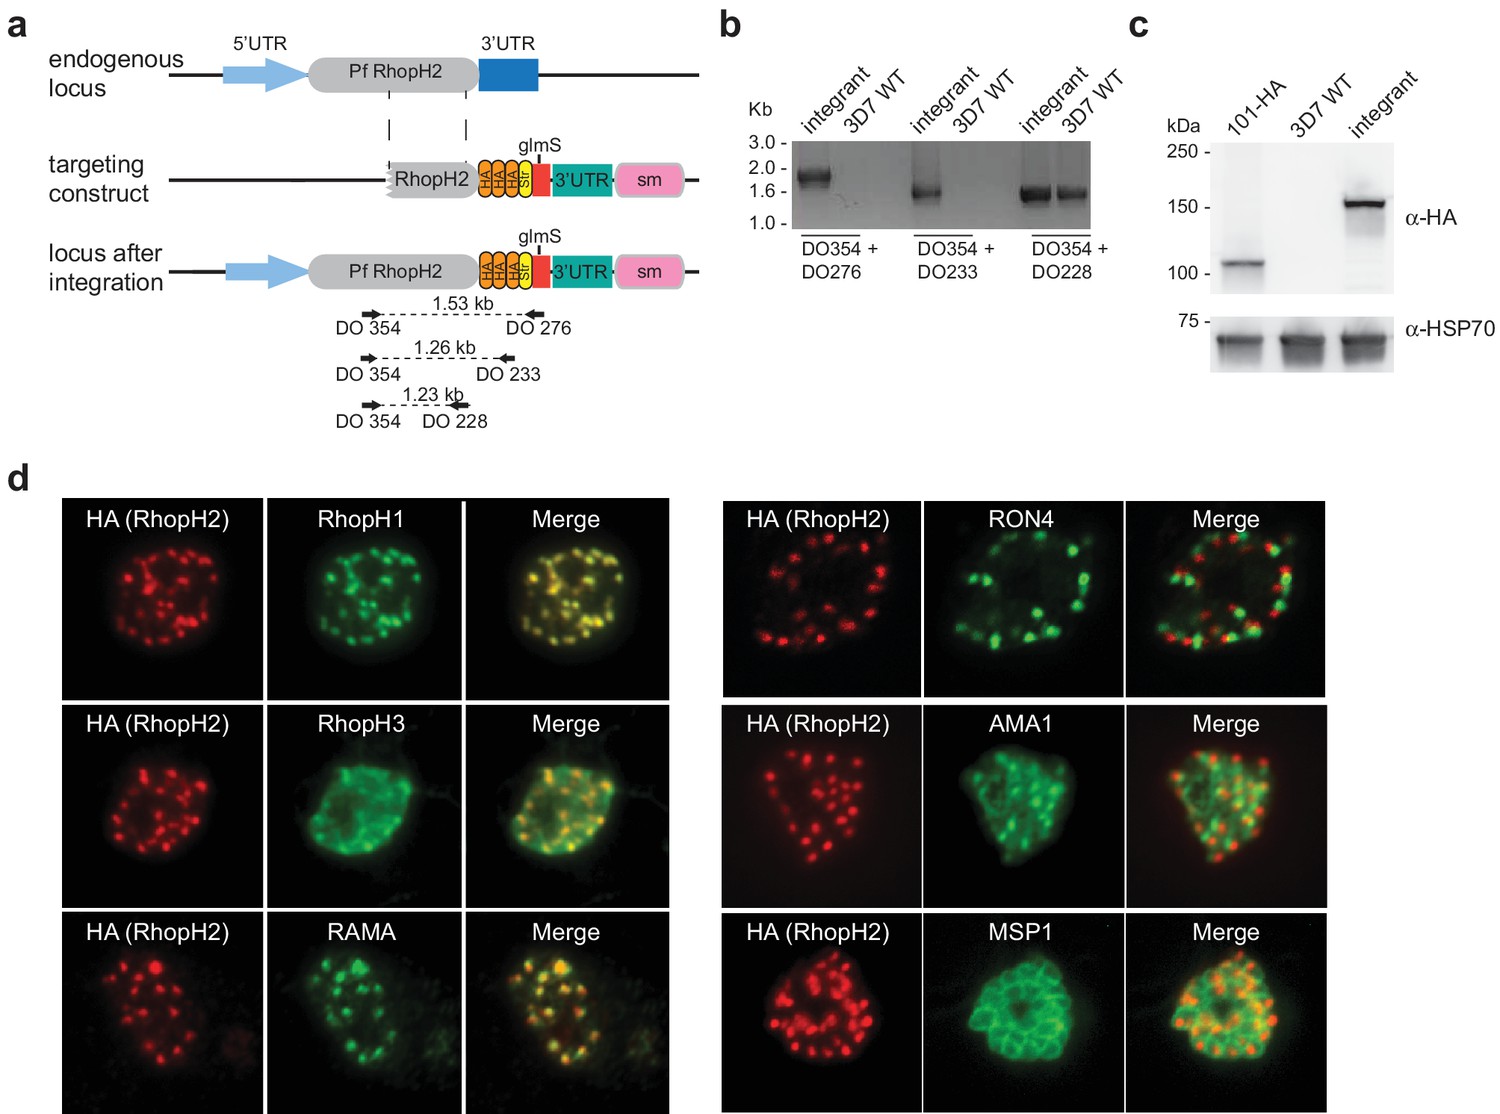
Generation of transgenic parasites in which RhopH2 is epitope-tagged.
(a) The P. falciparum RhopH2 targeting construct was designed to integrate into the endogenous locus by a single crossover recombination event. The predicted structure of the endogenous locus before and after integration is shown. Haemagglutinin (HA) and strep II (Str) epitope tags, selectable marker (sm), glmS ribozyme and untranslated regions (UTR) are shown. Arrows indicate oligonucleotides used in diagnostic PCR analysis and indicative product size. (b) Diagnostic PCR showing the PfRhoph2 gene contains the integrated sequence. Oligonucleotide pairs shown in (a) were used on genomic DNA prepared from drug-resistant parasites after transfection with the targeting construct (integrant) or 3D7 (WT). DO354 and DO228 oligonucleotides, which recognize the rhoph2 locus, serve as a positive control for the PCR. (c) Western blot analysis showing the integrant line expresses the HA epitope tags. The predicted molecular mass of epitope-tagged RhopH2 is 164 kDa. PfHSP101-HA (101-HA) serves as a positive control. (d) Immunofluorescence analysis (IFA) on schizonts fixed with acetone/methanol and labelled with anti-HA antibody to detect RhopH2 and other antibodies, as indicated.
Figure 1—figure supplement 1
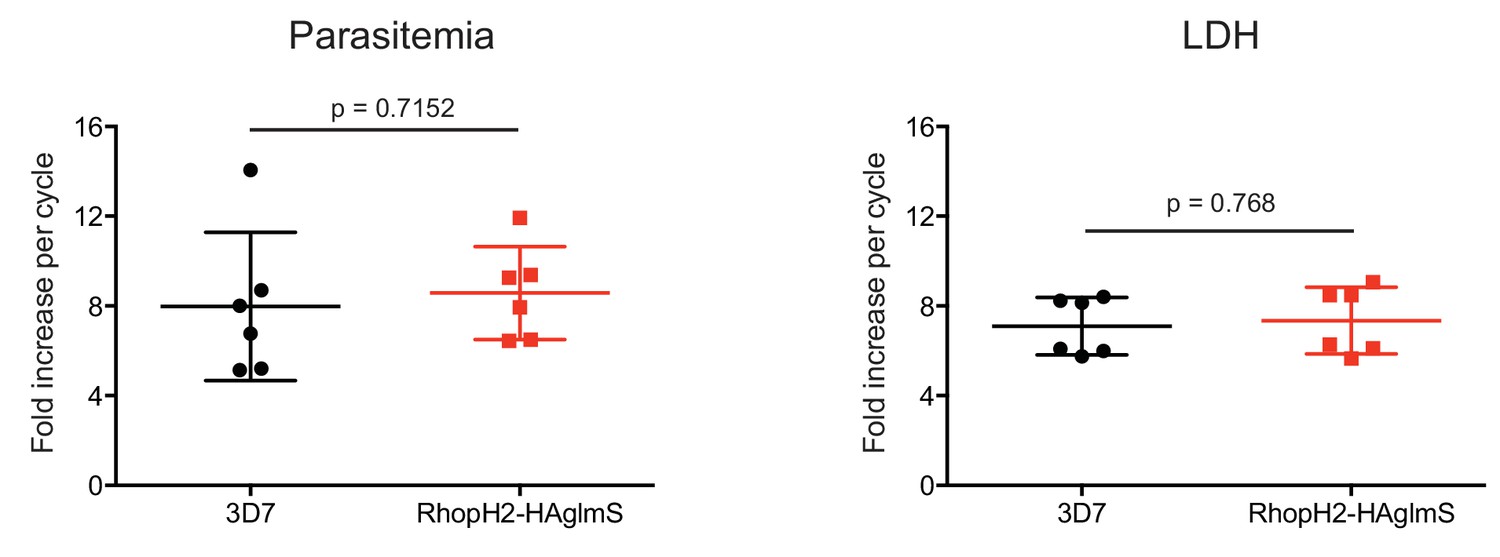
Comparison of growth between P. falciparum wildtype (3D7) and RhopH2-HAglmS parasite lines.
Parasite lines were grown in the absence of GlcN for three cycles and growth was measured by calculating the percentage parasitemia (left panel) or by lactate dehydrogenase assay (LDH) (right panel). Shown is the mean ± SD fold-increase in parasitemia or LDH activity (n = 6 independent biological replicates). An unpaired t-test was used to calculate statistical significance.
Figure 2
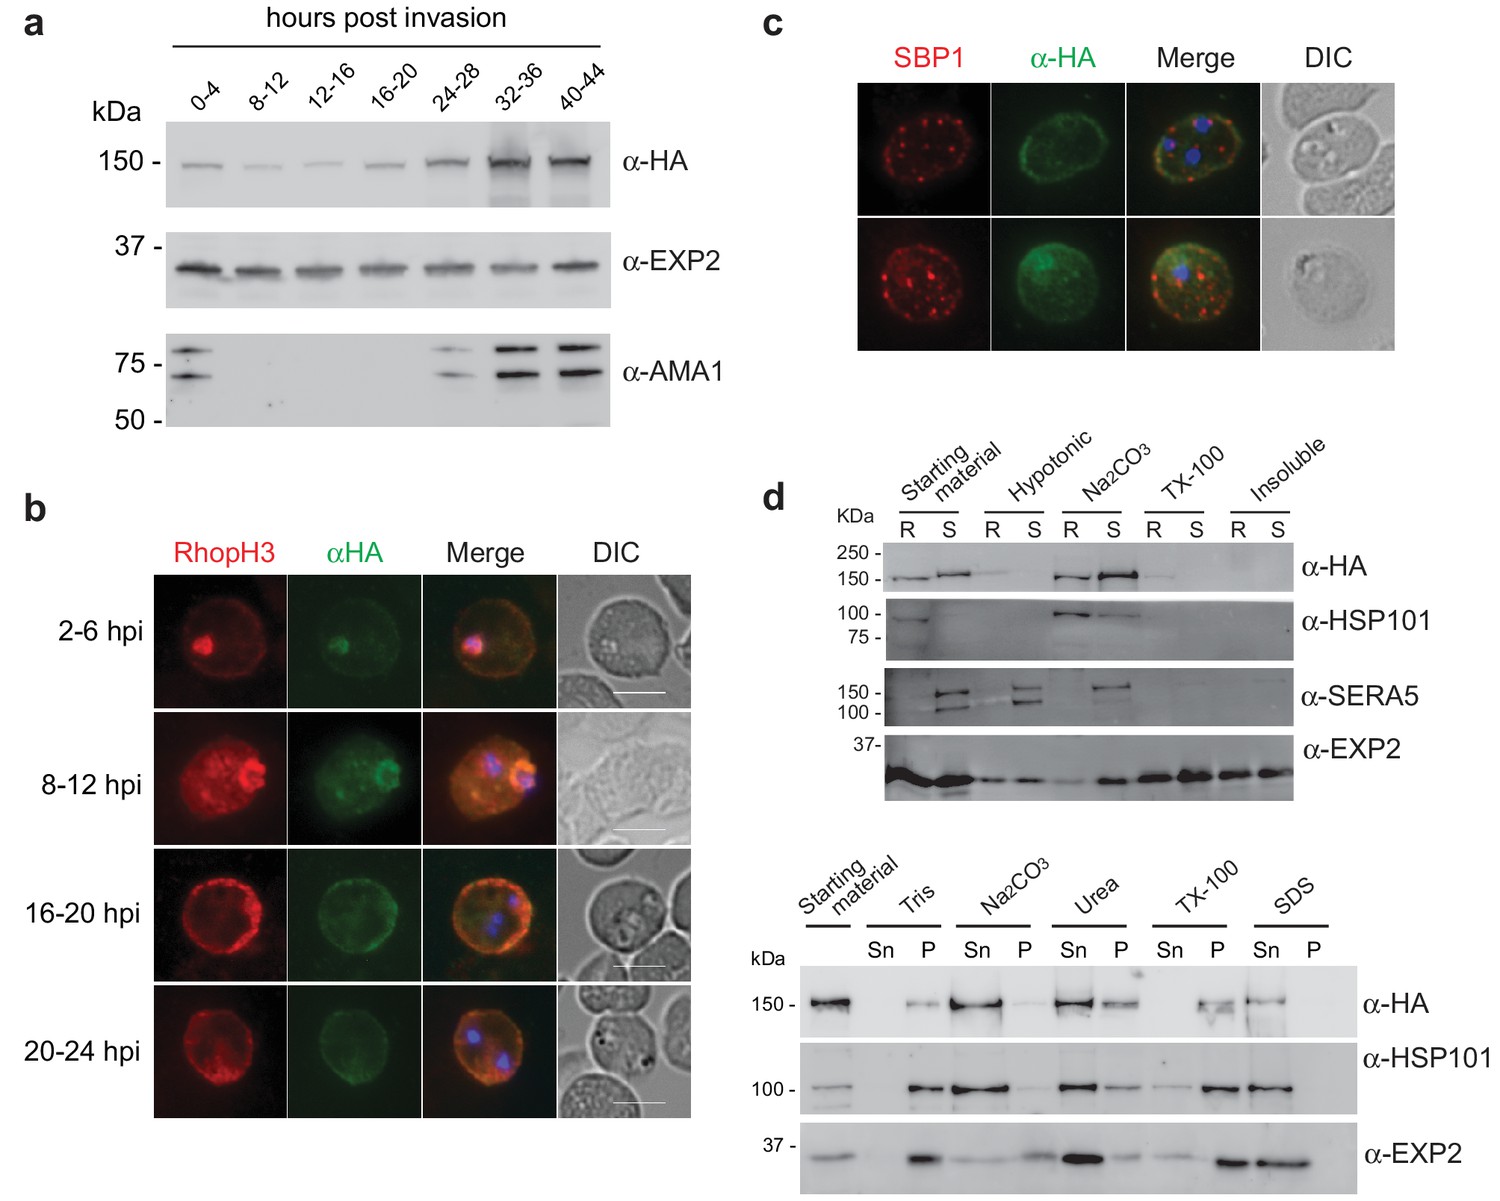
Expression, localisation and solubility profile of P. falciparum RhopH2.
(a) Western blot analysis of RhopH2-HA expression across the erythrocytic cycle. Immunoblots were probed with the antibodies as indicated. (b) Immunofluorescence analysis (IFA) on erythrocytes infected with PfRhopH2-HAglmS and fixed with acetone/methanol. RhopH2 is labeled with the anti-HA antibody. The bars represent 5 µm. (c) IFA on erythrocytes infected with PfRhopH2-HAglmS, fixed with acetone/methanol and probed with anti-HA (for RhopH2) and antibodies to the Maurer’s cleft protein SBP1 show that RhopH2 and SBP1 do not co-localise. (d) Solubility of RhopH2-HAglmS. Upper panel: Infected erythrocytes were synchronized and saponin-lysed when parasites reached ring (R) or schizont (S) stage and the pelleted material was sequentially dissolved in the buffers as indicated in the order of left to right (upper panel). Supernatant fractions were analysed by western blotting with the indicated antibodies. Insoluble material represents protein remaining in the pellet fraction after 1% Triton X-100 treatment. Lower panel: Alternatively, infected erythrocytes were saponin-lysed when parasites were at ring stages, split into equal portions and pelleted before dissolving in one of the indicated buffers. Both supernatant (Sn) and pellet (P) fractions were analysed by western blotting.
Figure 3

The RhopH2 interactome.
(a) Coomassie-stained SDS-PAGE gel of elution fractions from immune-precipitations performed with HA antibodies on lysates made from erythrocytes infected with RhopH2-HAglmS parasites at ring (R) or trophozoite stage (T). (b) Bar graph showing the total number of peptides of particular subclasses of proteins that were affinity purified with PfRhopH2-HA. (c) Pie charts showing the number of peptides from the respective RhopH proteins that affinity purified with RhopH2-HA. The numbers of peptides identified are indicated in brackets. Note RhopH1 includes all CLAG peptides. (d) Western blot of blue-native PAGE performed on erythrocytes infected with trophozoite stage RhopH2-HAglmS parasites that had been solubilized in either 0.25% Triton X-100 or 1% ASB detergent reveal RhopH2 is present in ~670 and ~410 kDa species. (e) Pie chart showing the numbers of the most abundant peptides from PEXEL proteins that affinity purified with PfRhopH2-HA from trophozoite stage parasites. (f) Pie chart showing the numbers of the most abundant peptides from host erythrocyte proteins that affinity purified with PfRhopH2-HA in ring stage parasites.
Figure 4
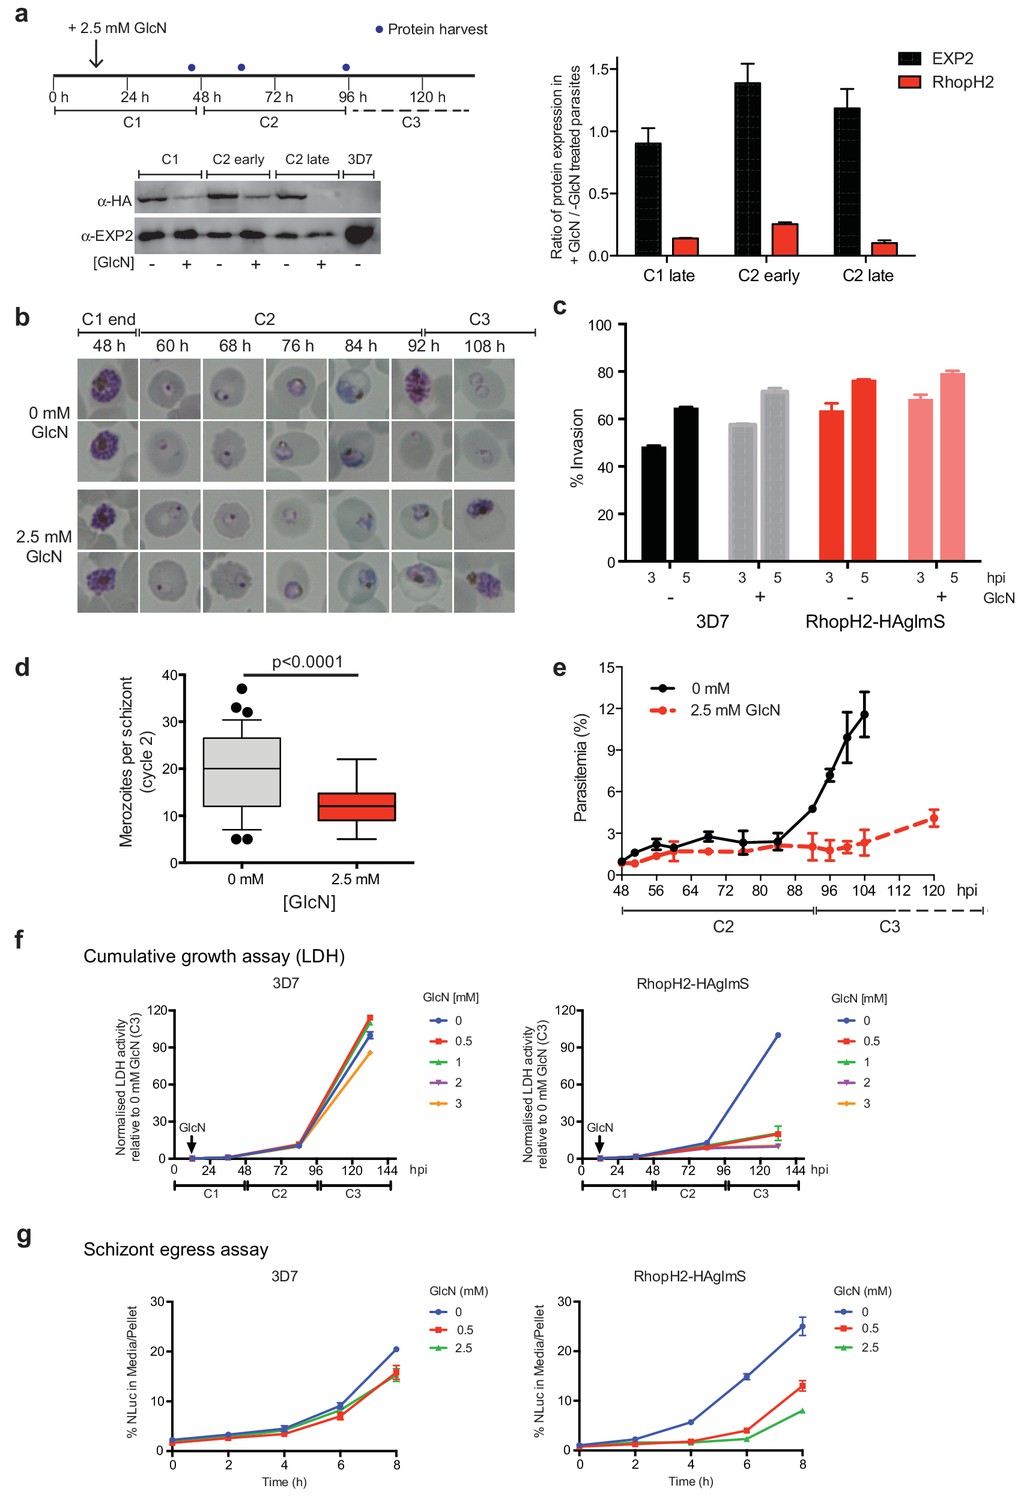
Reduction in PfRhopH2 expression leads to altered growth phenotypes in vitro.
(a) Effect of glucosamine on PfRhopH2 protein expression. Upper panel: overview of experiment. Synchronised cultures of PfRhopH2-glmS were treated with glucosamine (GlcN) at the indicated time and material harvested, as indicated. Lower panels: infected erythrocytes were harvested by saponin lysis and subject to SDS-PAGE and western blotting. PfRhopH2-HA was detected using an anti-HA antibody and EXP2 (used as a loading control) detected with a specific polyclonal EXP2 antibody. Right panel: Densitometry performed on bands observed in western blot using ImageJ was performed to calculate the ratio of EXP2 or RhopH2 protein levels in parasite lines grown in the presence (+) or absence (-) of GlcN (n = 3 independent experiments). Shown is the mean ± SEM (n = 3). (b) Representative Giemsa-stained smears parasites depleted of RhopH2 progress to schizont stage in cycle one but parasite growth is slowed around the trophozoite stage (n = 3 independent experiments). (c) Analysis of the number of schizonts in cultures of wildtype (3D7) and RhopH2-HAglmS parasites grown in the absence (−) or presence (+) of 2.5 mM GlcN that invaded donor erythrocytes within 3 or 5 hr post-incubation (hpi), as measured by FACS (n = 3). Shown is the mean ± SEM. (d) Box plot indicating the number of merozoites formed per schizont in cultures of RhopH2-HAglmS grown in 0 mM (35 schizonts examined) or 2.5 mM (51 schizonts examined) GlcN. The central bar in the box plot denotes the median whilst the whiskers delineate the 10th and 90th percentiles. p<0.0001 by unpaired t-test. (e) Parasitemias of cultured PfRhopH2-HAglmS parasites grown in 0 mM or 2.5 mM GlcN, determined by counting a minimum of 1000 erythrocytes. Depletion of PfRhopH2 expression increases the length of the cell cycle and has a marked effect on the numbers of parasites progressing to cycle 3. Shown is the mean ± SEM (n = 3). (f) Growth of 3D7 and PfRhopH2-HAglmS parasites when cultured in various concentrations of GlcN, as measured by lactate dehydrogenase assay (LDH). The LDH activities of 3D7 and RhopH2-HAglmS cultured in the absence of GlcN at cycle three were normalized to 100%, and activity of all lines (± GlcN) across the three cycles was measured relative to this. Shown is the mean ± SD (n = 3). An unpaired t-test revealed RhopH2-HAglmS parasites grew significantly slower than 3D7 in all concentrations of GlcN by 36 hpi (p<0.01) (g) Measurement of nanoluciferase (Nluc) released into the culture media and in pelleted erythrocytes infected with 3D7 or RhopH2-HAglmS parasites expressing Hyp1-Nluc. Measurements commenced around the time 3D7 parasites were starting to egress and invade new erythrocytes. The data represents the mean ± SD of one biological replicate completed in triplicate, with results expressed as percentage Nluc activity in the media relative to the pellet fraction.
Figure 5
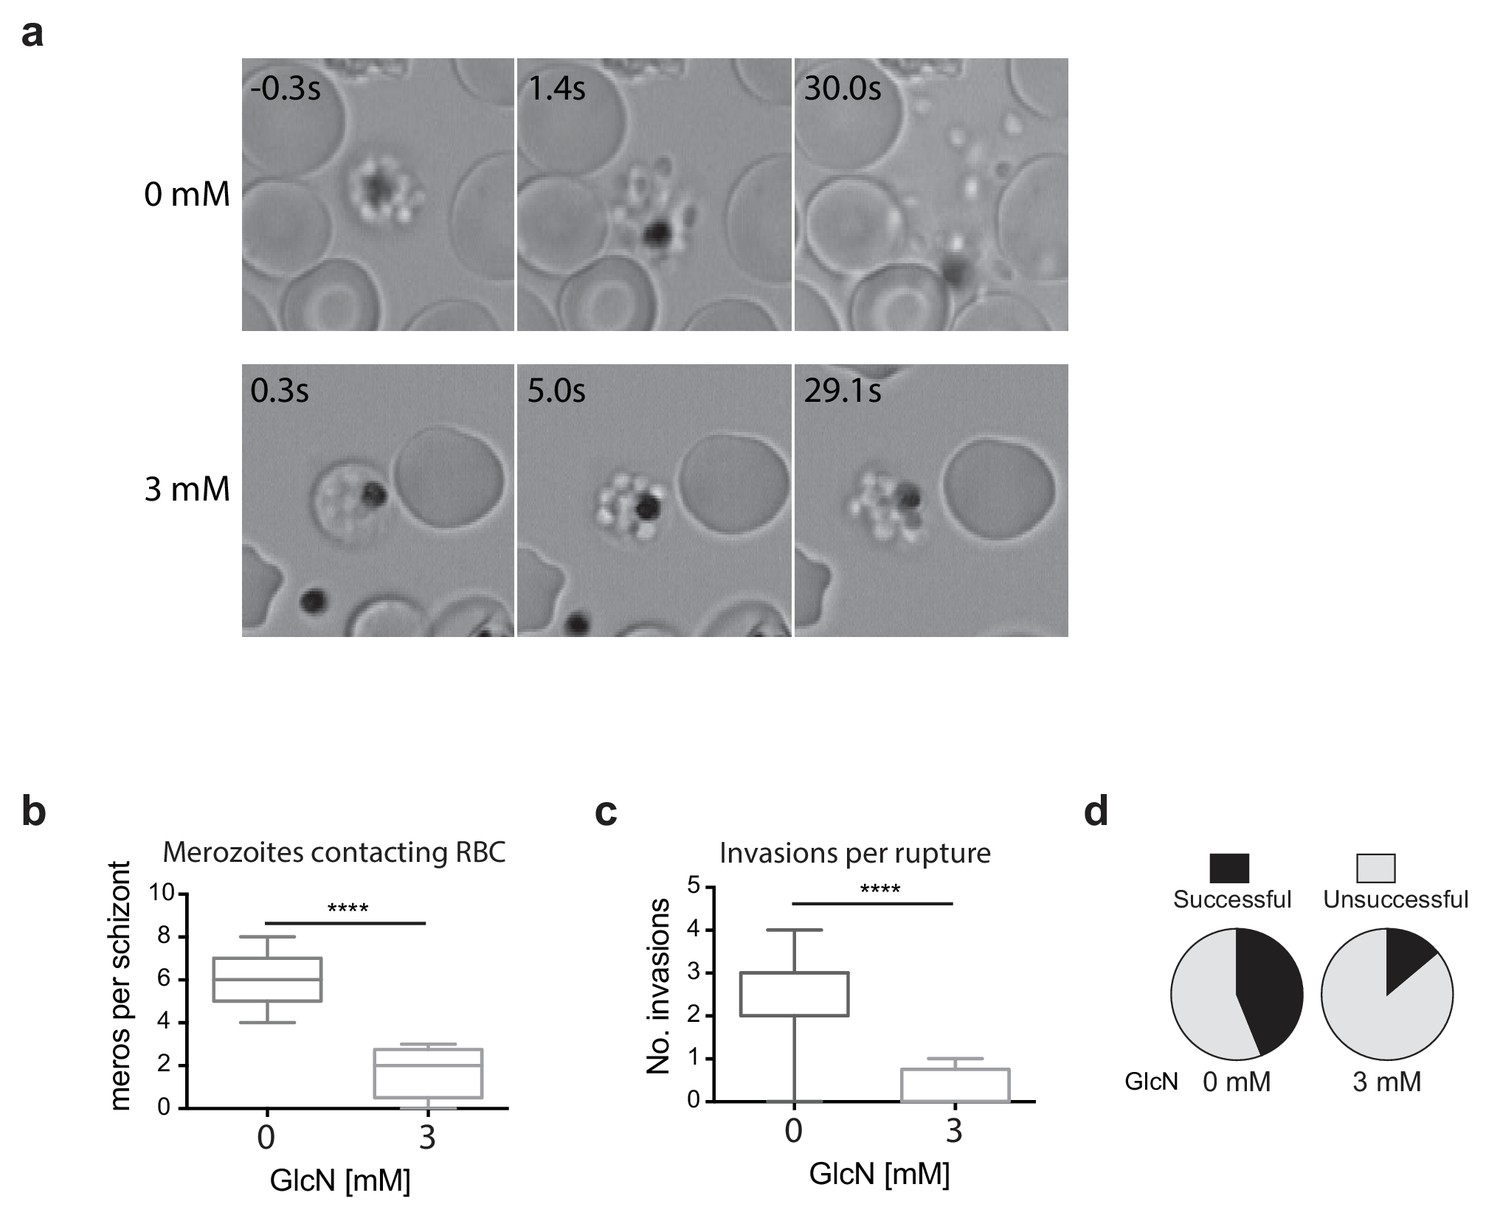
Merozoites depleted of PfRhopH2 show defect in parasite invasion the following cycle.
(a) Panel of images from videos of PfRhopH2-HAglmS schizonts observed rupturing and releasing merozoites at the end of cycle 2, post-addition of 0 or 3 mM GlcN. The number of seconds post-rupture is indicated. (b) The number of merozoites contacting nearby erythrocytes per schizont rupture following GlcN treatment is shown. (c) The number of erythrocyte invasions per schizont rupture is shown. (d) The proportion of merozoite-erythrocyte contacts that successfully result in invasion are indicated. For (b) and (c), the central bar denotes median, the box denotes 25–75th percentile and the whiskers the data range. ****p<0.0001 by unpaired t-test.
Figure 6 with 1 supplement
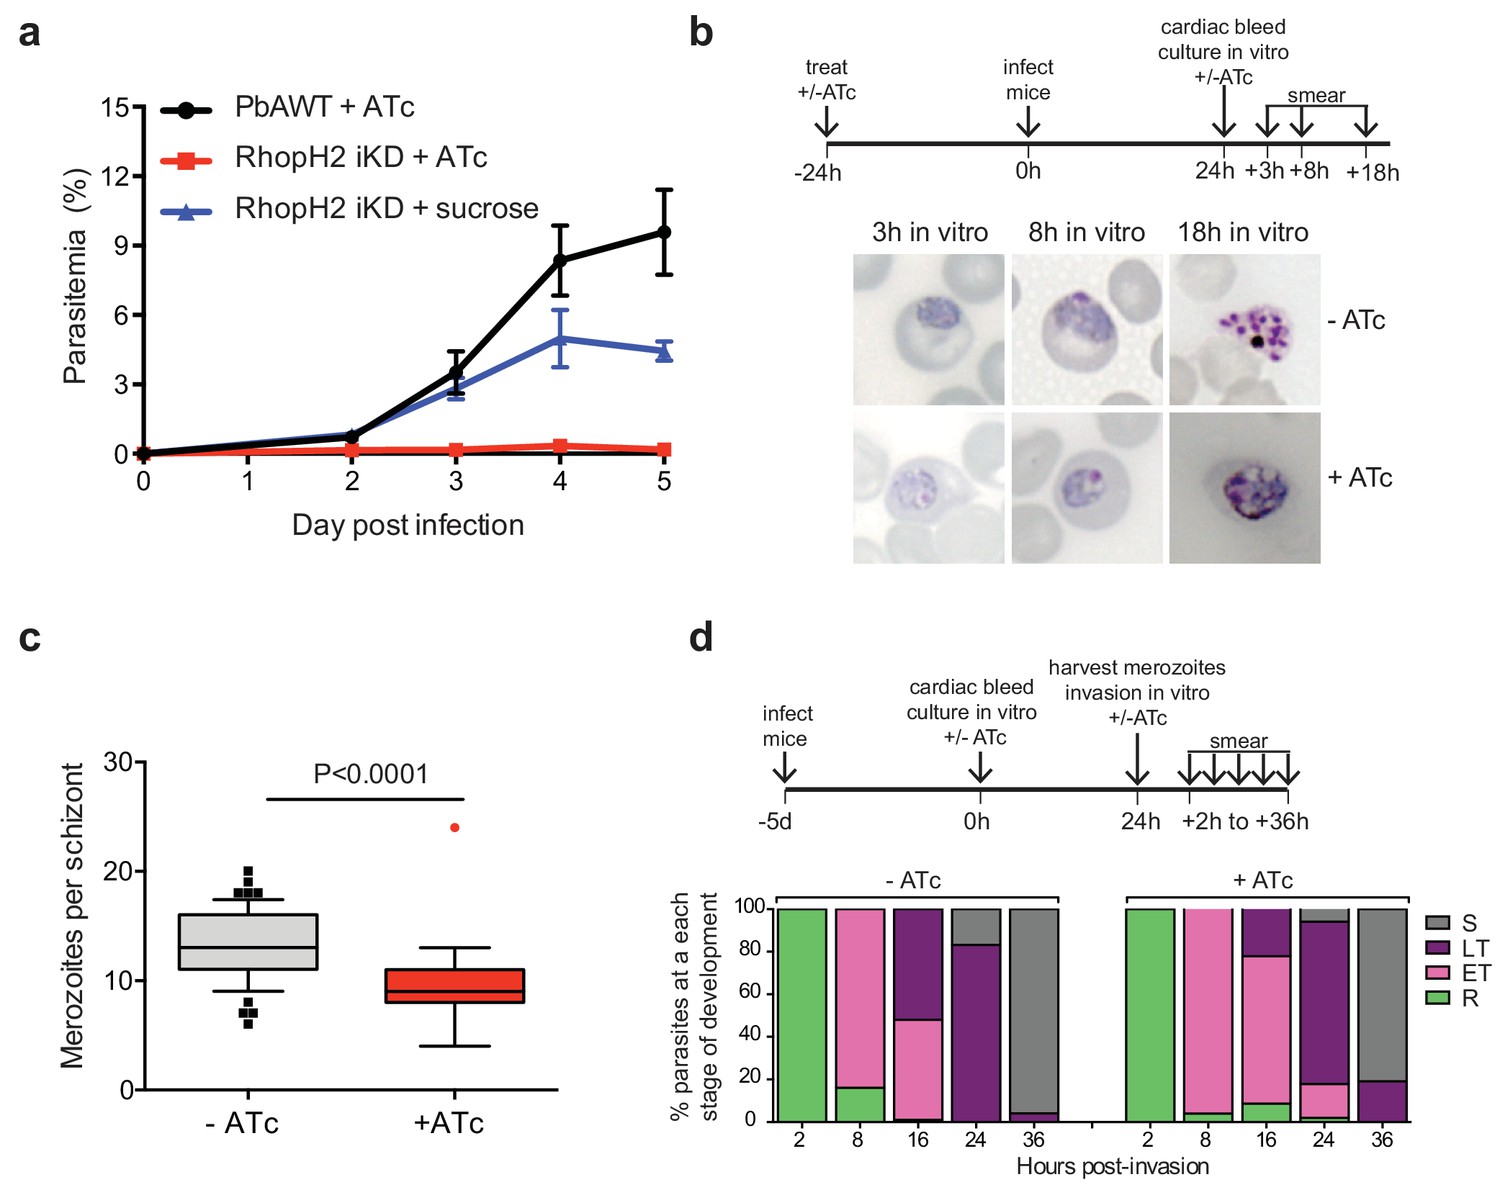
Depletion of RhopH2 in P. berghei leads to altered growth phenotypes in vivo and in vitro.
(a) Representative growth curve (n = 2) of P. berghei iRhopH2 and wildtype (WT) parasites. Groups of 5 mice were pre-treated for 24 hr with either 0.2 mg/ml ATc or sucrose (vehicle control), then infected with the PbiRhopH2 iKD line or WT PbANKA. Parasitaemia was calculated at the indicated timepoints. Error bars represent standard error of the mean. An unpaired t-test revealed growth of RhopH iKD +ATc was significantly impaired at all time points (p<0.0001) and that of RhopH2 iKD + sucrose was slower that PbAWT +ATc by day five post infection (p=0.026) (b) Representative Giemsa-stained smears showing effect of RhopH2 knockdown with ATc on parasite growth and schizont formation. Schematic shows experimental outline. (c) Depletion of RhopH2 protein levels also impacts on the number of merozoites formed per schizont (n = 59 and 55 schizonts examined for parasites grown in the absence and presence of ATc, respectively, and taken from three individual experiments). The central bar in the box plot denotes the median whilst the whiskers delineate the 10th and 90th percentiles. p<0.0001 by unpaired t-test. (d) Representative invasion assay (n = 2) performed with merozoites from mechanically ruptured schizonts cultured in vitro ± ATc showing percentage of parasites from n = 50–100 that were at ring (R), early trophozoite (ET), late trophozoite (LT) or schizont (S) stage of development.
Figure 6—figure supplement 1
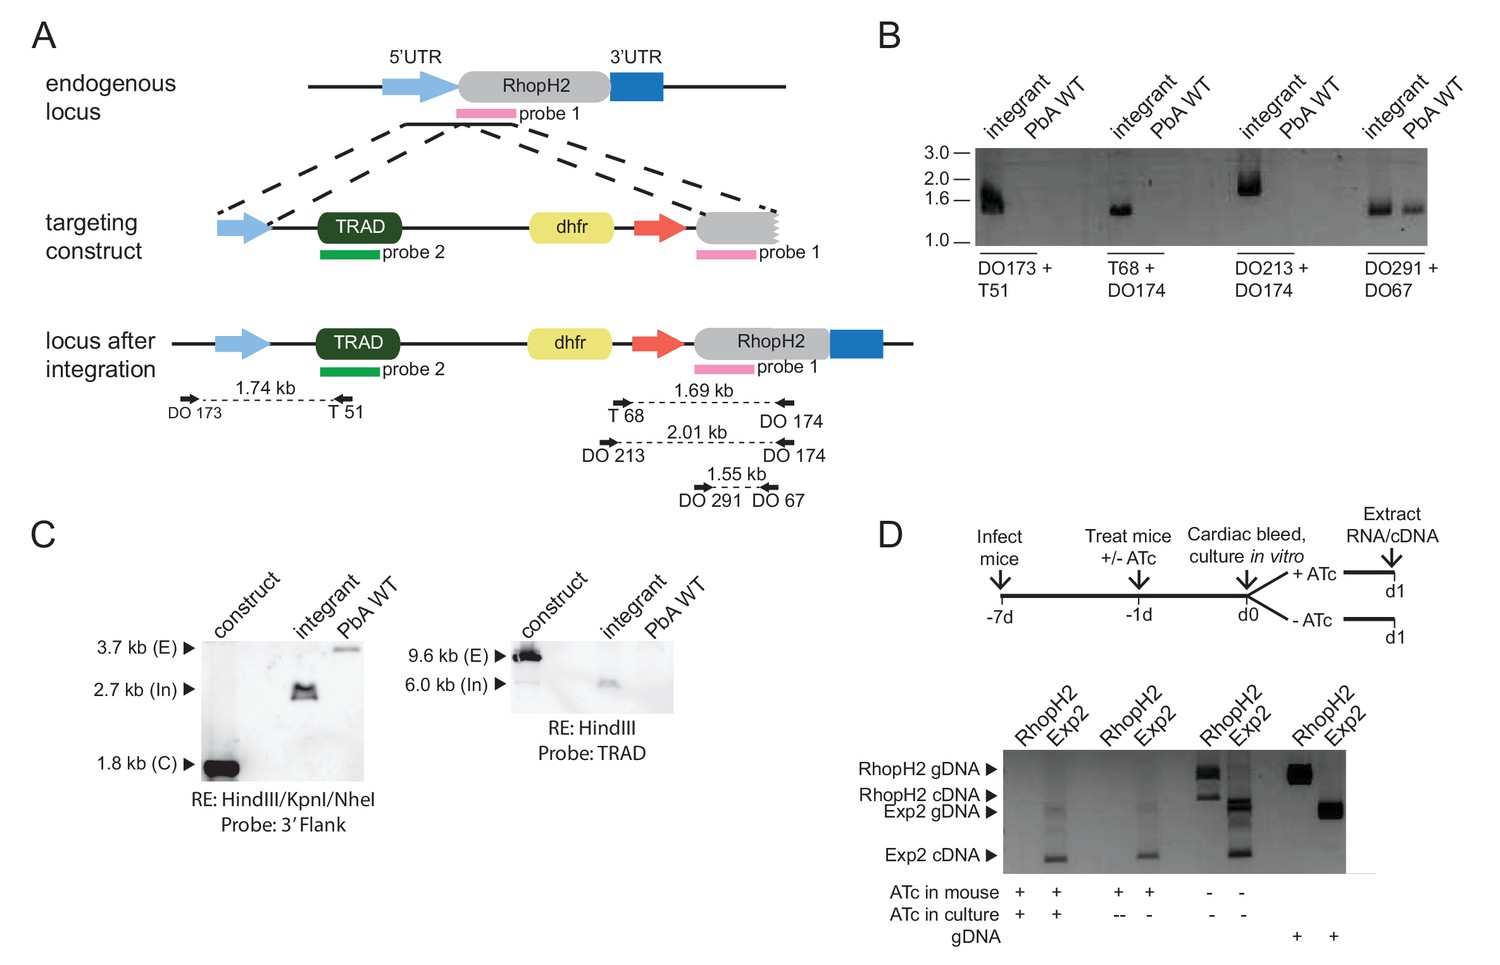
Characterization of inducible P. berghei RhopH2 parasites.
(a) The P. berghei inducible RhopH2 targeting construct was designed to integrate into the endogenous locus by double-crossover recombination. The predicted structure of the endogenous locus before and after integration is shown. Green and pink bars indicate regions used to generate probes for Southern blot, arrows indicate oligonucleotides used in diagnostic PCR analysis and indicative product size. (b) Diagnostic PCR showing PbRhopH2 iKD parasites have integrated the targeting sequence. Oligonucleotide pairs shown in A were used on genomic DNA prepared from drug-resistant parasites after transfection with the targeting construct (integrant) or P. berghei ANKA (WT). A product should only be observed for WT with DO291 and DO67 oligonucleotides. (c) Southern blot showing homologous integration into Pbrhoph2 gene as predicted. Plasmid DNA from the targeting construct and genomic DNA from integrant and WT were digested with restriction enzymes (RE) and probed with the 3' targeting sequence or TRAD sequence. In both cases, the endogenous locus (E) has been modified and integration (In) bands of the predicted size are seen. (d) RT-PCR showing reduced expression of PbRhopH2 in the presence of ATc. Upper panel: experimental outline. Mice infected with inducible RhopH2 line (PbiRhopH2) were treated with ATc or vehicle control (-ATc) for 24 hr prior to harvest and overnight culture in vitro ± ATc, upon which RNA was extracted from the schizont stages. Lower panel: Diagnostic PCR using oligonucleotides specific for rhoph2 or exp2. RhopH2 cDNA is only detected in the absence of ATc. Amplification products using gDNA as a template are shown in the last two lanes as controls.
Figure 7 with 1 supplement
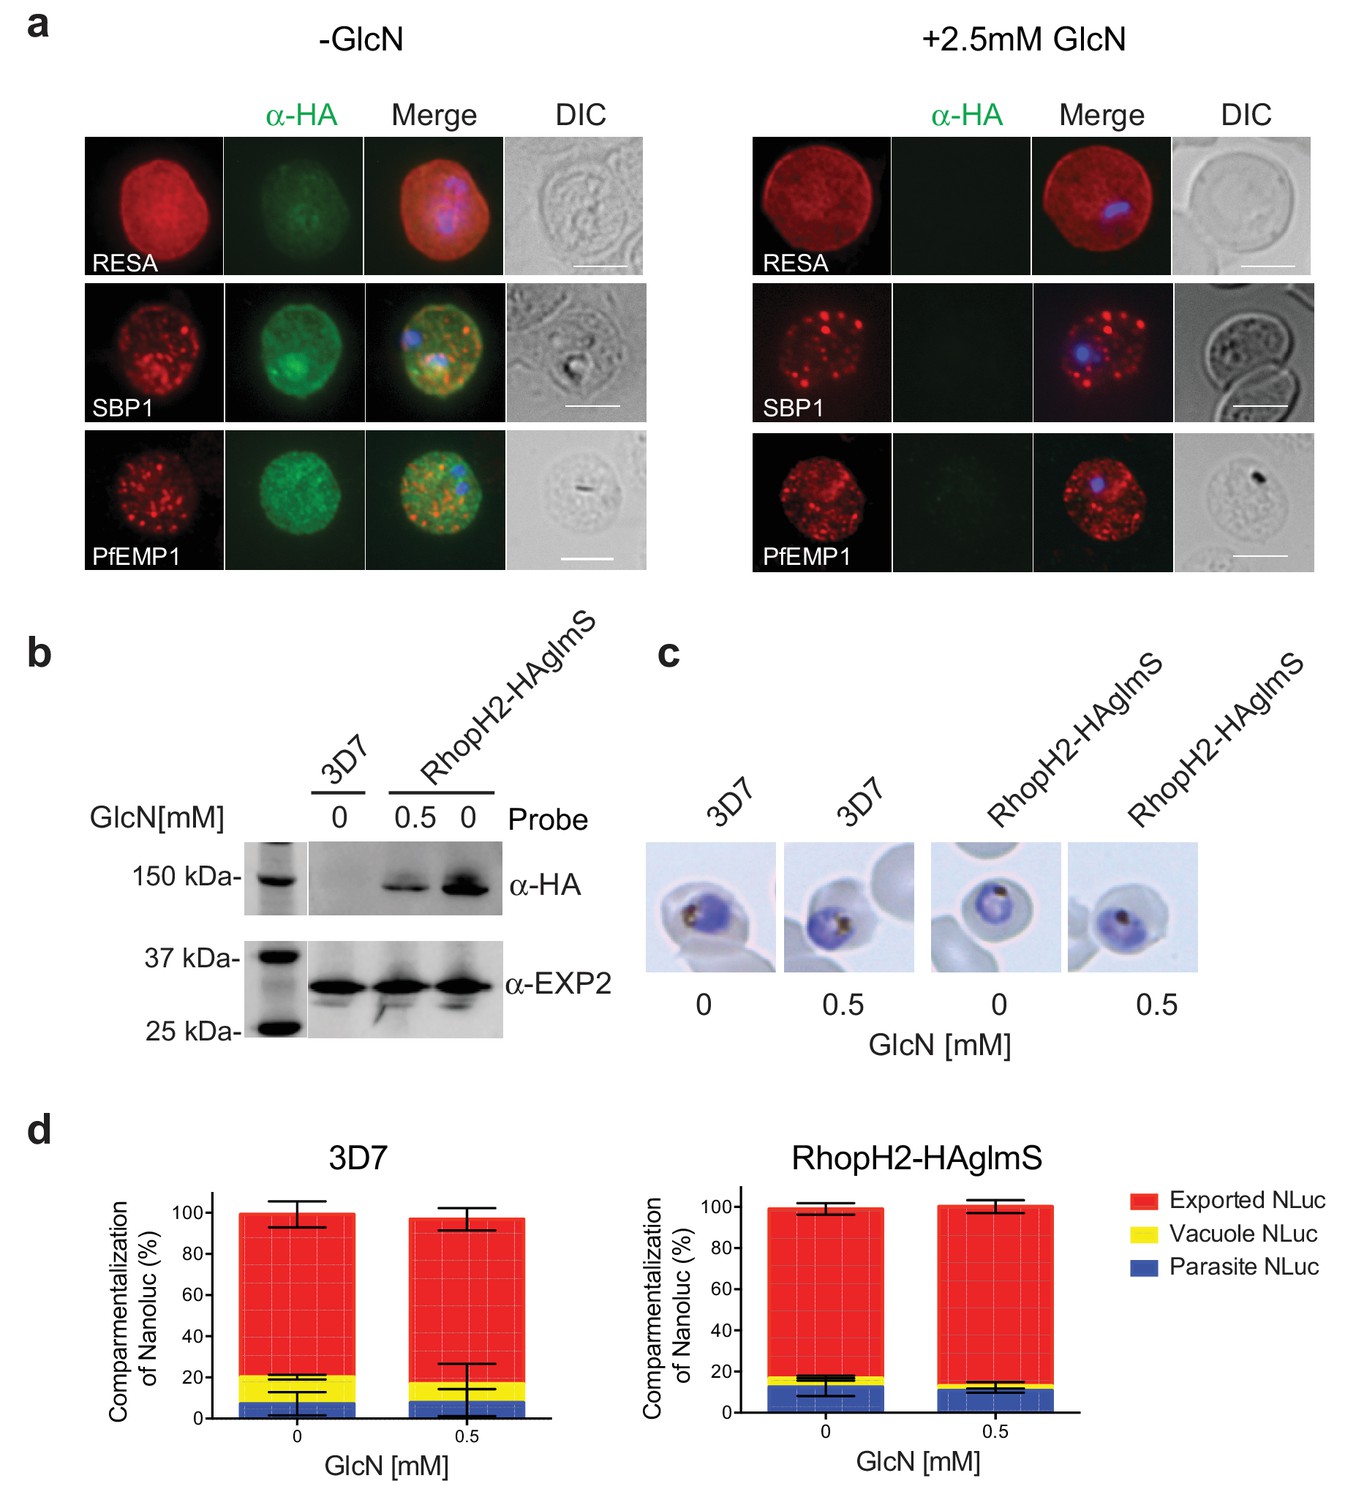
RhopH2 is not involved in the trafficking of exported proteins in the erythrocyte cytoplasm.
(a) Representative IFAs of erythrocytes infected with RhopH2-HAglmS parasites grown in 0 mM or 2.5 mM GlcN using the indicated antibodies show trafficking of RESA, SBP1 and PfEMP1 is unaffected upon RhopH2 knockdown. Scale bar = 5 µm (b) Western blots of the parasites probed with an anti-HA antibody indicate that PfRhopH2 has been substantially knocked down with 0.5 mM GlcN relative to an EXP2 loading control. (c) Giemsa stained images of the trophozoites that were analysed. (d) Proportion of luciferase activity exported into the erythrocyte cytosol, secreted into the parasitophorous vacuole or present in the parasite cytoplasm of RhopH2-HAglmS and 3D7 wildtype parasites transfected with Hyp1-Nluc and grown in ± GlcN. Bars denote mean ± SD (n = 3). An unpaired t-test revealed there was no significance different in the exported NLuc fractions ± GlcN for 3D7 (p=0.8579) and RhopH2-HAglmS (p=0.1801).
Figure 7—figure supplement 1
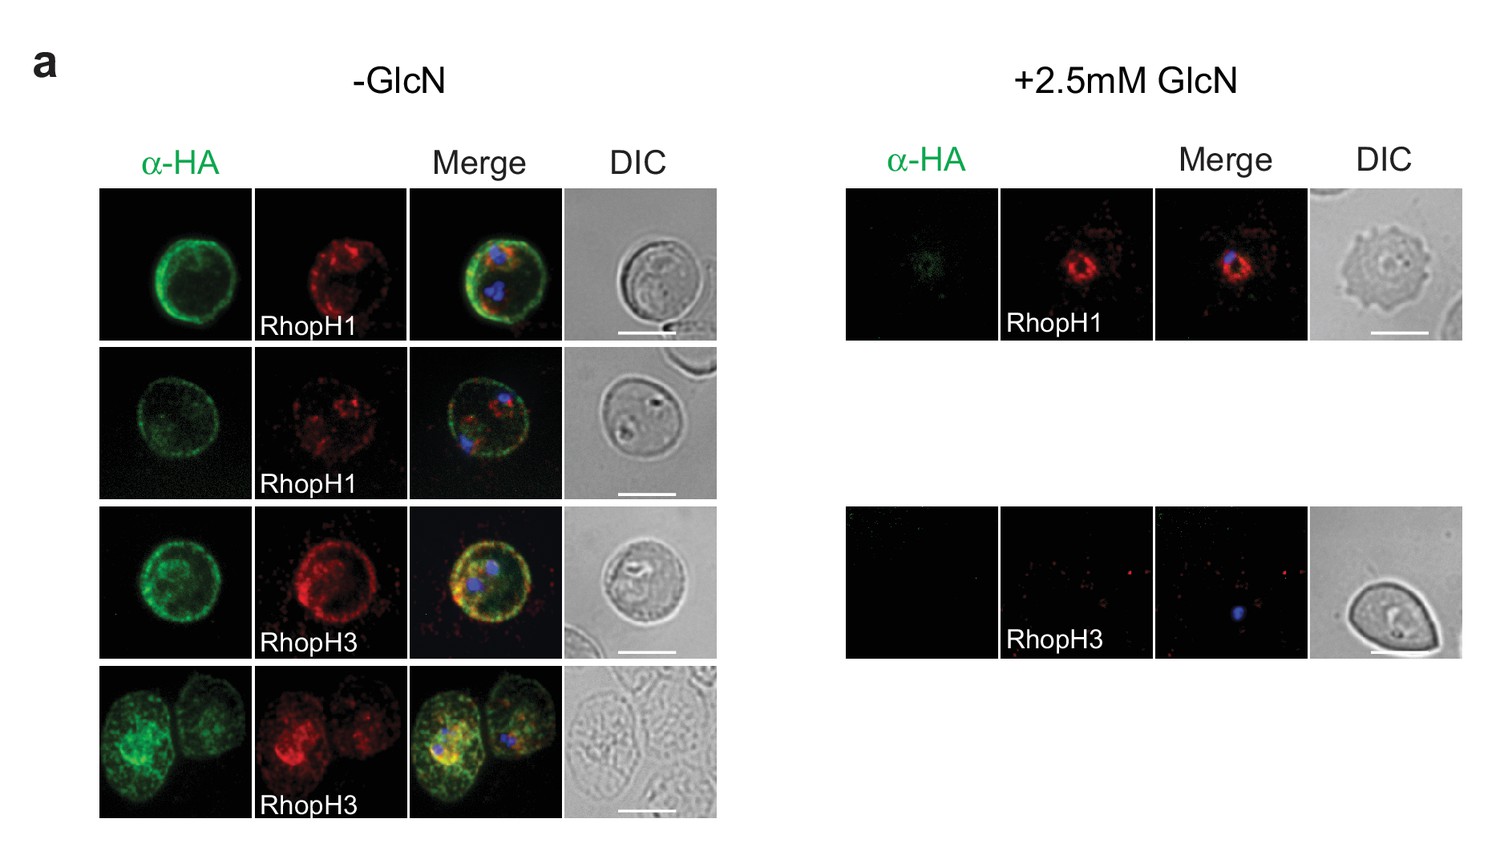
Localization of RhopH1/clag3 and RhopH3 in infected erythrocytes when RhopH2 expression is knocked down.
Representative immunofluorescence analysis of erythrocytes infected with RhopH2-HAglmS parasites grown in 0 mM or 2.5 mM GlcN. Cells fixed with acetone/methanol and labelled with anti-HA antibody to detect RhopH2 IFAs and other antibodies, as indicated.
Figure 8
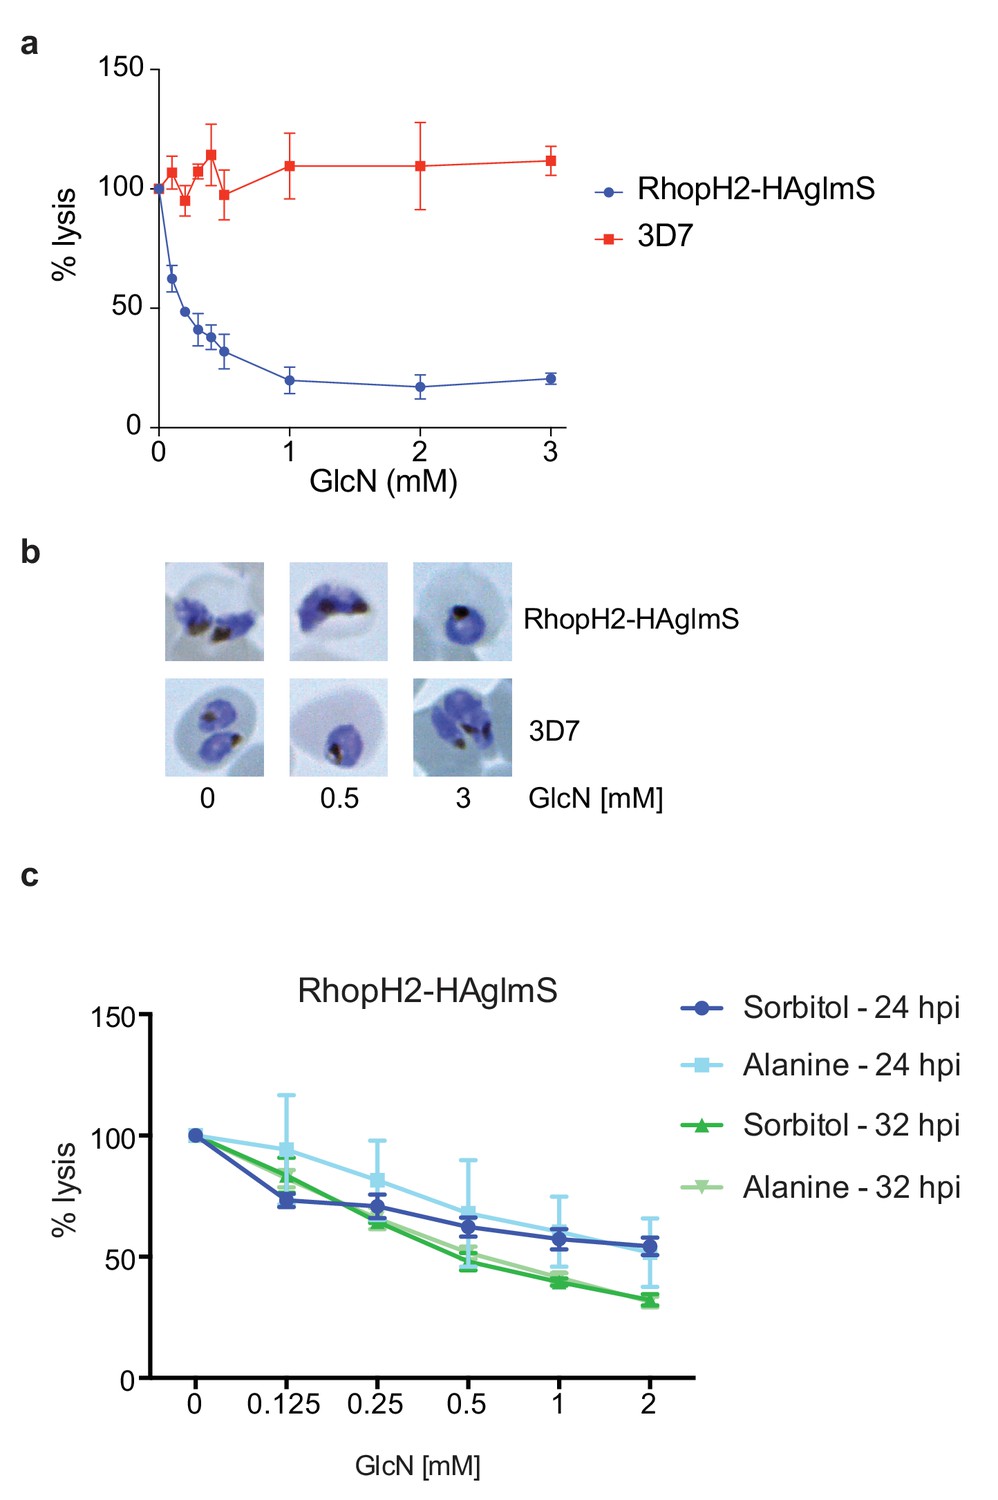
Knockdown of RhopH2 impairs sorbitol and alanine uptake.
(a) GlcN-mediated knockdown of RhopH2 in PfRhopH2-HAglmS parasites expressing an exported Hyp1-Nluc reporter leads to a dramatic reduction in the capacity of infected erythrocytes to be lysed by the addition of sorbitol. In contrast erythrocytes infected with 3D7 parasites expressing Hyp1-Nluc are sensitive to sorbitol-mediated lysis. The % lysis was determined by the amount of NanoGlo substrate hydrolysed by Hyp1-Nluc, with 100% lysis defined as the Nluc activity (RLU/min) in parasites incubated in 280 mM sorbitol buffer with no GlcN. Data represents mean ± SD of three biological replicates completed in triplicate. (b) Giemsa stained images of the trophozoites analysed in the sorbitol uptake assays. (c) Analysis of sorbitol and alanine-mediated lysis of erythrocytes infected with PfRhopH2-HAglmS parasites at 24 and 32 hr post infection (hpi) at various concentrations of GlcN. The % lysis was determined by the amount of NanoGlo substrate hydrolysed by Hyp1-Nluc. Data represents mean ± SD of one biological experiment completed in triplicate.
Figure 9
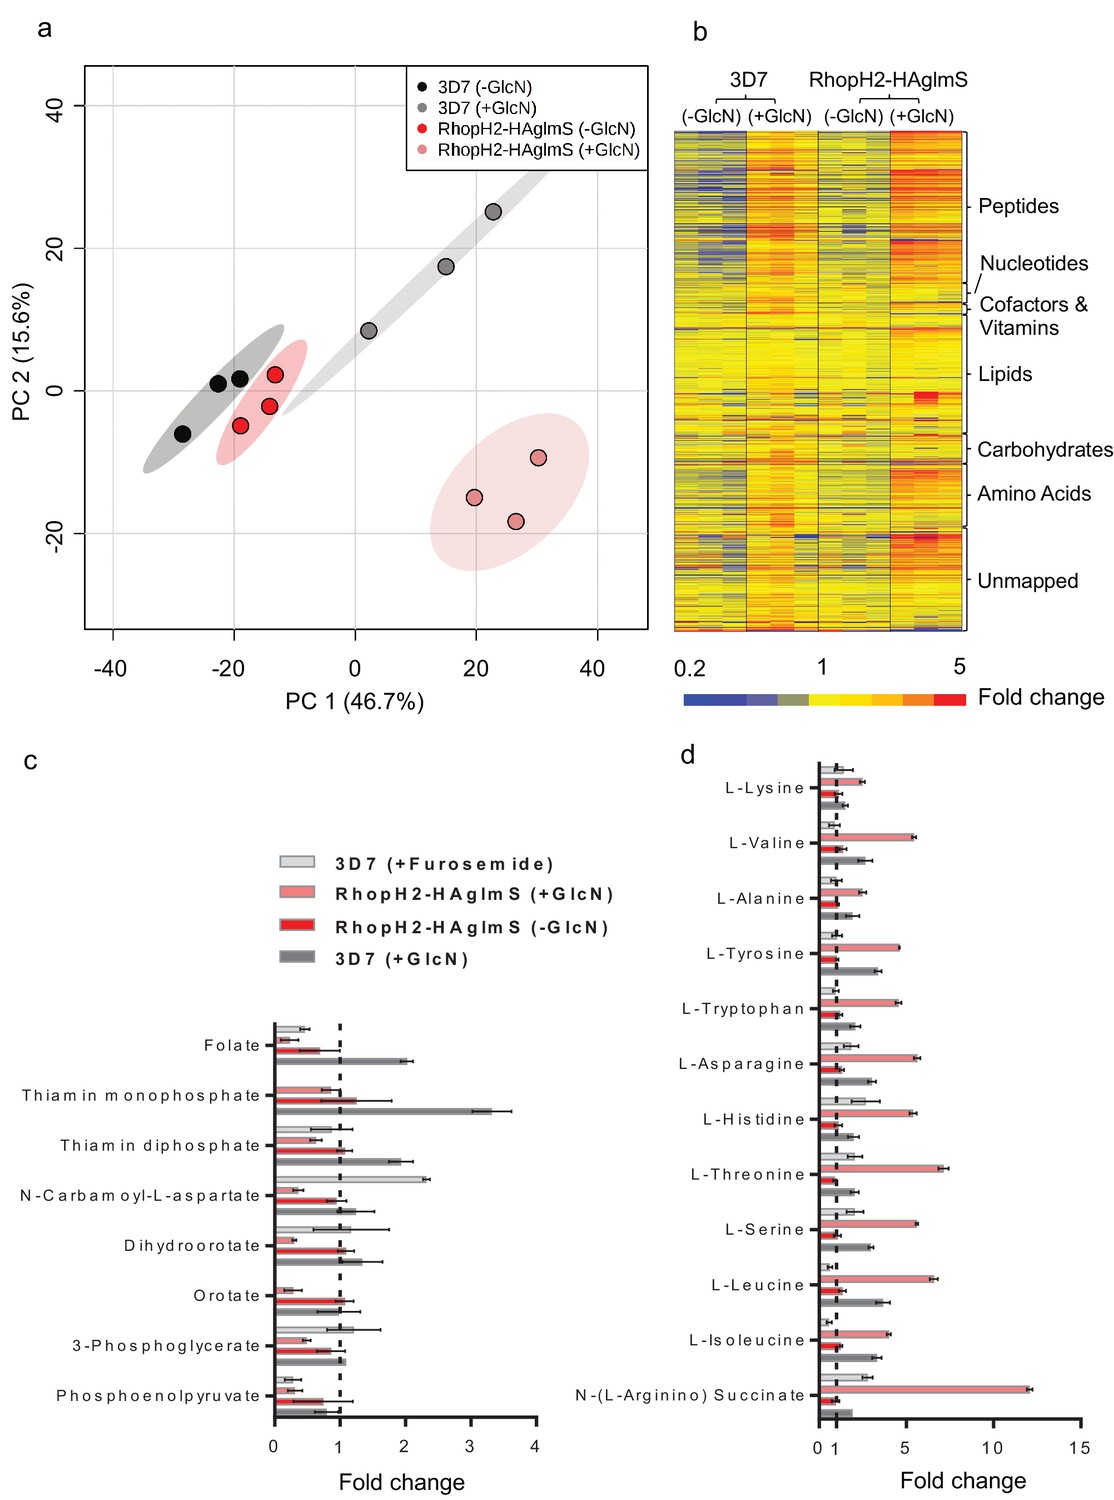
Metabolomics analysis of 3D7 and RhopH2-HAglmS parasites +/- GlcN treatment.
(a) Principal Component Analysis scores plot of the first two principal components based on all metabolite features across the four sample groups. (b) Heat map of relative abundance of all the putative metabolites detected in this study grouped according to metabolite classes. (c) Fold change of metabolites showing a decrease in abundance, involved in vitamin and co-factor metabolism, de novo pyrimidine synthesis and glycolysis in the RhopH2-HAglmS (+GlcN) and 3D7 (+Furosemide) parasites compared to 3D7 (untreated) represented by the dotted vertical line. Error bars indicate relative standard deviation from n = 3 independent biological replicates. Thiamine monophosphate and orotate were not detected in the furosemide treatment experiment. (d) Fold change of metabolites (amino acids and a urea cycle intermediate) showing an increase in abundance in the RhopH2-HAglmS (+GlcN) and 3D7 (+Furosemide) parasites compared to 3D7 (untreated) represented by the dotted vertical line. Error bars indicate relative standard deviation from n = 3 independent biological replicates.
Figure 10
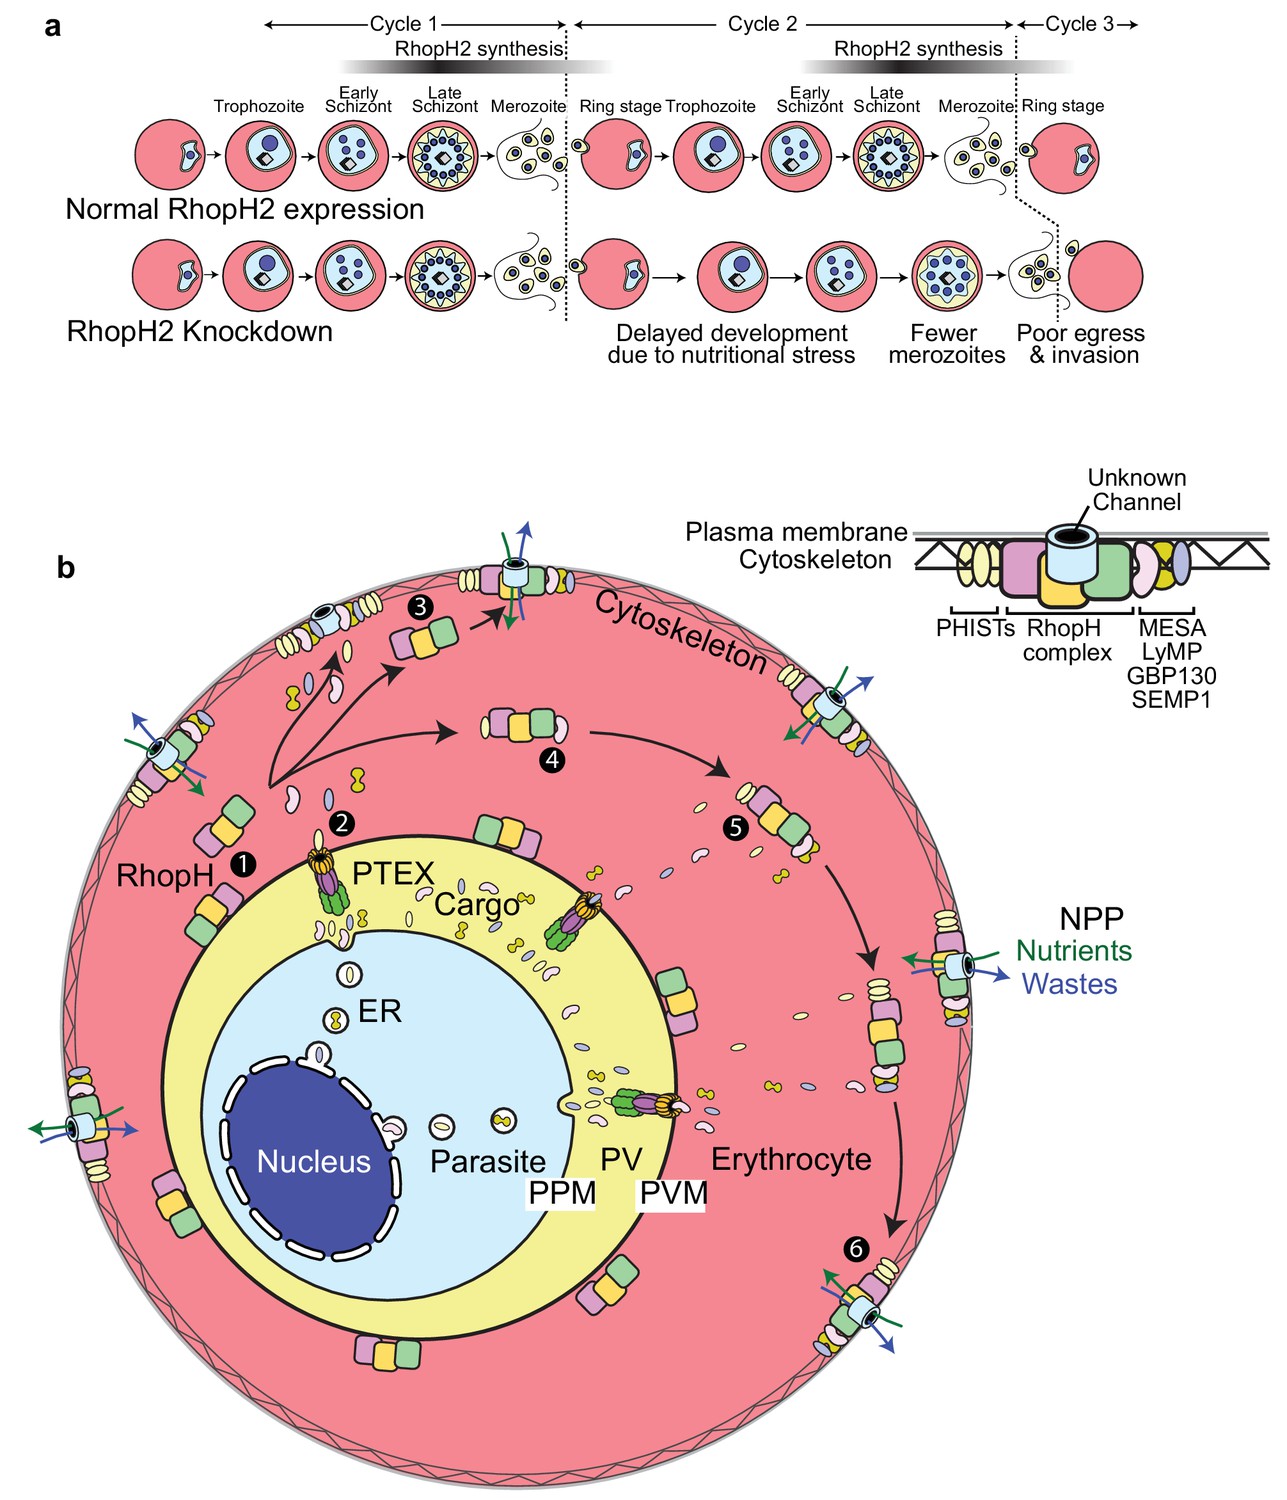
Scheme illustrating how RhopH2 knockdown effects blood stage development.
(a) Knockdown of RhopH2 expression in cycle one appears to impair uptake of plasma nutrients in cycle two which delays development and replication in cycles 2 and 3. (b) (1) The RhopH complex is probably introduced onto the surface of the parasitophorous vacuole membrane (PVM) during merozoite invasion. (2) Shortly after invasion the PTEX complex begins exporting parasite-synthesised proteins secreted into the parasitophorous vacuole (PV), out into the erythrocyte cytoplasm. Some of the exported proteins such as PHISTs, MESA, LyMP, GBP130 and SEMP1 travel and bind to the erythrocyte cytoskeleton. The RhopH complex either (3) binds to these exported proteins at the erythrocyte surface or (4, 5) assembles with these proteins en route to the surface. (6) Once at the surface, the RhopH/exported protein complex forms NPPs either by forming their own membrane-spanning pore or by ‘opening up’ an erythrocyte pore. The NPPs function to permit the entry of nutrients and to dispose of parasite waste products.
Videos
Video 1
Plasmodium falciparum RhopH2-HAglmS schizont rupturing and releasing merozoites which invade nearby human erythrocytes.
Successful invasions are indicated with white arrows. Time in seconds from egress is indicated.
Video 2
A rupturing Plasmodium falciparum RhopH2-HAglmS schizont that had been treated with 3 mM glucosamine for 2 cell cycles to knockdown RhopH2-HA expression.
At 0 s the erythrocyte membrane surrounding the schizont begins to break down but the merozoites do not disperse until about 68 s later. None of the merozoites appeared to invade neighbouring erythrocytes.
Additional files
-
Supplementary file 1
Metabolomics analysis of 3D7 and RhopH2-HAglmS parasites ± GlcN treatment.
Complete list of putative metabolites identified in this study are shown together with the fold change compared to untreated 3D7 parasites. The relative standard deviation from n = 3 independent biological replicates is also shown (see attached Excel spreadsheet).
- https://doi.org/10.7554/eLife.23217.018
-
Supplementary file 2
Oligonuclotide sequences used in this study.
- https://doi.org/10.7554/eLife.23217.019
Download links
A two-part list of links to download the article, or parts of the article, in various formats.
Downloads (link to download the article as PDF)
Open citations (links to open the citations from this article in various online reference manager services)
Cite this article (links to download the citations from this article in formats compatible with various reference manager tools)
Plasmodium falciparum parasites deploy RhopH2 into the host erythrocyte to obtain nutrients, grow and replicate
eLife 6:e23217.
https://doi.org/10.7554/eLife.23217


