Competition between histone and transcription factor binding regulates the onset of transcription in zebrafish embryos
- Max Planck Institute of Molecular Cell Biology and Genetics, Germany
- Center for Systems Biology Dresden, Germany
- Max Planck Institute for the Physics of Complex Systems, Germany
Figures
Figure 1 with 1 supplement
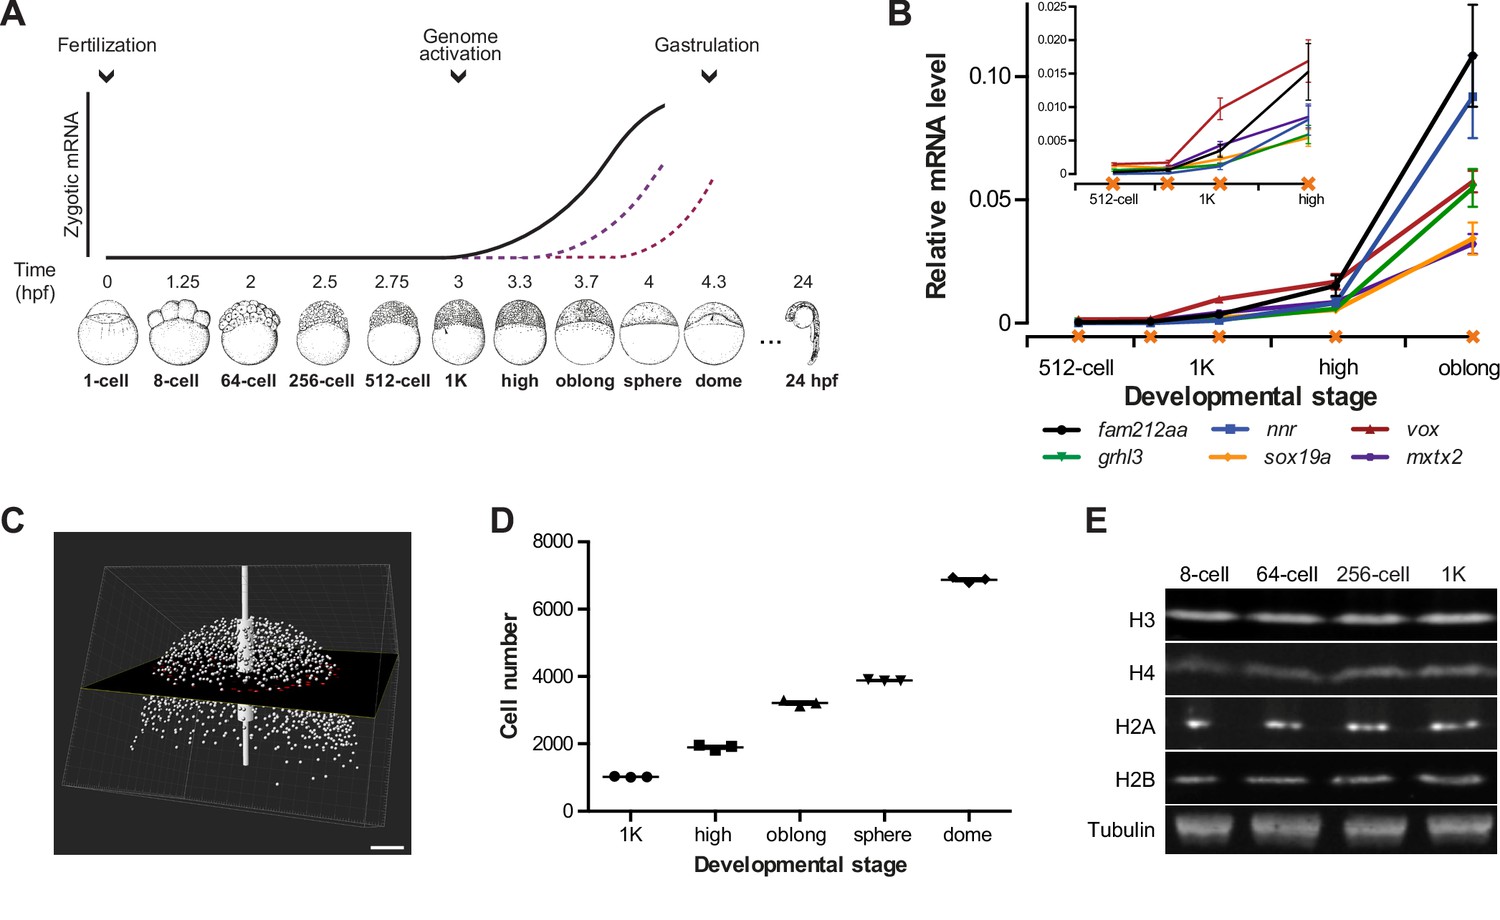
Assay to analyze the onset of transcription in zebrafish.
(A) In zebrafish, transcription begins ~3 hr post-fertilization. Stage-specific drawings of representative embryos are adapted from Kimmel et al. (1995) with permission. (B) Expression of six genes was analyzed by qPCR at 512-cell, early 1K, mid 1K, high and oblong stage in wild-type embryos. Inset shows the same data, focusing on 1K and high stage. Data were taken from Figures 2B and 3D. Error bars represent SEM (n ≥ 4). (C) Cell counting of DAPI-stained nuclei imaged with a two-photon microscope. Multiple z-slices and four tiles were stitched to allow rendering in imaging software Imaris and the calculation of cell number. Image shown is a representative example of high stage. Scale bar, 100 μm. (D) Quantification of the number of cells at 1K, high, oblong, sphere and dome stage. Each data point represents a biological replicate consisting of three embryos. Error bars represent SEM (n = 3). (E) Western blots showing the protein level of histone H3, H4, H2A, and H2B in embryos at 8-cell, 64-cell, 256-cell and 1K stages. Tubulin was used to control for equal loading in each experiment. Blots shown are representative examples (n > 3).
© 1995 John Wiley and Sons. All Rights Reserved. Figure 1 part A, lower panel sketches of embryos were reproduced from Kimmel et al. (1995) with permission.
-
Figure 1—source data 1
Cell numbers for wild-type zebrafish embryos.
At every stage, cells were counted for three biological replicates, each consisting of three embryos.
- https://doi.org/10.7554/eLife.23326.004
Figure 1—figure supplement 1

Selection of genes and eif4g2α as a normalizer gene.
(A) Schematic representation of gene-selection procedures. (B) Maternally loaded eif4g2α mRNA was used as a control in qPCR analyses. To test whether the level of eif4g2α mRNA was stable during the stages of interest (not degraded and independent of zygotic transcription), the level of eif4g2α mRNA was analyzed in wild-type embryos and in embryos that were injected with the transcription inhibitor α-amanitin. As a control, sox19a mRNA was analyzed. Indicated are the Ct’s (threshold cycles in quantitative PCR analysis) for eif4g2α and sox19a as obtained at 512-cell, early 1K, high, oblong and late oblong in the presence (minus α-amanitin) and absence (plus α-amanitin) of zygotic transcription. Whereas the Ct’s for sox19a decrease starting at high stage (green), the Ct’s for eif4g2α do not (red). Moreover, α-amanitin inhibits the transcription of sox19a (black) but does not affect the levels of eif4g2α (blue). Together, this shows that eif4g2α is neither degraded nor zygotically transcribed during the stages we analyzed. Shown is a representative example of two replicates.
Figure 2 with 2 supplements

Increasing the levels of all core histones delays onset of transcription and gastrulation.
(A) Schematic representation of experimental procedure. Histone cocktail (HC) containing ~5800 genomes worth of histones, or BSA was injected into the yolk of 1-cell embryos and qPCR and NanoString analysis was carried out at stages around genome activation. Orange crosses represent the timing of stages used for the analysis. (B) Expression of mxtx2 and fam212aa was analyzed by qPCR at early 1K, high, and oblong stage in uninjected, BSA-injected and HC-injected embryos. Bar graphs show the same data, focusing on high stage. Error bars represent SEM (n ≥ 13). ***p<0.001 (two-tailed Student’s t test, compared to BSA control). (C) Expression of 53 zygotically expressed genes was analyzed by NanoString analysis at high stage in uninjected, BSA-injected and HC-injected embryos. Mean counts of three independent biological replicates are shown. Location of mxtx2 and fam212aa counts is indicated (See Figure 2—figure supplement 2 for more details). (D) Relative expression level of mxtx2 and fam212aa at high stage, for embryos injected with BSA, HC, and HC minus H3, H4, H2A, or H2B. Error bars represent SEM (n = 7). ***p<0.001 (ordinary one-way ANOVA). (E) Brightfield images of embryos that were not injected, injected with BSA, or injected with HC. Boxed images represent the onset of gastrulation. Scale bar shown for the uninjected 2-cell embryo applies to all treatments except for 24 hpf embryos which have a different scale bar. All scale bars represent 250 μm. hpf, hours post-fertilization. (F) Bar graph shows the quantification of the extra time it takes embryos to start gastrulation upon injecting BSA, HC, or HC minus one histone, compared to uninjected embryos. Error bars represent SEM (n = 27 for BSA, n = 25 for HC, n = 7 for HC minus one histone experiments). ***p<0.001 (ordinary one-way ANOVA with Tukey’s multiple comparison test). In B and D, mRNA levels are normalized to the expression of eif4g2α.
-
Figure 2—source data 1
NanoString probe set.
- https://doi.org/10.7554/eLife.23326.007
Figure 2—figure supplement 1
Increasing the levels of all core histones delays onset of transcription.
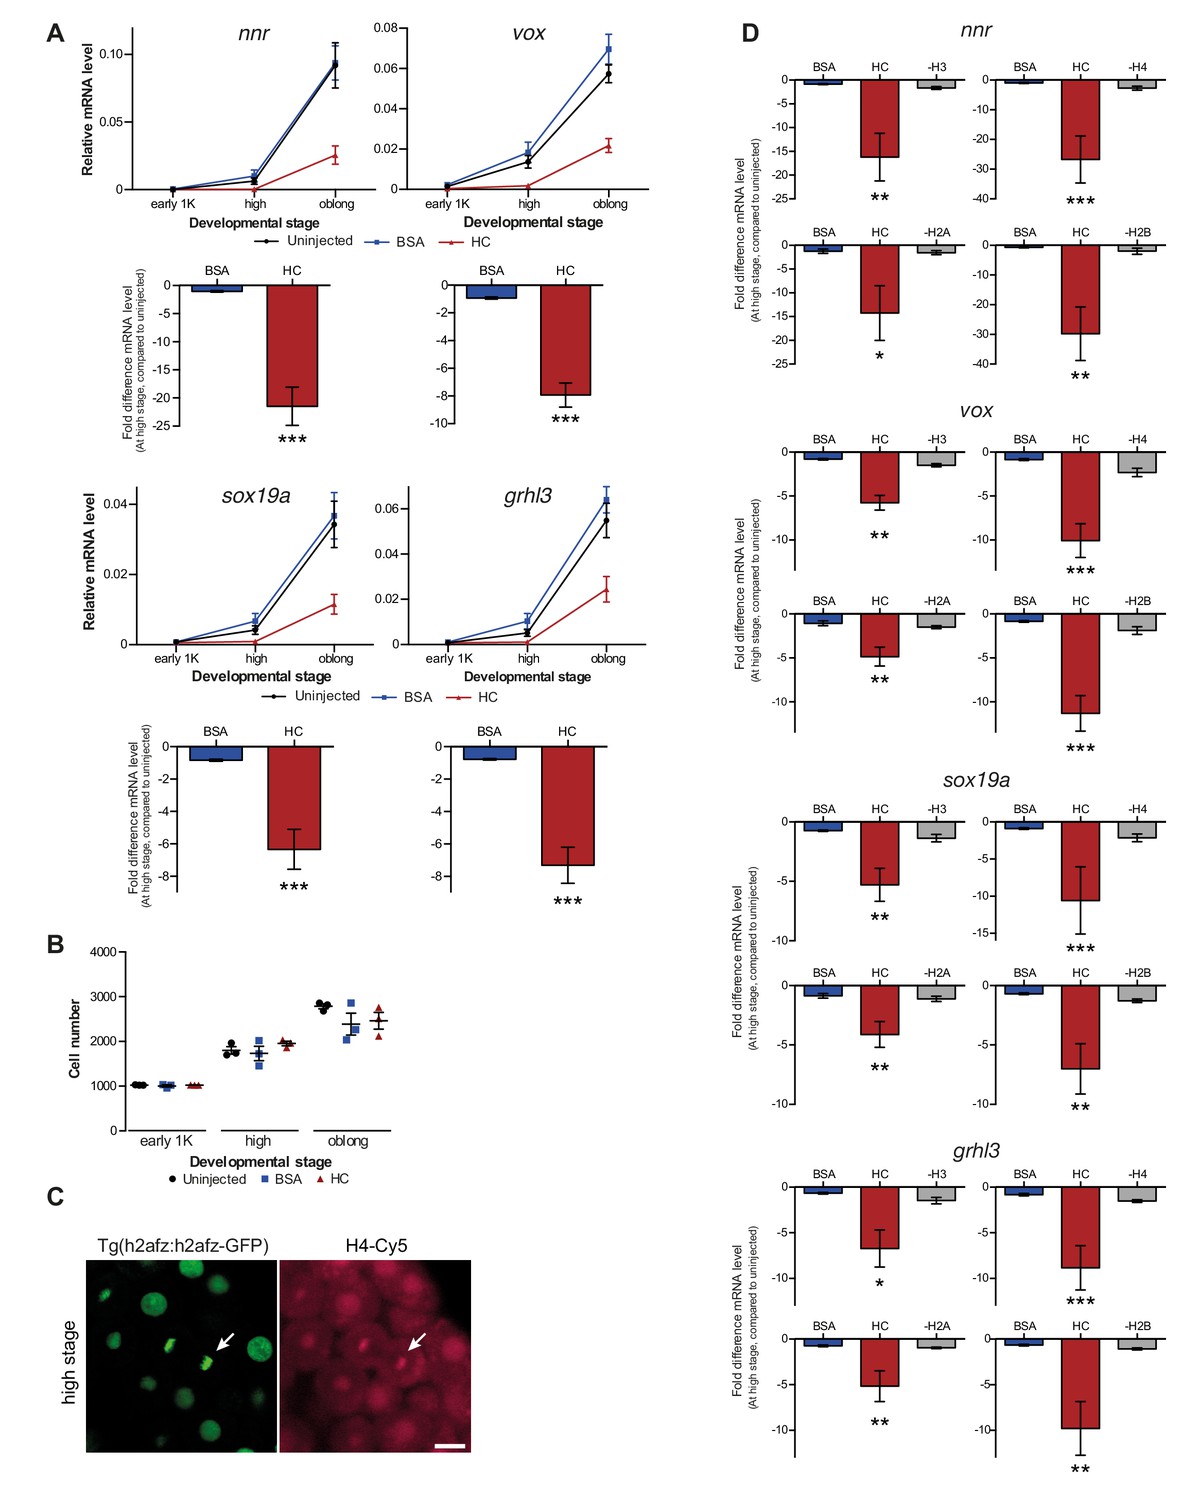
(A) Expression of nnr, vox, sox19a, and grhl3 was analyzed by qPCR at early 1K, high, and oblong stage in uninjected, BSA-injected and HC-injected embryos. Bar graphs show the same data, focusing on high stage. Error bars represent SEM (n ≥ 13). ***p<0.001 (two-tailed Student’s t-test, compared to BSA control). (B) Staging by morphology was verified by cell counting. Each data point represents a single embryo. Error bars represent SEM. (C) Confocal microscope images of transgenic fish line Tg(h2afz:h2afz-GFP) injected with Cy5 conjugated to H4. Arrow points at chromatin in dividing cell. Scale bar, 20 μm. (D) Relative expression level of nnr, vox, sox19a, and grhl3 at high stage, for embryos injected with BSA, HC, and HC minus H3, H4, H2A, or H2B. Error bars represent SEM (n = 7). *p<0.05; **p<0.01; ***p<0.001 (ordinary one-way ANOVA). In A and D, expression is normalized to the expression of eif4g2α.
Figure 2—figure supplement 2
Increasing the levels of all core histones delays onset of transcription for a large number of genes.
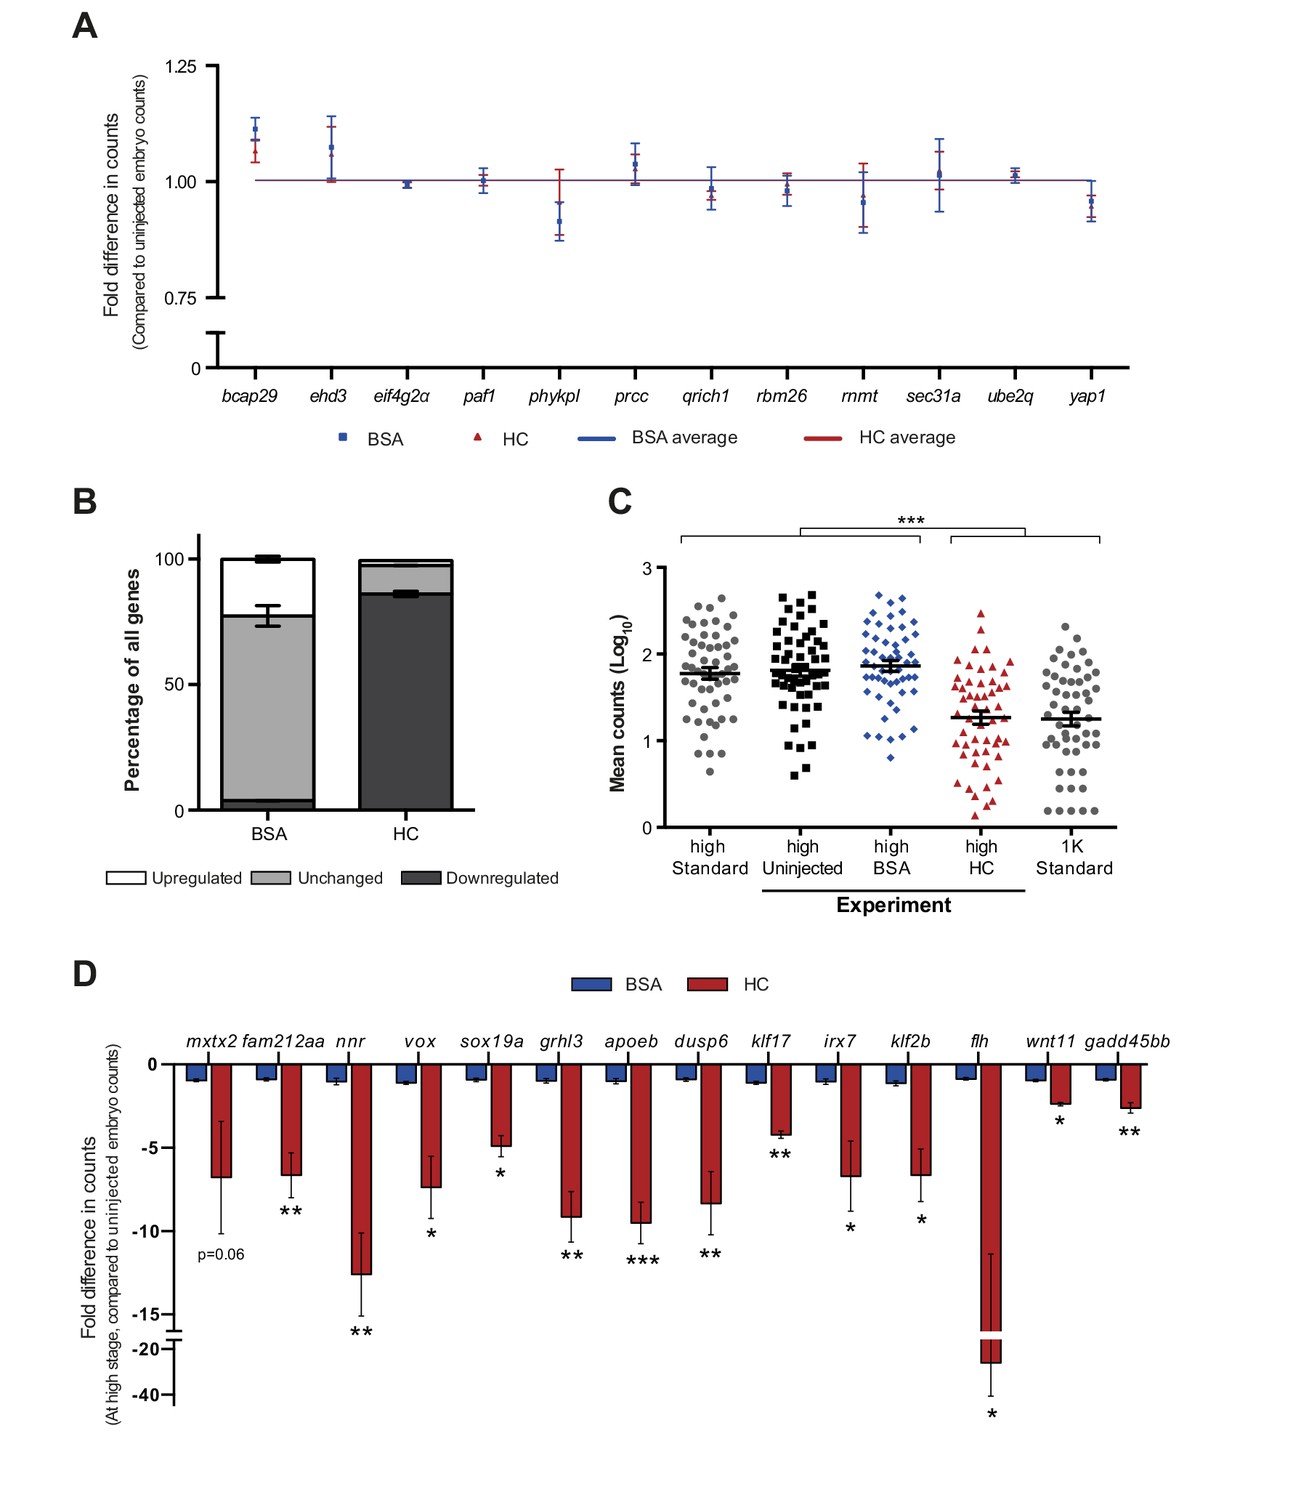
NanoString’s nCounter technology was used to analyze changes in gene expression upon HC injection for a large number of genes (see Materials and methods for more details). From a custom probe set with 84 zygotically expressed genes and 12 controls genes (see Figure 2—source data 1), 53 genes that are induced at high stage were used for analysis. mRNA was collected from high stage embryos that were uninjected, BSA-injected and HC-injected (n = 3). (A) Fold difference in expression of twelve control genes, for embryos injected with BSA or HC compared to uninjected. Control genes are maternally provided and were previously shown to be stable from 512 cell to dome stage in NanoString analysis (data not shown). Error bars represent SEM (n = 3). No significant difference was detected between BSA or HC-injected in control genes (Ordinary one-way ANOVA with Tukey’s multiple comparison test), showing that there are no differences in total RNA amount between samples. (B) Proportion of genes affected by BSA or HC injection at high stage in NanoString analysis. Error bars represent SEM (n = 3). A large proportion of genes are down-regulated in HC-injected embryos (86%) compared to BSA-injected embryos (4%). (C) Mean counts of three independent biological replicates in NanoString analysis for uninjected, BSA-injected and HC-injected embryos compared to a high (left) and 1K (right) standard from uninjected embryos. While uninjected and BSA-injected are statistically similar to the high standard, HC-injected is statistically similar to the 1K standard. Thus, HC-injected embryos that are developmentally at high stage, are transcriptionally delayed by one developmental stage. Error bars represent SEM (n = 3). ***p<0.001 (Ordinary one-way ANOVA with Tukey’s multiple comparison test). (D) Fold difference in mRNA counts for HC-injected and BSA-injected compared to uninjected embryos at high stage for all genes that were analyzed by qPCR in this study. Error bars represent SEM (n = 3). *p<0.05; **p<0.01; ***p<0.001 (two-tailed Student’s t-test ratio paired, compared to BSA-injected).
Figure 3 with 1 supplement
Decreasing the level of histones causes premature transcription.
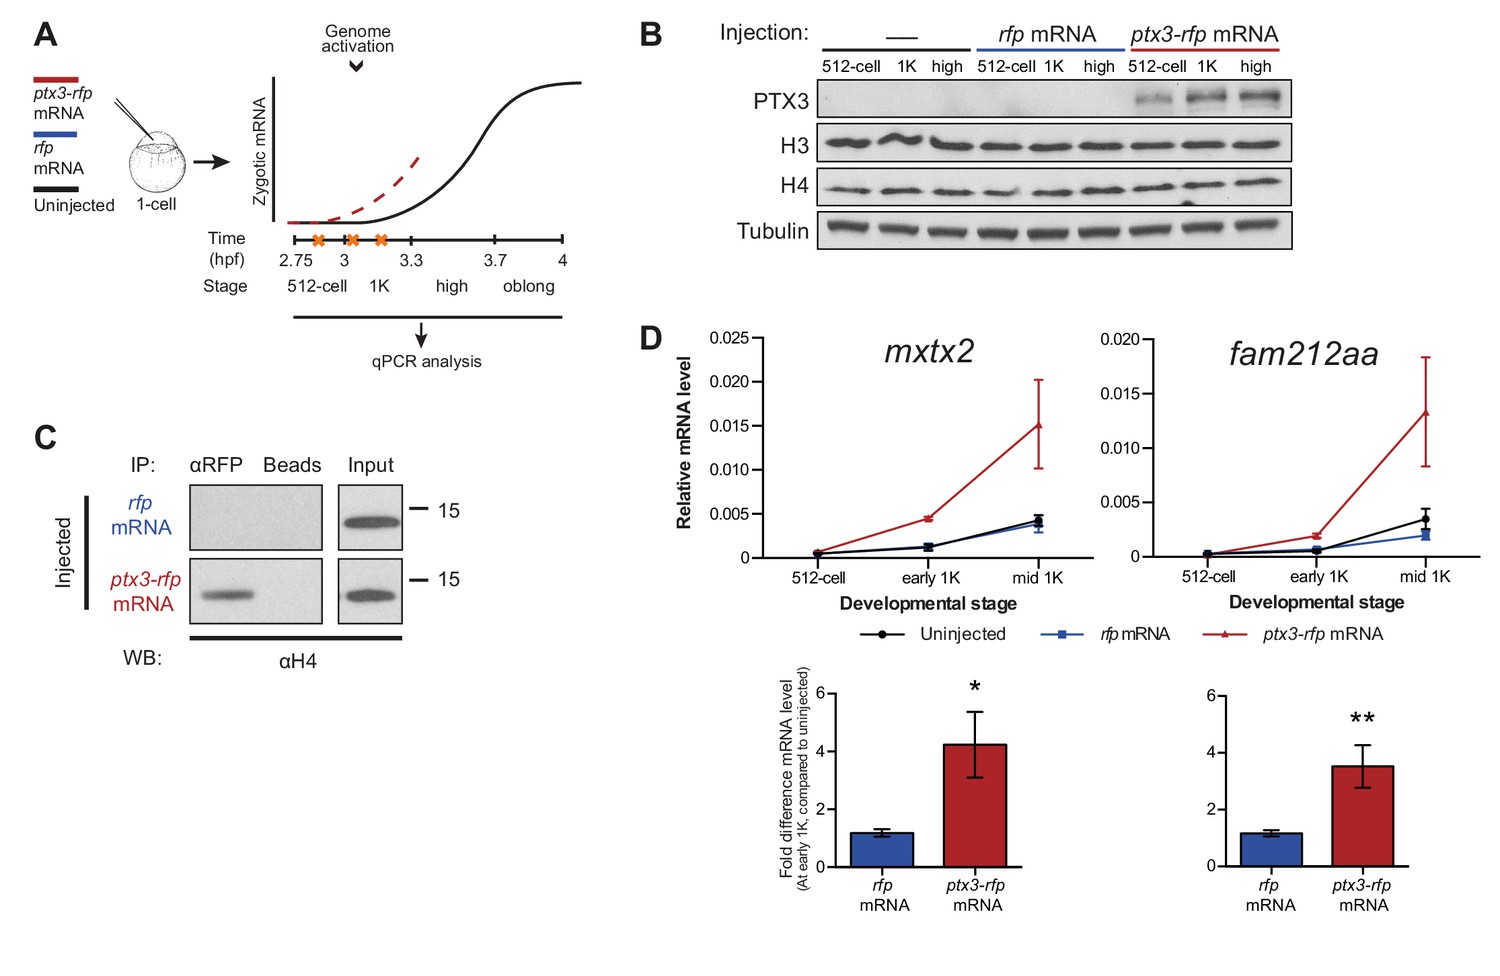
(A) Schematic representation of experimental procedure. ptx3-rfp or rfp (control) mRNA was injected into the cell of 1-cell embryos and qPCR analysis was carried out at stages around genome activation. Orange crosses represent the timing of stages used for the analysis. (B) Western blot analysis of PTX3, histone H3 and H4 levels at 512-cell, 1K and high stage in uninjected embryos, rfp and ptx3-rfp mRNA-injected embryos. Tubulin was used to control for equal loading. Blots shown are representative examples (n = 3). (C) Western blot analysis for histone H4 after a pull-down using an RFP antibody at 1K stage. Uncoupled beads were used as a negative control. Blot shown is a representative example (n = 3). (D) Expression of mxtx2 and fam212aa was analyzed by qPCR at 512-cell, early 1K, and mid 1K stage in uninjected, rfp mRNA-injected and ptx3-rfp mRNA-injected embryos. Bar graphs focus on early 1K stage. Error bars represent SEM (n ≥ 4). *p<0.05; **p<0.01 (two-tailed Student’s t-test, compared to rfp mRNA control). mRNA levels are normalized to the expression of eif4g2α.
Figure 3—figure supplement 1

Decreasing the level of histones causes premature transcription.
(A) Expression of nnr, vox, sox19a, and grhl3 was analyzed by qPCR at 512 cell, early 1K and mid 1K in uninjected embryos, embryos injected with rfp (control) mRNA and embryos injected with ptx3-rfp mRNA. Bar graphs show the same data, focusing on early 1K stage. Error bars represent SEM (n ≥ 4). n.s. p>0.05; *p<0.05; **p<0.01 (two-tailed Student’s t-test, compared to rfp mRNA control). Expression is normalized to the expression of eif4g2α. (B) Staging by morphology was verified by cell counting at the stages used for the analysis. Each data point represents a single embryo. Error bars represent SEM.
Figure 4 with 1 supplement

Onset of transcription coincides with a reduction in nuclear histone concentration.
(A) Our quantitative mass spectrometry approach. Zebrafish histones were quantified by comparing the abundances of native histone peptides with corresponding isotopically labeled peptides from the chimeric protein; chimeric protein was quantified by comparing the abundance of labeled (from chimera) and native (from standard) BSA peptides (see Materials and methods for more details). (B) Quantification of the number of histone H3, H4, H2A, and H2B per embryo at indicated stages by quantitative mass spectrometry. Error bars represent SEM (n = 3). (C) The excess number of histones per cell (in genomes worth) was calculated using H2B levels (Figure 4—source data 1) and cell numbers (Figure 1—source data 1), and by assuming an average of 1.5 genomes per cell (see Materials and methods for more details). For better visualization of the data at later developmental stages the values for 1-cell and 8-cell are not shown in the graph but are 3098 and 518, respectively. Error bars represent SEM (n = 3). GW, genomes worth of histones. (D) The total concentration of non-DNA-bound histones was calculated by dividing the excess genomes worth of histone H2B per embryo by the volume of the animal cap at the respective stages (Figure 4—figure supplement 1A). Error bars represent SEM of animal cap volumes (n = 3). GW, genomes worth of histones. (E) The nuclear concentration of non-DNA-bound histones was calculated from immunofluorescence (from left to right n = 12, 12, 14, 15) combined with live imaging and mass spectrometry data (see Materials and methods for more details). Error bars represent SEM of animal cap volumes (n = 3). (F) Relative differences in H2B intensity between chromatin fractions of 256-cell, 512-cell, 1K, and high stage embryos. Sphere stage embryos were used to determine the linear range of H2B detection (see also Figure 4—figure supplement 1C). Blots shown are representative examples (n ≥ 3). Plots show observed fold differences in H2B intensity in chromatin fractions comparing indicated stages compared to the differences that would be expected if the intensity were to scale with the amount of DNA (E, embryo). (G) Competition model. See text for more details (TFBS, transcription-factor-binding site).
-
Figure 4—source data 1
Quantification of histone number by mass spectrometry.
See Materials and methods for details on calculations.
- https://doi.org/10.7554/eLife.23326.013
-
Figure 4—source data 2
Two channel recording of H4-sfGFP and PCNA-RFP distributions from 8-cell to oblong stage.
H4-sfGFP (left, green channel) intensities are transformed to logarithmic scale to compensate for intensity increase due to ongoing translation of mRNA into fluorescent fusion protein. PCNA-RFP (right, magenta channel) intensities are linear. Both channels are maximum z-projections, with a view upon the animal cap, time stamps are given in hour:minute format, starting with the first acquired frame.
- https://doi.org/10.7554/eLife.23326.014
Figure 4—figure supplement 1
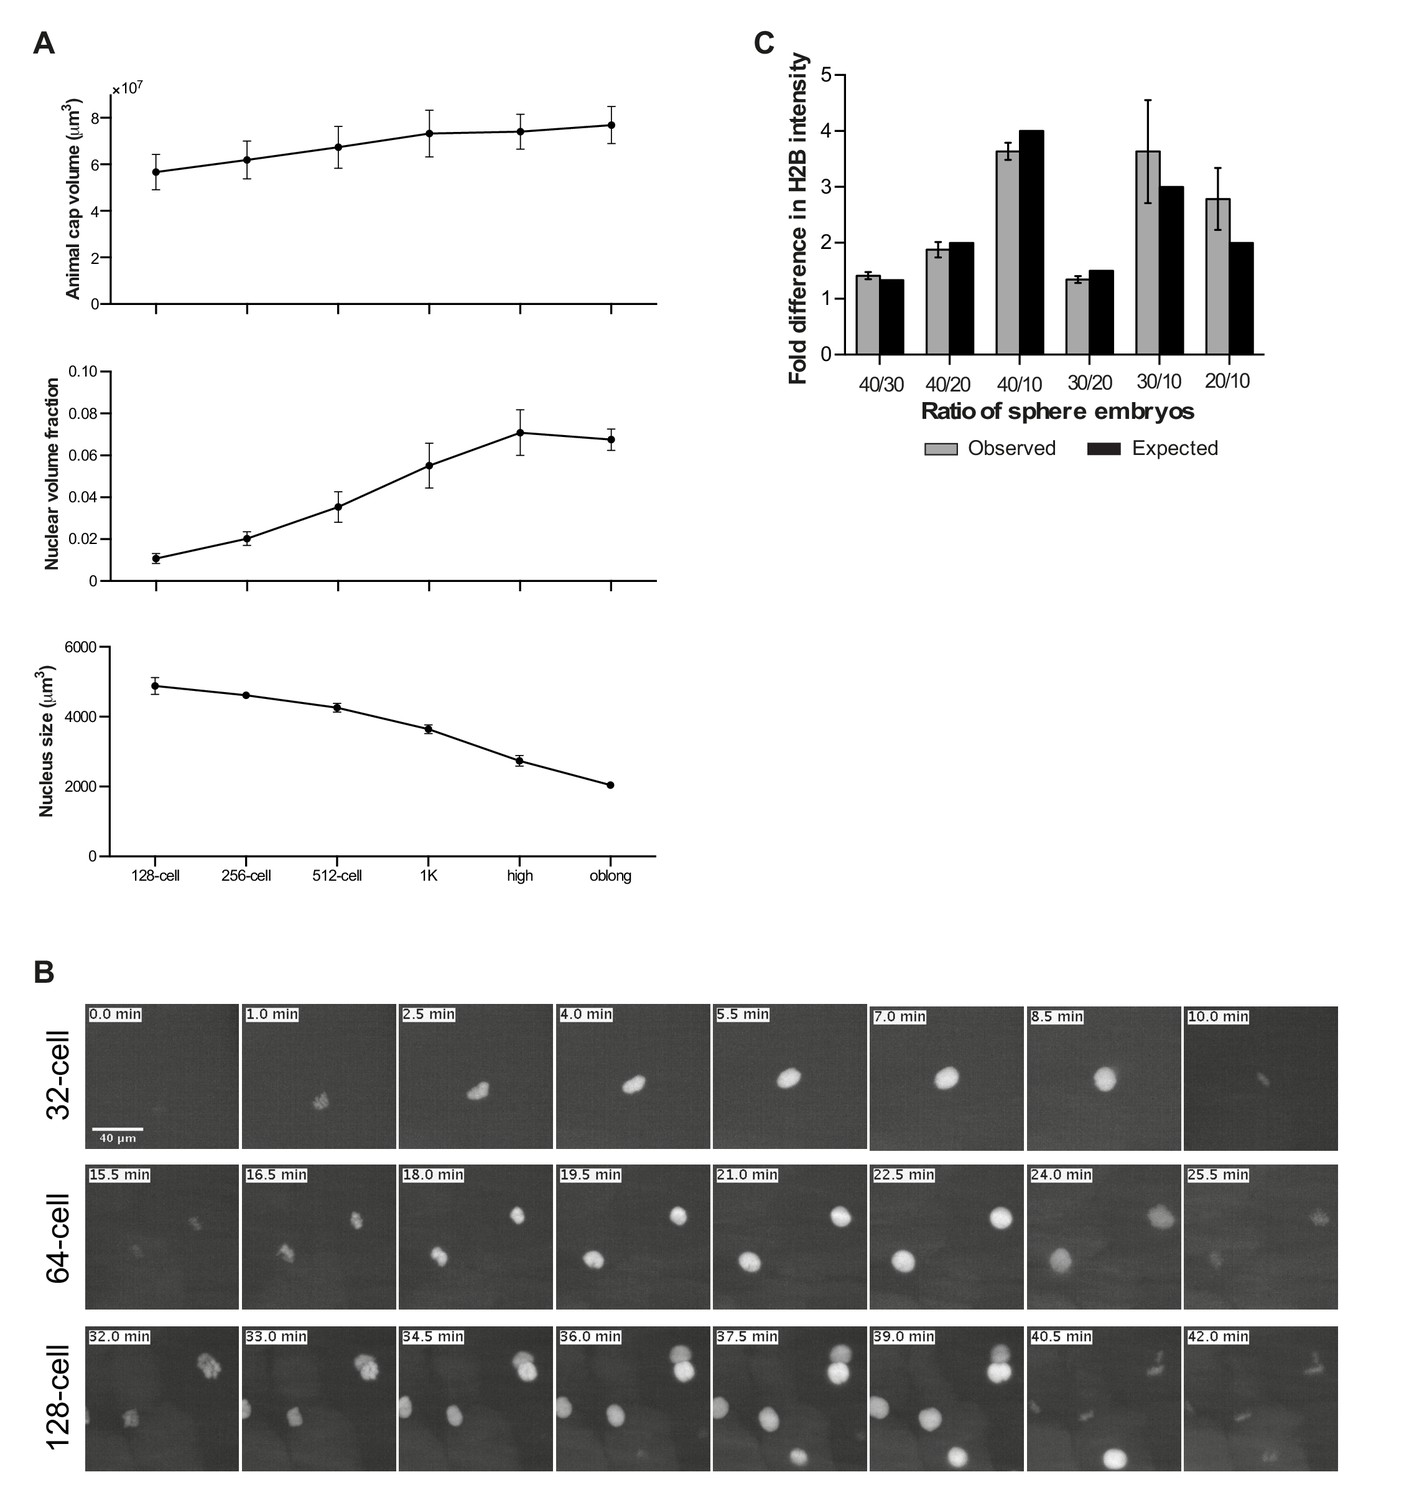
Onset of transcription coincides with a reduction in nuclear histone concentration.
(A) Changes in total animal cap volume, the fraction of the animal cap volume occupied by nuclei, and the size of individual nuclei for indicated stages. Volumes were measured by lightsheet microscopy of embryos injected with mRNA encoding H4-sfGFP and subsequent automated image analysis (error bars represent SEM, n = 3 embryos; offspring of transgenic PCNA-RFP was used to monitor integrity of imaged nuclei via a second color channel). (B) Image sequences showing nuclear import of H4-sfGFP fusion protein at 32- to 64- and 128-cell stages. Color scaling was kept constant and linear within each stage. Images show a representative maximum z-projection of a subset of a 3D microscopy stack of one of the embryos used in A. (C) The linear range of Western blots was determined using chromatin of sphere-stage embryos. Plotted are observed versus expected fold differences in H2B intensity using different numbers of embryos (n ≥ 3). Band intensities of test stages (Figure 4F) were only used for the analysis when they fell within the linear range.
Figure 5 with 2 supplements
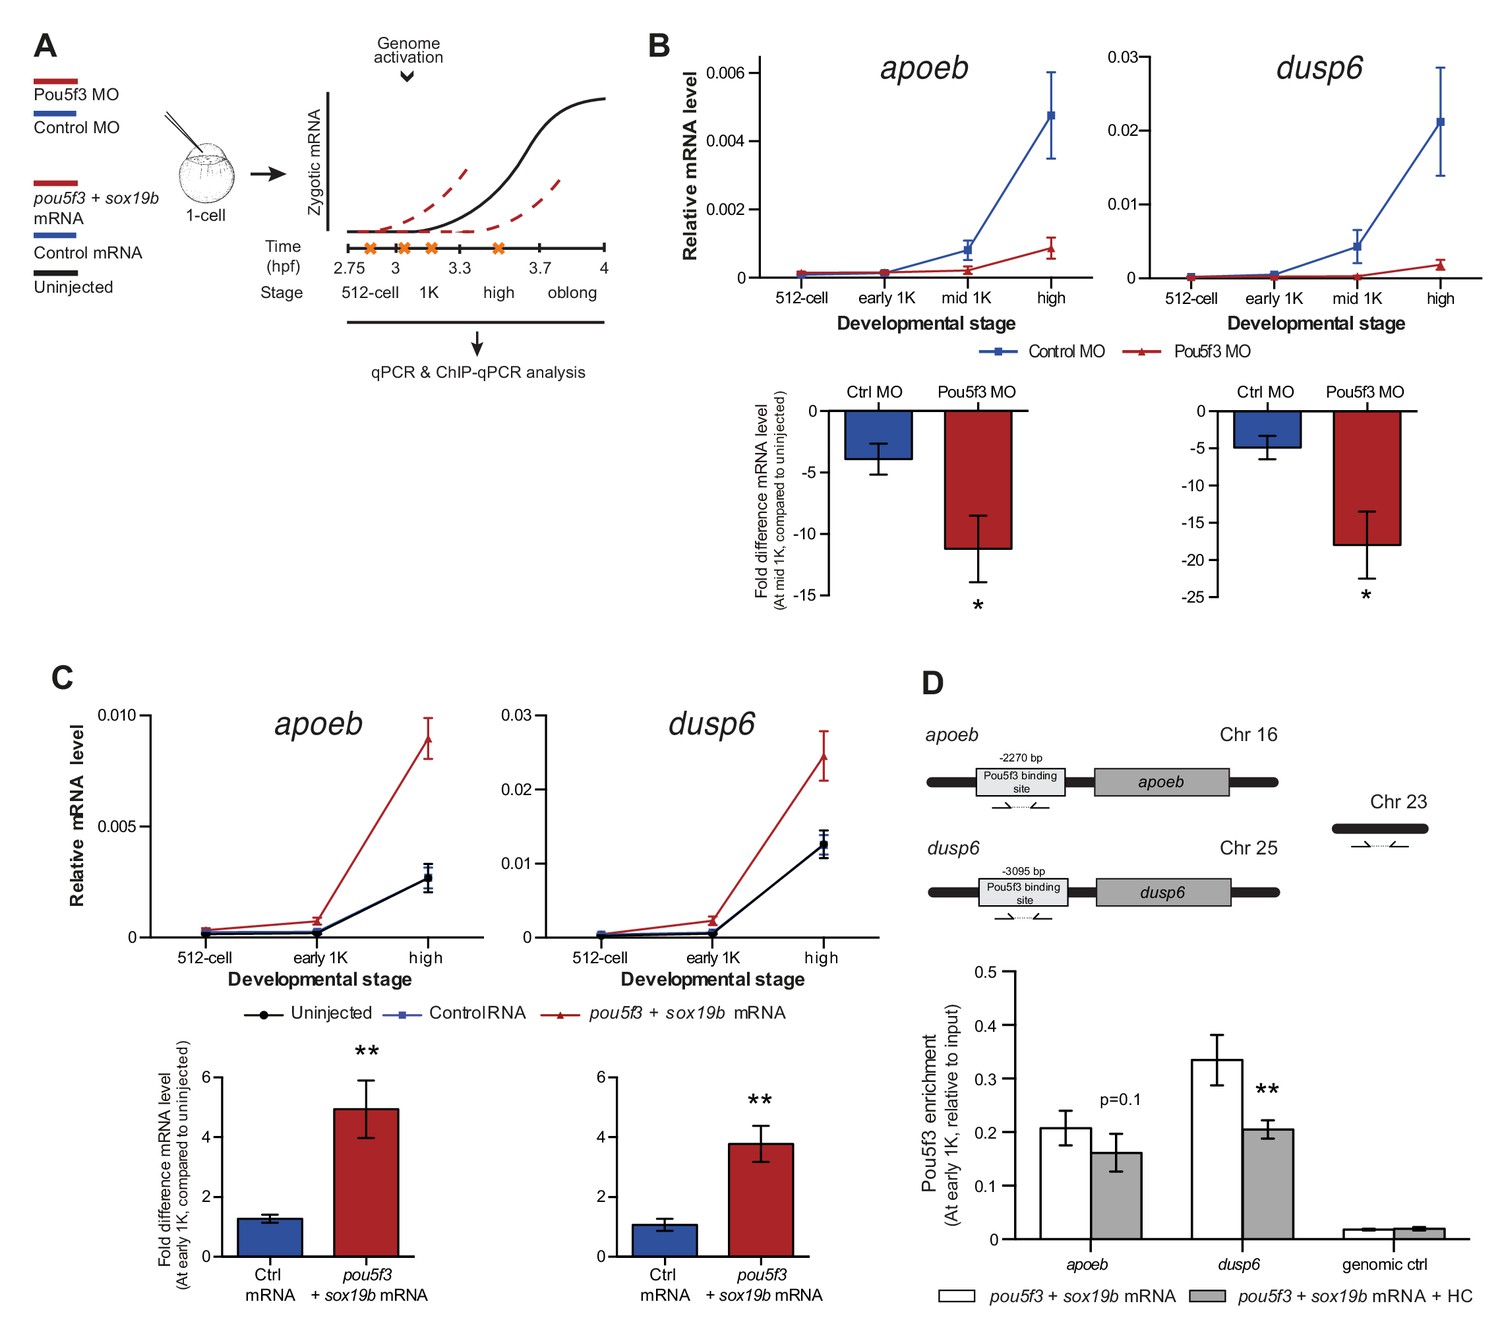
Direct experimental evidence for the competition model using endogenous genes and transcription factors.
(A) Schematic representation of experimental procedure. Pou5f3 levels were decreased by injecting a morpholino, or increased by injecting pou5f3 mRNA (in combination with sox19b mRNA) into the cell of 1-cell embryos. Controls used were a dead-end morpholino and gfp mRNA, respectively. qPCR and ChIP-qPCR analysis was carried out at stages around genome activation. Orange crosses represent the timing of stages used for the analysis. (B) Expression of apoeb and dusp6 was analyzed by qPCR at 512-cell, early 1K, mid 1K and high stage in control and Pou5f3 morpholino-injected embryos. The data in the bar graphs focus on the mid 1K stage. Error bars represent SEM (n ≥ 4). *p<0.05 (two-tailed Student’s t-test, compared to control MO). (C) Expression of apoeb and dusp6 was analyzed by qPCR at 512-cell, early 1K and high stage in uninjected embryos, embryos injected with control mRNA and embryos injected with pou5f3 and sox19b mRNA. Bar graphs focus on the early 1K stage. Error bars represent SEM (n ≥ 4). **p<0.01 (two-tailed Student’s t-test, compared to control mRNA). (D) Binding of Pou5f3 to its respective binding sites for apoeb and dusp6 (Leichsenring et al., 2013) and control region was analyzed by ChIP-qPCR at the early 1K stage in embryos injected with pou5f3 + sox19b mRNA or pou5f3 + sox19b mRNA plus histone cocktail. Enrichment of pulled-down fragments was normalized to input. Location of primer sets in respect to the transcription start-site used for ChIP-qPCR analysis are indicated by arrows. A genome control region on chromosome 23 was also used. Error bars represent SEM (n = 5). **p<0.01 (two-tailed Student’s t-test ratio paired, compared to pou5f3 + sox19b mRNA-injected embryos). In B and C, mRNA levels are normalized to the expression of eif4g2α.
Figure 5—figure supplement 1
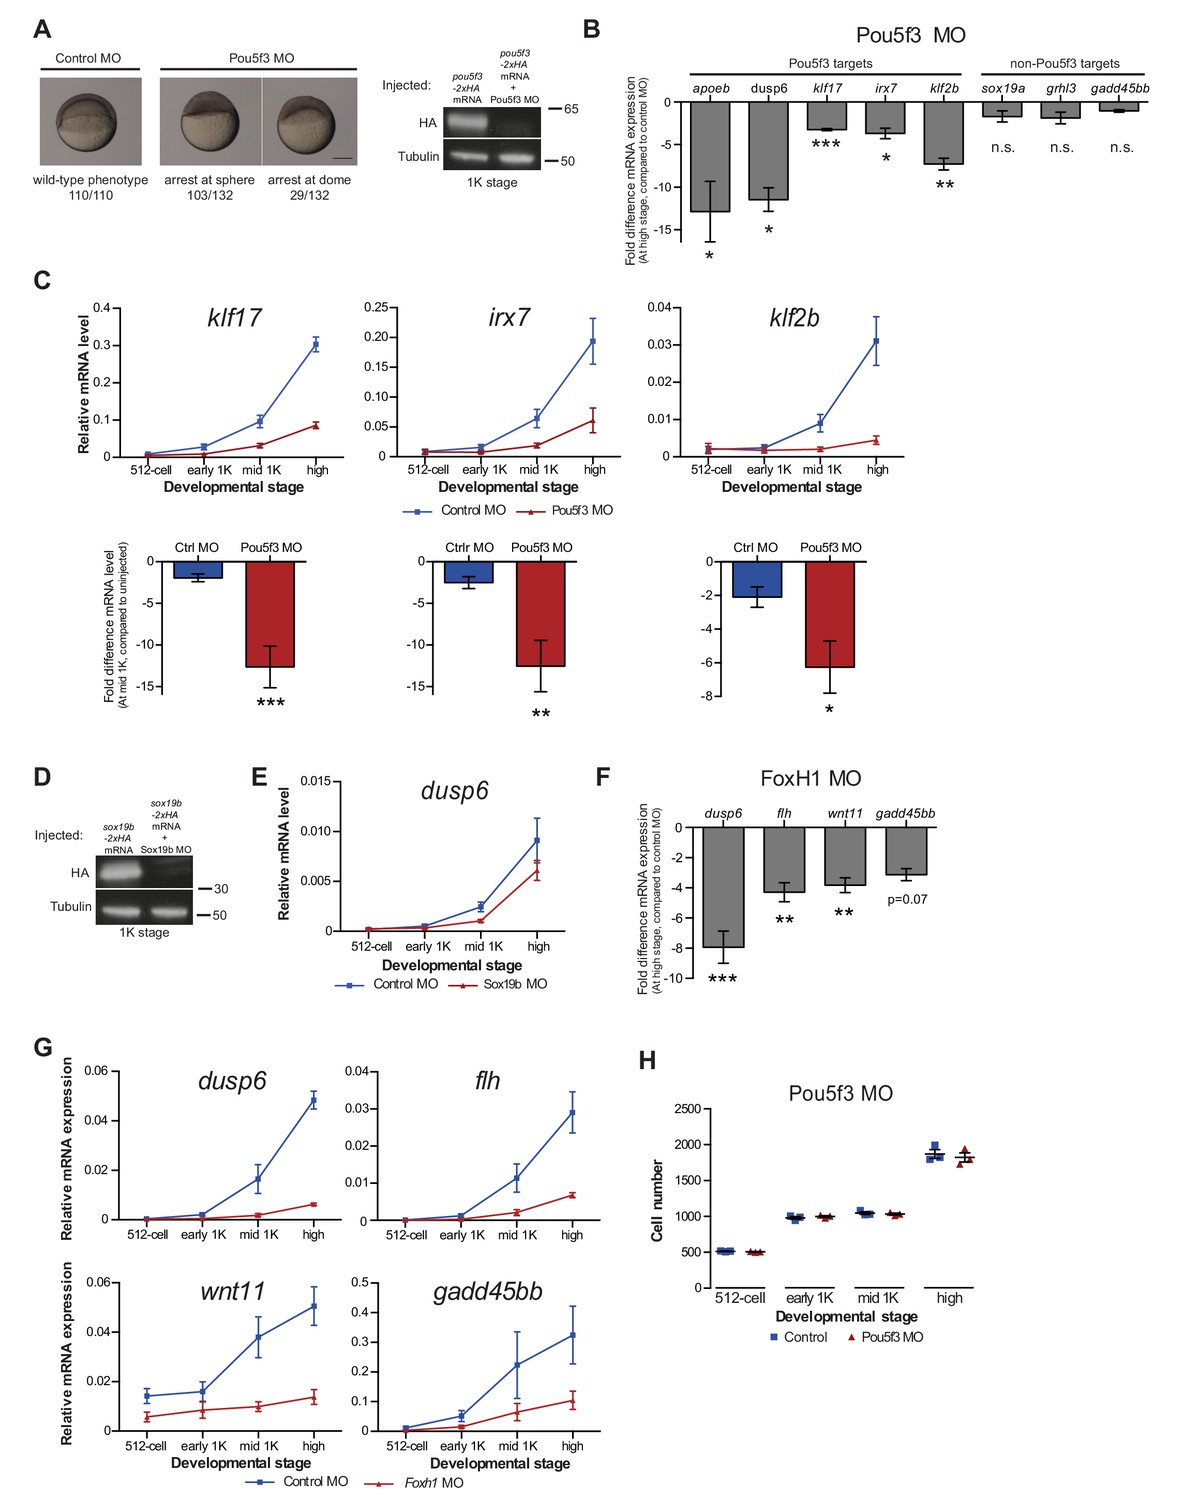
Reducing transcription factor levels delays the onset of transcription.
(A) Pou5f3 morpholino validation. Brightfield images of embryos that were injected with control or Pou5f3 morpholino. Embryos injected with Pou5f3 morpholino arrested at sphere or dome stage, as reported previously (Burgess et al., 2002). Scale bar, 250 μm. Western blot of embryos injected with 50 ng pou5f3-2xHA mRNA alone or in combination with 6 ng Pou5f3 moprholino. As expected, the morpholino reduces the expression of Pou5f3. (B) We injected embryos with Pou5f3 morpholino and analyzed the effect on transcription. Shown are the fold changes in relative expression levels of Pou5f3-morpholino-injected embryos compared to control morpholino-injected embryos at high stage for Pou5f3 targets apoeb, dusp6, klf17, irx7, and klf2b, and non-Pou5f3 targets sox19a, grhl3 and gadd45bb. Reduction of Pou5f3 results in decreased transcription for all Pou5f3 target genes analyzed at high stage, confirming that they are regulated by Pou5f3. Non-targets were not affected. Error bars represent SEM (n = 4). n.s. p>0.05; *p<0.05; **p<0.01; ***p<0.001 (two-tailed Student’s t-test, compared to control morpholino). (C) Expression of klf17, irx7 and klf2b was analyzed by qPCR at 512-cell, early 1K, mid 1K and high stage in control and Pou5f3 morpholino-injected embryos. Bar graphs focus on mid 1K stage. Error bars represent SEM (n ≥ 4). **p<0.01; **p<0.001 (two-tailed Student’s t-test, compared to control morpholino). (D) Western blot analysis of embryos injected with sox19b-2xHA mRNA alone and in combination with 2 ng of Sox19b morpholino validate the effect of the Sox19b morpholino. (E) Expression of dusp6 was analyzed by qPCR at 512-cell, early 1K, mid 1K and high stage in control and Sox19b morpholino-injected embryos. dusp6 was selected for analysis because it is the only gene from our selected Pou5f3-target genes that is also regulated by SoxB1 (Lee et al., 2013). Error bars represent SEM (n ≥ 4). (F) Validation of FoxH1 target genes. To verify that the genes we selected require FoxH1 for their expression, we injected embryos with FoxH1 morpholino and analyzed the effect on transcription. Shown are the fold changes in relative expression levels of FoxH1 morpholino-injected embryos compared to control morpholino-injected embryos at high stage for FoxH1 targets dusp6, flh, wnt11 and gadd45bb. Reduction of FoxH1 results in decreased transcription for all FoxH1 target genes. (G) Expression of dusp6, flh, wnt11 and gadd45bb was analyzed by qPCR at 512-cell, early 1K, mid 1K and high stage in control and FoxH1 morpholino-injected embryos. All four target genes show a delay in the time when they are first transcribed in the FoxH1 morphants compared to control morpholino-injected embryos. Error bars represent SEM (n ≥ 4). (H) Staging by morphology was verified by cell counting at the stages used for the Pou5f3 morpholino analysis. Each data point represents a single embryo. Error bars represent SEM. Gene expression is normalized to the expression of eif4g2α.
Figure 5—figure supplement 2
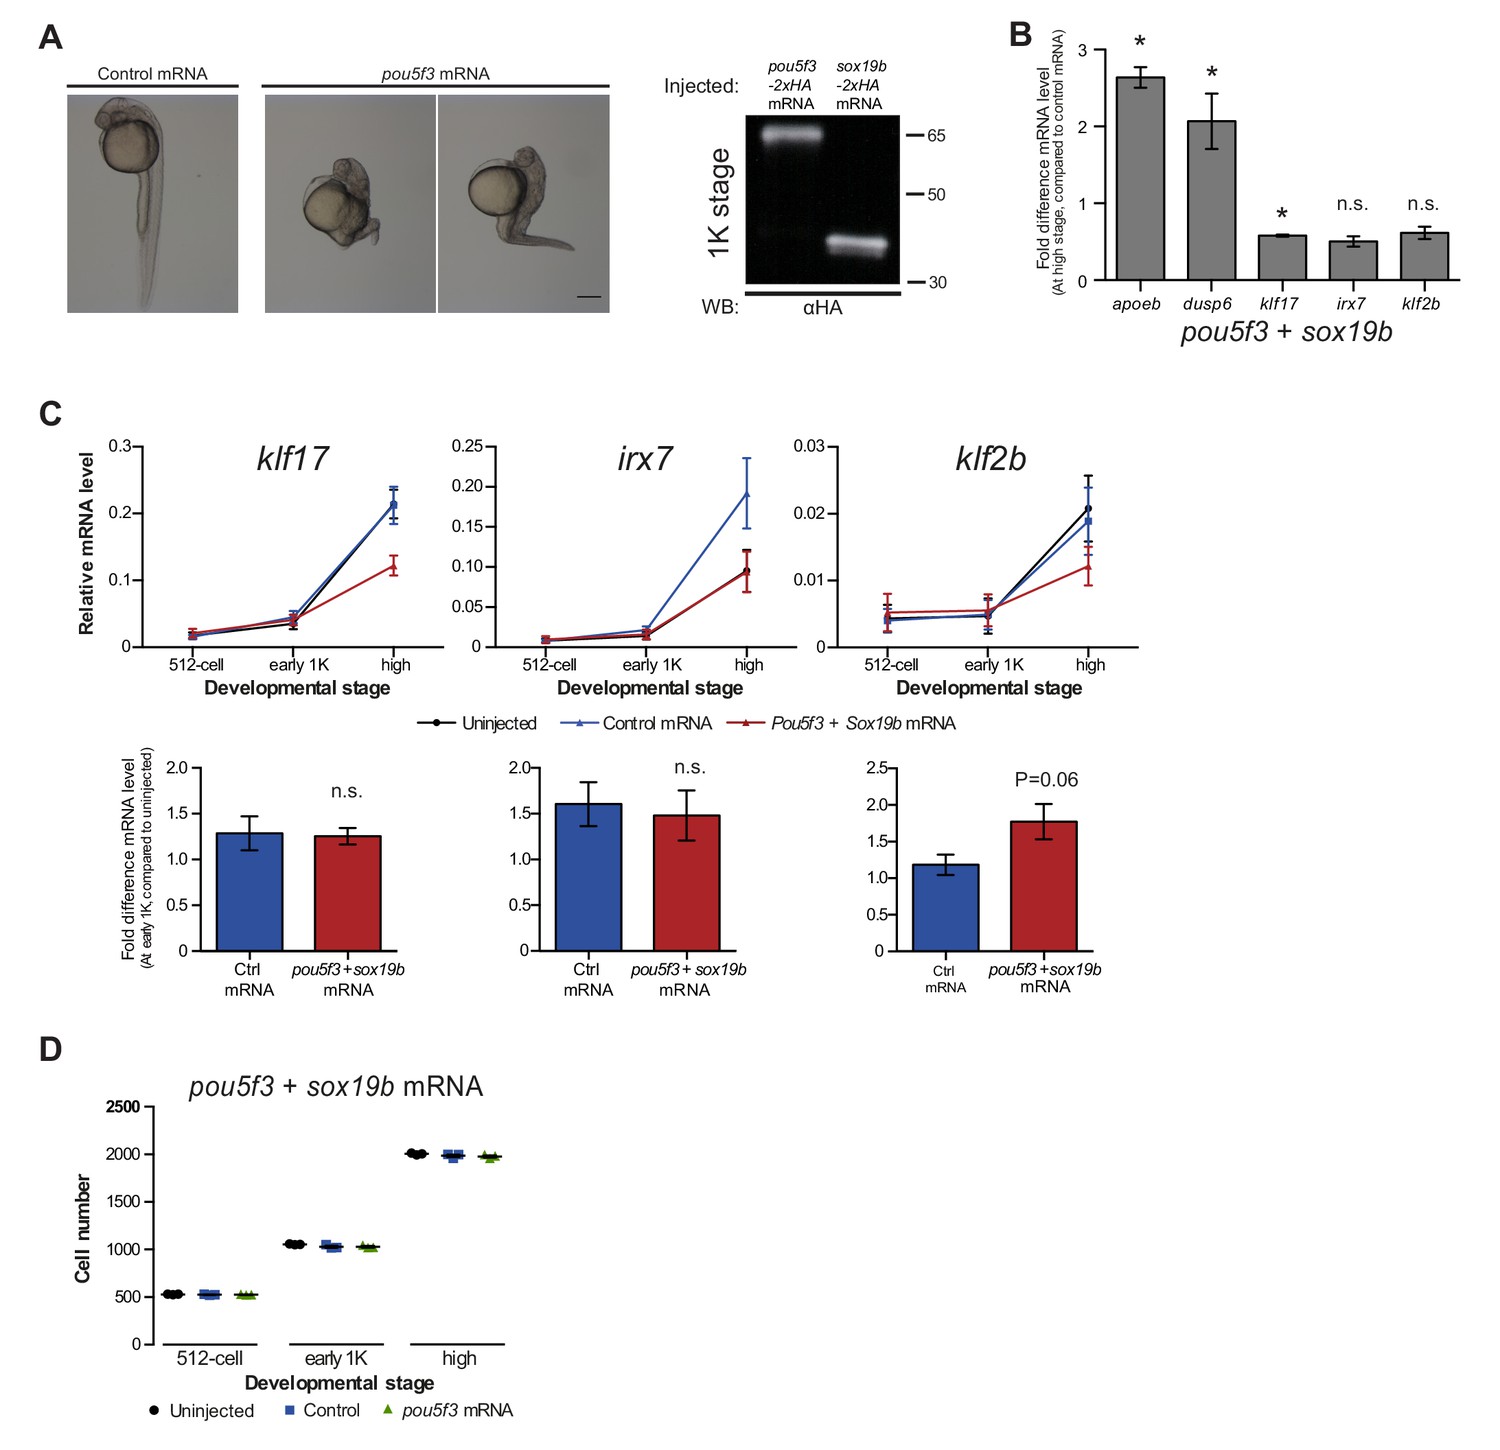
Increasing transcription factor levels causes premature transcription.
(A) Pou5f3 overexpression validation. Brightfield images of embryos that were injected with control or pou5f3 mRNA. Developmental defects at 24 hpf resembled the ventralized phenotypes described upon pou5f3-VP16 overexpression (Belting et al., 2011). Scale bar, 250 μm. Western blot using an HA antibody shows the protein level of Pou5f3-2xHA and Sox19b-2xHA in embryos at 1K stage after injection at the 1 cell stage. Blot shown is a representative example (n = 2). (B) To test whether Pou5f3 and Sox19b are sufficient to drive expression of the genes we selected, we increased the level of both transcription factors and analyzed the effect on transcription. Shown are the expression levels of apoeb, dusp6, klf17, irx7, and klf2b at high stage for embryos injected with pou5f3 + sox19b mRNA relative to control mRNA-injected. Error bars represent SEM (n ≥ 4). Increasing the levels of Pou5f3 and Sox19b only increased the relative expression level of apoeb and dusp6, suggesting that Pou5f3 and Sox19b are not sufficient to drive expression of the other genes. Error bars represent SEM (n ≥ 4). n.s p>0.05; *p<0.05 (two-tailed Student’s t-test, compared to control mRNA). (C) Expression of klf17, irx7 and klf2b and was analyzed by qPCR at 512-cell, early 1K, and high stage in uninjected, control and pou5f3 + sox19b mRNA-injected embryos. Bar graphs focus on the early 1K stage. Error bars represent SEM (n ≥ 4). n.s p>0.05 (two-tailed Student’s t-test, compared to control mRNA). (D) Staging by morphology was verified by cell counting at the stages used for the analysis. Each data point represents a single embryo. Error bars represent SEM. In B and C, expression is normalized to the expression of eif4g2α.
Figure 6 with 1 supplement
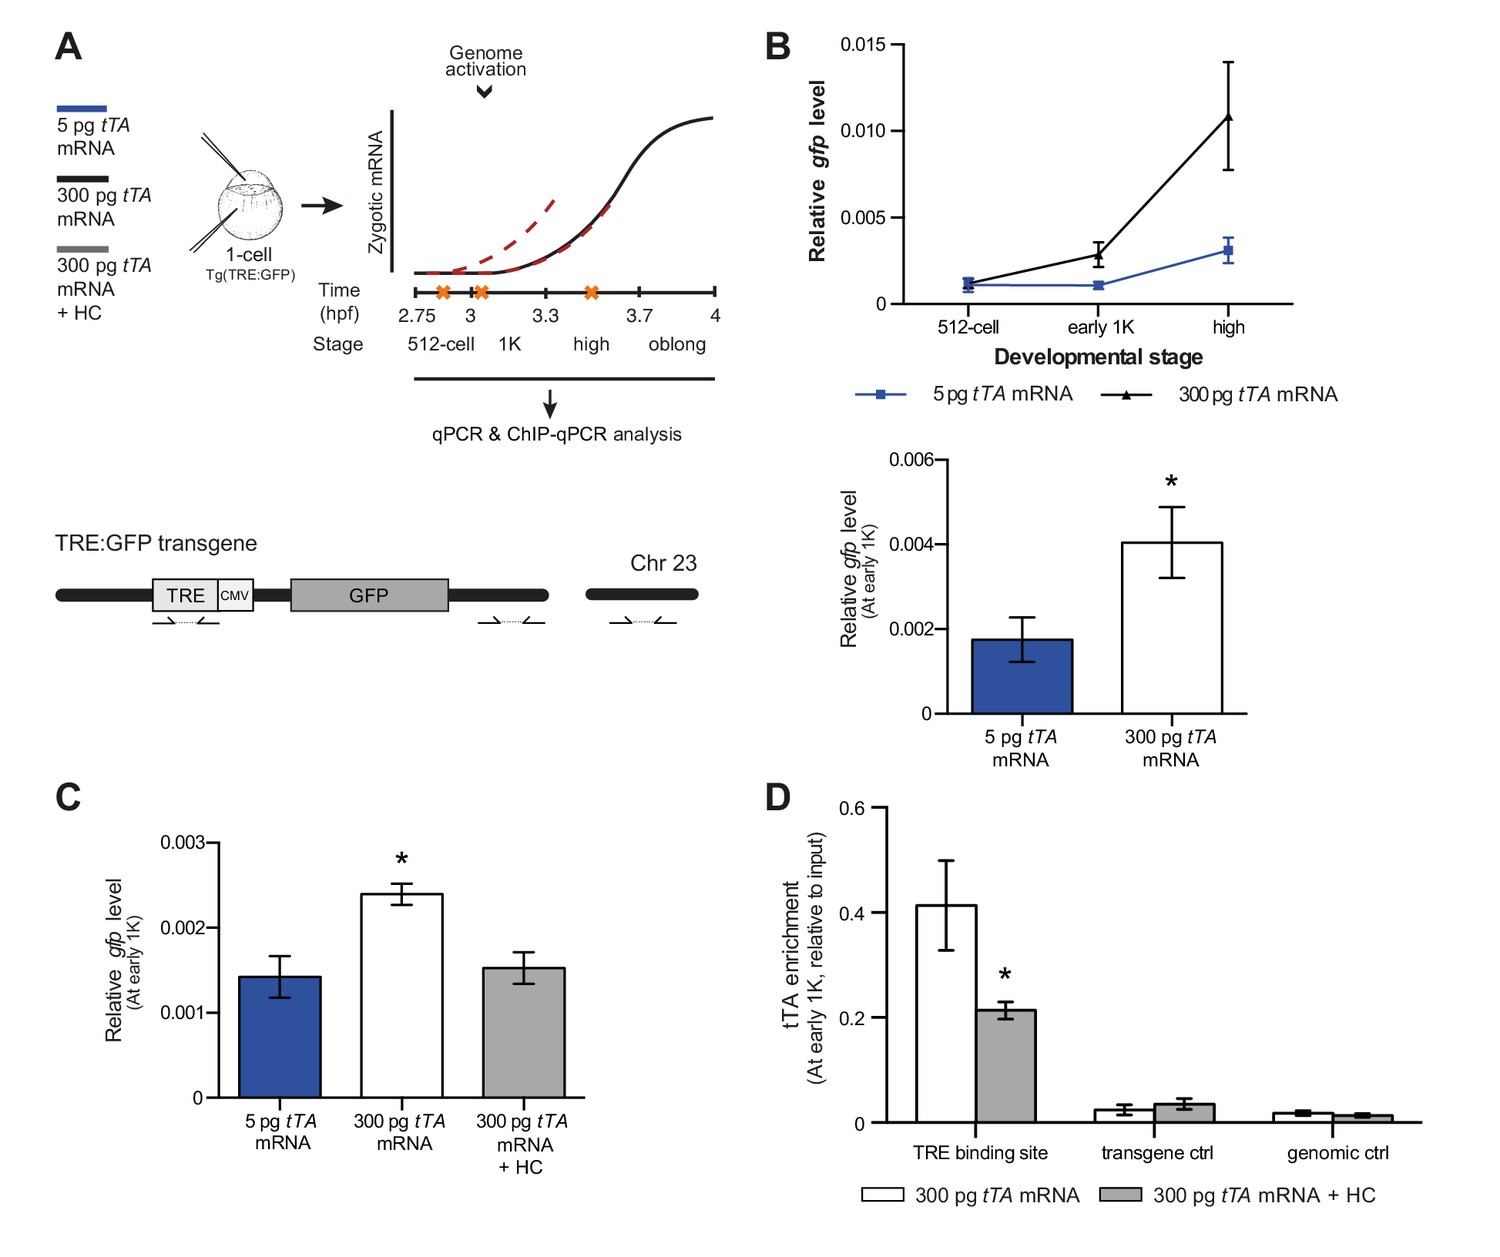
Direct experimental evidence for the competition model using a heterologous transgene.
(A) Schematic representation of the experimental procedure and TRE:GFP transgene. tTA-VP16 and/or histone levels were increased by injecting mRNA or HC into the cell or yolk, respectively, of 1-cell transgenic embryos. The TRE element contains seven binding sites for tTA-VP16 and is joined to a CMV promoter. qPCR and ChIP-qPCR analysis was carried out at stages around genome activation. Orange crosses represent the timing of stages used for the analysis. (B) Expression of gfp was analyzed by qPCR at 512-cell, early 1K and high stage in embryos injected with 5 or 300 pg tTA-VP16 mRNA. Bar graphs focus on the early 1K stage. Error bars represent SEM (n ≥ 4). *p<0.05 (two-tailed Student’s t-test, compared to 5 pg tTA-VP16 mRNA). (C) Expression of gfp was analyzed by qPCR at early 1K stage in embryos injected with 5 pg, 300 pg tTA-VP16 mRNA and 300 pg tTA-VP16 mRNA plus histone cocktail. Error bars represent SEM (n = 4). *p<0.05 (Ordinary one-way ANOVA). (D) Binding of tTA-VP16 to the TRE element and control regions was analyzed by ChIP-qPCR at the early 1K stage in embryos injected with 300 pg tTA-VP16 mRNA or 300 pg tTA-VP16 mRNA plus histone cocktail. Enrichment of pulled-down fragments was normalized to input. Primer sets used for ChIP-qPCR analysis are indicated by arrows in panel A. A control region on the transgene was used in addition to a genome control region on chromosome 23. Error bars represent SEM (n = 3). *p<0.05 (two-tailed Student’s t-test ratio paired, compared to 300 pg tTA-VP16 mRNA-injected embryos). In B and C, mRNA levels are normalized to the expression of eif4g2α.
Figure 6—figure supplement 1
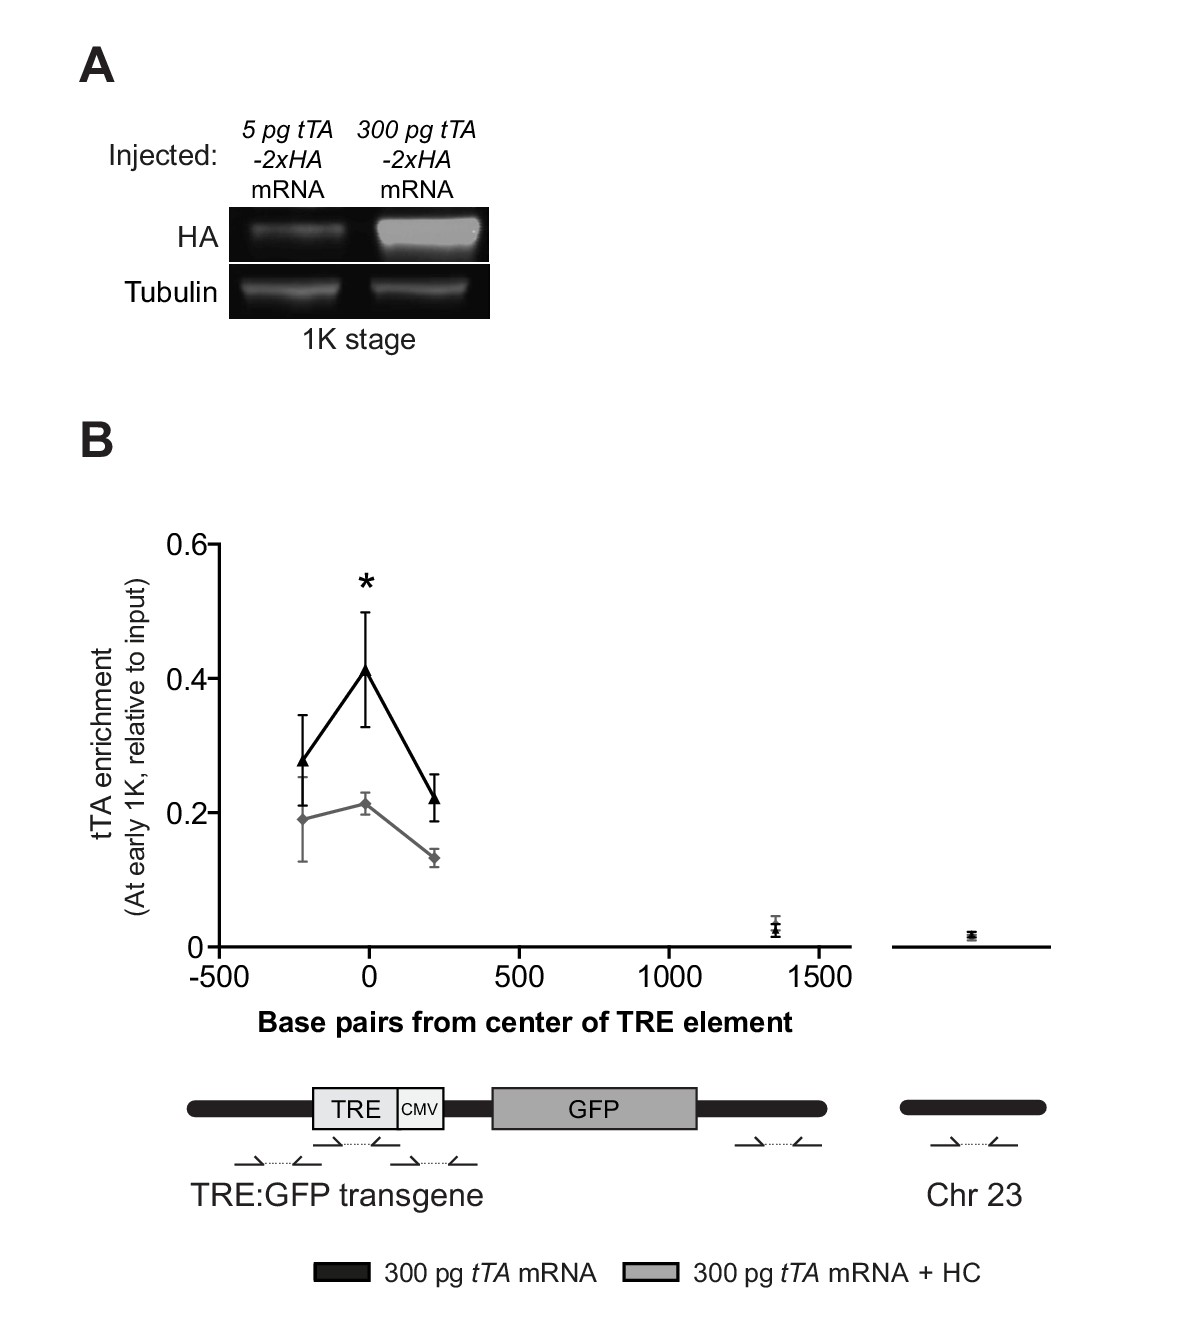
Direct experimental evidence for the competition model using a heterologous transgene.
(A) Western blot using an HA antibody shows the protein level at 1K stage after injection of either 5 pg or 300 pg tTA-VP16 mRNA. Tubulin was used to control for equal loading. Blot shown is a representative example (n = 2). (B) Binding of tTA-VP16 to the TRE element was analyzed by ChIP-qPCR at the early 1K stage in embryos injected with 300 pg tTA-VP16 or 300 pg tTA-VP16 mRNA plus histone cocktail. Enrichment of pulled-down fragments was normalized to input. All primers used for ChIP-qPCR are indicated using arrows. Error bars represent SEM (n = 3). *p<0.05 (two-tailed Student’s t-test ratio paired, compared to 300 pg tTA-VP16 mRNA plus histone cocktail).
Tables
Table 1
List of morpholinos used.
| Morpholinos | |||
|---|---|---|---|
| Target | Sequence | Company | Reference |
| p53 | 5’-GCGCCATTGCTTTGCAAGAATTG | GeneTools | Langheinrich et al. (2002) |
| Pou5f3 | 5′-CGCTCTCTCCGTCATCTTTCCGCTA | GeneTools | Burgess et al. (2002) |
| Sox19b | 5'-ACGAGCGAGCCTAATCAGGTCAAAC | GeneTools | Okuda et al. (2010) |
| Foxh1 | 5'-TGCTTTGTCATGCTGATGTAGTGGG | GeneTools | Pei et al. (2007) |
| Dead-end | 5'-GCTGGGCATCCATGTCTCCGACCAT | GeneTools | Weidinger et al. (2003) |
| Ctrl MO | 5'-CCTCTTACCTCAGTTACAATTTATA | GeneTools | GeneTools, LLC |
Table 2
List of primers used. Location of primer sets with respect to transcription start-sites are indicated in brackets.
| Primer list | |
|---|---|
| Gene | Primers |
| eif4g2α | 5’-GAGATGTATGCCACTGATGAT |
| 5’-GCGCAGTAACATTCCTTTAG | |
| mxtx2 | 5’-ACTGACTGCATTGCTCAA |
| 5’-ACCATACCTGAATACGTGATT | |
| fam212aa | 5’-GCAAATGAGTATCTAAAACTGCT |
| 5’-CATCATATAGCGCATCTGGT | |
| nnr | 5’-GAGACATACCACAGGTGAAGC |
| 5’-CCGCTCTGGTCTGTTGC | |
| vox | 5’-TTATTCGTCGGGTTATGAGAG |
| 5’-AACCAAGTTCTGATCTGTGT | |
| sox19a | 5’-GAGGATGGACAGCTACGG |
| 5’-CTATAGGACATGGGGTTGTAG | |
| grhl3 | 5’-AGACGAGCAGAGAGTCCT |
| 5’-TTGCTGTAATGCTCGATGATG | |
| apoeb | 5’-GCAGAGAGCTTGACACACTAA |
| 5’-TGCATTCTGCTCCATCATGG | |
| dusp6 | 5'-AGCCATCAGCTTTATTGATGAG |
| 5'-CAAAGTCCAAGAGTTGACCC | |
| klf17 | 5’-ATAGTTCGGGACTGGAAAGTTG |
| 5’- TGAGGTGTTGTCGTTGTCAG | |
| irx7 | 5’-TGGCACACATTAGCAATTCC |
| 5’-GCATGATCTTCTCGCCTTTG | |
| klf2b | 5’-GCTCTGGGAGGATAGATGGA |
| 5’-CTCGGAGTGGGAGATGAAC | |
| flh | 5'-CACTGAAGCTCAGGTTAAAGTC |
| 5'-ACAATCTGGGGAAAATCATGG | |
| wnt11 | 5'-CAGACAGGTGCTTATGGACT |
| 5'-CATCTCTCGGGGCACAAG | |
| gadd45bb | 5'-CAACTCATGAATGTGGATCCAG |
| 5'-ATGCAGTGAAGGTCTCTTGG | |
| GFP | 5’-GCACCATCTTCTTCAAGGAC |
| 5’-TTGTCGGCCATGATATAGAC | |
| Pou5f3 binding site (−2270 apoeb) | 5'-TAAAGTGAGCAAATGTATGGCC |
| 5'-TTTGTTGATTAAATCGCTTGTGA | |
| Pou5f3 binding site (−3095 dusp6) | 5'-CATATGTTAAGCGGGGTGAAAC |
| 5'-ATCCTGTCTCCTGTGTCATTTG | |
| TRE binding site (−222) | 5'-TCTTGATAGAGAGGCTGCAAAT |
| 5'-TCGAGATGGGCCCTTGATA | |
| TRE binding site (13) | 5'-TCGTATAGGGATAACAGGGTAATG |
| 5'-TACACGCCTACCTCGACC | |
| TRE binding site (217) | 5'-GTACGGTGGGAGGCCTATAT |
| 5'-CTTCTATGGAGGTCAAAACAGC | |
| Transgene control | 5'-CTCTACAAATGTGGTATGGCTG |
| 5'-ATTACCCTGTTATCCCTAAGGC | |
| Genomic control | 5'-CCATCATATTCACATCTTGCAAG |
| 5'-GTTCGTATGAACCGGAAGC | |
Table 3
List of primary antibodies used.
| Primary antibodies | ||||||
|---|---|---|---|---|---|---|
| Target/Name | Company | Company code | RRID | [WB] | [IF] | [IP] |
| H3 | Abcam | ab1791 | AB_302613 | 1:10,000 | ||
| H4 | Abcam | ab10158 | AB_296888 | 1:1000 | 1:300 | |
| H2A | Abcam | ab18255 | AB_470265 | 1:1000 | ||
| H2B | Abcam | ab1790 | AB_302612 | 1:3000 | ||
| α-tubulin | Sigma | T6074 | AB_477582 | 1:20,000 | ||
| RFP | Abcam | ab152123 | AB_2637080 | Excess | ||
| PTX3 | Cosmo Bio | PPZ1724 | AB_1962280 | 1:15,000 | ||
| RNA Pol II | BioLegend | MMS-126R | AB_10013665 | 1:1000 | ||
| HA | Abcam | ab9110 | AB_307019 | 1:5000 | Excess | |
| IgG from rabbit serum | Sigma | I5006 | AB_1163659 | Excess | ||
-
WB, Western blotting; IF, immunofluorescence; IP, immunoprecipitation.
Table 4
List of secondary antibodies used.
| Secondary antibodies | |||||
|---|---|---|---|---|---|
| Name | Company | Company code | RRID | [WB] | [IF] |
| Alexa 488 goat anti-mouse IgG H&L | ThermoFisher | A-11029 | AB_138404 | 1:1000 | |
| Alexa 594 goat anti-rabbit IgG H&L | ThermoFisher | A-11037 | AB_2534095 | 1:500 | |
| IRDye 800CW donkey anti-rabbit IgG H&L | LI-COR | P/N 926–32213 | AB_621848 | 1:20,000 | |
| IRDye 800CW donkey anti-mouse IgG H&L | LI-COR | P/N 926–32212 | AB_621847 | 1:20,000 | |
| Peroxidase AffiniPure goat anti-rabbit IgG H&L | Jackson ImmunoResearch | 111-035-144 | AB_2307391 | 1:20,000 | |
| Peroxidase AffiniPure rabbit anti-mouse IgG H&L | Jackson ImmunoResearch | 315-035-003 | AB_2340061 | 1:20,000 | |
-
WB, Western blotting; IF, immunofluorescence.
Download links
A two-part list of links to download the article, or parts of the article, in various formats.
Downloads (link to download the article as PDF)
Open citations (links to open the citations from this article in various online reference manager services)
Cite this article (links to download the citations from this article in formats compatible with various reference manager tools)
Competition between histone and transcription factor binding regulates the onset of transcription in zebrafish embryos
eLife 6:e23326.
https://doi.org/10.7554/eLife.23326


