Variability of cholesterol accessibility in human red blood cells measured using a bacterial cholesterol-binding toxin
- Howard Hughes Medical Institute, University of Texas Southwestern Medical Center, United States
- University of Texas Southwestern Medical Center, United States
Figures
Figure 1
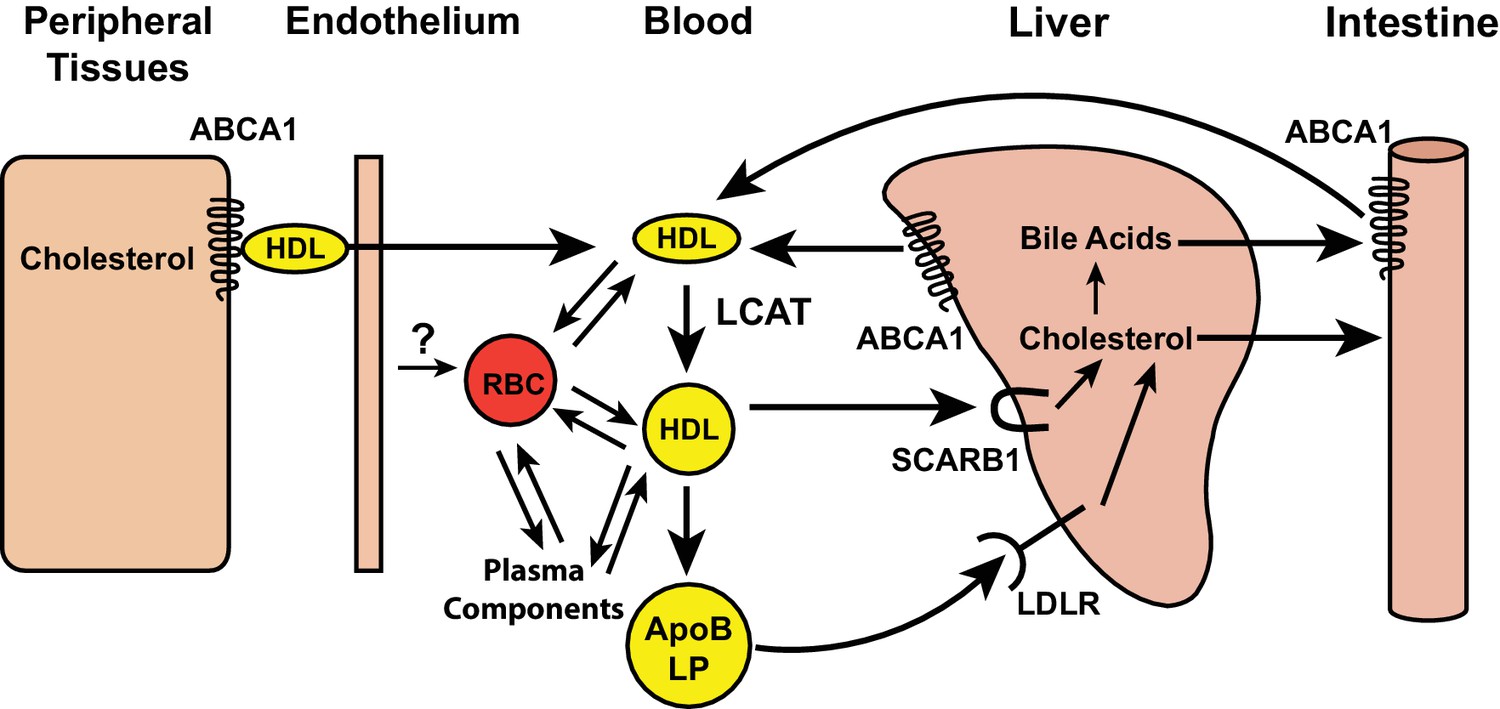
Schematic of reverse cholesterol transport in the blood.
Free cholesterol in peripheral tissues is effluxed by ABCA1 transporters to high-density lipoprotein (HDL), and transported into the vascular space. Lecithin cholesterol acyl transferase (LCAT), present on HDL, esterifies free cholesterol. The cholesterol esters formed by the LCAT reaction are either taken up by SCARB1 receptors on hepatocytes or transferred to apolipoprotein B containing lipoproteins (ApoB LP) and taken up into hepatocytes by the low density lipoprotein receptor (LDLR). Red blood cells (RBCs) may also participate in reverse cholesterol transport by accepting cholesterol from vascular endothelial cells and participating in a cholesterol exchange with lipoproteins and plasma components, such as albumin.
Figure 2
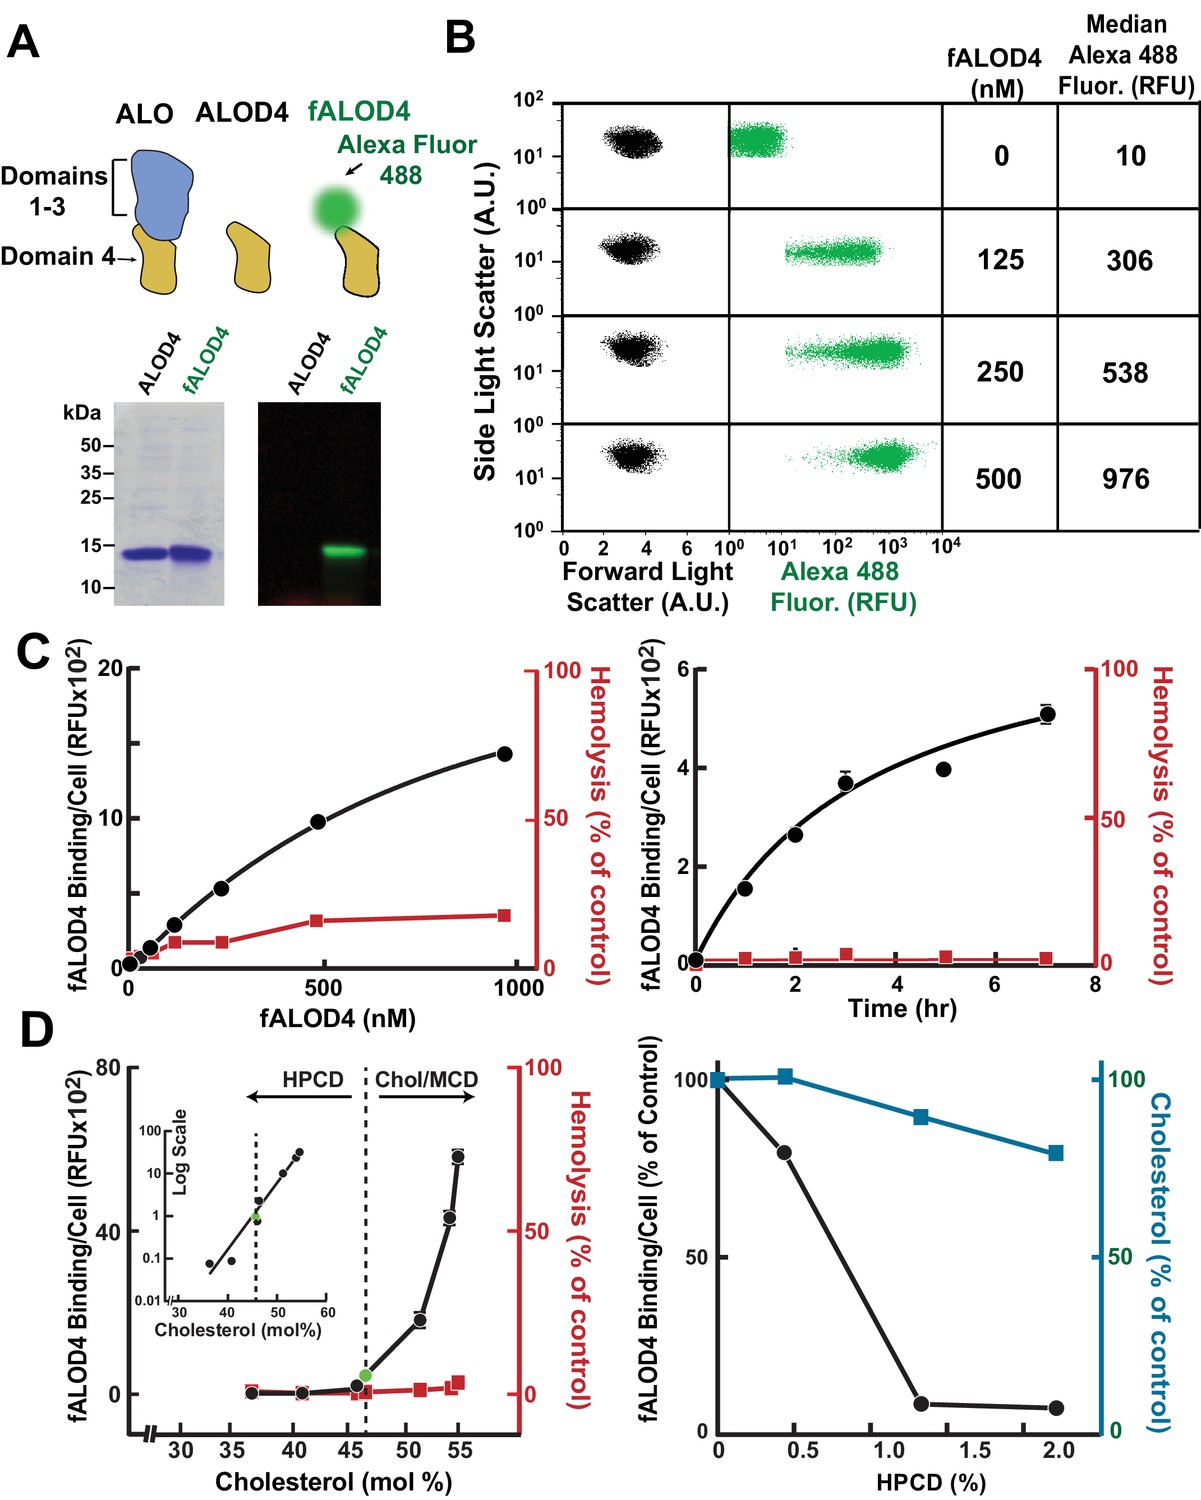
Assay for red blood cell (RBC) cholesterol accessibility.
(A) Schematic of anthrolysin O (ALO) domains. Domain 4 (ALOD4) binds cholesterol but does not oligomerize or form membrane-lysing pores. In fALOD4, Alexa Fluor 488 dye is covalently attached to an engineered cysteine near the NH2-terminus of domain 4. Purified proteins (5 µg) were subjected to SDS-PAGE (15%) and visualized by Coomassie staining (left) or fluorescence scanning (LI-COR) at 600 nm (right). (B) Flow cytometry analysis of fALOD4 binding to RBCs. RBCs (2.5 × 10⁵ RBCs in 500 μl buffer D) were incubated for 3 hr at 4°C with fALOD4 at the indicated concentrations. Fluorescence was measured by a FACSCalibur flow cytometer as described in the Materials and methods. Forward light scatter (FSC), side light scatter (SSC), and Alexa 488 fluorescence measurements for 10,000 RBCs were acquired on the flow cytometer. Median Alexa 488 fluorescence per cell was calculated using FlowJo software. AU, arbitrary units; RFU, relative fluorescence units. (C) Dose response (left) and time course (right) of fALOD4 binding to RBCs. Each reaction was set up as described above using either the indicated concentrations of fALOD4 (right) or 250 nM fALOD4 (left). After incubation at 4°C for 3 hr (left) or for the indicated times (right), fALOD4 RBC binding was measured by flow cytometry. Hemolysis during fALOD4 binding reactions was determined by measuring the release of hemoglobin as described in the Materials and methods. 100% hemolysis is defined as the amount of hemoglobin released after treatment of RBCs with 1% (w/v) Triton X-100. Data points represent means of three independent measurements of the same sample (technical replicates). Error bars, which are often not visible due to the small variation, represent the SEM. The experiment was repeated three times and the results were similar. (D) Effect of RBC cholesterol modulation on RBC fALOD4 binding. (Left) RBCs were not treated (green circle) or treated with either hydroxypropyl-β-cyclodextrin (HPCD) or cholesterol/methyl-β-cyclodextrin (MCD) to reduce or increase the cholesterol content of RBCs. The fALOD4 binding assay was performed as described in the Materials and methods using 250 nM of fALOD4. Lipids were extracted from ghost membranes isolated from the RBCs, and the molar percentage of cholesterol was measured as described in the Materials and methods. The dashed line indicates the cholesterol content of untreated RBCs. Hemolysis was measured as described in the Materials and methods. Inset: Data for the experiment plotted on a logarithmic-linear scale. (Right) RBCs were treated with HPCD to remove cholesterol and both fALOD4 binding and cholesterol content were measured as described in the Materials and methods. The fALOD4 binding per cell and cholesterol content (mole %) in untreated RBCs was set to 100%. Data points represent the mean of three independent measurements of fALOD4 binding and a single measurement of RBC cholesterol content. Error bars represent the SEM. RFU, relative fluorescence units. The experiments were repeated three times and the results were similar.
Figure 3
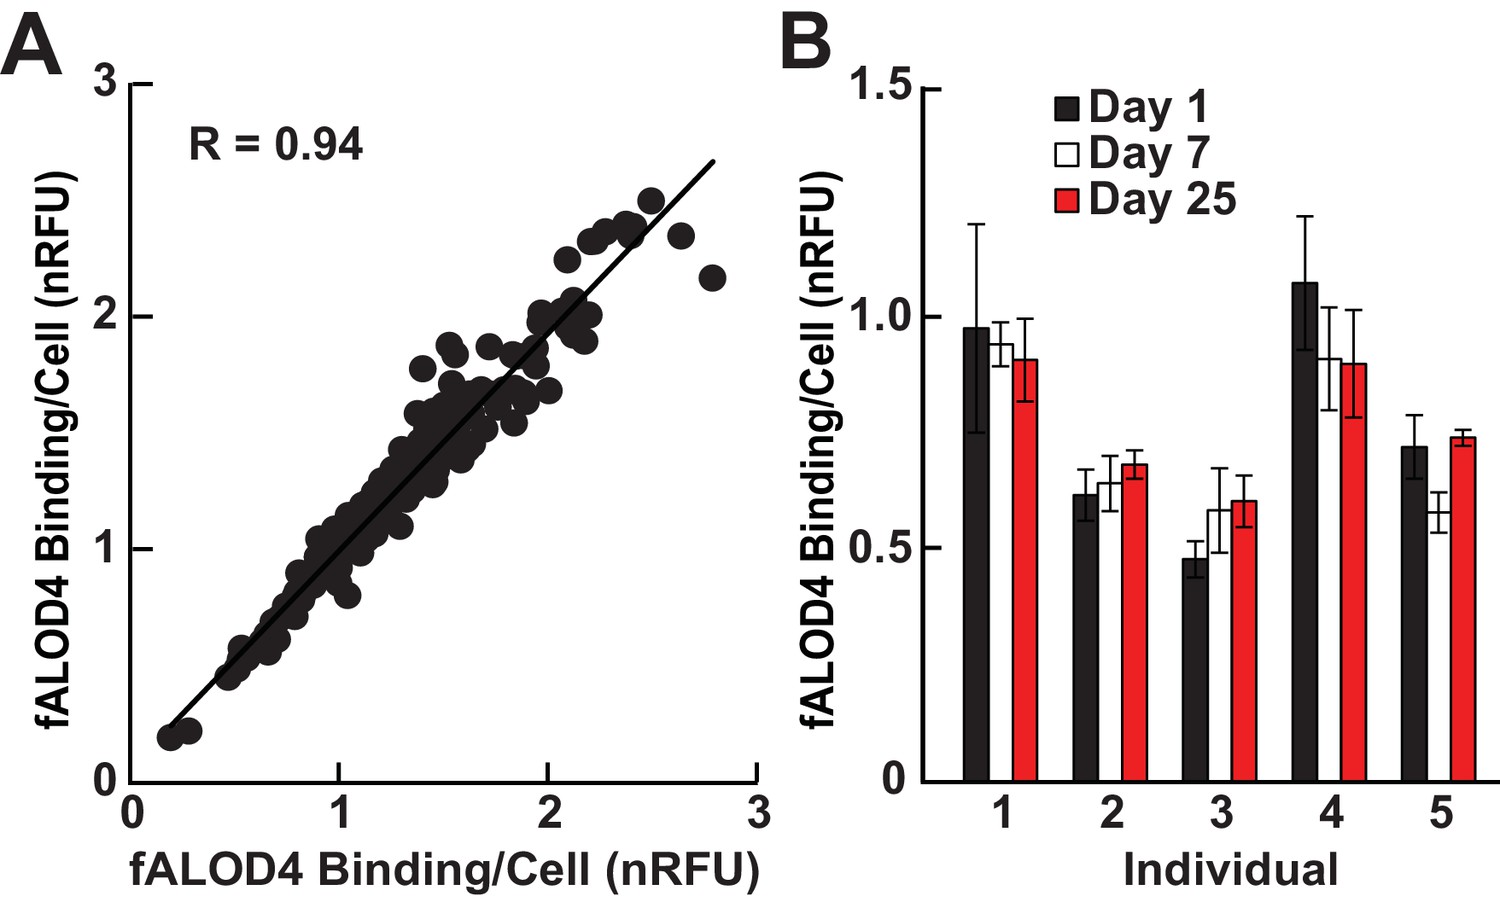
Characterization of RBC cholesterol accessibility assay.
(A) Intra-assay correlation was determined by measuring fALOD4 binding to two aliquots of RBCs from 164 unrelated healthy individuals as described in the Materials and methods. The levels of fALOD4 binding were normalized to a reference sample of RBCs from a healthy individual that was included in all the assays. Data points represent the mean of three independent measurements from each of the RBC aliquots. (B) Intra-individual variability of fALOD4 binding to RBCs from five individuals. Blood samples from five unrelated individuals were collected on three separate days over a month and fALOD4 binding was measured. fALOD4 binding values in A and B were normalized to the binding values obtained from the reference blood sample. The reference blood sample was collected from the same healthy volunteer prior to each experiment in this study and the sample was processed and assayed concurrently. Error bars represent the mean ± SEM of three measurements from each blood sample.
Figure 4

Distribution of fALOD4 binding to RBCs in individuals with low, medium and high binding.
(A) Flow cytometry analysis of fALOD4 binding to RBCs from three individuals with low (top), medium (middle) and high (bottom) fALOD4 binding. Forward light scatter, side light scatter, and Alexa 488 fluorescence measurements of 10,000 RBCs were acquired using a FACSCalibur flow cytometer as described in the Materials and methods. Fluorescence data are presented as both a dot plot (middle) and histogram (right). AU, arbitrary units; RFU, relative fluorescence units. (B) Relationship between RBC number and fALOD4 binding in three individuals with low (green), medium (blue) and high (orange) binding. Samples were collected on the same day and the fALOD4 binding assay was performed as described in the legend to Figure 1. Error bars represent the mean ± SEM of three measurements from each blood sample. The experiment was repeated once and the results were similar. (C) RBC cholesterol content and fALOD4 binding to RBCs. RBC ghost membranes were prepared from RBCs of 73 healthy, unrelated individuals. Total lipids were extracted from the membranes and the molar percentage of cholesterol was measured as described in the Materials and methods. fALOD4 binding values were normalized to the binding values obtained from the reference blood sample. Shown is the Spearman correlation between fALOD4 binding, normalized to the reference blood sample, and RBC membrane total cholesterol expressed as mole % of total lipids. Data points represent the means of three independent measurements of fALOD4 binding and a single measurement of RBC cholesterol content. The experiment was repeated once and the results were similar. nRFU, normalized relative fluorescence units.
Figure 5
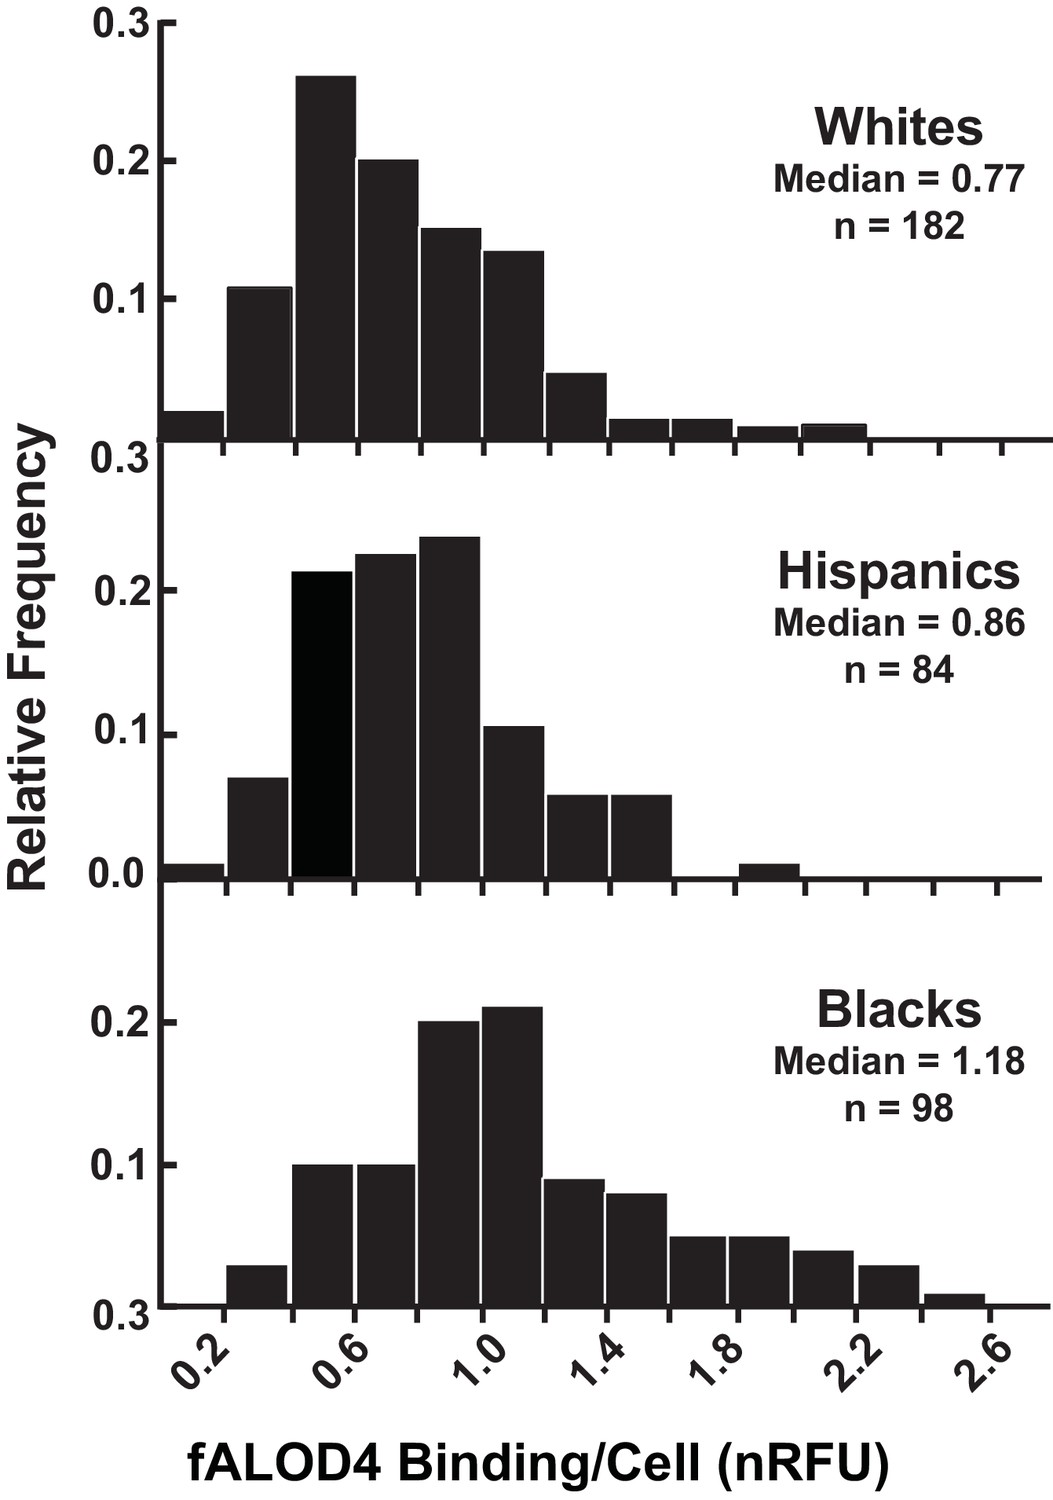
Distribution of fALOD4 binding to RBCs from 364 healthy, unrelated individuals.
Blood samples were collected from 364 individuals and RBCs were isolated as described in the Materials and methods. Each measurement was performed in triplicate. fALOD4 binding values were normalized to those of the reference blood sample. Data are plotted as frequency histograms of median fALOD4 binding. nRFU, normalized relative fluorescence units.
Figure 6

Correlation between fALOD4 binding to RBCs and RBC indices.
Hematocrit, hemoglobin, RBC count, mean corpuscular hemoglobin concentration (MCHC), mean corpuscular volume (MCV), and RBC distribution width (RDW) were measured by Quest Diagnostics. fALOD4 binding to RBCs was measured in triplicate as described in the Materials and methods and normalized to the reference blood sample. Spearman’s correlation coefficients (r) and p-values were calculated using the software package Prism 6 (two tailed T-test).
Figure 7
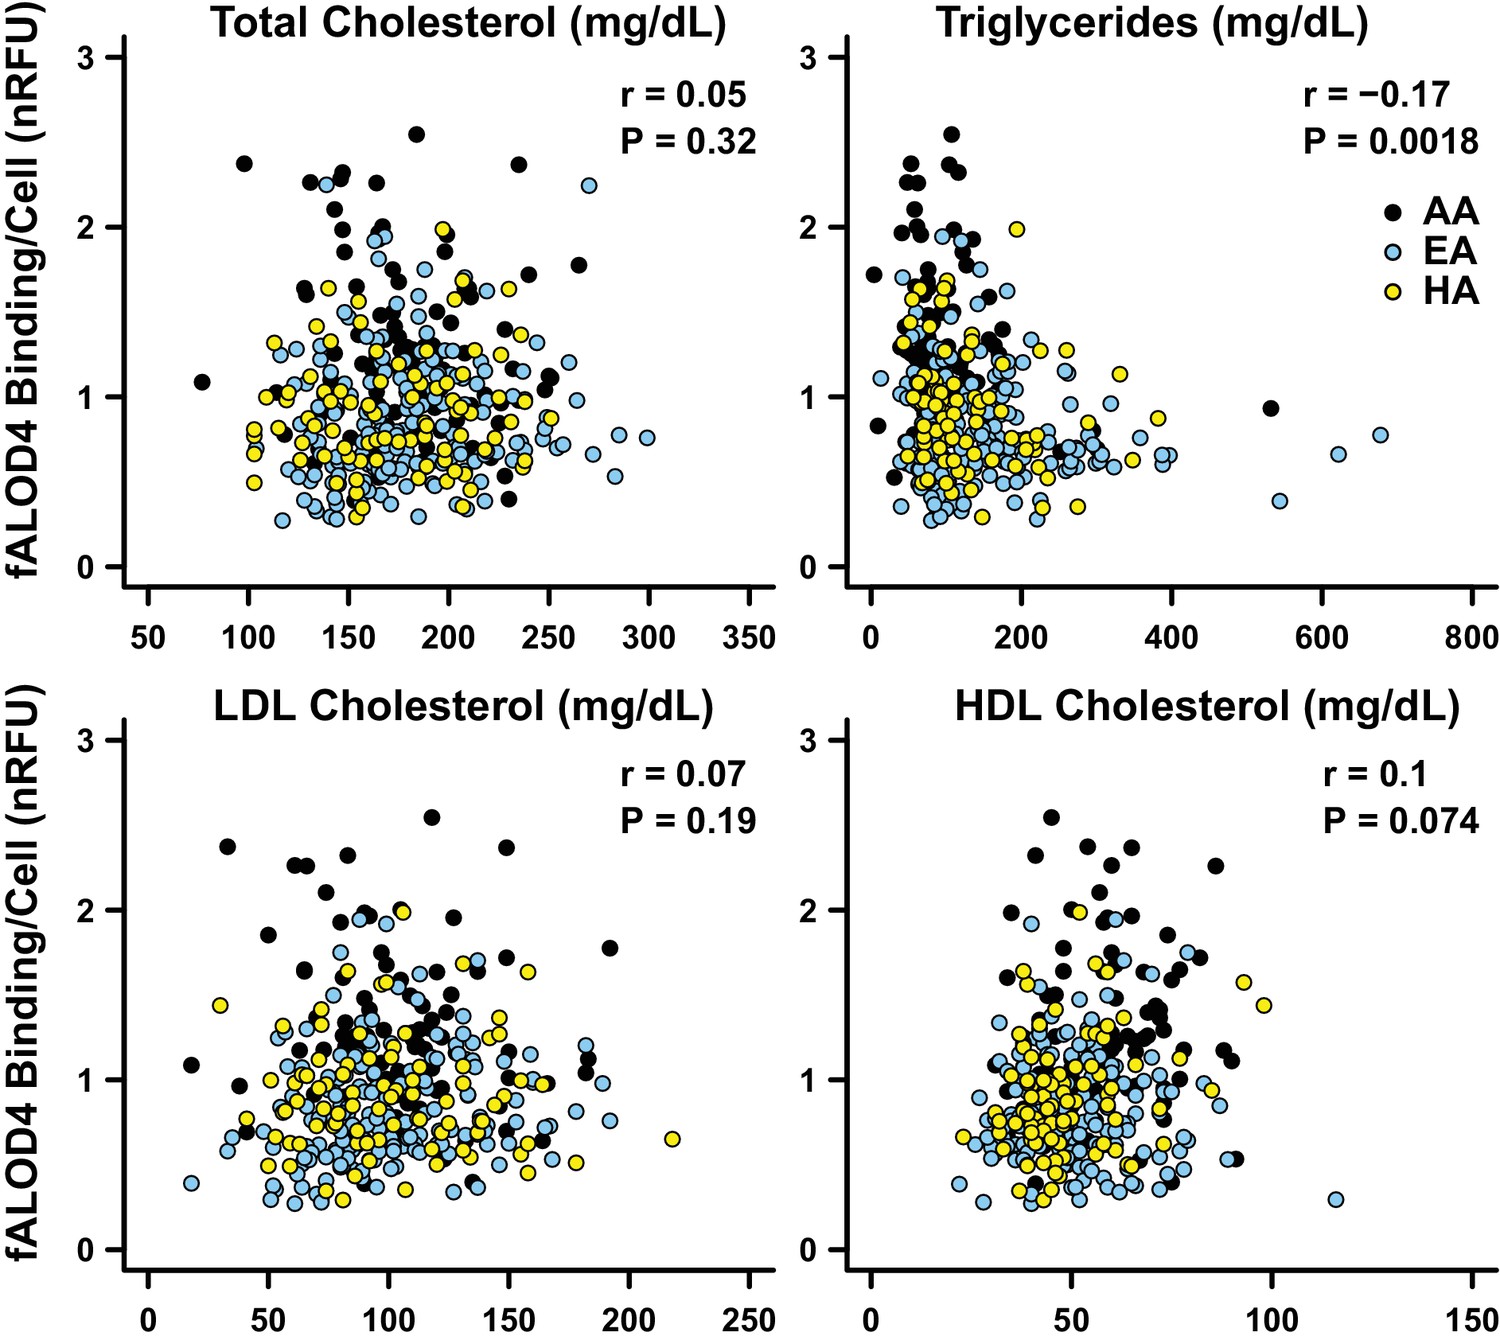
Correlations between fALOD4 binding to RBCs and serum lipids and lipoproteins.
Total cholesterol, triglycerides, LDL-C and HDL-C were measured by Quest Diagnostics. fALOD4 binding to RBCs was measured in triplicate as described in the Materials and methods and normalized to the reference blood sample. Partial correlation coefficients (r) and p-values were calculated using linear regression adjusted for age, gender, and ethnicity, using statistical analysis software R.
Figure 8
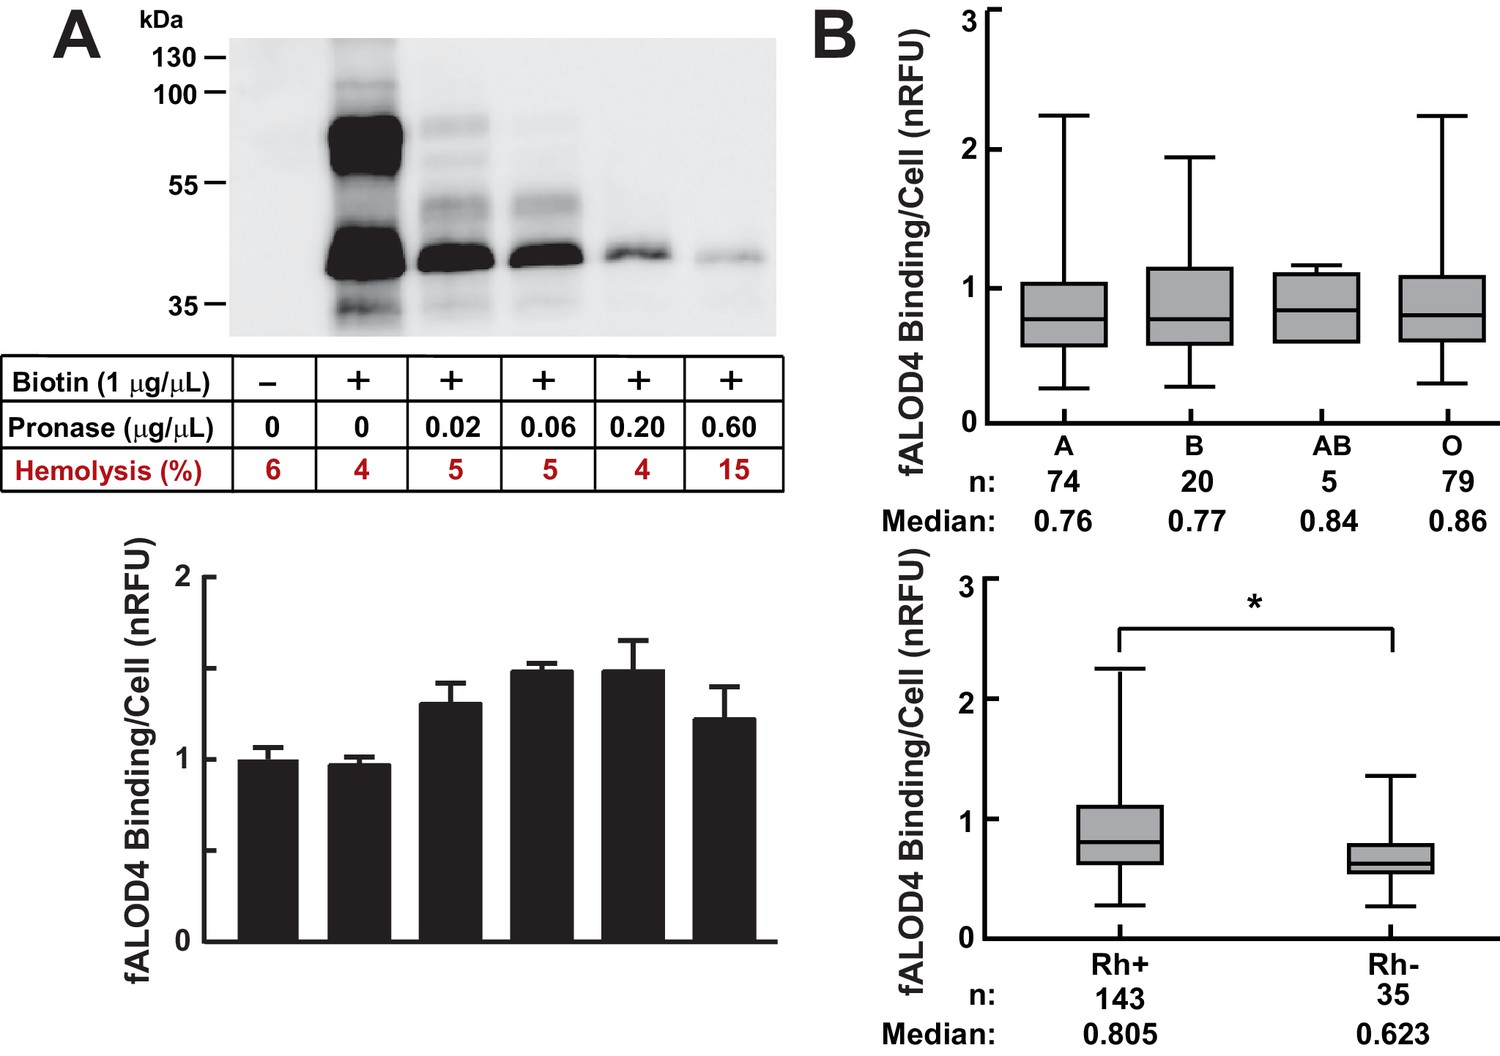
Effects of cell surface proteins on fALOD4 binding to RBCs.
(A) Effect of proteolysis of RBC surface membrane proteins on fALOD4 binding to RBCs. RBCs isolated from a healthy individual were labeled with biotin and then treated with increasing amounts of pronase as indicated. An aliquot of the treated RBCs was used for fALOD4 binding assays and the remainder was subjected to 10% SDS/PAGE and probed with streptavidin-HRP (0.22 µg/mL) as described in the Materials and methods. fALOD4 binding values were normalized to the untreated sample. Data points represent the mean of three independent measurements. Error bars represent the SEM. The experiment was repeated three times and the results were similar. (B) Relationship between fALOD4 binding and ABO blood group antigens (upper panel) and Rhesus blood group (Rh antigen) (lower panel). RBC fALOD4 binding was determined in triplicate using RBCs from 178 White blood donors as described in the Materials and methods. Each fALOD4 binding measurement was performed in triplicate and values were normalized to the reference blood sample. Boxes represent the 25th and 75th percentiles and whiskers represent the minimum and maximum measurements. *p<0.005, two-tailed t-test. nRFU, normalized relative fluorescence units.
Figure 9
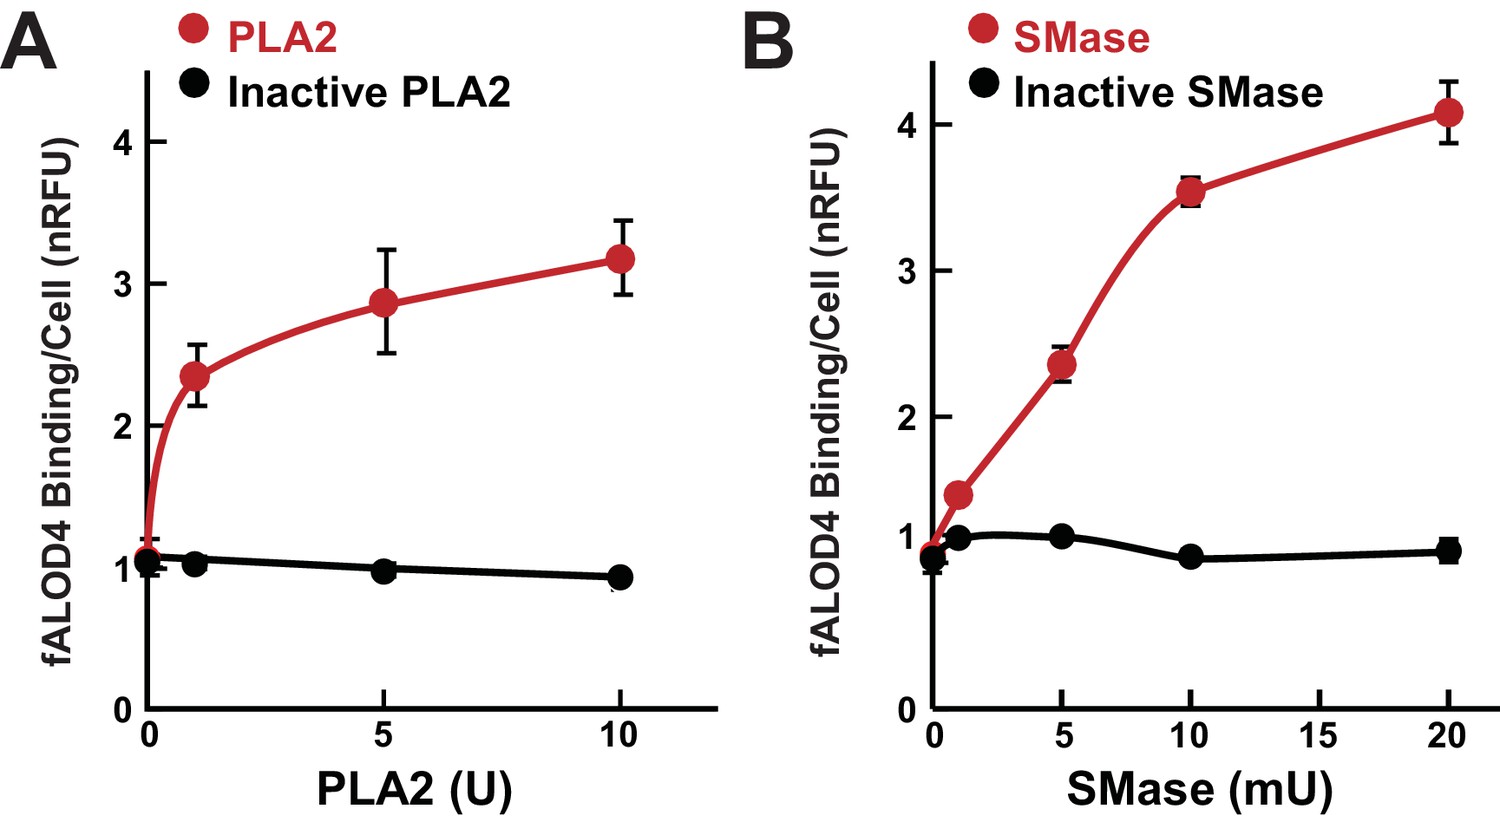
Effect of phospholipase and sphingomyelinase treatment of RBCs on fALOD4 binding.
A total of 1.6 × 10⁸ RBCs were incubated with indicated the amounts of active or inactivated phospholipase A2 (PLA2) (A) or active or inactive sphingomyelinase (SMase) (B) for 1 hr at room temperature or 37°C, respectively. Cells were washed three times in PBS and an aliquot containing 2 × 10⁵ RBCs was used to measure fALOD4 binding. Data points represent the mean of three independent measurements (±SEM). The experiment was repeated three times and the results were similar.
Figure 10
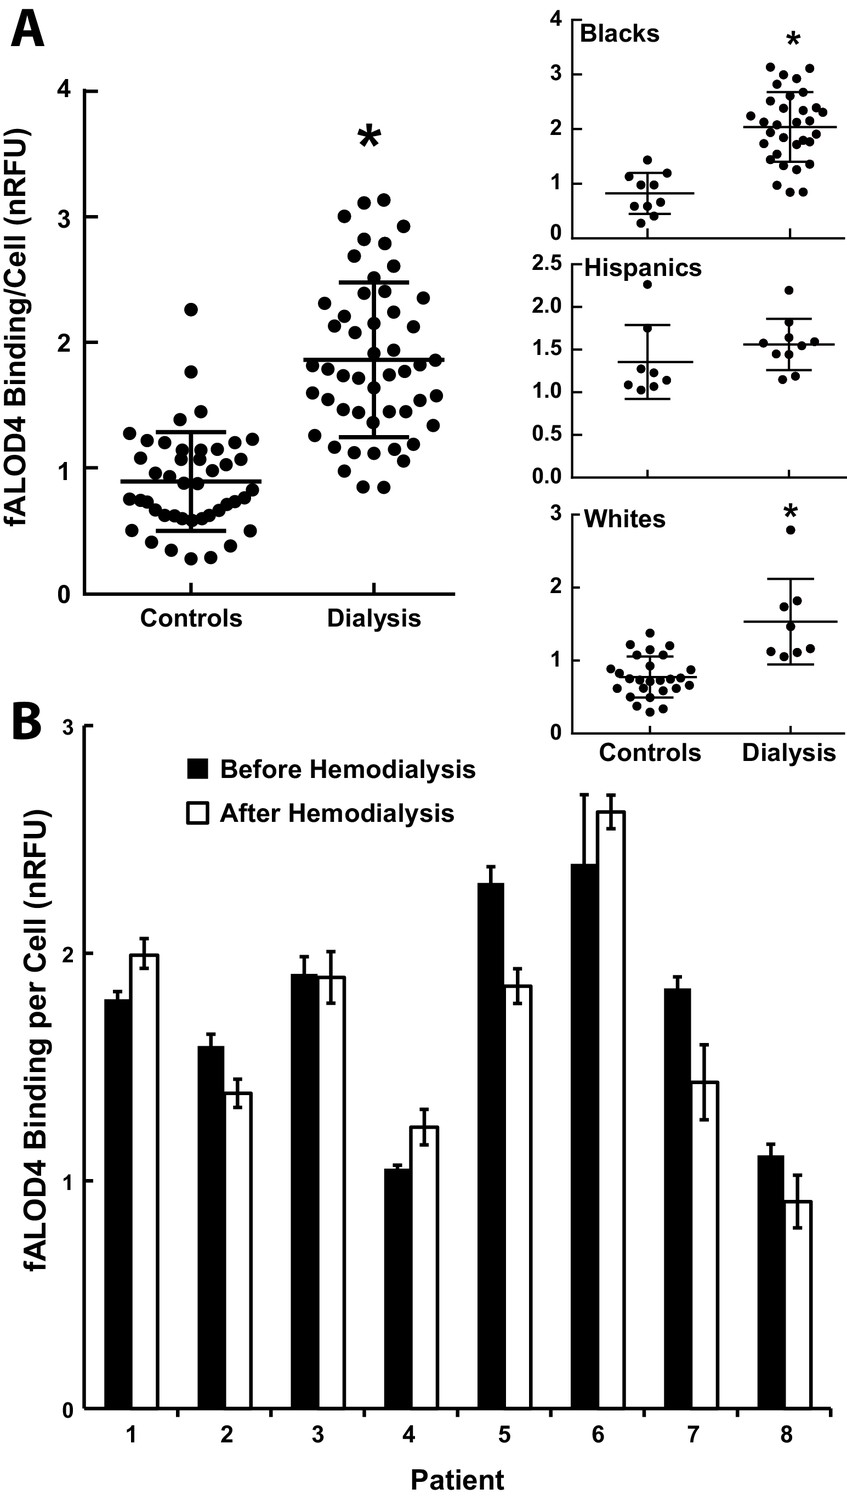
fALOD4 binding to RBCs of patients on hemodialysis.
(A) Blood samples were collected from 50 hemodialysis patients immediately before dialysis was initiated and from 44 ethnicity-matched individuals who did not have chronic renal failure and were measured on the same day (Table 6). RBCs were isolated and fALOD4 binding assays were performed as described in the Materials and methods. Each measurement was performed in triplicate. fALOD4 binding values were normalized to the binding values obtained for the reference blood sample that was collected from the same healthy subject for each experiment. Data is plotted as the mean of each nomalized value. *p<0.0001, two-tailed t-test. (B) fALOD4 binding measurements were made exactly as described above using RBCs isolated from blood samples collected before and after dialysis in eight individuals undergoing hemodialysis. Blood samples were collected once from each patient before and after hemodialysis in eight patients. Data is plotted as the mean ± SEM.
Tables
Table 1
Characteristics of 364 healthy subjects. Data are mean ± SD or median (25th – 75th percentile), unless otherwise indicated. Blood samples were obtained from healthy subjects after an 8 hr fast. Plasma lipids and lipoproteins and RBC indices were measured by Quest Diagnostics as described in the Materials and methods. Continuous variables were compared between groups using ANOVA adjusted for age and gender, where appropriate and categorical variables were compared using chi-square tests. Variables with non-normal distributions were inverse-normally transformed before analysis. Hct, hematocrit; Hb, hemoglobin; MCHC, mean corpuscular hemoglobin concentration; MCV, mean corpuscular volume; RDW, RBC distribution width; HDL-C, high density lipoprotein cholesterol; LDL-C, low density lipoprotein cholesterol.
Characteristic | n | All (n = 364) | White (n = 182) | Black (n = 98) | Hispanic (n = 84) | P-value |
|---|---|---|---|---|---|---|
Age, years | 364 | 40.9 ± 16.5 | 42.2 ± 17.7 | 44.9 ± 12 | 33.4 ± 16.2 | 3.5E-06 |
Male, n (%) | 364 | 136 (37.4) | 91 (50) | 19 (19.4) | 26 (31) | 1.1E-06 |
Female, n (%) | 364 | 228 (62.6) | 91 (50) | 79 (80.6) | 58 (69) | 1.1E-06 |
Hct (%) | 345 | 41.1 ± 5.6 | 41.4 ± 6.1 | 40.6 ± 5.5 | 40.8 ± 4.5 | 0.27 |
Hb (g/dL) | 344 | 13.2 ± 1.9 | 13.5 ± 1.9 | 12.9 ± 1.8 | 13 ± 2.0 | 0.98 |
RBC count (106/µL) | 345 | 4.6 ± 0.6 | 4.7 ± 0.6 | 4.6 ± 0.6 | 4.6 ± 0.5 | 0.065 |
MCHC | 344 | 32.3 ± 0.8 | 31.8 ± 0.7 | 32.6 ± 0.8 | 32.2 ± 0.8 | 7.5E-10 |
MCV (fL) | 345 | 87.9 ± 8.3 | 88.3 ± 8.8 | 87.2 ± 9.5 | 88.0 ± 5.3 | 0.23 |
RDW | 345 | 14.4 ± 1.8 | 14.7 ± 1.7 | 14.2 ± 1.9 | 14.3 ± 1.7 | 0.11 |
Total cholesterol (mg/dL) | 363 | 178.4 ± 36.8 | 180.3 ± 37.3 | 179.6 ± 34.6 | 173.1 ± 38.0 | 0.47 |
HDL-C (mg/dL) | 345 | 51.9 ± 14.4 | 50.3 ± 14.6 | 57 ± 14 | 49.1 ± 13.2 | 0.012 |
LDL-C (mg/dL) | 341 | 101.4 ± 35.4 | 99.5 ± 32.2 | 102.9 ± 31.6 | 103.3 ± 44.6 | 0.53 |
Triglycerides (mg/dL) | 345 | 76 (105-164) | 129 (85-184) | 83 (67-117) | 106 (85-159) | 2.8E-07 |
Table 2
Factors associated with fALOD4 binding in 364 healthy subjects. Beta coefficients are in SD units. For quantitative variables (age and lipid levels), betas are given per 1 SD change in the predictor. Partial R2 indicates the proportion of variance in fALOD4 binding explained by a given predictor after adjusting for other factors.
Factor | Beta | SE | P-value | Partial R2 (%) |
|---|---|---|---|---|
Age | 0.017 | 0.023 | 0.46 | 0.16 |
Male Gender | 0.119 | 0.046 | 0.010 | 1.93 |
Ethnicity: | ||||
White | Reference | – | – | 14.63 |
Black | 0.403 | 0.053 | 2.8E-13 | |
Hispanic | 0.130 | 0.053 | 1.6E-02 | |
Triglycerides (mg/dL) | −0.089 | 0.024 | 0.00021 | 3.99 |
Total cholesterol (mg/dL) | 0.053 | 0.024 | 0.026 | 1.45 |
Total | 21.61 | |||
Table 3
Demographics and clinical characteristics of blood donors. Blood samples were obtained from healthy subjects after fasting for at least 8 hr. ABO blood group and presence of Rh antigen was determined by Carter BloodCare as described in Materials and methods. Ethnicity, age, and gender were self-reported. Plasma lipids and lipoproteins and RBC indices were measured by Quest Diagnostics as described in the Materials and methods. Numerical values are mean ± SD. Rh, rhesus antigen D; HDL-C, high density lipoprotein cholesterol; LDL-C, low density lipoprotein cholesterol; TG, triglyceride; Hb, hemoglobin; Hct, hematocrit; MCV, mean corpuscular volume.
n | 178 |
Age (mean) | 42 |
Male (%) | 51 |
Female (%) | 49 |
Blood Groups | |
A (%) | 42 |
B (%) | 11 |
AB (%) | 3 |
O (%) | 445 |
Rh positive (%) | 80 |
Rh negative (%) | 20 |
Total cholesterol (mg/dL) | 180 ± 3 |
HDL-C (mg/dL) | 50 ± 1 |
LDL-C (mg/dL) | 99 ± 3 |
TG (mg/dL) | 155 ± 8 |
Hb (g/dL) | 13.5 ± 0.2 |
Hct (%) | 41.4 ± 0.5 |
MCV (fL) | 88 ± 0.6 |
RBC count (106/uL) | 4.7 ± 0.05 |
Table 4
Characteristics of 123 subjects in whom RBC membrane lipids were measured. Data are mean ± SD or median (25th – 75th percentile), unless otherwise indicated. All RBC lipids are expressed as mol% of total phospholipids. The lipid mole percentages were determined by mass tandem mass spectrometry. Continuous variables were compared between groups using ANOVA adjusted for age and gender where appropriate, categorical variables - using chi-square tests. Variables with non-normal distributions were inverse-normally transformed before analysis. HDL-C, high density lipoprotein cholesterol; LDL-C, low density lipoprotein cholesterol; TG, triglyceride; PC, phosphatidylcholine; SM, sphingomyelin; PE, phosphatidylethanolamine; ePC, ether-phosphatidylcholine; PS, phosphatidylserine; LPE, lysophosphatidylethanolamine; ePE, ether-phosphatidylethanolamine; LPC, lysophosphatidylcholine; PA, phosphatidic acid.
Characteristic | Black (n = 41) | Hispanic (n = 82) | P-value |
|---|---|---|---|
Age, years | 42.2 ± 11.5 | 34.8 ± 9.5 | 0.00087 |
Female, n (%) | 34 (82.9) | 55 (67.1) | 0.10 |
Male, n (%) | 7 (17.1) | 27 (32.9) | 0.10 |
fALOD4 binding (nRFU) | 1.4 (1.1–1.7) | 1.7 (1.3–2.0) | 1.3 (1.0–1.5) |
Total cholesterol (mg/dL) | 184.5 ± 38.5 | 185.2 ± 35.2 | 0.097 |
HDL-C (mg/dL) | 59.7 ± 14 | 47.9 ± 11.8 | 0.00039 |
LDL-C (mg/dL) | 107.5 ± 35.6 | 105.4 ± 29.6 | 0.35 |
TG (mg/dL) | 71 (56–101) | 130 (89–190) | 1.2E-08 |
RBC membrane lipids | |||
PC (mol %) | 40 ± 2.4 | 44 ± 3.6 | 2.7E-11 |
SM (mol %) | 19 ± 4.1 | 19 ± 3.5 | 18 ± 4.4 |
PE (mol %) | 15 ± 1.8 | 12 ± 1.8 | 6.6E-07 |
ePC (mol %) | 5.7 ± 0.61 | 6.1 ± 0.92 | 0.0028 |
PS (mol %) | 6.0 ± 0.94 | 6.2 ± 1.1 | 5.9 ± 0.81 |
LPE (mol %) | 5.1 ± 1 | 4 ± 1.4 | 0.0027 |
Ceramides (mol %) | 2.9 ± 0.45 | 2.8 ± 0.57 | 0.61 |
PI (mol %) | 2.7 ± 0.63 | 2.7 ± 0.8 | 0.18 |
ePE (mol %) | 1.7 ± 0.35 | 1.3 ± 0.26 | 8.3E-06 |
LPC (mol %) | 1.4 ± 0.31 | 1.2 ± 0.29 | 2.3E-08 |
PA | 0.44 ± 0.13 | 0.38 ± 0.099 | 0.0024 |
Table 5
Factors associated with fALOD4 binding in subjects from Table 4. Beta coefficients are in SD units. For quantitative variables (age, lipids and CBCs), betas are given per 1 SD change in the predictor. Partial R2 indicates the proportion of variance in fALOD4 binding explained by a given predictor after adjusting for other factors. LPE, lysophosphatidylethanolamine; SM, sphingomyelin; PA, phosphatidic acid.
Factor | Beta | SE | P-value | Partial R2 (%) |
|---|---|---|---|---|
Age | −0.044 | 0.034 | 0.20 | 1.40 |
Male Gender | −0.008 | 0.068 | 0.91 | 0.01 |
Ethnicity (AA vs. HA) | −0.442 | 0.077 | 6.9E-08 | 22.44 |
Triglycerides | −0.192 | 0.033 | 4.6E-08 | 22.96 |
LPE | −0.131 | 0.040 | 0.0014 | 8.55 |
SM | −0.005 | 0.045 | 0.91 | 0.01 |
PA | 0.076 | 0.036 | 0.040 | 3.62 |
Total | 56.25 |
-
Table 5—source data 1
Correlation between fatty acids (FA) and fALOD4 binding to RBCs.
- https://doi.org/10.7554/eLife.23355.016
Table 6
Demographics and lipid levels of 50 subjects with chronic renal insufficiency on hemodialysis and 44 ethnically-match controls. Data are mean ± SD, unless otherwise indicated. Blood samples were obtained either from hemodialysis patients immediately prior to dialysis or from healthy subjects after a minimum of 8 hr of fasting. Ethnicity, age, and gender were self-reported. Plasma lipids and lipoproteins and RBC indices were measured by Quest Diagnostics as described in the Materials and methods. HDL-C, high density lipoprotein cholesterol; LDL-C, low density lipoprotein cholesterol; TG, triglyceride; Hb, hemoglobin; Hct, hematocrit; MCV, mean corpuscular volume.
All | White | Black | Hispanic | |||||
|---|---|---|---|---|---|---|---|---|
Control | Dialysis | Control | Dialysis | Control | Dialysis | Control | Dialysis | |
N | 44 | 50 | 26 | 8 | 10 | 32 | 8 | 10 |
Age | 44 ± 2 | 54 ± 2 | 48 ± 2 | 52 ± 6 | 51 ± 3 | 57 ± 2 | 27 ± 4 | 48 ± 4 |
Male (%) | 46 | 58 | 54 | 71 | 30 | 50 | 56 | 80 |
Total cholesterol (mg/dL) | 182 ± 6 | 142 ± 5 | 191 ± 8 | 180 ± 3 | 153 ± 12 | 156 ± 6 | 184 ± 13 | 116 ± 5\5 |
HDL-C (mg/dL) | 48 ± 2 | 45 ± 2 | 45 ± 3 | 40 ± 4 | 54 ± 4 | 49 ± 2 | 48 ± 3 | 38 ± 4 |
LDL-C (mg/dL) | 103 ± 6 | 72 ± 4 | 111 ± 7 | 84 ± 15 | 83 ± 10 | 75 ± 5 | 100 ± 7 | 54 ± 4 |
TG (mg/dL) | 153 ± 15 | 122 ± 11 | 172 ± 22 | 144 ± 20 | 78 ± 9 | 109 ± 15 | 180 ± 30 | 147 ± 22 |
Hb (g/dL) | 13.8 ± 0.2 | 11.8 ± 0.8 | 14 ± 0.3 | 16 ± 3 | 13 ± 0.5 | 10.4 ± 0.4 | 13.5 ± 0.4 | 12.6 ± 2 |
Hct (%) | 42 ± 1 | 32 ± 1 | 43 ± 1 | 31 ± 1 | 41 ± 2 | 32 ± 1 | 41 ± 1.2 | 31 ± 1 |
MCV (fL) | 87 ± 1 | 90 ± 1 | 86 ± 2 | 87 ± 6 | 90 ± 2 | 92 ± 1 | 86 ± 2 | 88 ± 4 |
RBC count (106/µL) | 4.8 ± 0.1 | 3.7 ± 0.2 | 4.8 ± 0.2 | 3.4 ± 0.1 | 4.7 ± 0.3 | 3.8 ± 0.3 | 4.8 ± 0.2 | 3.5 ± 0.1 |
Author response table 1
Factors associated with fALOD4 binding in 364 healthy subjects, stratified by ethnicity.
Ethnicity | Factor | Β | SE | P-value |
White (n=182) | Age | 0.041 | 0.030 | 0.1766 |
Male gender | 0.097 | 0.065 | 0.1351 | |
Black (n=98) | Age | -0.098 | 0.057 | 0.0863 |
Male gender | 0.020 | 0.104 | 0.8503 | |
Hispanic (n=84) | Age | 0.031 | 0.043 | 0.4716 |
Male gender | 0.037 | 0.091 | 0.6886 |
Author response table 2
Correlation of RBC lipids with fALOD4 binding in 123 subjects in whom RBC membrane lipids were measured.
Lipid | AA (n=41) | HA (n=82) | ||
class | Partial r | P-value | Partial r | P-value |
Cer | 0.28 | 0.0762 | 0.02 | 0.8615 |
ePC | -0.15 | 0.3414 | -0.03 | 0.7717 |
ePE | -0.17 | 0.2817 | 0.17 | 0.1331 |
ePS | 0.24 | 0.1351 | 0.13 | 0.2465 |
HexCer | -0.14 | 0.3796 | -0.09 | 0.4333 |
LPC | 0.35 | 0.0250 | 0.16 | 0.1613 |
LPE | -0.46 | 0.0023 | -0.32 | 0.0029 |
PA | 0.33 | 0.0361 | 0.21 | 0.0599 |
PC | -0.13 | 0.4199 | -0.19 | 0.0882 |
PE | -0.18 | 0.2542 | -0.15 | 0.1726 |
PG | -0.41 | 0.0078 | 0.07 | 0.5341 |
PI | -0.35 | 0.0264 | -0.07 | 0.5052 |
PS | -0.17 | 0.2983 | -0.12 | 0.2704 |
SM | 0.40 | 0.0094 | 0.33 | 0.0024 |
| Partial correlation coefficients (r) were calculated using linear regression adjusted for age and gender. Bold font indicates correlations significant at p<0.05. | ||||
Download links
A two-part list of links to download the article, or parts of the article, in various formats.
Downloads (link to download the article as PDF)
Open citations (links to open the citations from this article in various online reference manager services)
Cite this article (links to download the citations from this article in formats compatible with various reference manager tools)
Variability of cholesterol accessibility in human red blood cells measured using a bacterial cholesterol-binding toxin
eLife 6:e23355.
https://doi.org/10.7554/eLife.23355


