A chloroplast retrograde signal, 3’-phosphoadenosine 5’-phosphate, acts as a secondary messenger in abscisic acid signaling in stomatal closure and germination
- The Australian National University, Australia
- Western Sydney University, Australia
- University of Adelaide, Australia
- University of California, San Diego, United States
- Research School of Biology, The Australian National University, Australia
- Zhejiang University, China
Figures
Figure 1 with 3 supplements
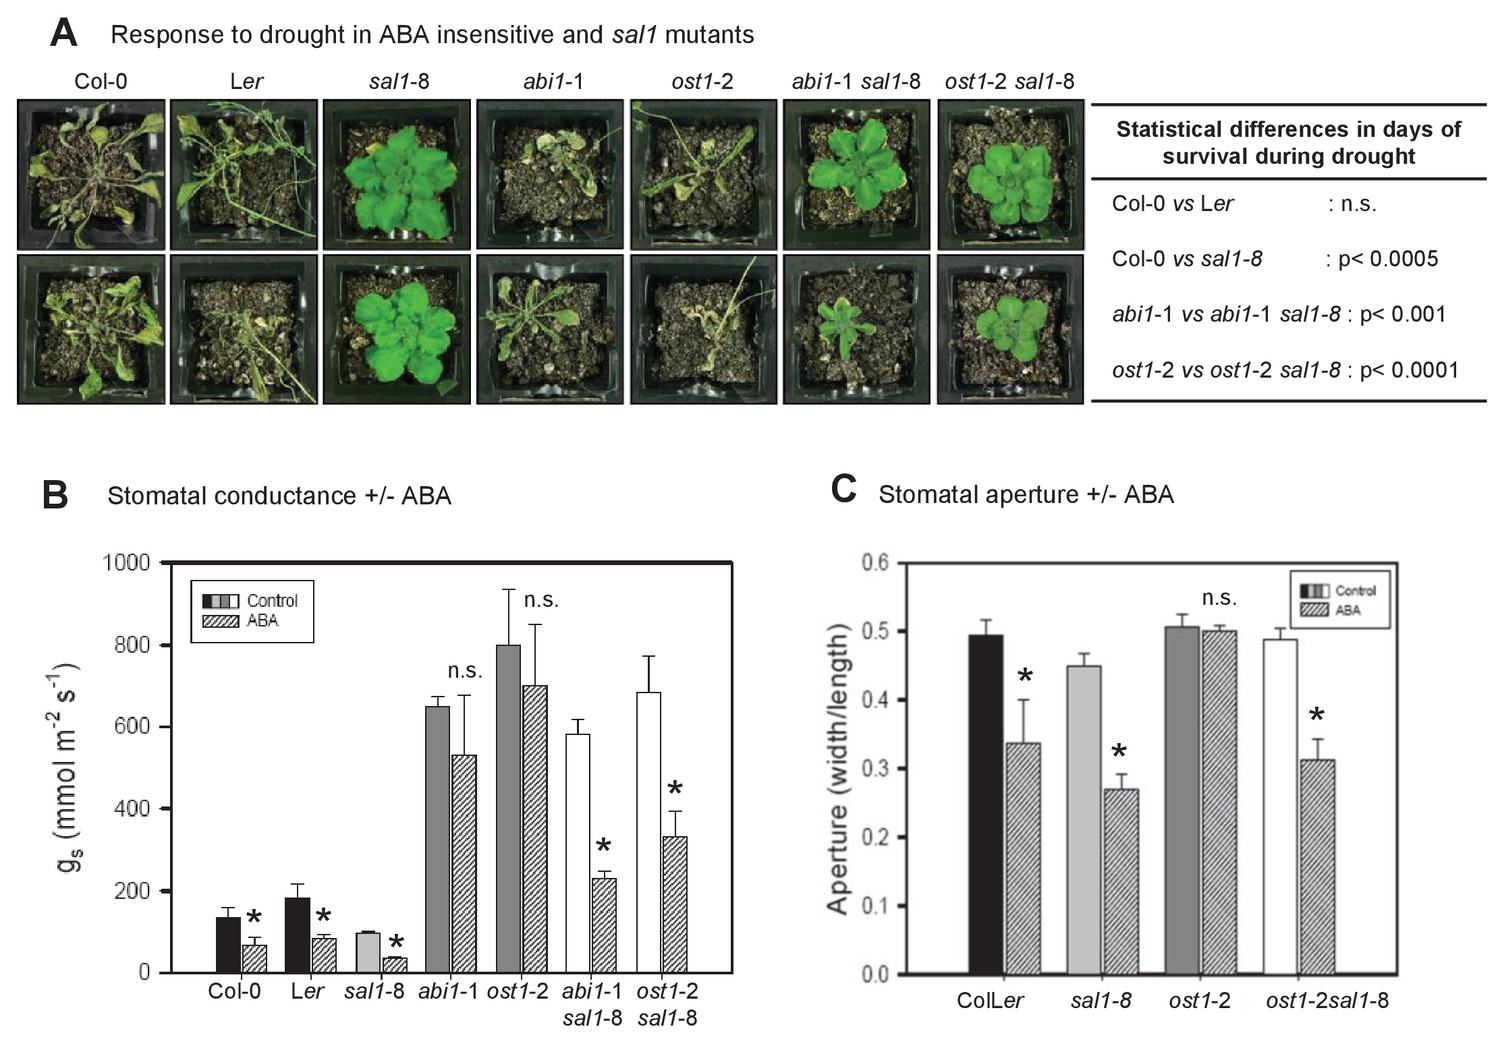
PAP restores drought tolerance and ABA-responsive stomatal closure in ABA signaling mutants.
(A) Representative photos of two plants per genotype subjected to 10 days of drought. Statistically significant differences in survival during drought between genotypes are indicated (n = 4 per genotype per experiment, three independent experiments). (B) Effect of 20 µM ABA on stomatal conductance (gs) after 2 hr feeding through the roots of hydroponically-grown plants. The data is the average of two independent experiments (n = 3 plants per genotype per experiment) ± SEM. (C) The effect of 50 µM ABA treatment for 2 hr on stomatal aperture of leaf peels from five to six-week old plants.
Figure 1—figure supplement 1
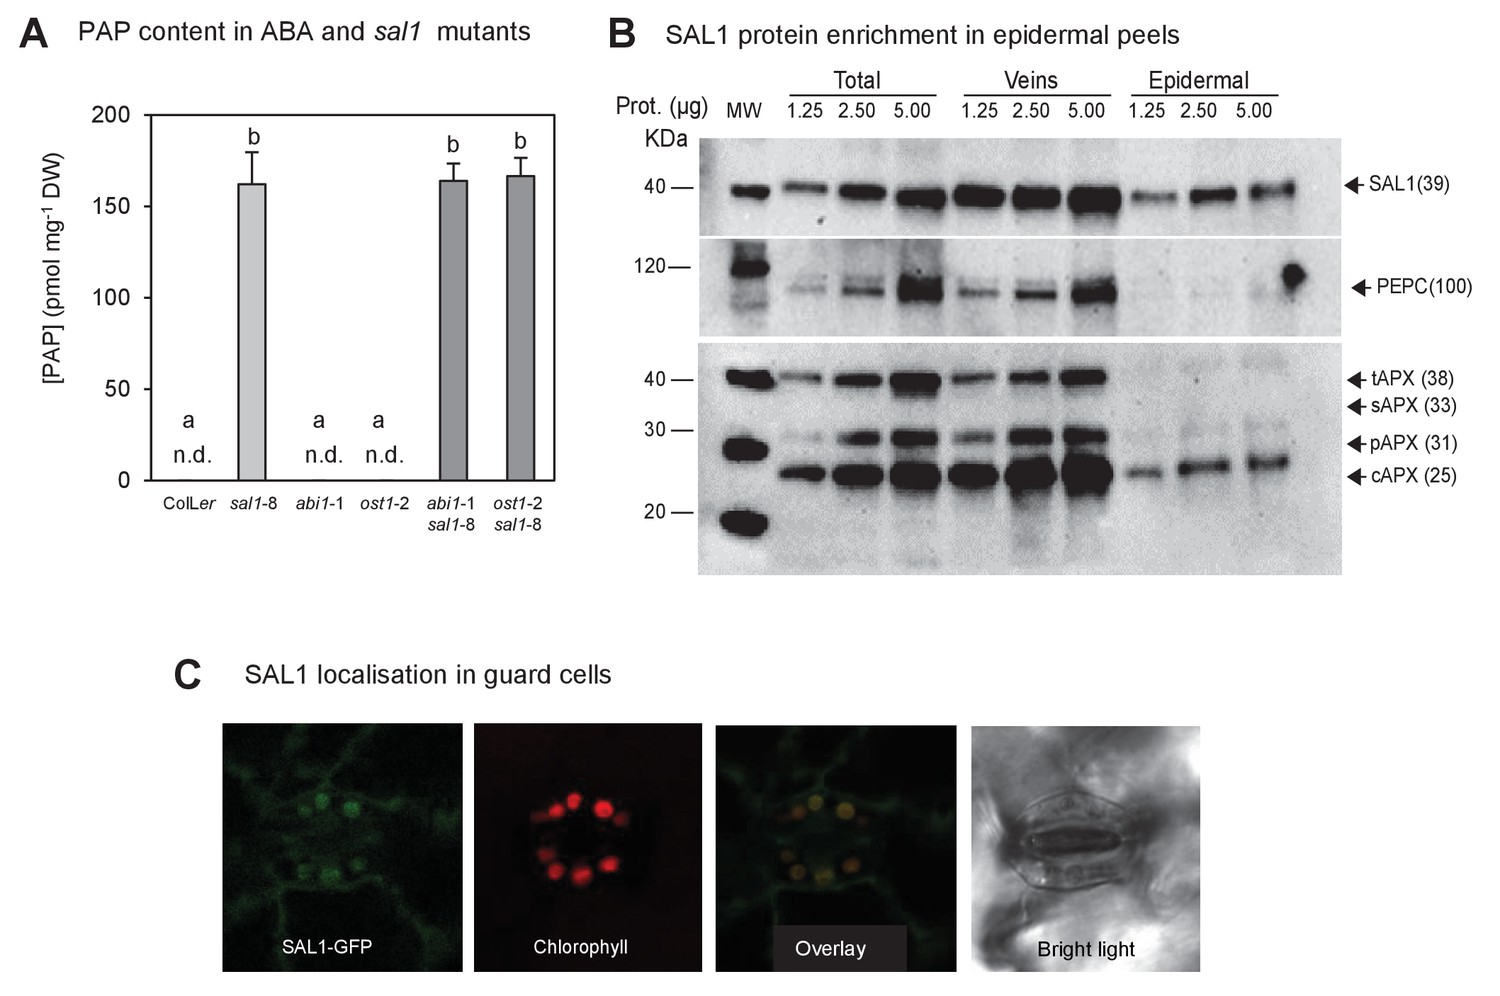
PAP content in single and double mutants; and SAL1 localization in epidermal peels and guard cell chloroplasts.
(A) Quantification of PAP in well-watered (WW) plants shows PAP levels in double mutants (dark bars) were not significantly different to sal1-8 (light bar). Data are means ± SEM, n = 5. Significant differences (p<0.05) are indicated by a, b. n.d. = not detected. (B) Western blots of total leaf, veins and epidermal peels isolated from 51 day-old Col-0 plants showed SAL1 could be detected in epidermal peels, whereas mesophyll and bundle sheath localized proteins, PEPC and APX were barely detectable. (C) Leaves of adult plants expressing pSAL1:SAL1:GFP examined using a Leica confocal microscope showed GFP fluorescence in the chloroplasts of guard cells.
Figure 1—figure supplement 2
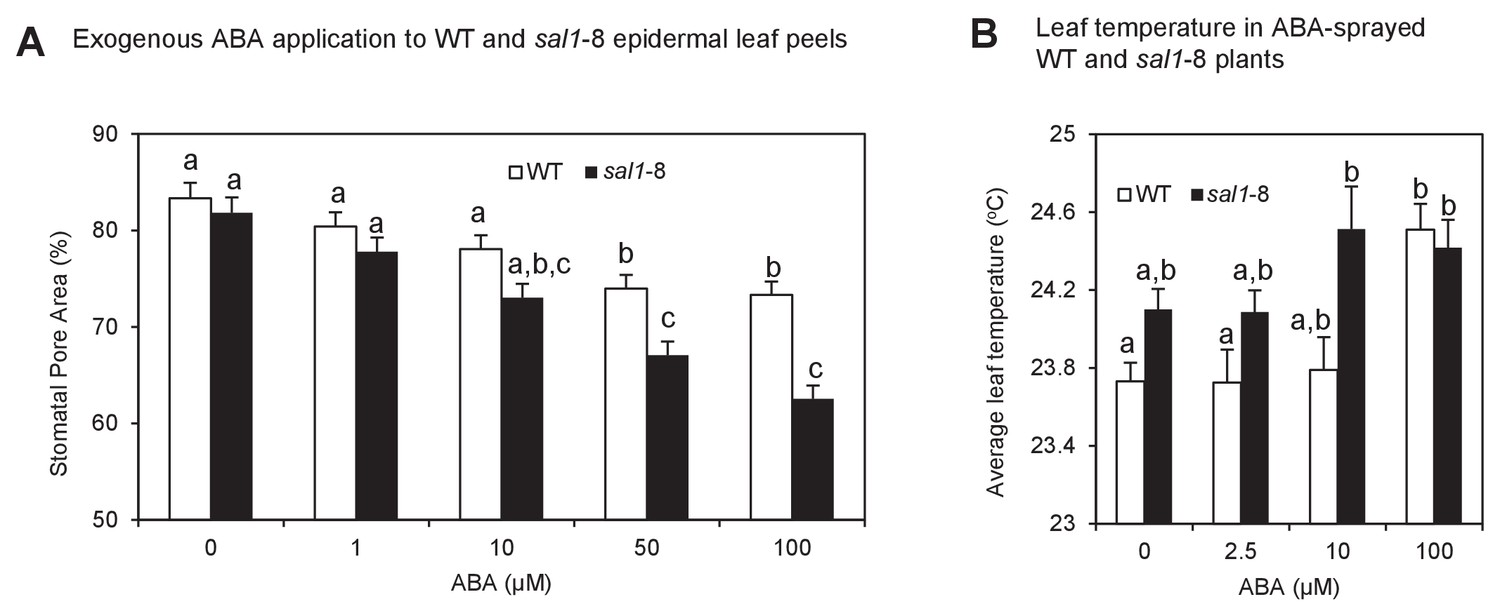
Enhanced ABA sensitivity in guard cells of sal1-8.
(A) Stomatal aperture, calculated using measurements of pore width and length, in leaf peels of wild type and sal1-8 plants treated with 0, 1, 10, 50 and 100 µM for 1 hr. Values are means, expressed as a percentage compared to time 0, of 12–16 stomata ± SEM. Significant differences between genotypes and treatments are shown by a,b,c (2-way ANOVA and Tukey’s HSD, p<0.05). (B) Thermography of 35-day old wild type and sal1-8 intact plants sprayed with 0, 2.5, 10 or 100 µM ABA. Mean and SEM of leaf temperature from four individual plants per genotype are shown. Plants were returned to growth chamber and temperature measured after 2 hr. Significant differences between genotypes are treatments are shown by a,b (2-way ANOVA and Tukey’s HSD, p<0.05).
Figure 1—figure supplement 3
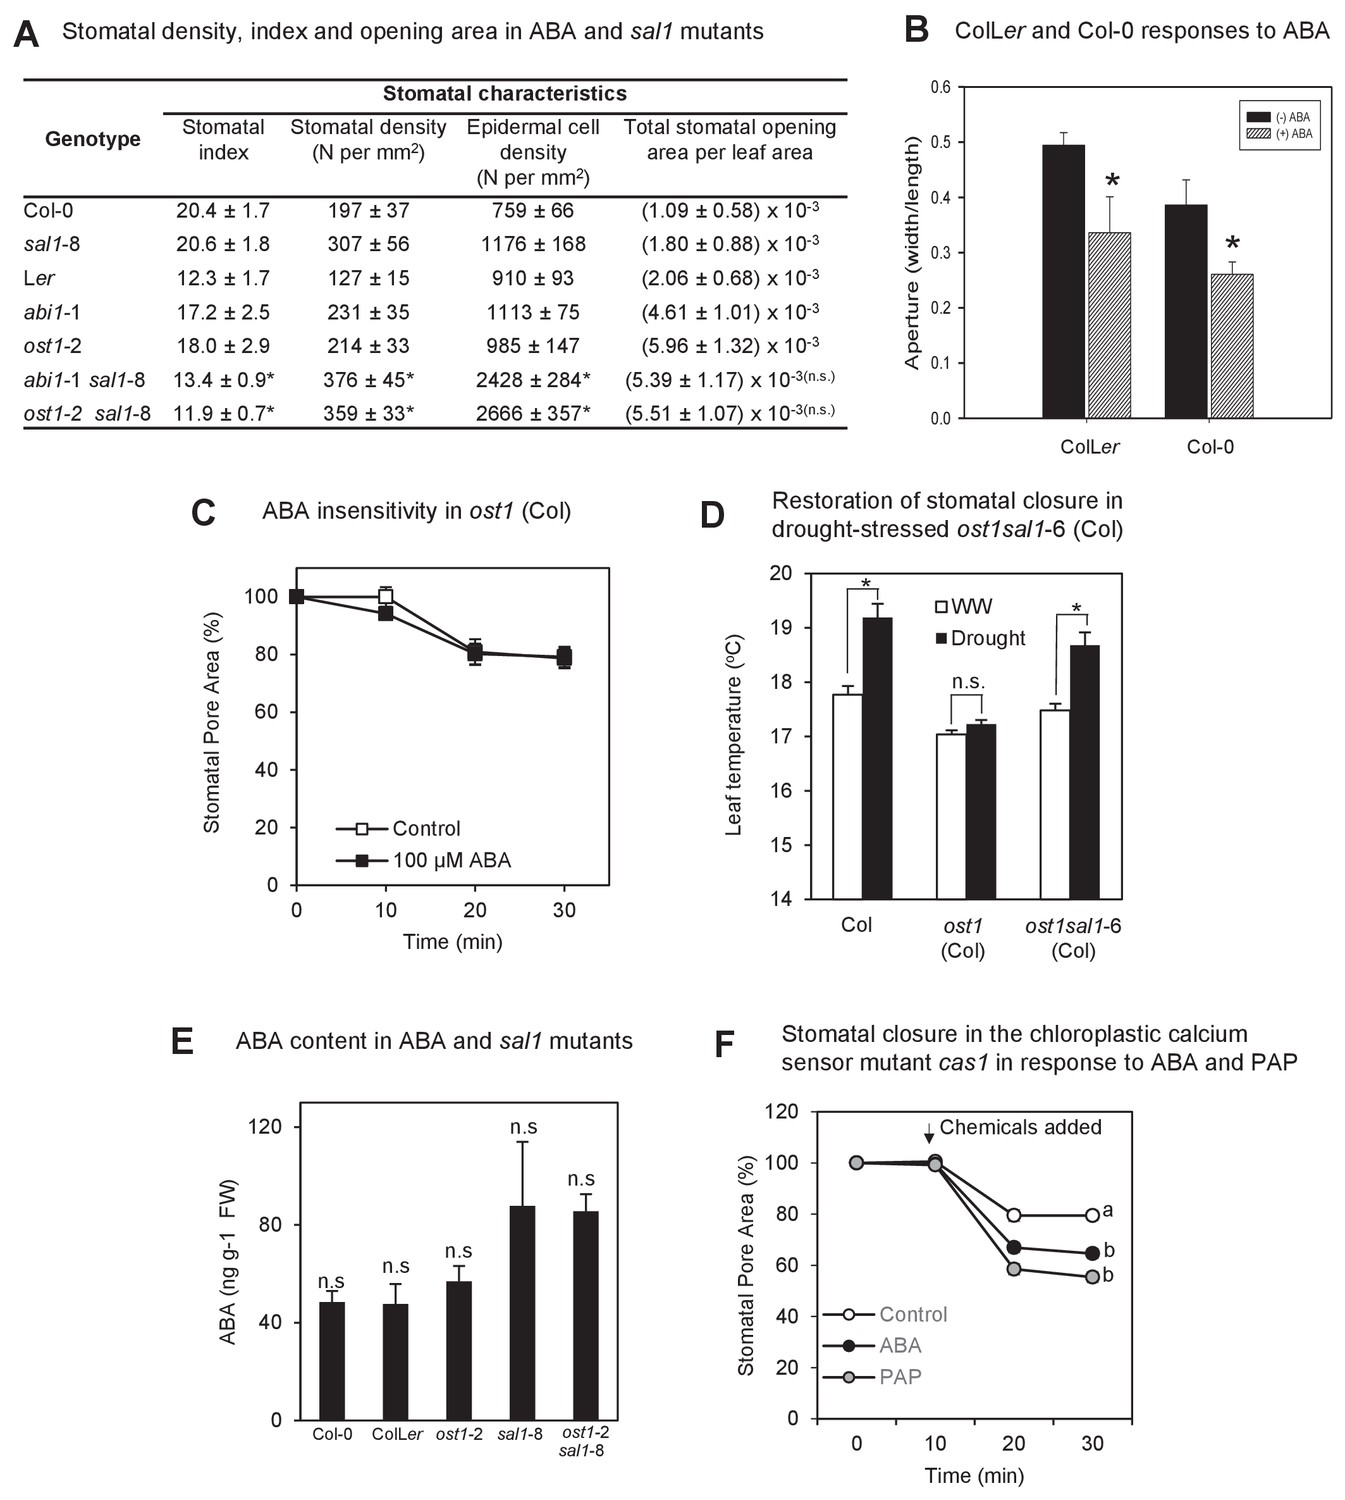
The biochemistry, physiology and stomatal features of single and double mutants, and testing of PAP action via pathogen signaling.
(A) Stomata density, epidermal cell density, stomatal index and total stomatal opening area per leaf area from CryoSEM images of abaxial surface of leaves of six week-old plants. Stomatal index is calculated according to the equation: Stomatal index = [(stomatal density) / (stomatal density + epidermal cell density)]*100. Calculations were performed from five different fields of view per leaf per genotype, n > 30. The experiments were performed twice with similar results. Significant differences at p<0.05 (*) or no significant difference (n.s.) are shown for abi1-1 sal1-8 to abi1-1 and ost1-2 sal1-8 to ost1-2, respectively. (B) Effect of ABA on the stomatal aperture of Col-0 vs ColLer hybrid of leaf peels from five- to six-week old plants after 2 hr of 50 µM ABA. (C) Effect of ABA on the stomatal aperture of ost1 (Col-0) treated with either mock control buffer or 100 µM ABA for 30 min. Results are mean ± SE of 15 stomata per treatment. (D) Stomatal closure, as assayed by leaf temperature using infrared thermography, in well-watered and drought-stressed WT, ost1 and ost1sal1-6 (all in Col-0 background). Values are mean ± SE of five individual plants per genotype. Significant differences are shown for p<0.05 (*). (E) Effect of the sal1-8 mutation on total leaf ABA content. The ABA content in sal1-8 and ost1-2 sal1-8 were marginally higher but not statistically different to ColLer or ost1-2 (ANOVA, p=0.09). Results are means and standard error of 3 × 100 mg pooled two-week old seedlings. (F) Stomatal closure in leaf peels of the chloroplastic calcium sensor mutant, cas1, after treatment with 100 µM ABA, 100 µM PAP or control measuring buffer (Means ± SEM of >40 stomata per genotype). Significant differences at t = 30 min (a, b; p<0.05) are shown.
Figure 2 with 1 supplement

Exogenous PAP interacts with ABA signaling and acts in stomatal closure in both Arabidopsis and barley.
(A) Stomatal aperture, calculated using measurements of pore width and length, in leaf peels of wild type (ColLer) plants treated with either 100 µM PAP or 100 µM ABA over a period of 1 hr. Values are means, expressed as a percentage compared to t = 0 min, of at least 20 stomata ± SEM. Rates of closure were compared by modelling the closure between 10–25 min (log-transformed data), significant difference groups (p<0.05) are denoted by #, *. Final level of closure was also considered by ANOVA across the final 30 min; significant difference (p<0.05) denoted a, b, c. (B) Stomatal aperture in leaf epidermal peels of three-week old barley plants in measuring buffer (Control) for 10 min before adding 100 µM ABA or 100 µM PAP for another 50 min. Values are means ± SEM (n = 17–20 stomata of four plants). Significant difference (p<0.05) is denoted a, b. (C) Stomatal aperture as in (A) but treated with either 100 µM PAP or 1 mM ATP alone or in combination, in measuring buffer. Values are means of at least eight stomata ± SEM. The control treatment for (A), (B) and (C) was 1 hr of measuring buffer. (D) Thermography of 35-day old wild type leaves petiole fed with 250 µL of different combinations of 20 µM ABA, 100 mM LiCl, 1 mM PAP and 10 mM ATP in infiltration buffer or buffer alone (Control). Mean and SEM of leaf temperature from three leaves from three plants per genotype are shown. Leaves in solution were returned to growth chamber and temperature measured at indicated timepoints. Significant differences to control are shown (*p<0.05; **p<0.01). Also see Figure 2—figure supplement 1.
Figure 2—figure supplement 1
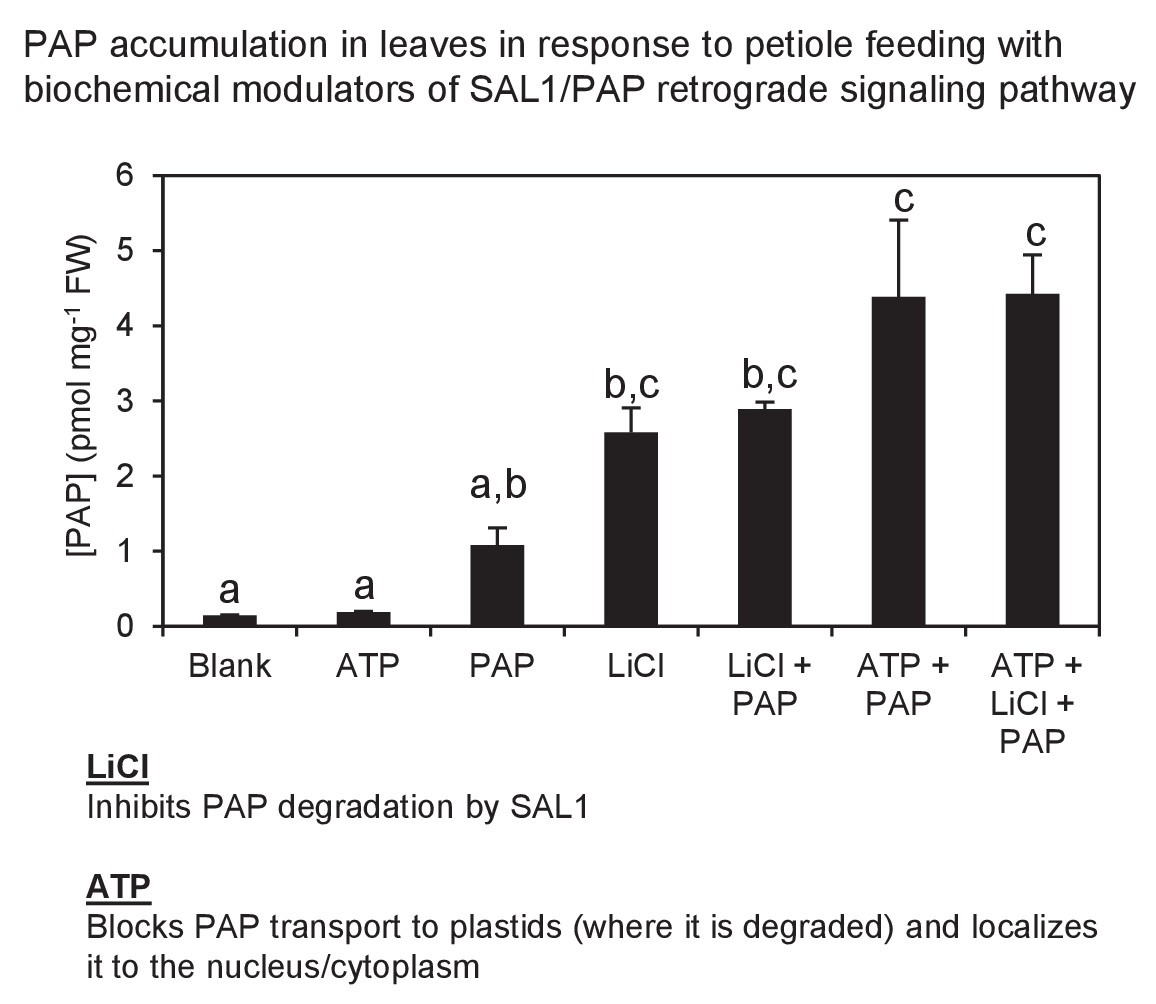
Exogenous PAP feeding to plant leaves via epidermal leaf peels or petiole feeding.
Petiole feeding of PAP for 1 hr results in accumulation of PAP in leaves. Levels were significantly enhanced by co-application with LiCl, an inhibitor of the PAP catabolic enzyme SAL1, or with ATP, which outcompetes PAP for transport into plastids where PAP is degraded. ATP also allows PAP to be localized to its sites of action, the nucleus/cytoplasm. Results averaged from three individual plants ± SEM. a, b and c represent significant differences (p<0.05).
Figure 3 with 2 supplements
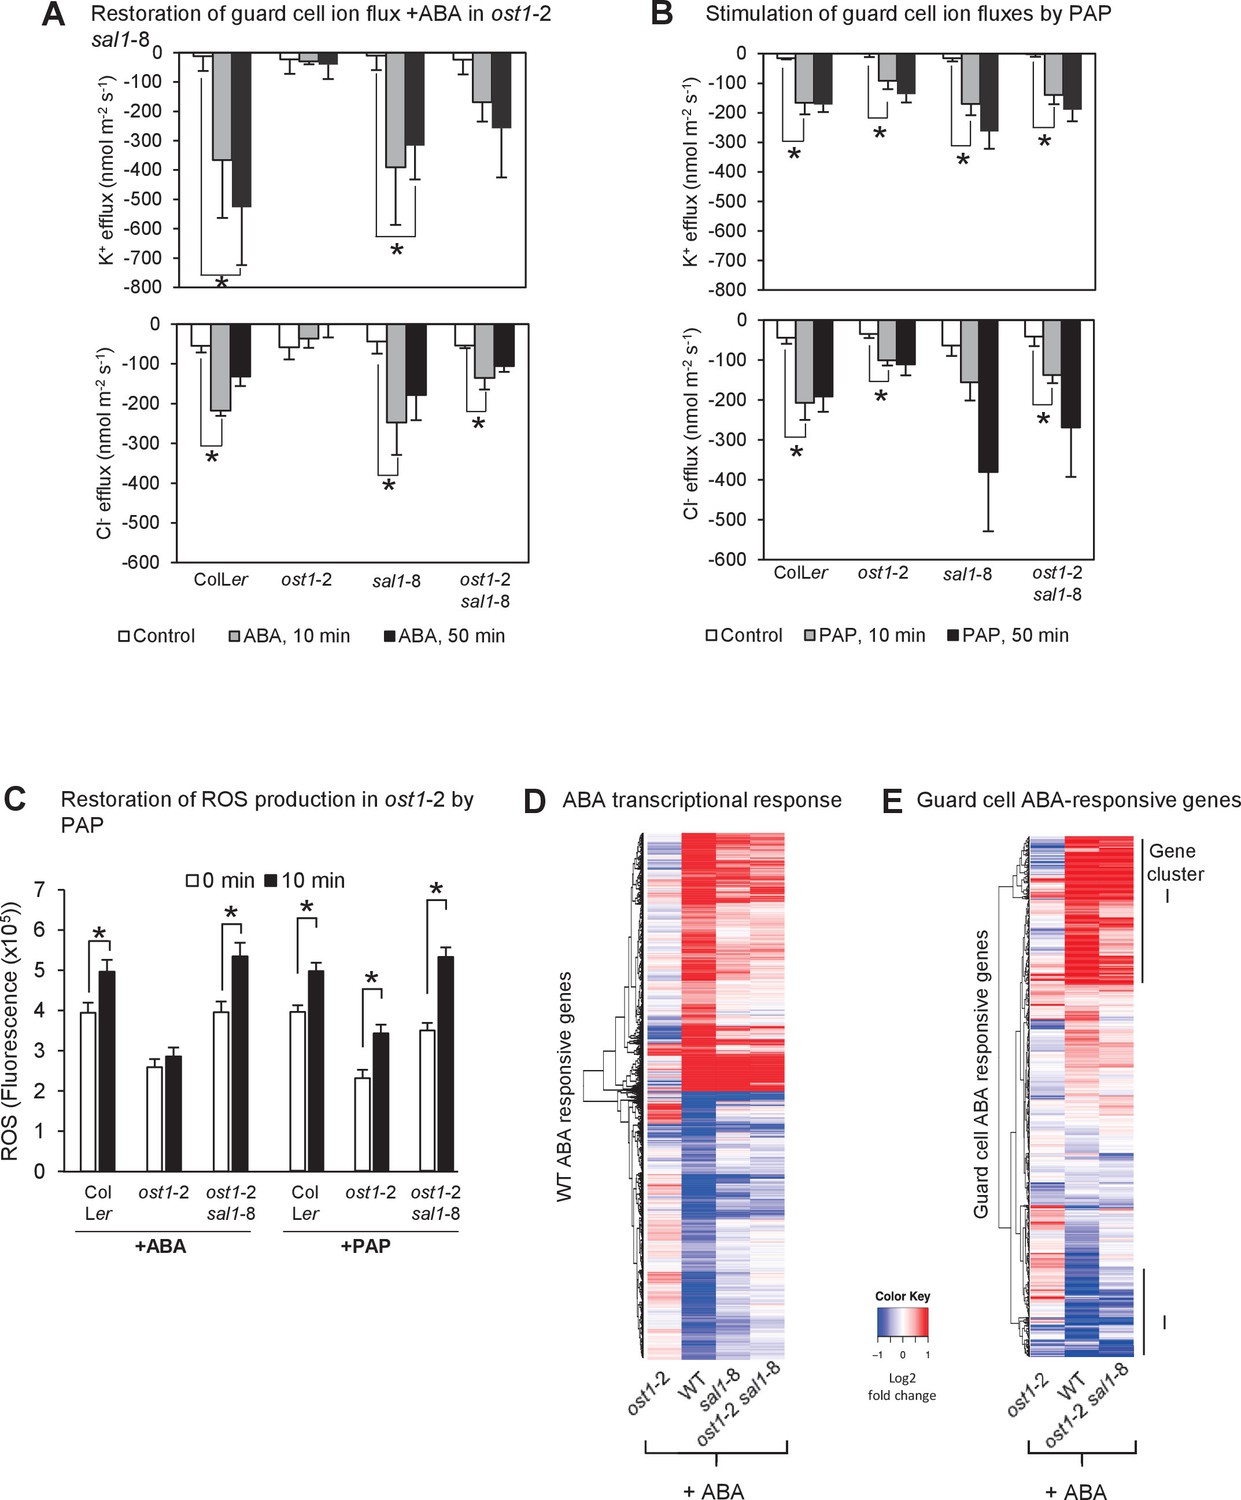
PAP restores guard cell ion fluxes, ROS burst and global transcriptional response to ABA when accumulated genetically in ost1-2 sal1-8 and when applied exogenously to ost1-2 and wild type.
Effects of (A) 500 µM ABA or (B) 500 µM PAP on combined net flux of each of the ion transporters for K+ and Cl− from guard cells in leaf epidermal peels of four-week old Arabidopsis plants. Average net ion fluxes ± SEM (n = 5–7 plants) are shown for control, 10 min and 50 min after ABA or PAP treatment. Asterisk shows statistically significant difference to 0 min (p<0.05, ANOVA). (C) Mean corrected total cell fluorescence of ROS in the presence of 2’,7’-dichlorodihydrofluorescein diacetate (H2DCFDA), a ROS probe that detects primarily H2O2 and to a lesser extent hydroxyl radicals (Wojtala et al., 2014), in guard cells before and after 10 min of 100 µM ABA or 100 µM PAP. Means ± SEM of 45–54 (+ABA) or 73–92 (+PAP) stomata per genotype is shown with significant differences denoted (t-test, p<0.05). (D–E) Hierarchical clustering comparing ABA transcriptional response in wild type (WT) and mutants for (D) transcripts responsive to ABA in WT in this study; and (E) transcripts known to respond to ABA in guard cells (Wang et al., 2011). The blue (down)-red (up) scale is log2 fold change for each genotype +/− ABA, respectively. The scale has been condensed such that the red and blue colours at the end of the scale encompass all fold-changes greater or equal to 2, or less than or equal to 0.5, respectively. Clusters showing co-expression in WT and ost1-2 sal1-8 are marked (I). Also see Supplementary file 1.
Figure 3—figure supplement 1
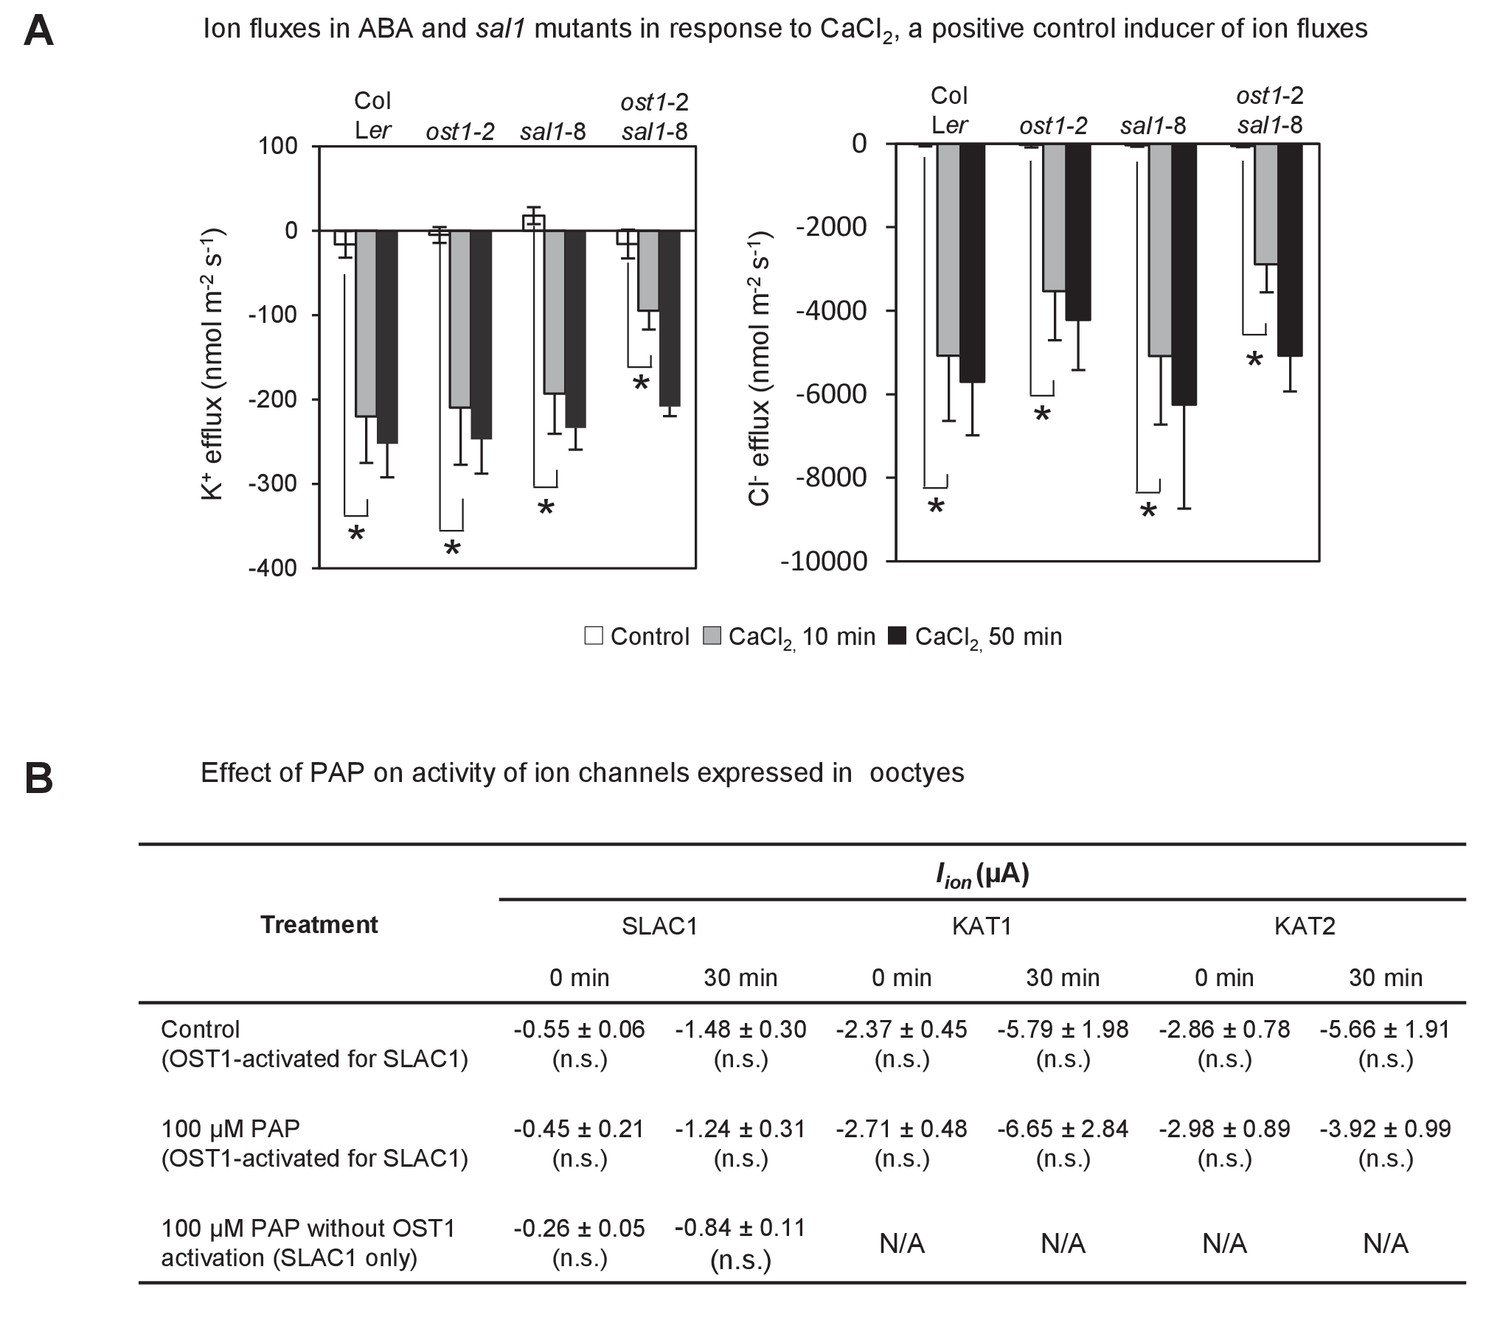
Effect of endogenously accumulated and exogenous PAP on ion fluxes in guard cells and transporter activity in oocytes respectively.
(A) Changes in ion fluxes (K+, Cl−) in genotypes treated with CaCl2, a known secondary messenger and inducer of stomatal closure downstream of ABA, transcription, NO and ROS. Bars denote means of at least five plants ± SEM. Asterisk indicates statistically significant difference to 0 min (p<0.05, ANOVA) (B) Effect of 100 µM PAP on the activity of the chloride ion channel SLAC1 and potassium ion channels KAT1 and KAT2 expressed in Xenopus oocytes. Steady-state ion channel currents were measured at −110 mV for SLAC1 and −150 mV for KAT1 and KAT2 (see Materials and methods for voltage clamp protocols and measuring conditions). ‘OST1-activated for SLAC1’ treatments refer to oocytes co-injected by both SLAC1 and OST1 cRNA to allow expression of both proteins and for phosphorylation of SLAC1 by OST1, which activates SLAC1 activity. Means and SE of three to four biological replicates per treatment and ion channel are shown.
Figure 3—figure supplement 2
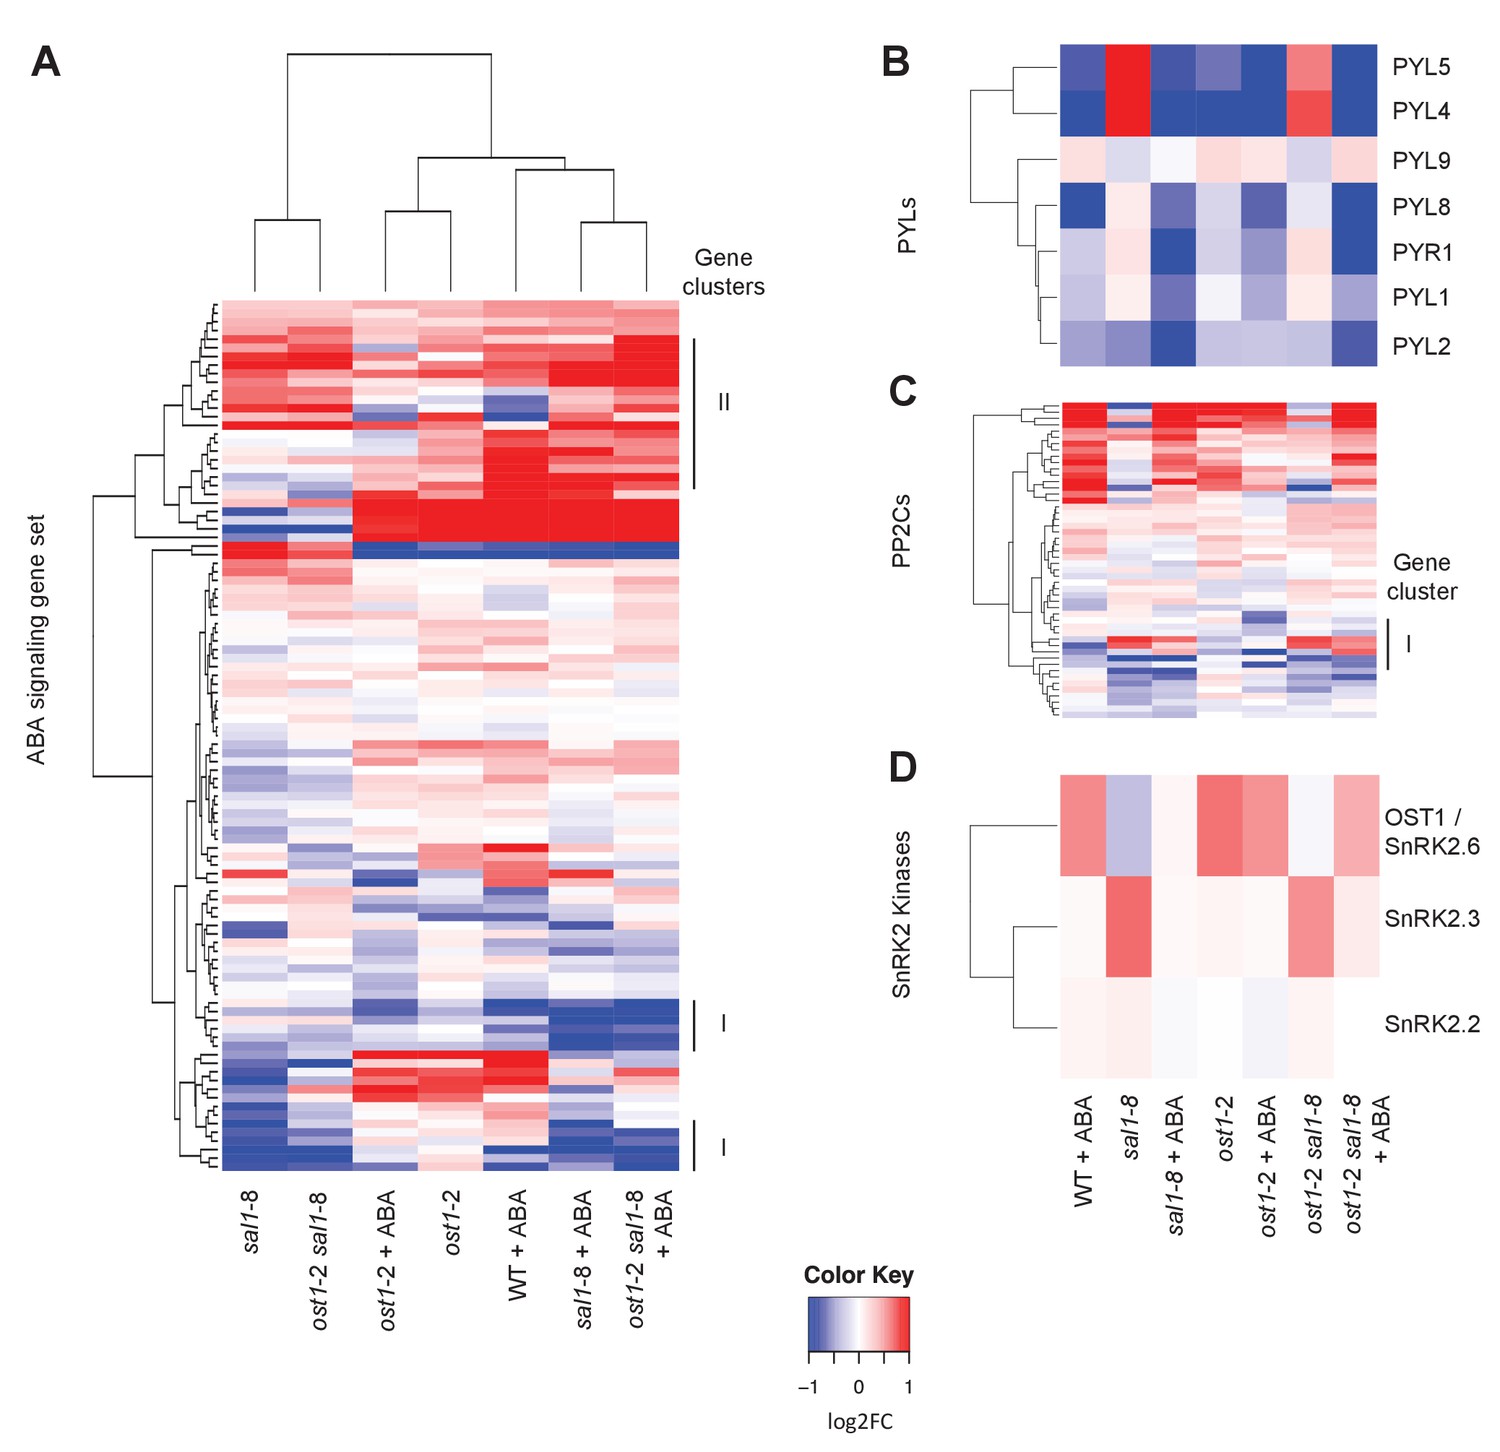
Changes in gene expression of ABA receptors, PP2Cs and SnRKs in response to ABA.
Hierarchical clustering of the expression of (A) ABA signalling gene sets in wild type, ost1-2, sal1-8 and ost1-2 sal1-8 ± ABA; (B) seven PYLs; (B) 52 PP2C genes; and (C) three SnRK2 kinases. For all hierarchical clustering analyses performed, gene expression was compared to wild type untreated of the four genotypes ± ABA. Scale = log2, blue lower and red higher expression. The scale has been condensed such that the red and blue colours at the end of the scale encompass all fold-changes greater or equal to 2, or less than or equal to 0.5, respectively.
Figure 4
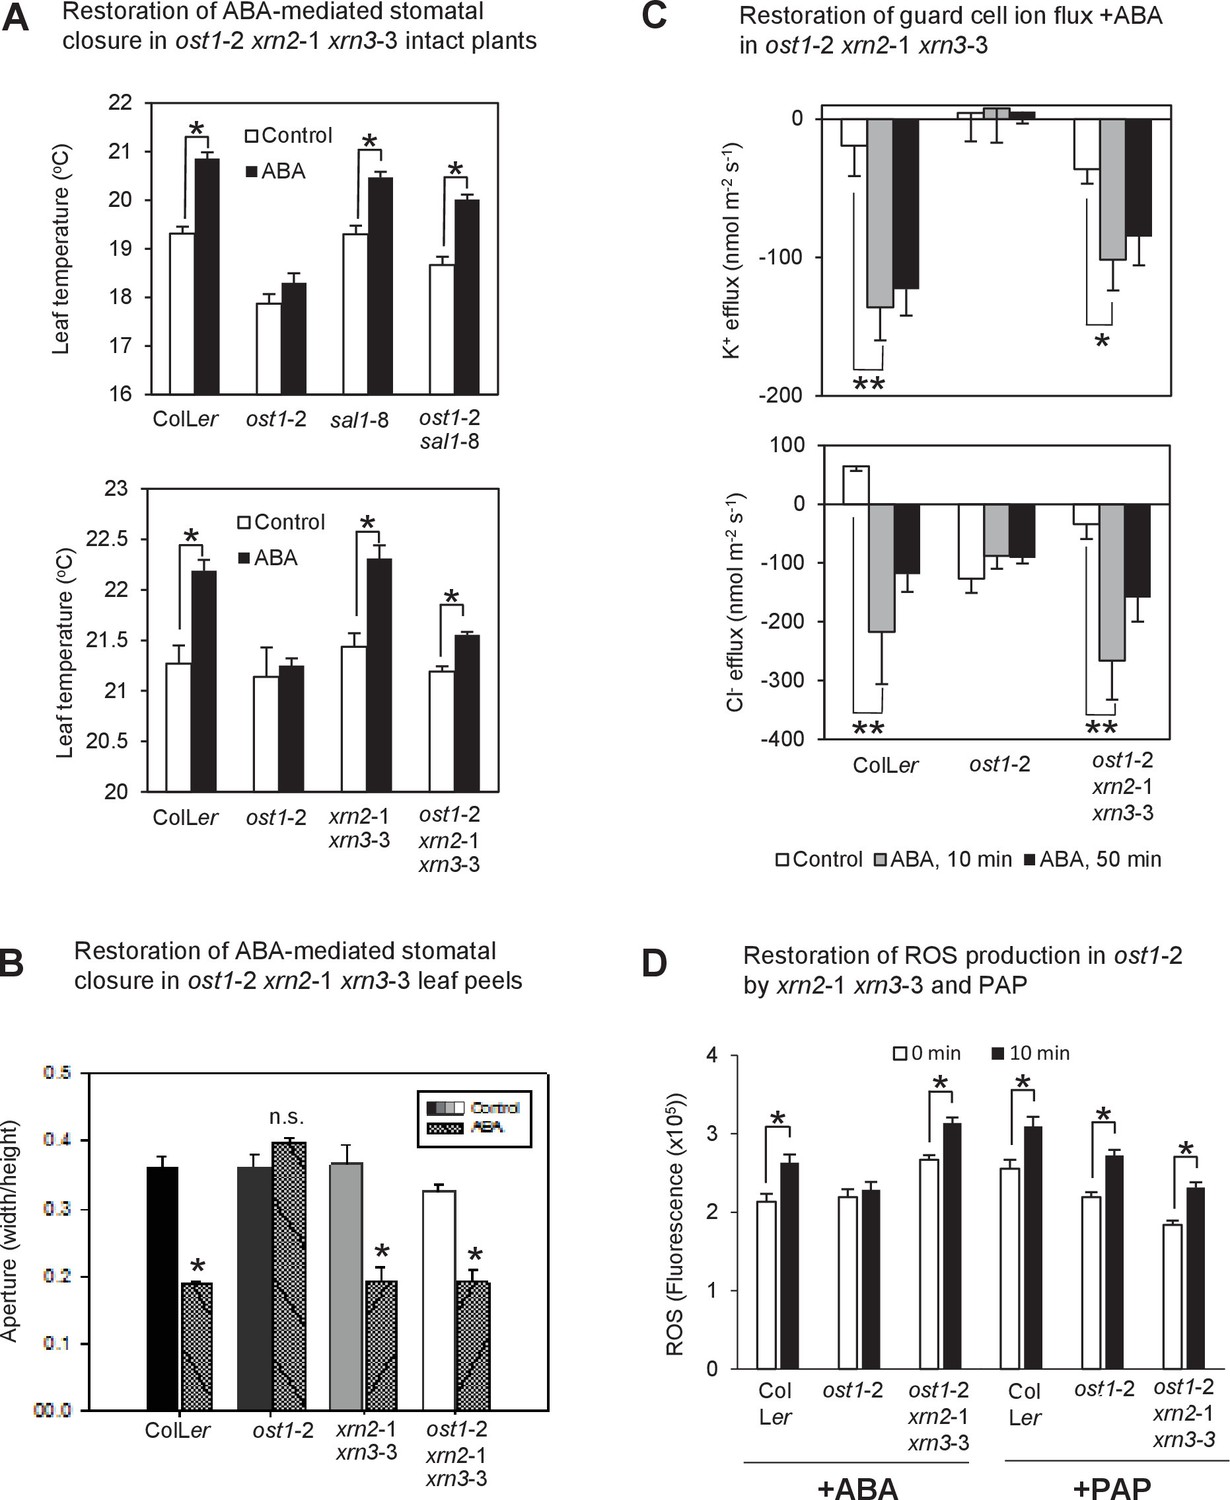
Restoration of ABA-responsive stomatal closure, guard cell ion fluxes and ROS production in ost1-2 xrn2-1 xrn3-3.
(A) Leaf temperature, a proxy of stomatal closure, in leaves of intact plants of wild type, ost1-2, sal1-8, ost1-2 sal1-8, xrn2-1 xrn3-3 and ost1-2 xrn2-1 xrn3-3 after treatment with 20 µM ABA for 2 hr. Significant differences relative to control are indicated by asterisk (*p<0.05). Values shown are means ± SEM of 3–9 biological replicates per treatment. The ABA responses of ost1-2 sal1-8 and associated controls were performed in an earlier, independent experiment compared to ost1-2 xrn2-1 xrn3-3. (B) Stomatal aperture in leaf peels of wild type, ost1-2, xrn2-1 xrn3-3 and ost1-2 xrn2-1 xrn3-3 after treatment with 50 µM ABA for 2 hr (40–60 stomata per genotype ± SD). Significant difference (*) at p<0.05 is shown for +ABA. The same trend was observed in two independent experiments. (C) Effects of 500 µM ABA on combined net flux of each of the ion transporters for K+ and Cl− from guard cells in leaf epidermal peels of four-week old Arabidopsis plants. Average net ion fluxes ± SEM (n = 4–12 plants) are shown for control, 10 min and 50 min after ABA treatment. Significant differences are indicated by asterisks (*p<0.05, **p<0.01; ANOVA) (D) Mean corrected total cell fluorescence of ROS in the presence of 2’,7’-dichlorodihydrofluorescein diacetate (H2DCFDA), a ROS probe that detects primarily H2O2 and to a lesser extent hydroxyl radicals (Wojtala et al., 2014), in guard cells before and after 10 min of 100 µM ABA or 100 µM PAP. Means ± SEM of 110–190 (+ABA) or 130–200 (+PAP) stomata from four biological replicates per genotype are shown with significant differences denoted (t-test, p<0.05).
Figure 5 with 1 supplement
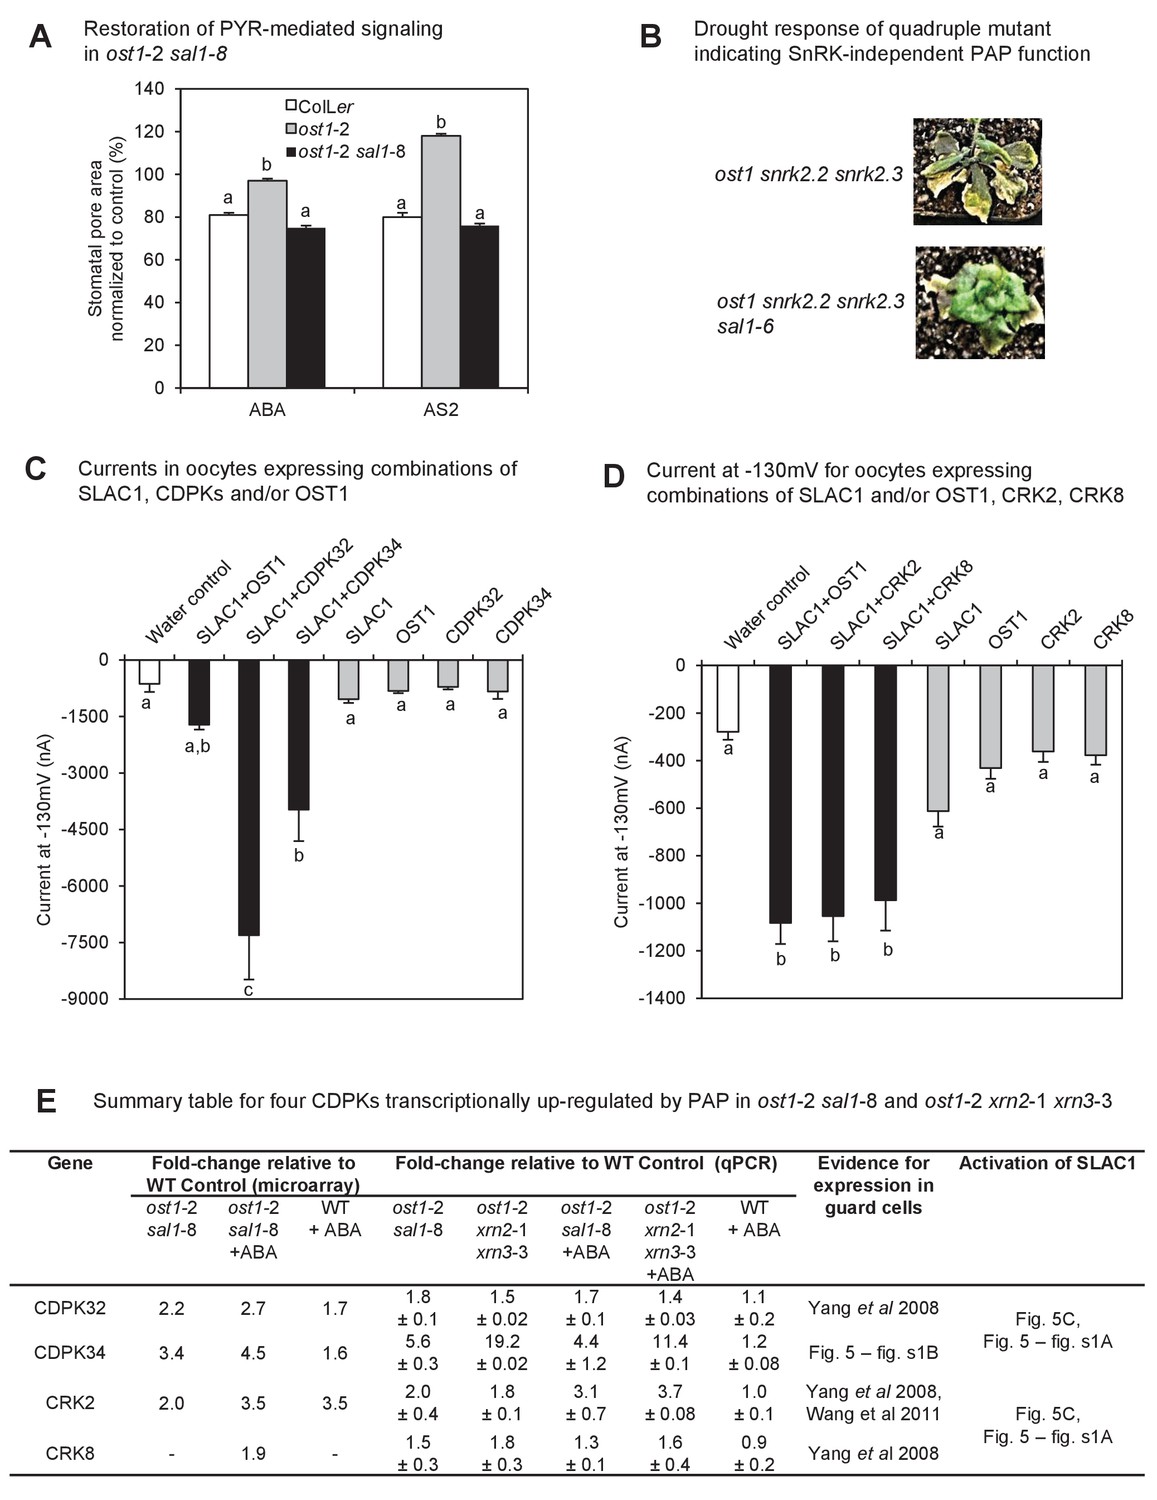
Identification of a mechanism by which PAP restores ABA sensitivity in ost1-2 sal1-8.
(A) Restoration of ABA signaling mediated by specific PYR/PYLs in ost1-2 sal1-8. Stomatal closure was observed in leaf peels after 30 min exposure to ABA or the ABA limited-spectrum agonist, AS2. Values are mean ± SEM of 17–85 stomata per genotype per treatment. Statistically significant differences in response to a treatment are indicated (a, b, c). (B) Restoration of turgor to the SnRK2 gene family triple knockout ost1(snrk2.6) snrk2.2 snrk2.3 by sal1-6. (C) and (D) Anion channel activity, expressed as steady state currents activated at −130 mV, in Xenopus laevis oocytes expressing (C) SLAC1, OST1, CDPK32, CDPK34 alone, or SLAC1 in combination with one of the kinases; and (D) SLAC1, OST1, CRK2, CRK8 alone, or SLAC1 in combination with one of the kinases. Values are means of three to five oocytes ± SEM. Significant differences between treatment (ANOVA, p<0.05) are denoted a, b, c. (E) Summary information for four CDPKs up-regulated by PAP in ost1-2 sal1-8, and in ost1-2 xrn2-1 xrn3-3. Means ± SEM are shown for qPCR performed on three biological replicates per genotype.
Figure 5—figure supplement 1
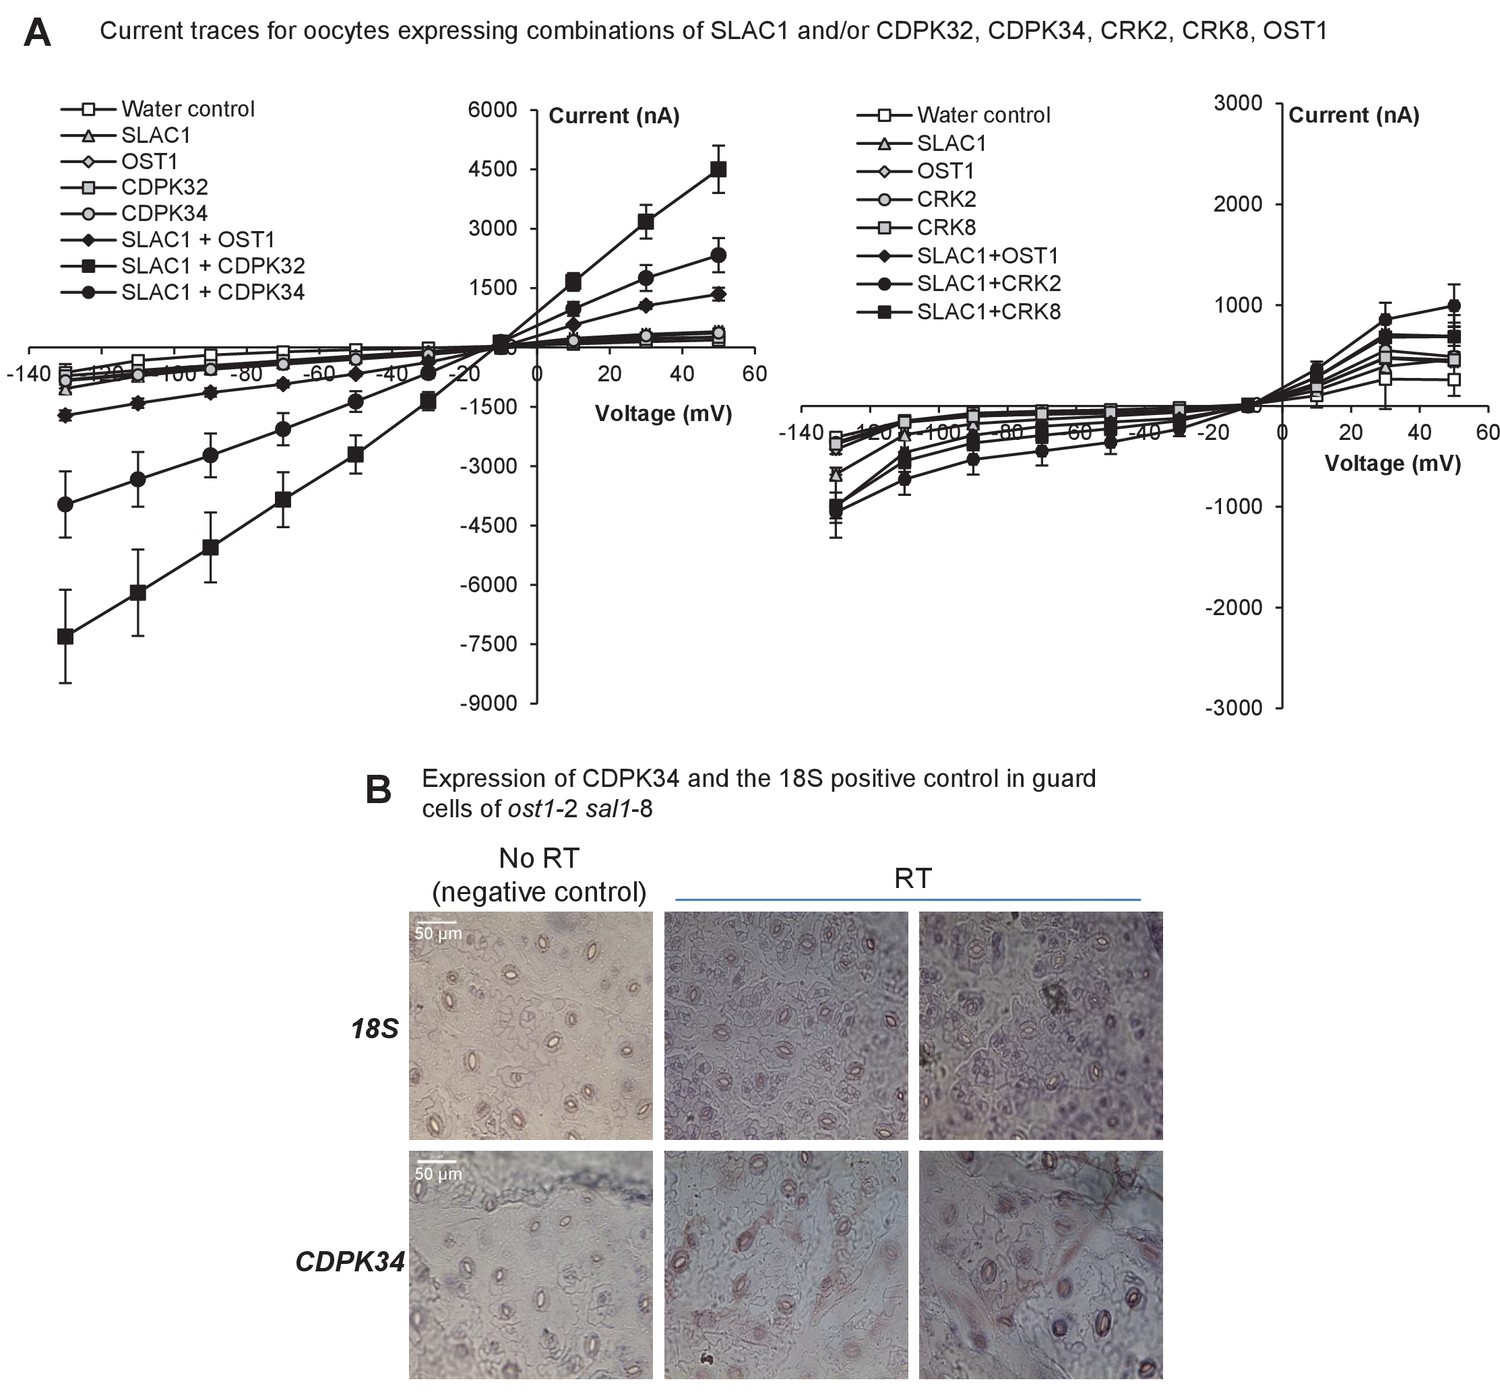
Expression and activity of CDPKs up-regulated by PAP.
(A) Representative current trace data of SLAC1 anion activation by different kinases in Xenopus laevis oocytes at voltage pulses ranging from +50 to −130 mV in 20 mV decrements. Values are means of three to five oocytes ± SEM. (B) Representative images for expression of CDPK34 and the housekeeper 18S in guard cells of ost1-2 sal1-8, as detected by in situ PCR on leaf peels. Staining for cDNA of CDPK34 and 18S ribosomal RNA showed a diffuse blue pattern across both pavement and guard cells. In guard cells the staining was evenly blue or punctate, consistent with CDPK34 expression. The negative control (‘no RT’) slides showed only large precipitates or no staining as expected. The ‘no RT’ negative controls refer to leaf peels in which the reverse transcription of mRNA was omitted, thus any staining in these slides occur by non-specific binding or precipitation of the stain. Similar results were observed in at least two biological replicates per mRNA.
Figure 6
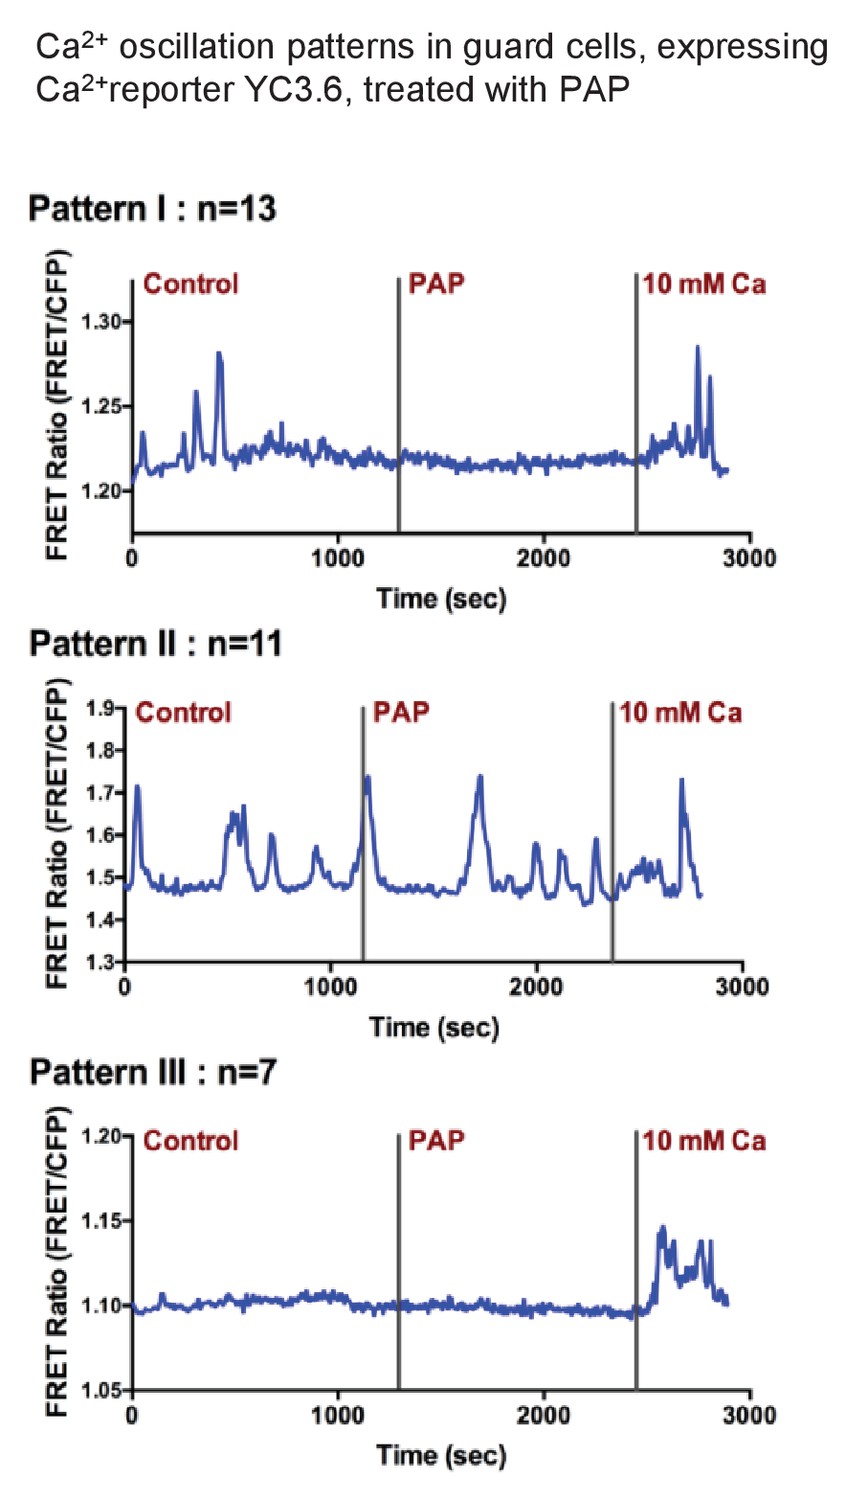
Exogenous PAP does not stimulate cytosolic Ca2+ transients in guard cells.
Three representative Ca2+ oscillation patterns obtained from time-resolved Ca2+ imaging experiments with PAP treatment. Numbers of observed cells in each group are labeled above each graph (measurements were obtained from 10 different plants). Guard cells of YC3.6 plants were monitored for their FRET emission at 535 nm and 480 nm. FRET ratio increases after the addition of 10 mM Ca2+ suggesting the cells are capable of sensing intracellular Ca2+ level changes.
Figure 7
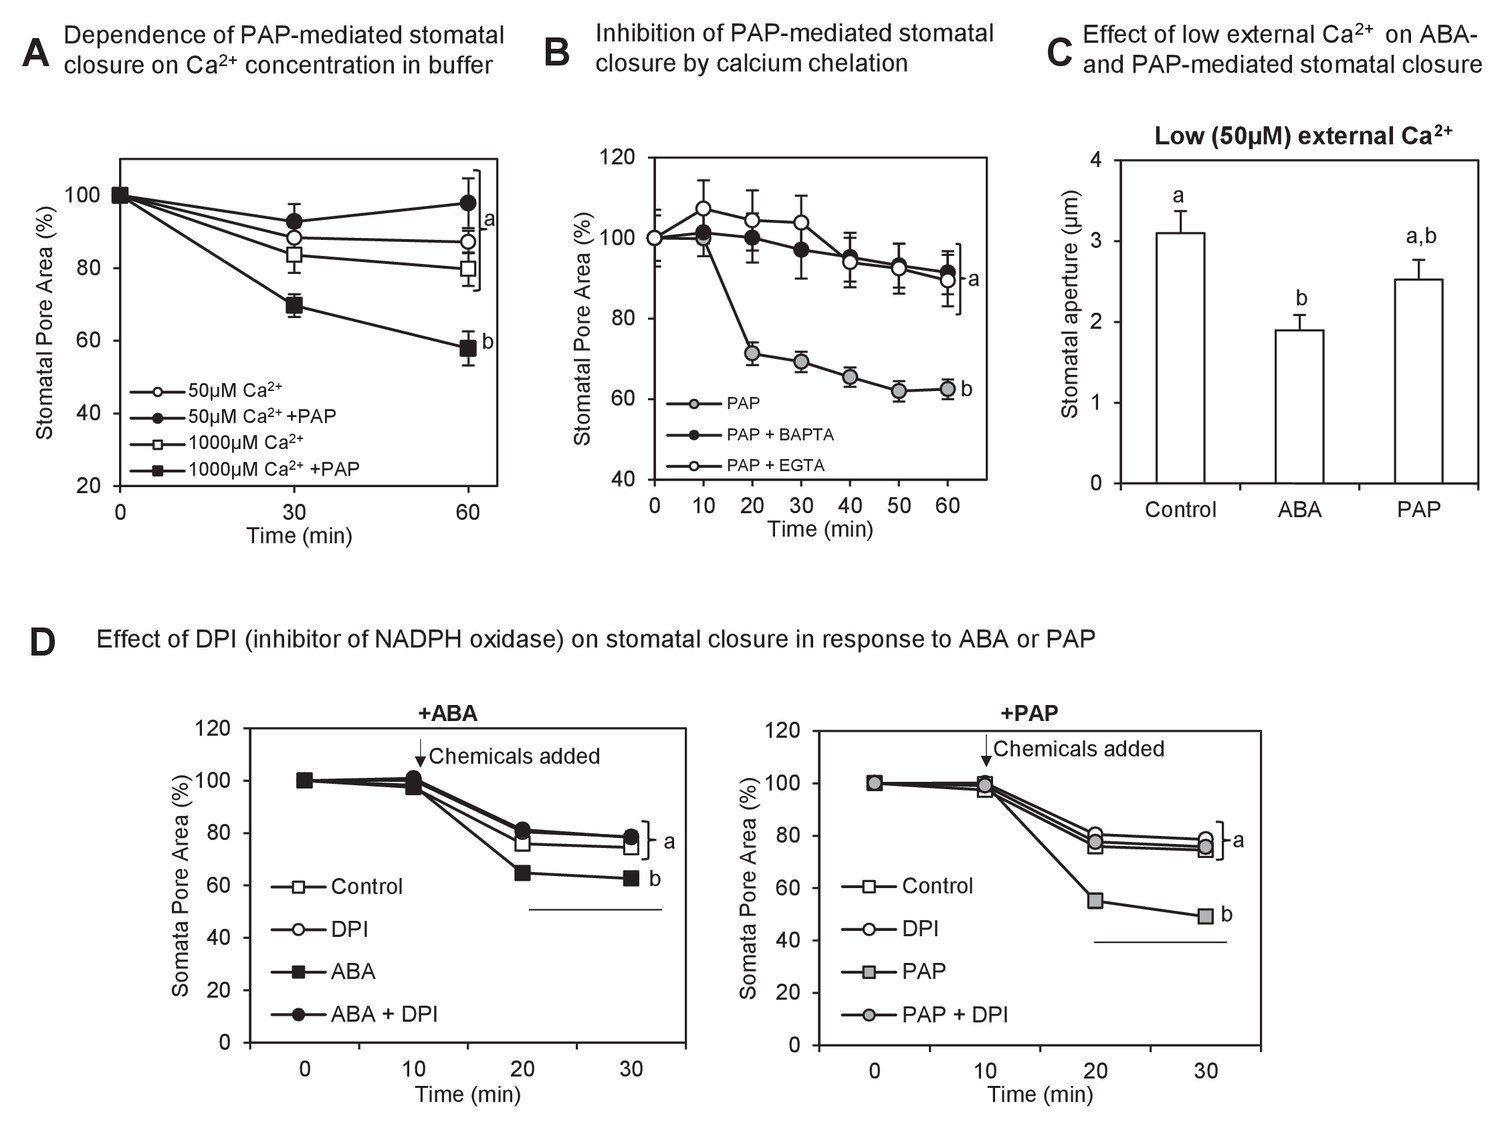
Interaction between PAP-mediated signaling with Ca2+.
(A) Wild type stomatal aperture with or without PAP in the presence of low (50 µM) Ca2+ or high (1 mM) Ca2+ in the measuring buffer. Means ± SEM for 9–10 stomata per treatment are shown. Significant differences between treatments at t = 60 min (ANOVA, p<0.05) are indicated by a, b. (B) Stomatal aperture in leaf peels treated with PAP and an intracellular calcium chelator (BAPTA-AM) or an extracellular calcium chelator (EGTA).Values are relative to control (measuring buffer). Means ± SEM for 18 stomata from four plants per treatment are shown. Significant differences between treatments at t = 60 min (ANOVA, p<0.05) are indicated by a, b. (C) Stomatal aperture in leaf peels treated with control (ethanol), 100 µM PAP or 10 µM ABA in the presence of low Ca2+ (50 µM). Means and SEM for four plants with >28 stomata per plant are shown. Significant differences between treatments (ANOVA, p<0.05) are indicated by a, b. (D) Stomatal aperture in leaf peels that were pretreated with 20 µM diphenyleneiodonium (DPI) prior to treatment with either 100 µM PAP or 100 µM ABA, in measuring buffer. The control treatment was leaf peels which were not pretreated with DPI and were treated with measuring buffer. Values are means ± SEM for 41–51 stomata per treatment. Final level of closure was considered by ANOVA after treatment; significant difference (p<0.05) denoted a, b.
Figure 8 with 1 supplement
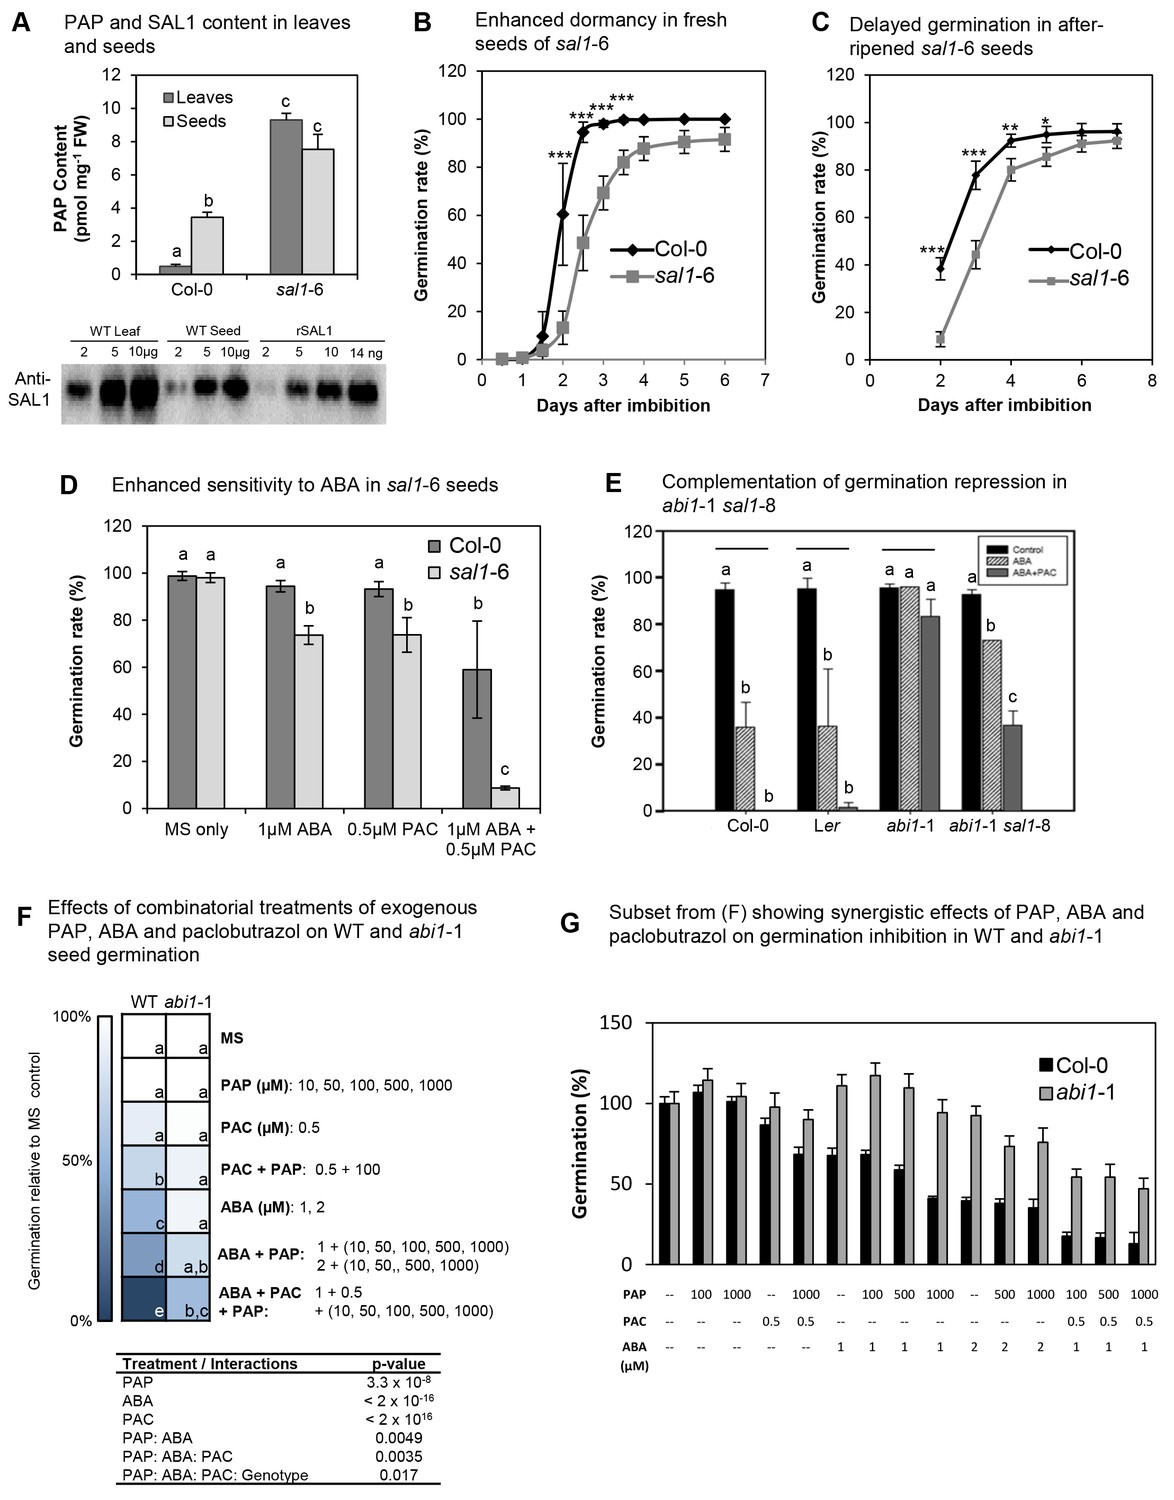
PAP also acts as an ABA secondary messenger in Arabidopsis seeds.
(A) PAP levels in wild type and sal1-6 leaves and seeds. Data are means ± SEM, n = 3. Significantly different groups (p<0.05) are shown as a, b, c. Western blot of total protein probed with anti-SAL1, together with rSAL1 recombinant protein control. (B) Germination rates (radicle emergence) of wild type and sal1-6 seeds harvested fresh and plated straight onto 0.8% agarose without prior storage, stratification or sterilization. Values show averages of five to eight plates containing at least 70 seeds per plate ± SEM. Significant differences at p<0.001 (***) or at p<0.05 (*) compared to wild type are shown. (C) Germination rates (radicle emergence) of wild type and sal1-6 non-stratified seeds that were after-ripened at room temperature for one month post-harvest. Values show averages of five plates containing at least 70 seeds per plate ± SEM. Significant differences at p<0.001 (***), p<0.01 (**) or p<0.05 (*) compared to wild type are shown. (D) Germination rates of mature dry wild type and sal1-6 seeds sterilised and sown on MS plates with appropriate chemicals added before stratification and growth. At least 70 seeds were sown in a plate per genotype and eight replicates per genotype per treatment were prepared. Data are means ± SD. Significant difference groups (p<0.05) are shown (a, b, c). (E) Germination rates of wild type, abi1-1 and abi1-1 sal1-8 in the presence of 1 µM ABA or ABA + 0.5 µM of a GA biosynthesis inhibitor: paclobutrazol (PAC). Bar graphs represent the average of two independent experiments (n = 90 seeds per genotype per experiment) ± SEM. Significant difference (p<0.05, *) compared to respective controls. n.s: not significant. (F) Germination rates of WT and abi1-1 seeds under combinatorial treatments of ABA (1, 2 µM), paclobutrazol (0.5 µM) and PAP (10, 50, 100, 500, 1000 µM), shown as a heat map. Multivariate analysis of the complete dataset shows highly significant treatment interactions (table) and were used to calculate significant difference groups (a, b, c, d, e; p<0.05) within a genotype. (G) Subset result of (F) showing individual germination rates for WT and abi1-1 in response to specific combinations of ABA, paclobutrazol and PAP. For both (F) and (G) n = 70 seeds x 5 plates = 350 seeds per genotype per combinatorial treatment.
Figure 8—figure supplement 1
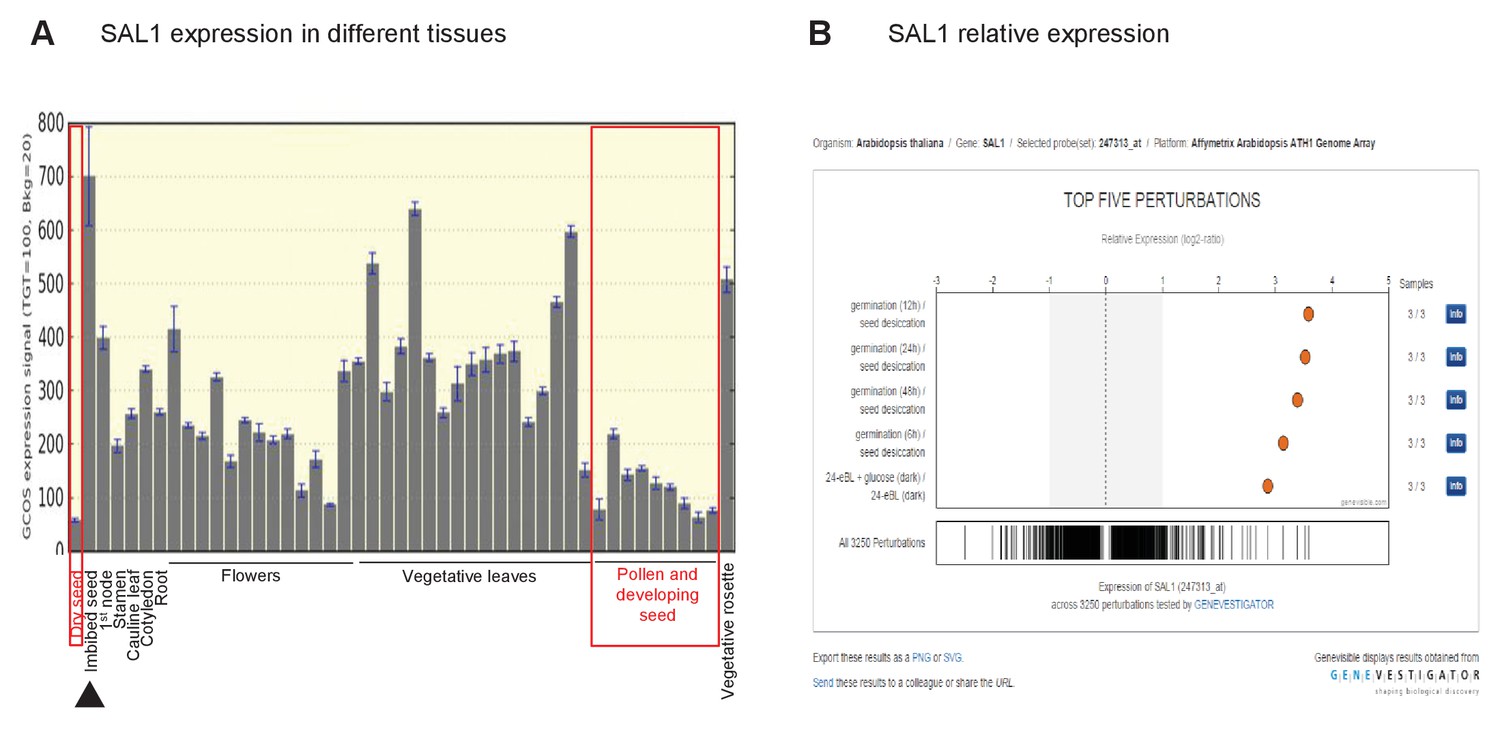
Role of SAL1 and PAP in regulating seed germination.
Wild type seed differentially regulates SAL1 transcript and protein abundance to accumulate more PAP than leaves. (A) SAL1 expression is the lowest during seed development and in dry seed (red boxes), and highest when the seed is imbibed (black arrow). Data visualized from publically-deposited microarray data using eFP Browser. (B) Analysis of publically-deposited microarray data in Genevestigator using the Genevisible tool reveals that the top four environmental changes that exert the highest degree of change in SAL1 transcript abundance, out of >3000 perturbations, are the transition from dry seed to germinating seed. This suggests that the transcriptional repression of SAL1 and the associated PAP accumulation in seed are key aspects of seed development and dormancy.
Figure 9
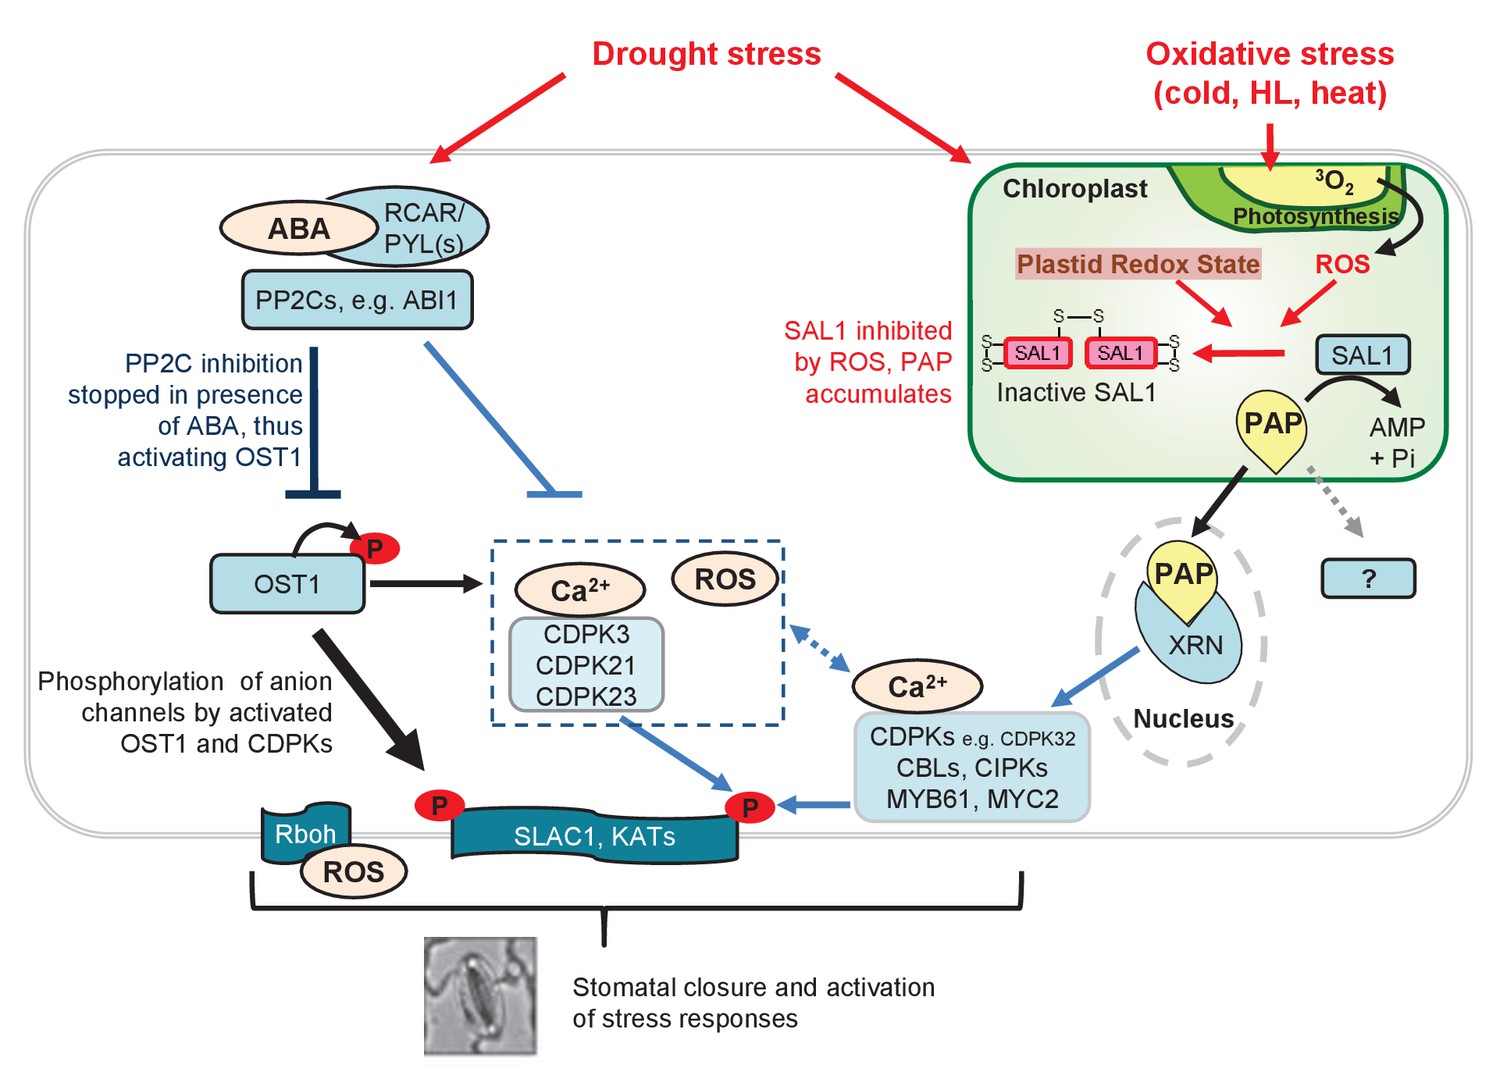
Model for fine-tuning of stomatal closure by PAP retrograde signaling.
Proposed intersection between PAP and ABA signaling during drought stress, or in ost1-2 sal1-8 / abi1-1 sal1-8 treated with ABA. Binding of ABA to its receptors (PYR/PYLs) inactivates the inhibitory PP2Cs, thus allowing activation of OST1 for phosphorylation of proteins such as transcription factors and SLAC1. This is the major pathway for stomatal closure. Additionally, ABA signaling results in Ca2+ release which could activate multiple Ca2+ signaling proteins including CDPKs and CBLs/CIPKs thus allowing phosphorylation and activation of SLAC1. Many of these ABA and Ca2+ signaling proteins can be regulated by PAP predominantly via PAP-XRN-mediated retrograde signaling. The CDPK activation of SLAC1 can occur in parallel with Ca2+-independent OST1, allowing a convergence between chloroplast and ABA signaling at this key anion channel for stomatal closure. It is possible that PAP can also regulate stomatal closure through other proteins, though there is as yet no evidence for this in plants. The relative contributions of each pathway towards control of stomatal closure are indicated by the thickness of the arrows and lines. Solid lines and arrows indicate characterized pathways. Signaling pathways which have not been fully studied are indicated with dashed lines and ‘?'.
Additional files
-
Supplementary file 1
Global gene expression changes in response to ABA.
- https://doi.org/10.7554/eLife.23361.019
-
Supplementary file 2
List of ABA signaling genes transcriptionally altered in ost1-2 sal1-8 +/- ABA.
- https://doi.org/10.7554/eLife.23361.020
Download links
A two-part list of links to download the article, or parts of the article, in various formats.
Downloads (link to download the article as PDF)
Open citations (links to open the citations from this article in various online reference manager services)
Cite this article (links to download the citations from this article in formats compatible with various reference manager tools)
A chloroplast retrograde signal, 3’-phosphoadenosine 5’-phosphate, acts as a secondary messenger in abscisic acid signaling in stomatal closure and germination
eLife 6:e23361.
https://doi.org/10.7554/eLife.23361


