Automated deep-phenotyping of the vertebrate brain
- Massachusetts Institute of Technology, United States
- Uppsala University, Sweden
- ETH Zürich, Switzerland
Figures
Figure 1 with 4 supplements

Automated OPT platform for automated 3D in situ phenotyping.
(A) From left to right, the optical projection tomography platform consists of the following components: (1) a post-mountable broadband emission quartz tungsten-halogen light source, (2) a ground glass diffuser, (3) an imaging chamber and glass capillary capable of rotating the specimen 360°, (4) a telephoto zoom lens, and (5) a programmable progressive scan CCD camera (one megapixel, 120 fps). (B) The imaging chamber consists of an upper hollow shaft stepper motor run by 5-phase microstepping drivers and a lower transparent glass cuvette. The stepper motor holds and rotates an aluminosilicate glass capillary containing a non-embedded, paraformaldehyde-fixed zebrafish embryo stained using standard chromogenic whole-mount in situ hybridization techniques. Both the capillary and the surrounding glass cuvette are filled with benzyl alcohol-benzyl benzoate (BABB) to achieve refractive index matching and render the fixed sample optically transparent. The bottom end of the capillary contains a tapered insert fabricated from index-matching optical adhesive to hold the sample in place during rotational imaging and enable rapid loading and unloading through the upper fluidic port. The location and movement of the embryo during each step is indicated by the red arrow. (C) Tomographic reconstruction of a 2 dpf embryo stained with tyrosine hydroxylase showing from left to right: a typical single 2D bright-field image, a 3D reconstruction of an individual embryo presented as a maximum intensity projection, an averaged 3D expression pattern based on 10 embryos, and a 3D segmentation of the averaged pattern. (D) Co-registered 3D segmentations of all probes in our library (left), monoaminergic markers (mono, center), and glutamatergic markers (glut, right). (C,D) Anterior is to the top. Scale bar: 100 μm.
Figure 1—figure supplement 1
Capillary fabrication and OPT image acquisition.
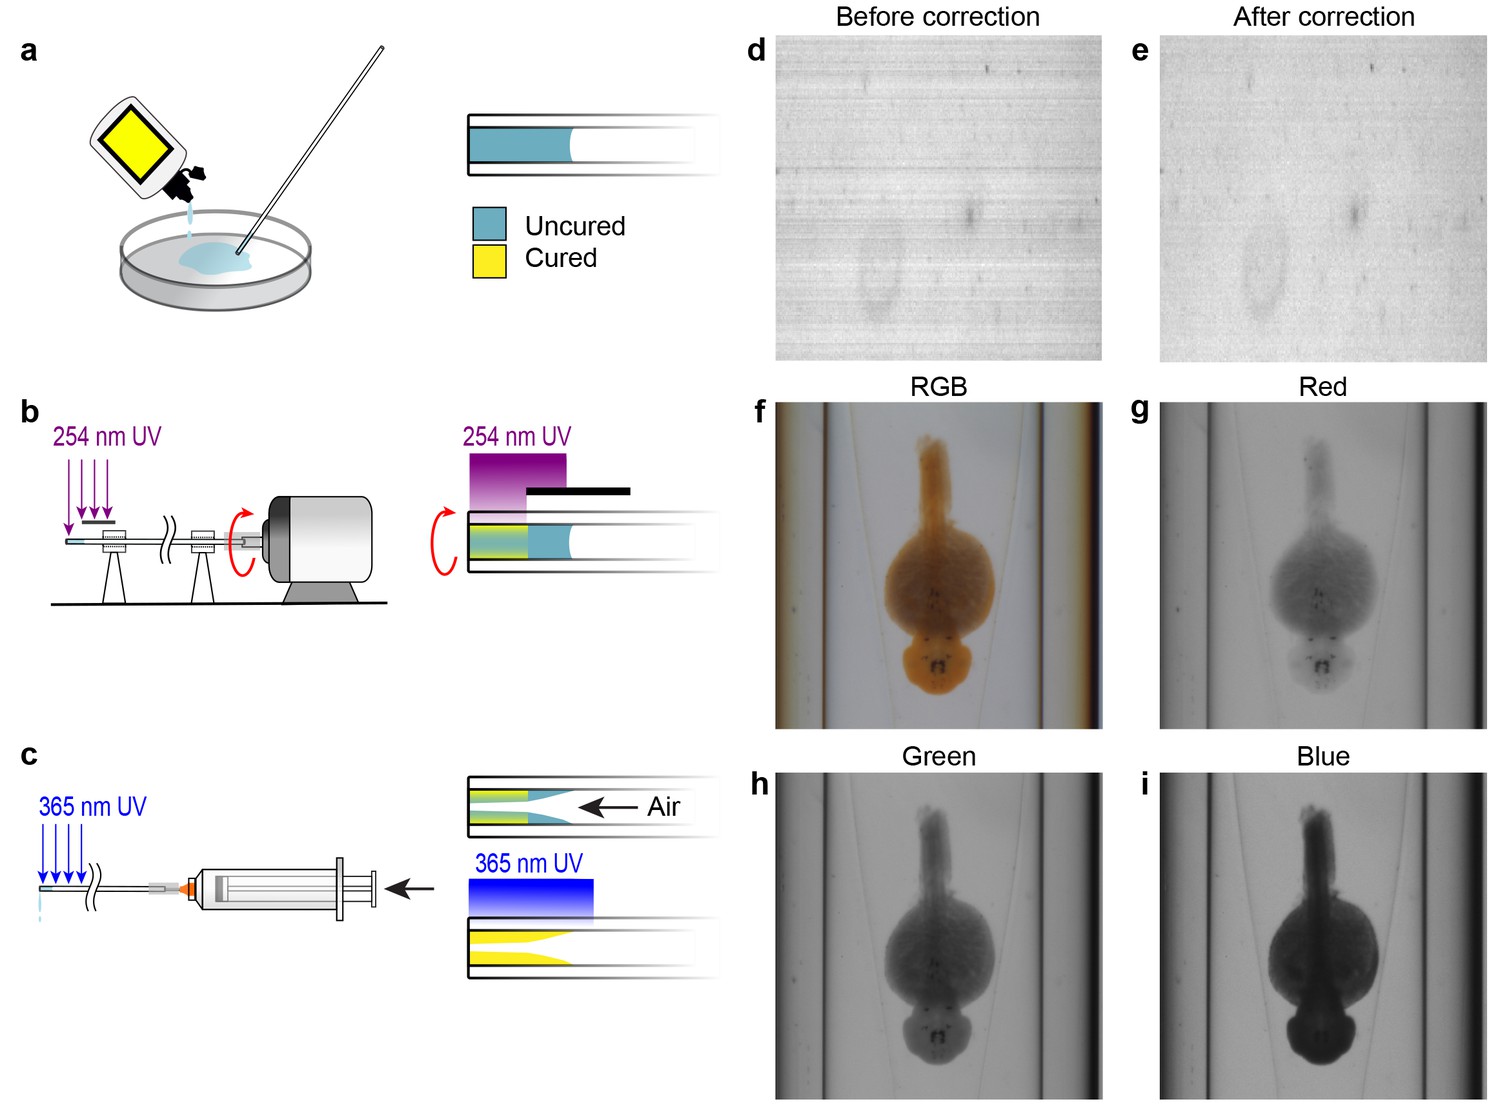
(A–C) Fabrication of a refractive index-matched tapered insertion within the glass capillary. (A) After being cleaned in Nano-Strip, the distal end of the capillary is dipped into index-matching optical adhesive and allowed to fill to approximately 5 mm by capillary action. (B) The proximal end of the capillary is attached to a miniature DC electric motor and rotated under short wavelength UV light to cure a thin outer shell of optical adhesive at the distal end. The region of the capillary where the tapered insert will be formed is protected from the UV light by an opaque shield. (C) A syringe is attached to the proximal end of the capillary and air is pumped through it at a rate of 20 mL per second. Simultaneously, long wavelength UV light is applied to completely cure the adhesive. The air flow causes a tapered surface to form in the uncured region of the optical adhesive. (D–E) Compensating for pixel-to-pixel variation in CCD sensitivity. (D) One row of pixels acquired over time prior to pixel response correction. Each row shows the sensor response over time. (E) Pixel response after correction for pixel-to-pixel variation. (F–I) Acquisition data from the OPT system showing the same WISH-stained embryo in full RGB (F) and separated into red (G), green (H), and blue (I) channels.
Figure 1—figure supplement 2
Registering 3D zebrafish images.
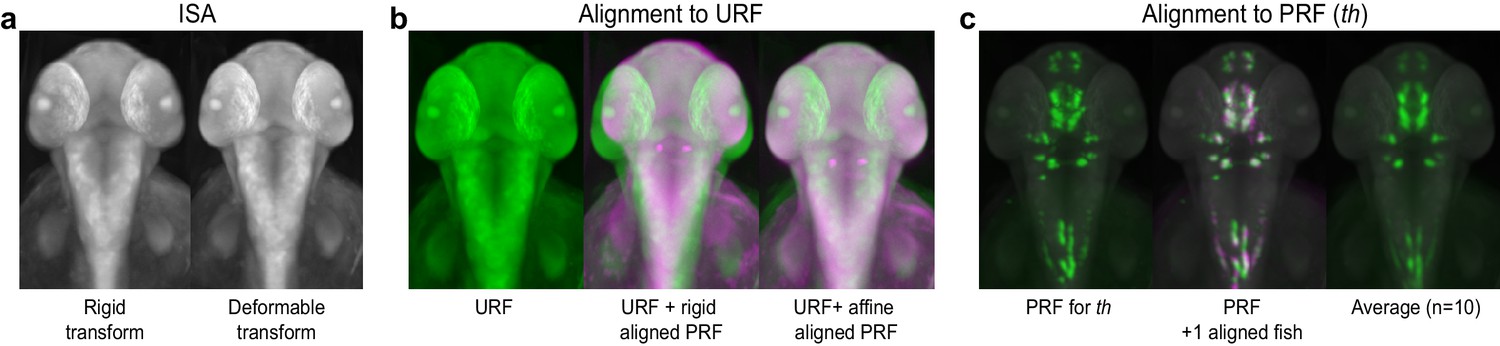
(A) Iterative shape averaging (ISA) is used to generate an average unstained reference fish (URF) for each developmental stage of interest from 5–7 wild-type embryos. Left: 2 dpf reference fish following initial alignment with a rigid transform. Right: 2 dpf reference fish after the final deformable B-spline transform. (B) Alignment of probe reference fish (PRF) to URF. Left: the URF alone (green). Center: the URF (green) with rigid alignment of PRF (magenta). Right: the URF (green) with final affine alignment of PRF (magenta). (C) Alignment of individual WISH-stained embryos to the PRF. Left: the 2 dpf PRF for tyrosine hydroxylase (th; green). Center: the PRF (green) and a second th-stained embryo (magenta) aligned using deformable registration. Areas of overlap show up as white. Right: an averaged 3D th expression pattern from 10 separate wild-type embryos.
Figure 1—figure supplement 3
Registration workflow for in situ pattern alignment.
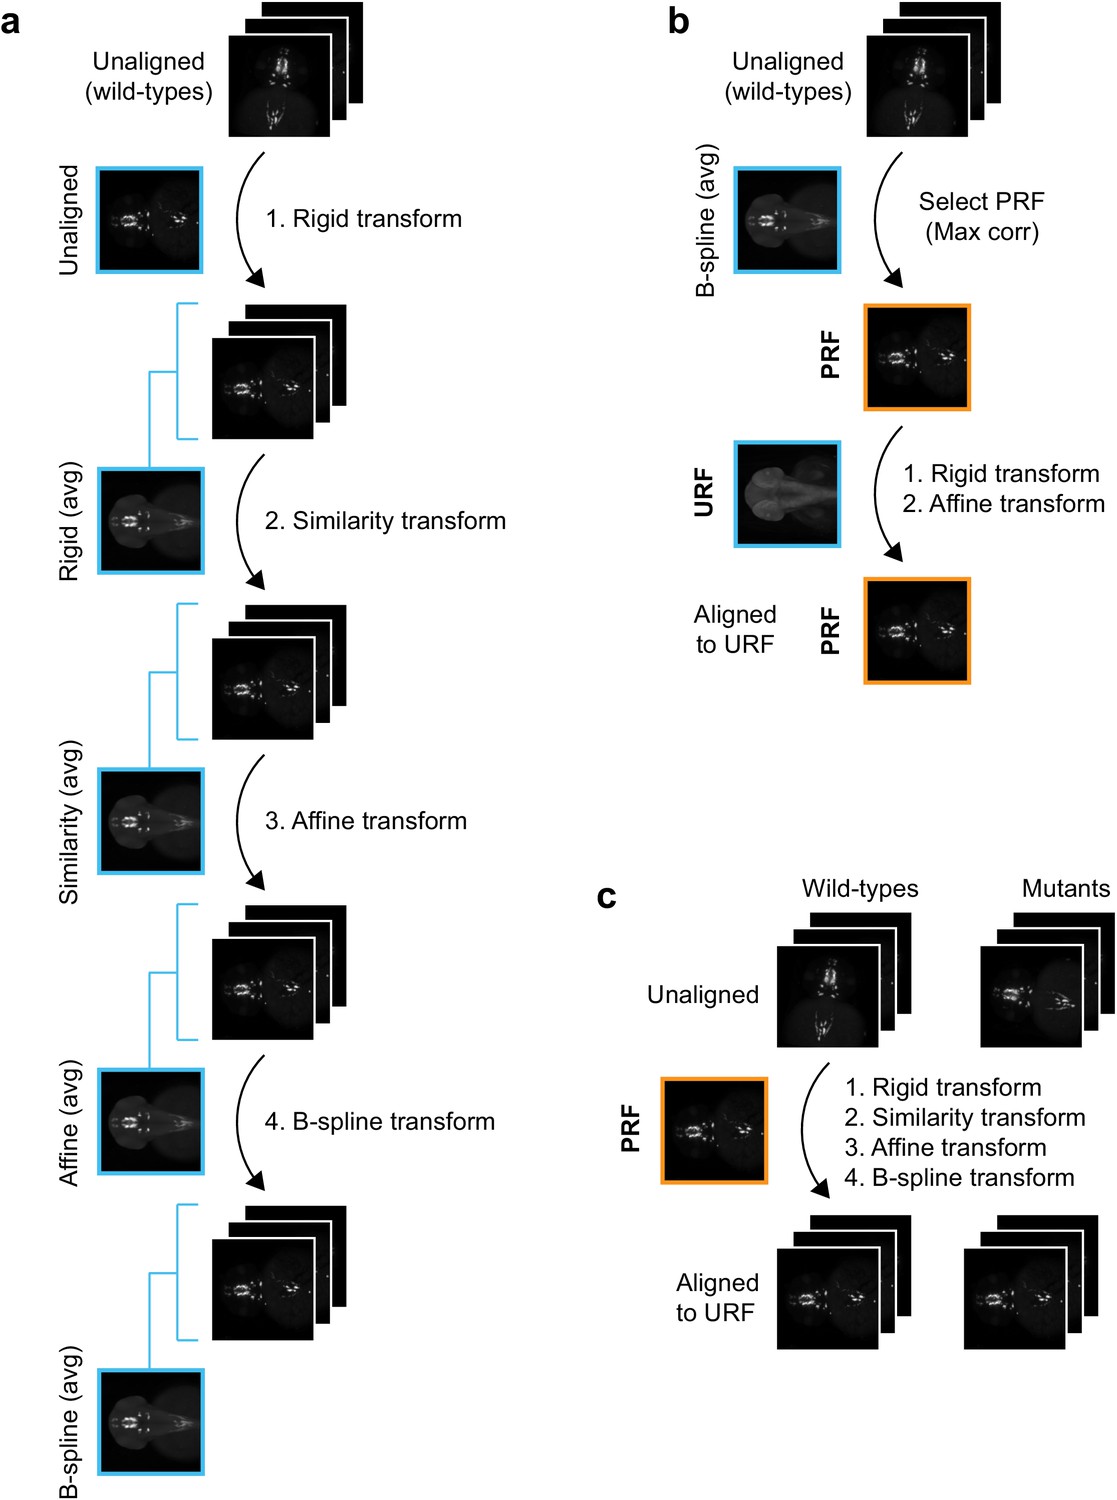
(A) Iterative shape averaging is used to select probe reference fish (PRF). All wild-type fish from the same age stained with the same probe (8+) are aligned in the green channel. The initial alignment is done using a rigid transform and an average fish is created from the aligned images. In the next round of registration, all embryos are aligned to the rigid average using a similarity transform. A new average is created from the aligned images and the process is repeated with an affine transform and finally a deformable B-spline transform. (B) The individual wild-type embryo with the highest correlation (max corr) to the B-spline average is chosen as the PRF. The PRF is aligned to the unstained reference fish (URF) and thereby to the anatomical brain atlas with rigid and affine transforms in the blue channel. (C) All wild-type and mutant embryos from the same age stained with the same probe are aligned to the PRF with rigid, similarity, affine, and finally B-spline transformations in the green channel.
Figure 1—figure supplement 4
alternate registration workflow for in situ pattern alignment.
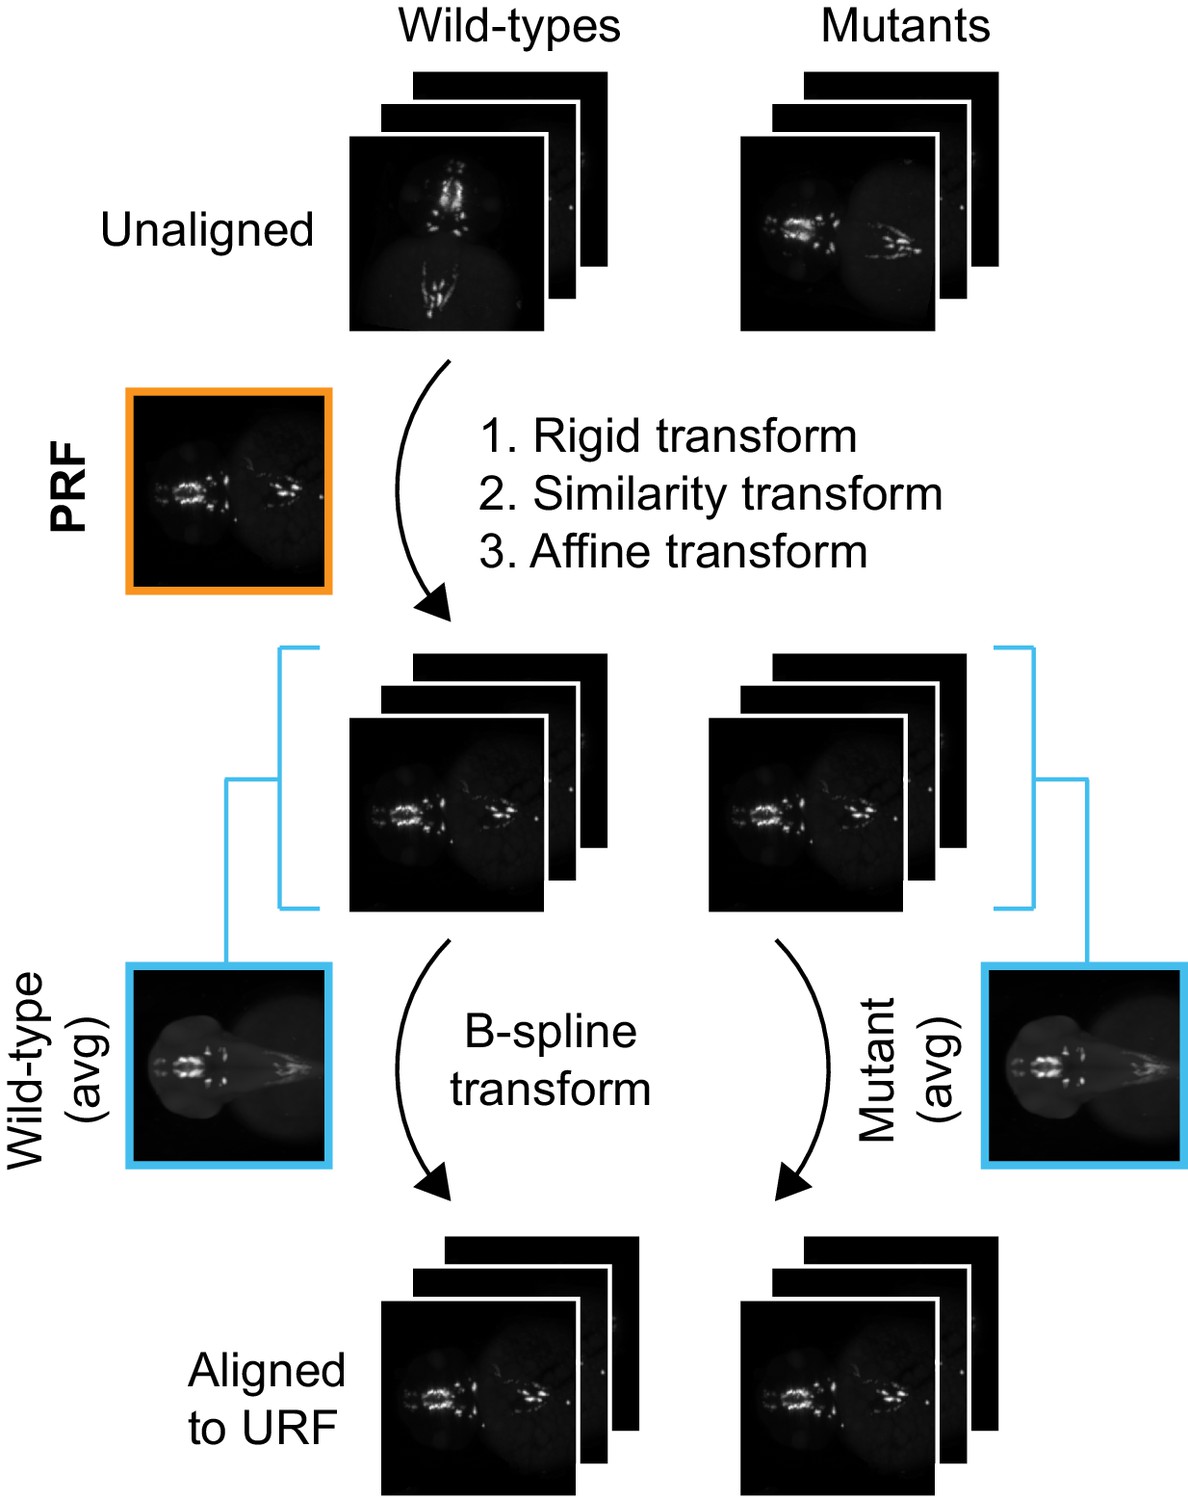
A wild-type probe reference fish (PRF) is selected using iterative shape averaging following the workflow in Figure 1—figure supplement 3A,B. All wild-type and mutant embryos from the same age stained with the same probe are then registered to the PRF with rigid, similarity, and affine transformations in the green channel. To avoid deforming mutant gene expression patterns to more closely resemble wild-type gene expression patterns, separate mutant and wild-type reference fish are generated for the final non-linear B-spline transform. This is done by creating an average wild-type and an average mutant reference from the affine aligned images. All wild-type and mutant embryos are then registered to the appropriate reference with a B-spline transform.
Figure 2
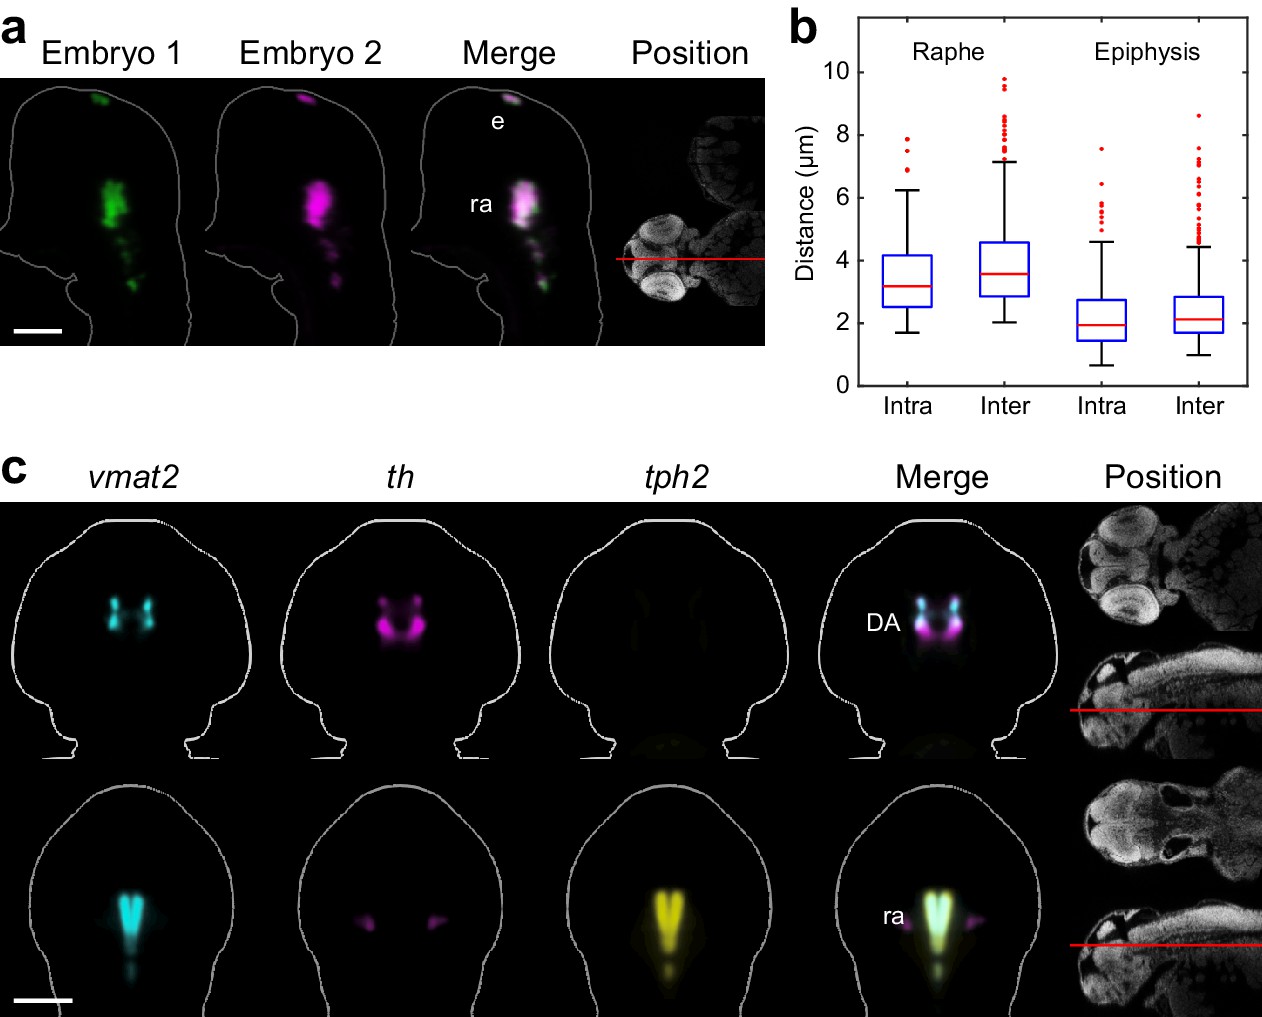
Automated registration and alignment of 3D WISH images.
(A) Alignment accuracy of 3D registration algorithms was verified using 26 wild-type embryos stained with tryptophan hydroxylase 2 (tph2). Stained embryos are randomly divided into three groups and all groups are independently registered to the common reference. The overlay analysis shows two representative embryos from separate registration groups. The position and orientation of each 2D slice within the embryo is indicated on the Nissl-stained two photon reference image to the right. Anterior is to the top. (B) Registration accuracy was quantified by manually segmenting tph2 expression domains in all three independent groups and calculating the average distance between every border voxel in the segmentation. For the hindbrain expression domain in the raphe nuclei (ra), the intra-group registration accuracy is 3.5 µm and the inter-group accuracy is 4.0 µm. For the epiphysis (ep) expression domain, the intra-group accuracy is 2.3 µm and the inter-group accuracy is 2.5 µm. Box-and-whisker plots show results of intra- and inter-group border distance measurements. Tops and bottoms of each box represent the 25th and 75th percentiles of the samples, respectively. Whiskers are drawn from the ends of the interquartile ranges to the furthest observations that fall within ±1.5 times the interquartile range away from the top or bottom of the box. The line in the middle of each box is the sample median. Observations beyond the whisker length are marked as outliers (+ sign). (C) Virtual co-registration of vesicular monoamine transporter 2 (vmat2), tyrosine hydroxylase (th), and tryptophan hydroxylase 2 (tph2) in wild-type embryos at 2 dpf showing patterns of colocalization in the raphe nuclei and dopaminergic (DA) clusters. All 3D reconstructions are generated by averaging eight or more embryos per experimental group. For transverse planes (upper) dorsal is to the top; for frontal planes (lower) anterior is to the top. The position and orientation of each 2D slice within the embryo is indicated on the Nissl-stained two photon reference image to the right of the panel. Scale bar: 100 μm.
Figure 3 with 4 supplements
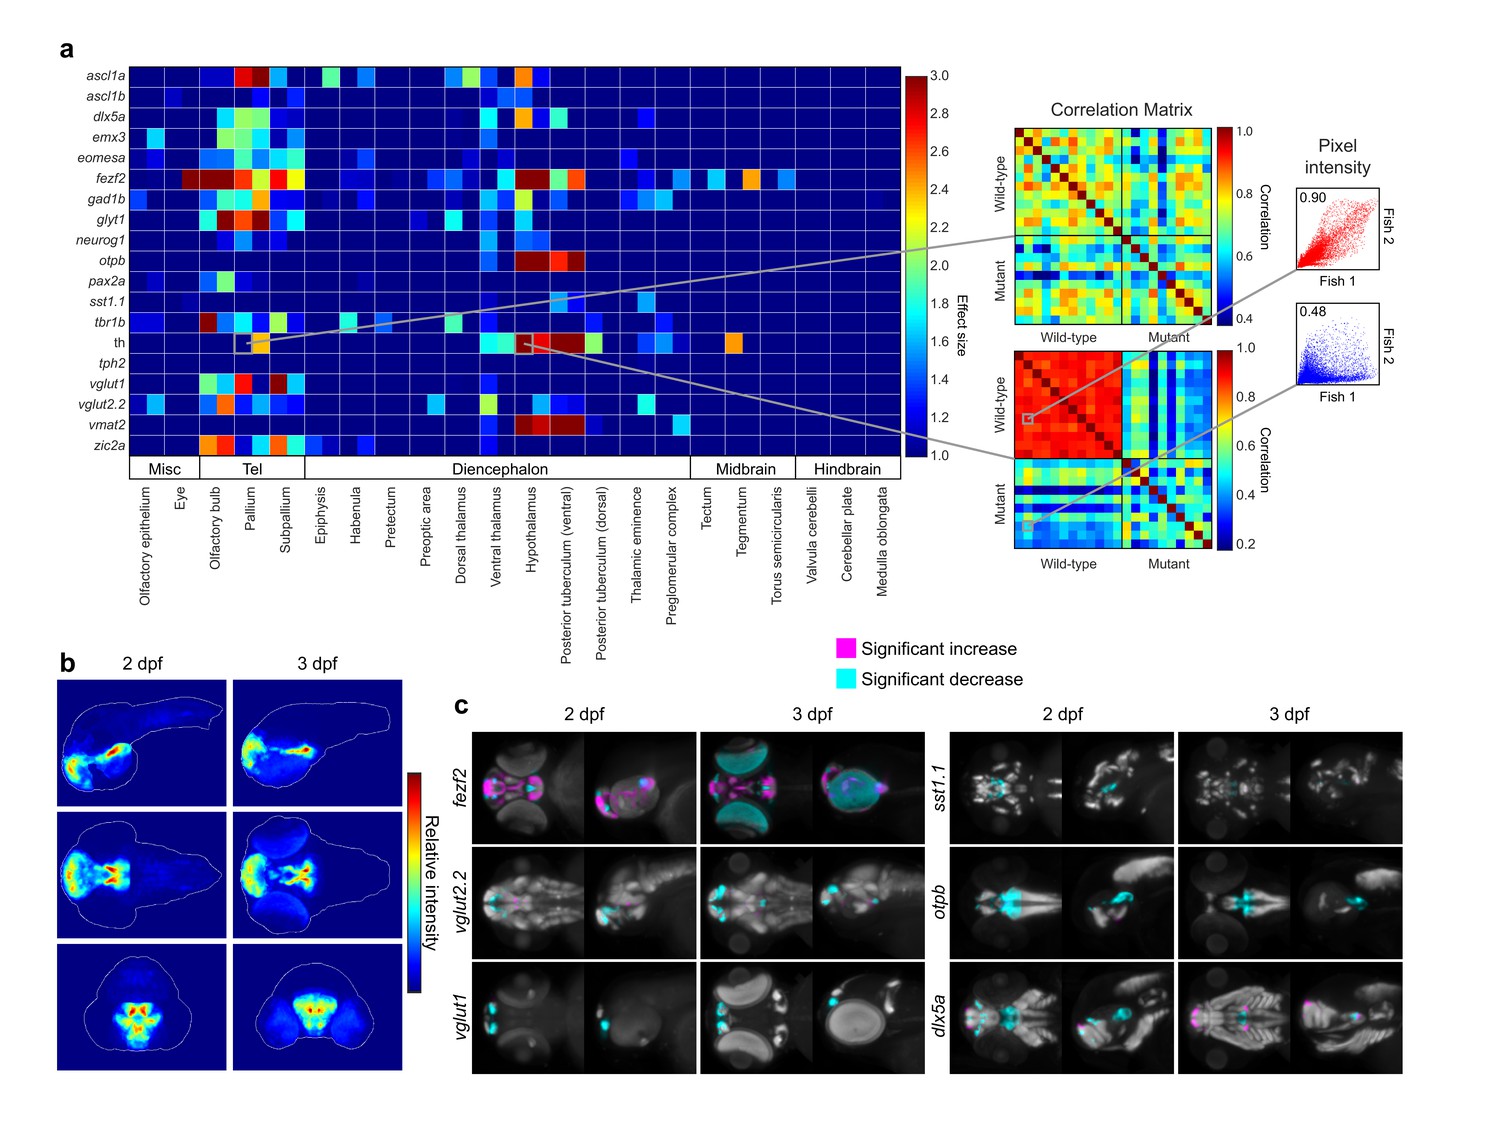
Automated detection and statistical quantification of fezf2 mutant deficits.
(A) Right: alterations in the expression of individual probes can be detected using a correlation-significance analysis approach. For each brain region, all wild-type embryos are compared with each other and with all mutant embryos, creating a correlation matrix. The Pearson correlation coefficient is calculated for each embryo pair based on the intensities of corresponding voxels. For probes with altered expression patterns in fezf2 mutants, correlation within groups (i.e. wild-type vs. wild-type and mutant vs. mutant) is significantly greater than correlation between groups. Scatterplots to the right of the correlation matrix illustrate embryo pairs with correlated (red; r = 0.9) and uncorrelated (blue; r = 0.5) expression. Left: Automated Correlation Analysis plot showing results for all in situ probes in all brain regions at 2 and 3 dpf. For each region, 2 dpf results are shown in the left square and 3 dpf in the right. Dark blue squares indicate no significant difference between wild-type and mutant embryos (p<10−5). For regions with a significant difference, the color bar represents the effect size (d > 1) of the difference. (B) Regions in which the expression patterns of multiple independent probes have been altered can be visualized using aggregate difference imaging. Pixel intensity difference is calculated between wild-types and mutants for each probe within each affected brain region. Summing the absolute value of the significant differences for all probes highlights areas which are most altered in fezf2 mutants. Aggregate difference images are shown at 2 and 3 dpf in lateral (upper panels), dorsal (middle panels), and anterior (lower panels) views. Telencephalon, t; ventral diencephalon, vd. (C) Significance analysis overlaid on maximum Intensity Projections (MIPs). MIPs have been color coded to highlight all regions in which the expression of a given probe is significantly reduced (cyan) or increased (magenta) in mutant embryos (p<0.5×10⁻³). Significant intensity differences between mutants and wild-types were determined by performing a Mann-Whitney U-test to compare corresponding voxels for each probe within each brain region showing alterations in Automated Correlation Analysis. All MIPs show dorsal (left) and lateral (right) views. (B,C) Anterior is to the left, dorsal is to the top.
Figure 3—figure supplement 1
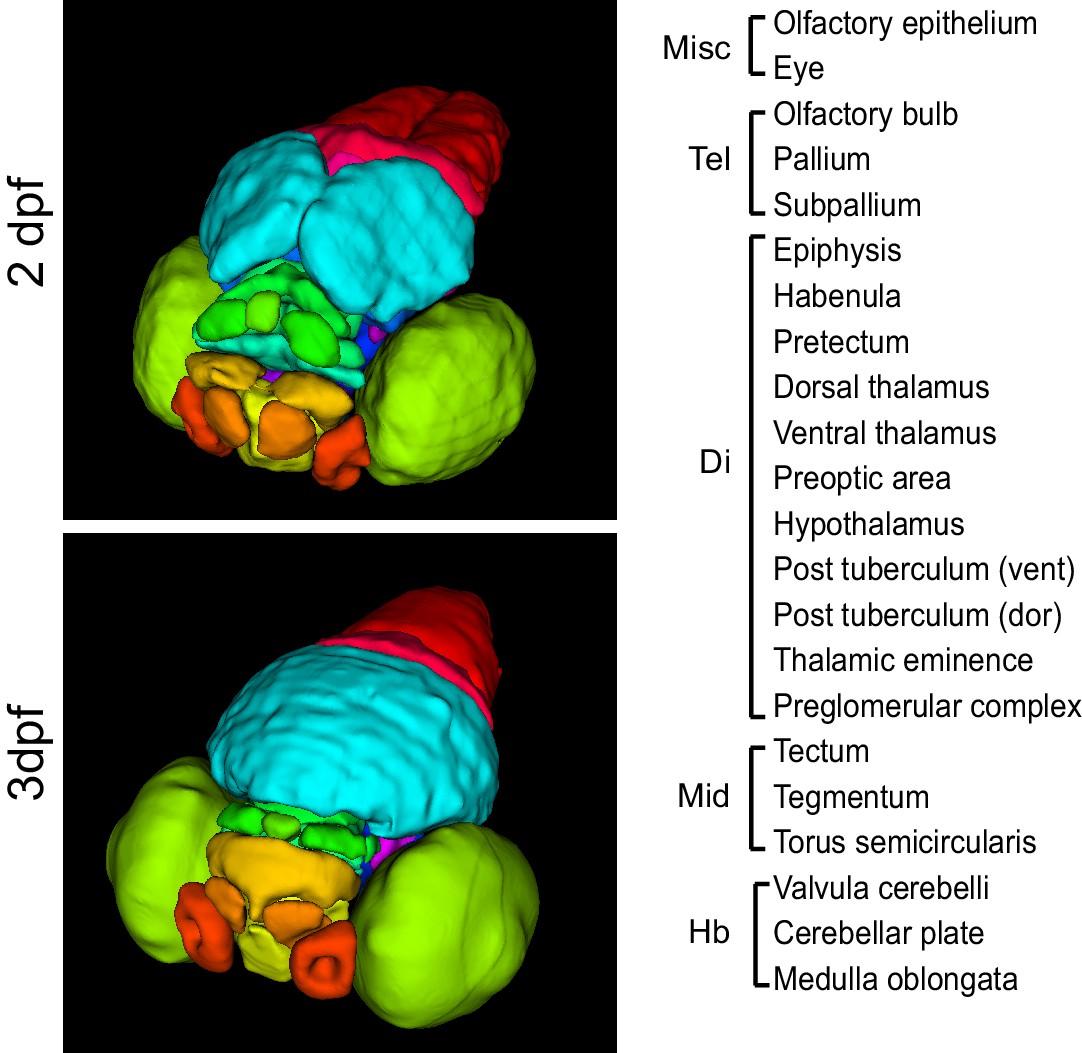
3D anatomical brain atlases.
Surface renderings of all regions in the 2 dpf (top) and 3 dpf (bottom) 3D anatomical zebrafish brain atlases. Both atlases comprise all 22 regions listed at right. Regions are subdivided between the telencephalon (Tel), diencephalon (Di), midbrain (Mid), and hindbrain (Hb).
Figure 3—figure supplement 2

Expression data mapped to brain regions.
Quantification of expression data for all probes mapped to all brain regions at 2 dpf (left) and 3 dpf (right). Expression data are visualized using a method developed for the Virtual Brain explorer(Ronneberger et al., 2012) that combines both volumetric data and information on signal intensity. Color represents relative stain intensity (see the colormap to the right) and the fraction each square covered by a given color represents the fraction of the brain region expressing the marker at that relative intensity.
Figure 3—figure supplement 3
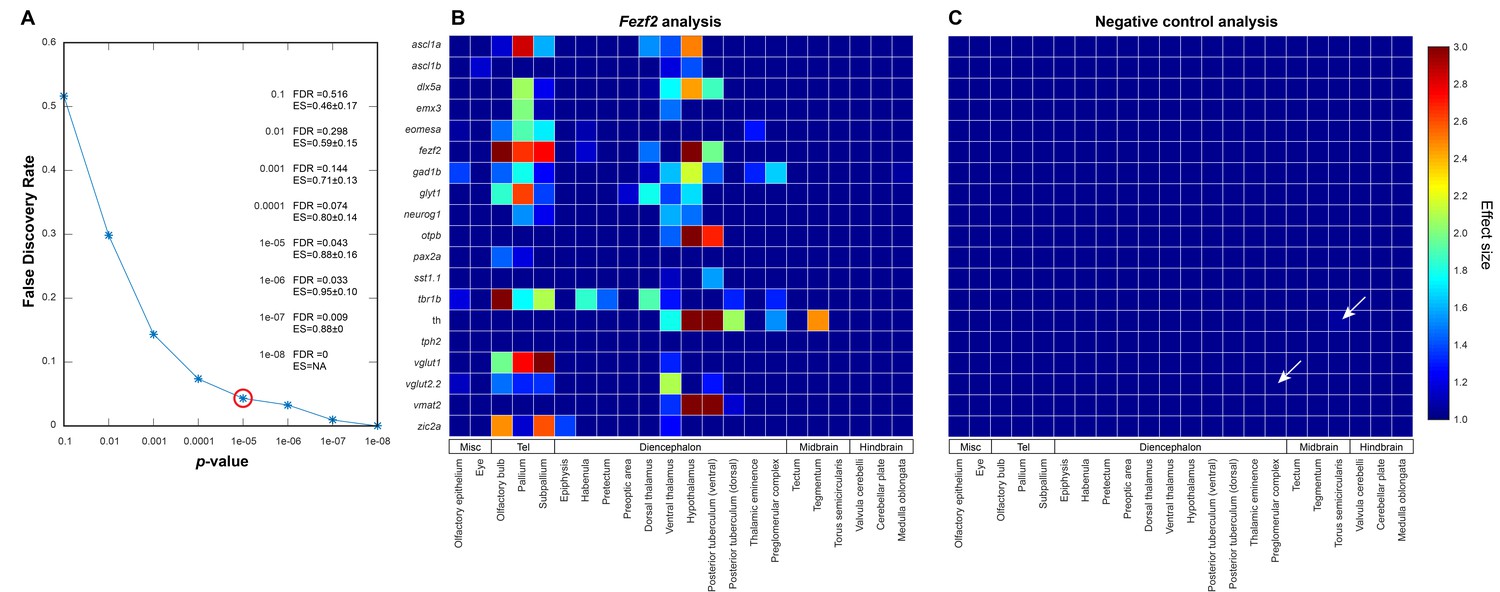
Negative controls for automated 3D phenotyping.
(A) A null data set, consisting of 16+ negative control embryos (i.e. age-matched siblings that are either genetically wild-type or heterozygous for the fezf2 mutation) per probe, is used to define the false discovery rate (FDR) for Automated Correlation Analysis over a range of thresholds. Following in situ staining, negative control embryos are randomly divided into two separate groups and analyzed as in Figure 3A. We then evaluate significance thresholds (t) ranging from p=10−1 to 10−8 by counting the number of experimental scores (sexp; i.e. wild-types vs. fezf2 mutants) ≥ t and the number of null scores (snull; i.e. negative control group one vs. negative control group 2) ≥ t and calculating the FDR (snull/sexp). Both experimental and null data sets comprise 418 scores (19 in situ probes analyzed over 22 brain regions). Based on this analysis, we chose p<10−5 (red circle; FDR = 0.043) as an appropriate threshold for Automated Correlation Analysis. Additionally, since the mean effect size (ES; Cohen’s d) is <1.0 in the null data set for all significance thresholds evaluated, d > 1.0 was set as an additional requirement for subsequent analysis. Incorporating an effect size requirement reduces the FDR for p<10−5 from 0.043 to 0.020. (B–C) Automated Correlation Analysis showing the results from all brain regions when (B) wild-type embryos are compared with fezf2 mutants (‘fezf2 analysis’) and (C) when the two negative control groups are compared with each other (‘negative control analysis’). Dark blue squares indicate no significant difference in expression between the wild-type groups (p<10−5). For regions with a significant difference, the color bar represents the effect size (d > 1) of the difference. In the negative control plot, white arrows indicate regions that meet the p<10−5 threshold and have an effect size d > 1.
Figure 3—figure supplement 4
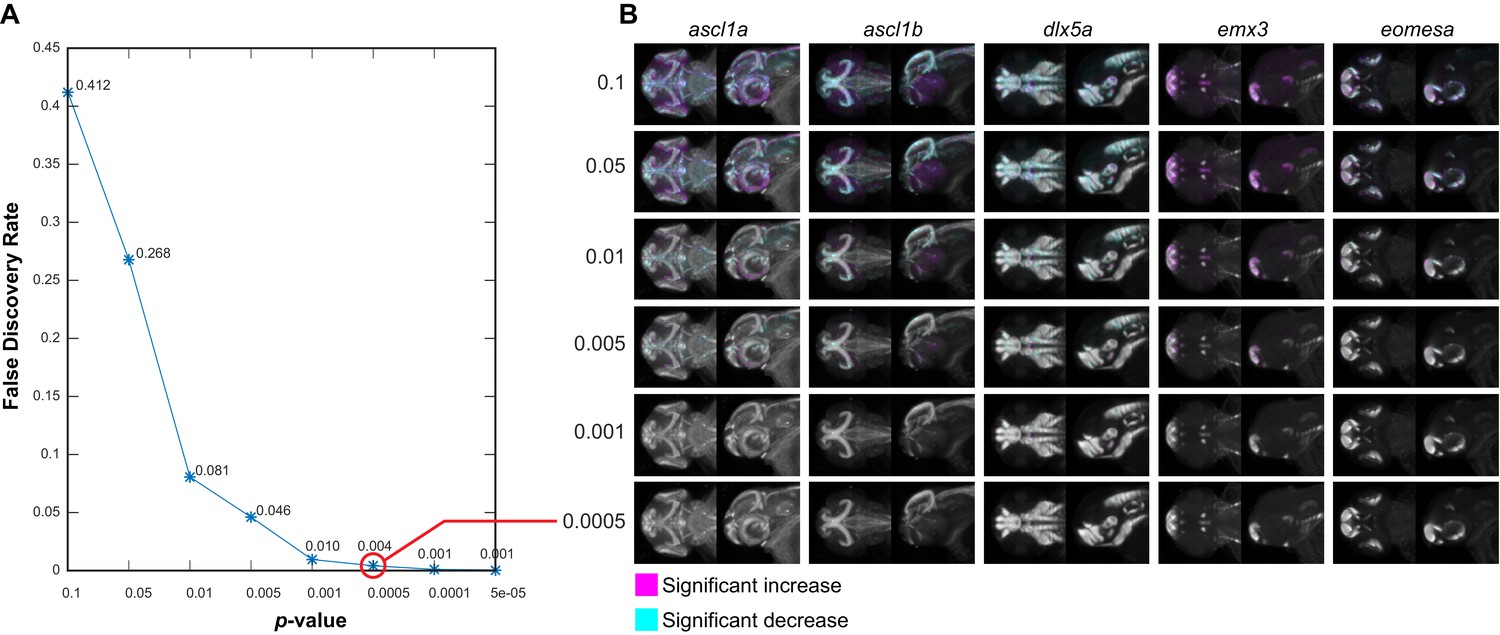
Negative controls for maximum intensity projections.
(A) The null data set from Figure 3—figure supplement 3A is used to define the false discovery rate (FDR) for significance analysis of maximum intensity projections (MIPs) over a range of p-value thresholds. We perform a Mann-Whitney U test to compare corresponding voxels between the two negative control groups for each probe within each brain region that shows alterations based on Automated Correlation Analysis of the fezf2 mutant (Figure 3—figure supplement 3B). We then evaluate significance thresholds (t) ranging from p=0.1 to 5e-05 by counting the number of experimental scores (sexp; wild-types vs. fezf2 mutants) ≥ t and the number of null scores (snull; negative control group one vs. negative control group 2) ≥ t and calculating the FDR (snull/sexp). Both experimental and null data sets comprise 1,962,771 scores (i.e. the total number of voxels in all brain regions that are significantly altered in fezf2 mutants for each of the 19 in situ probes). Based on this analysis, we chose p<0.5×10⁻³ (red circle; FDR = 0.004) as an appropriate threshold for voxelwise analysis. (B) MIPs for the first five in situ probes in our library have been color coded to highlight voxels in which expression is significantly reduced (cyan) or increased (magenta) between the two negative control groups at the indicated threshold. Note that at the threshold chosen for voxelwise analysis of experimental data (p<0.5×10⁻³), virtually no significant voxels are visible by eye. All MIPs show dorsal (left) and lateral (right) views. Anterior is to the left, dorsal is to the top.
Figure 4 with 1 supplement
Automated phenotyping uncovers known and novel diencephalic deficits in fezf2 mutants.
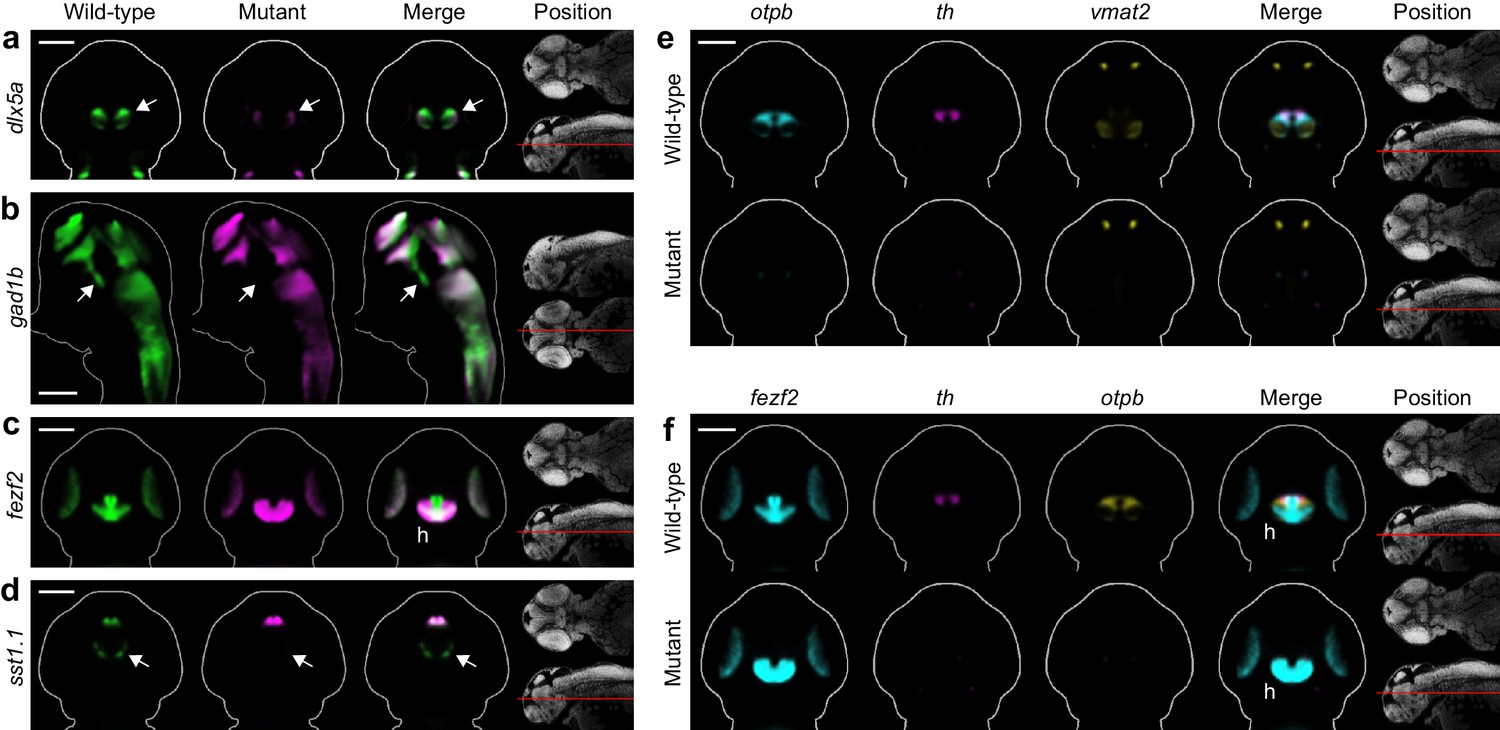
(A–D) Overlay analysis of in situ expression patterns in wild-type and fezf2 mutant embryos at 2 dpf. Wild-type expression patterns are shown in green and fezf2 mutants are shown in magenta. Expression of the GABAergic markers dlx5a (A) and gad1b (B) is substantially reduced (arrow) in the ventral diencephalon. (C) The fezf2 expression domain is dramatically altered in the posterior hypothalamus (h). (D) A bilateral cluster of sst1.1-expressing cells (arrow) is lost in the ventral diencephalon. Other clusters are unaffected. (E–F) Multi-probe co-expression analysis of ventral diencephalic deficits in fezf2 mutants. (E) Virtual co-registration showing loss of otpb, th, and vmat2 expression domains in the ventral diencephalon. (F) Virtual co-registration showing spatial relationships between affected fezf2, th, and otpb expression domains in the posterior hypothalamus. (A–F) All 3D reconstructions are generated by averaging eight or more embryos per experimental group. The position and orientation of each 2D slice within the embryo is indicated on the Nissl-stained two photon reference image to the right of the panel. For sagittal and frontal sections anterior is to the top; for transverse sections dorsal is to the top. Scale bar: 100 μm.
Figure 4—figure supplement 1
Additional diencephalon phenotypes in fezf2 mutant embryos.
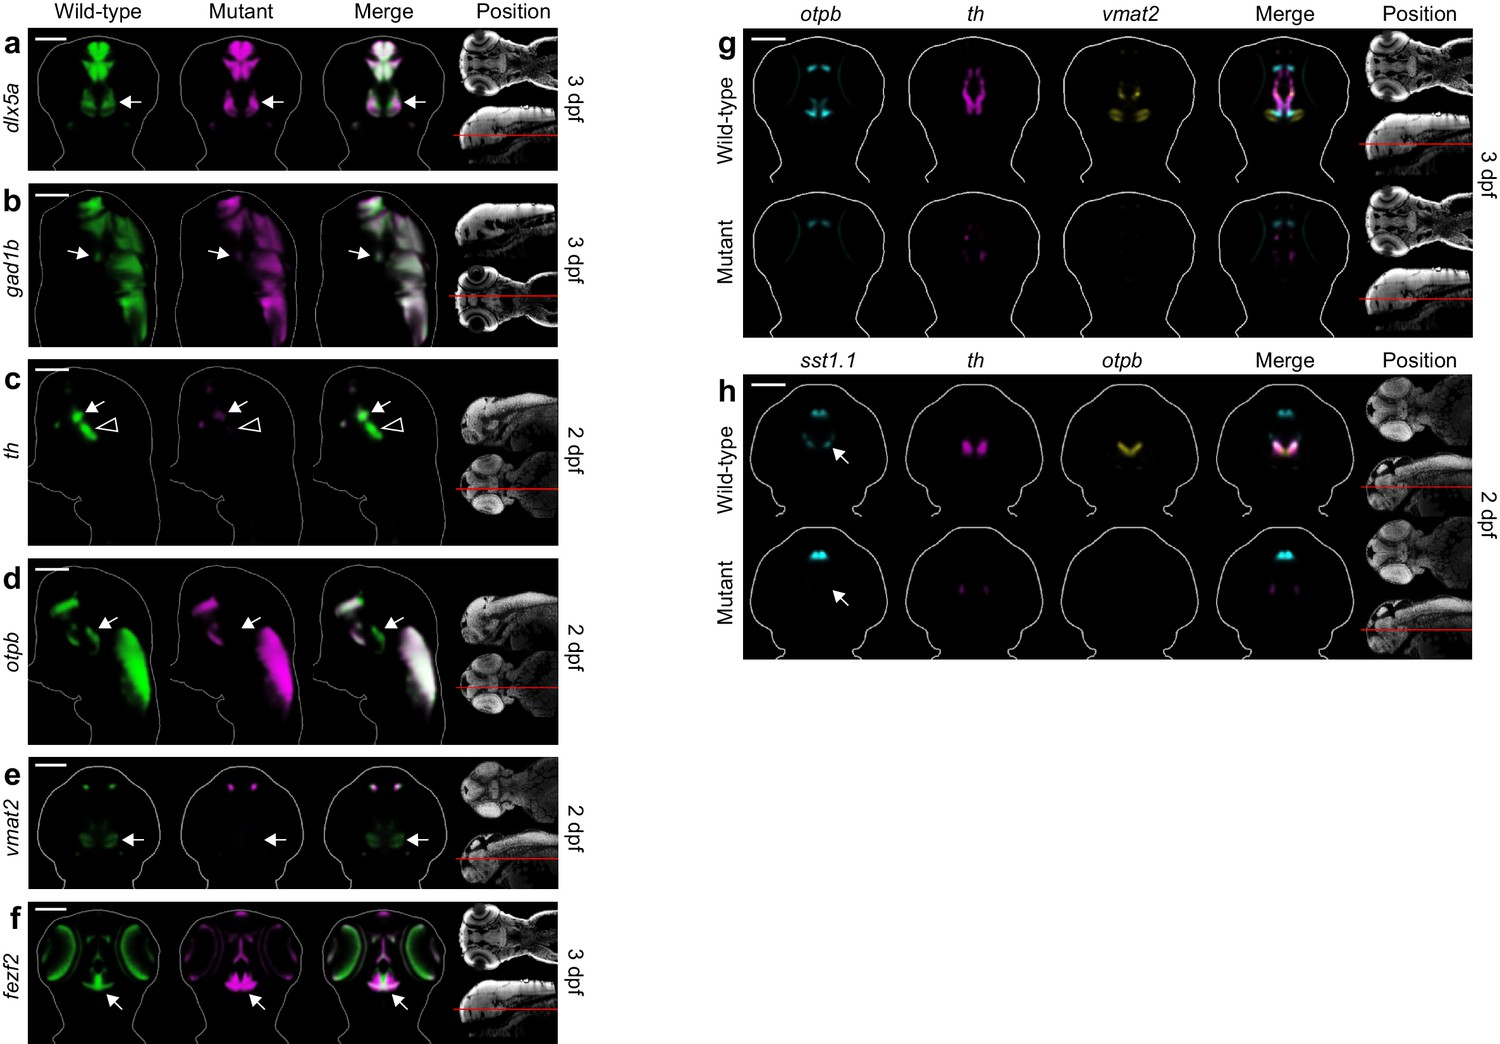
(A–F) Overlay analysis of in situ expression patterns in wild-type and fezf2 mutant embryos at 2 and 3 dpf. Wild-type expression patterns are shown in green and fezf2 mutants are shown in magenta. Expression of the GABAergic markers dlx5a (A) and gad1b (B) begins to recover in the ventral diencephalon (arrows) of mutant embryos at 3 dpf (compare with Figure 4A,B). (C) th expression is significantly reduced in the dopaminergic (DA) clusters of the ventral diencephalon, with posterior clusters (open arrowheads) appearing to be more strongly affected than anterior clusters (arrows). (D) Expression of the otpb transcription factor is lost in the ventral posterior tuberculum and posterior hypothalamus (arrows) but persists in other brain regions. (E) Vmat2 expression is lost in DA clusters of the ventral diencephalon (arrows). (F) The fezf2 expression domain is dramatically altered in the posterior hypothalamus (arrow) and is substantially reduced in the retina at 3 dpf (but note that retinal expression appears normal at 2 dpf; Figure 4C) (G–H) Multi-probe co-expression analysis of ventral diencephalic deficits in fezf2 mutants. (G) Virtual co-registration showing spatial relationships between affected otpb, th, and vmat2 expression domains in the ventral diencephalon at 3 dpf. (H) The sst1.1-expressing clusters lost in fezf2 mutants (arrow) partially overlap with optb in the hypothalamus and are either intermingled with or located just lateral to th-expressing DA clusters. (A–H) All 3D reconstructions are generated by averaging eight or more embryos per experimental group. The position and orientation of each 2D slice within the embryo is indicated on the Nissl-stained two photon reference image to the right of the panel. Scale bar: 100 μm.
Figure 5 with 2 supplements
Fezf2 mutants exhibit telencephalic glutamatergic deficits during early development.
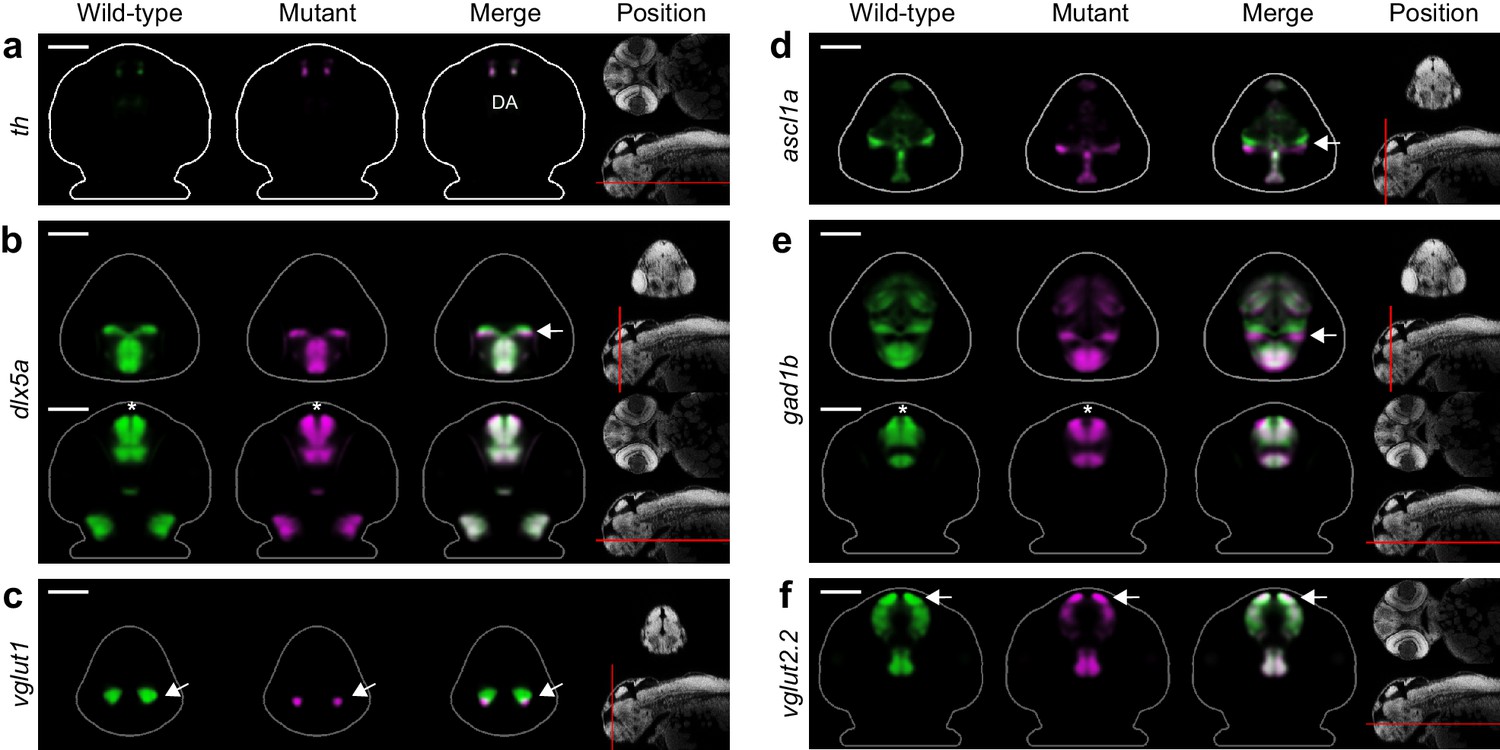
(A–F) Overlay analysis of in situ expression patterns in wild-type and fezf2 mutant embryos at 2 dpf. Wild-type expression patterns are shown in green and fezf2 mutants are shown in magenta. (A) Expression of th is largely unaffected in dopaminergic (DA) clusters of the telencephalon. (B) Expression of the GABAergic marker dlx5a is shifted ventrally in the diencephalon (arrow) and is away from the midline in the telencephalon (asterisk), but is not significantly reduced. (C) Expression of the glutamatergic marker vglut1 is substantially reduced in the telencephalon (arrow). (D) Expression of the progenitor marker ascl1a is shifted ventrally (arrow) and compressed along the dorsoventral axis of the telencephalic midline. (E) Expression of the GABAergic marker gad1b is shifted ventrally in the diencephalon (arrow) and is away from the midline in the telencephalon (asterisk), but is not significantly reduced. (F) Expression of the glutamatergic marker vglut2.2 is substantially reduced in the telencephalon (arrow). (A–F) The position and orientation of each 2D slice within the embryo is indicated on the Nissl-stained two photon reference image to the right of the panel. For frontal sections anterior is to the top; for transverse sections dorsal is to the top. Scale bar: 100 μm.
Figure 5—figure supplement 1
Additional telencephalon phenotypes in fezf2 mutant embryos.
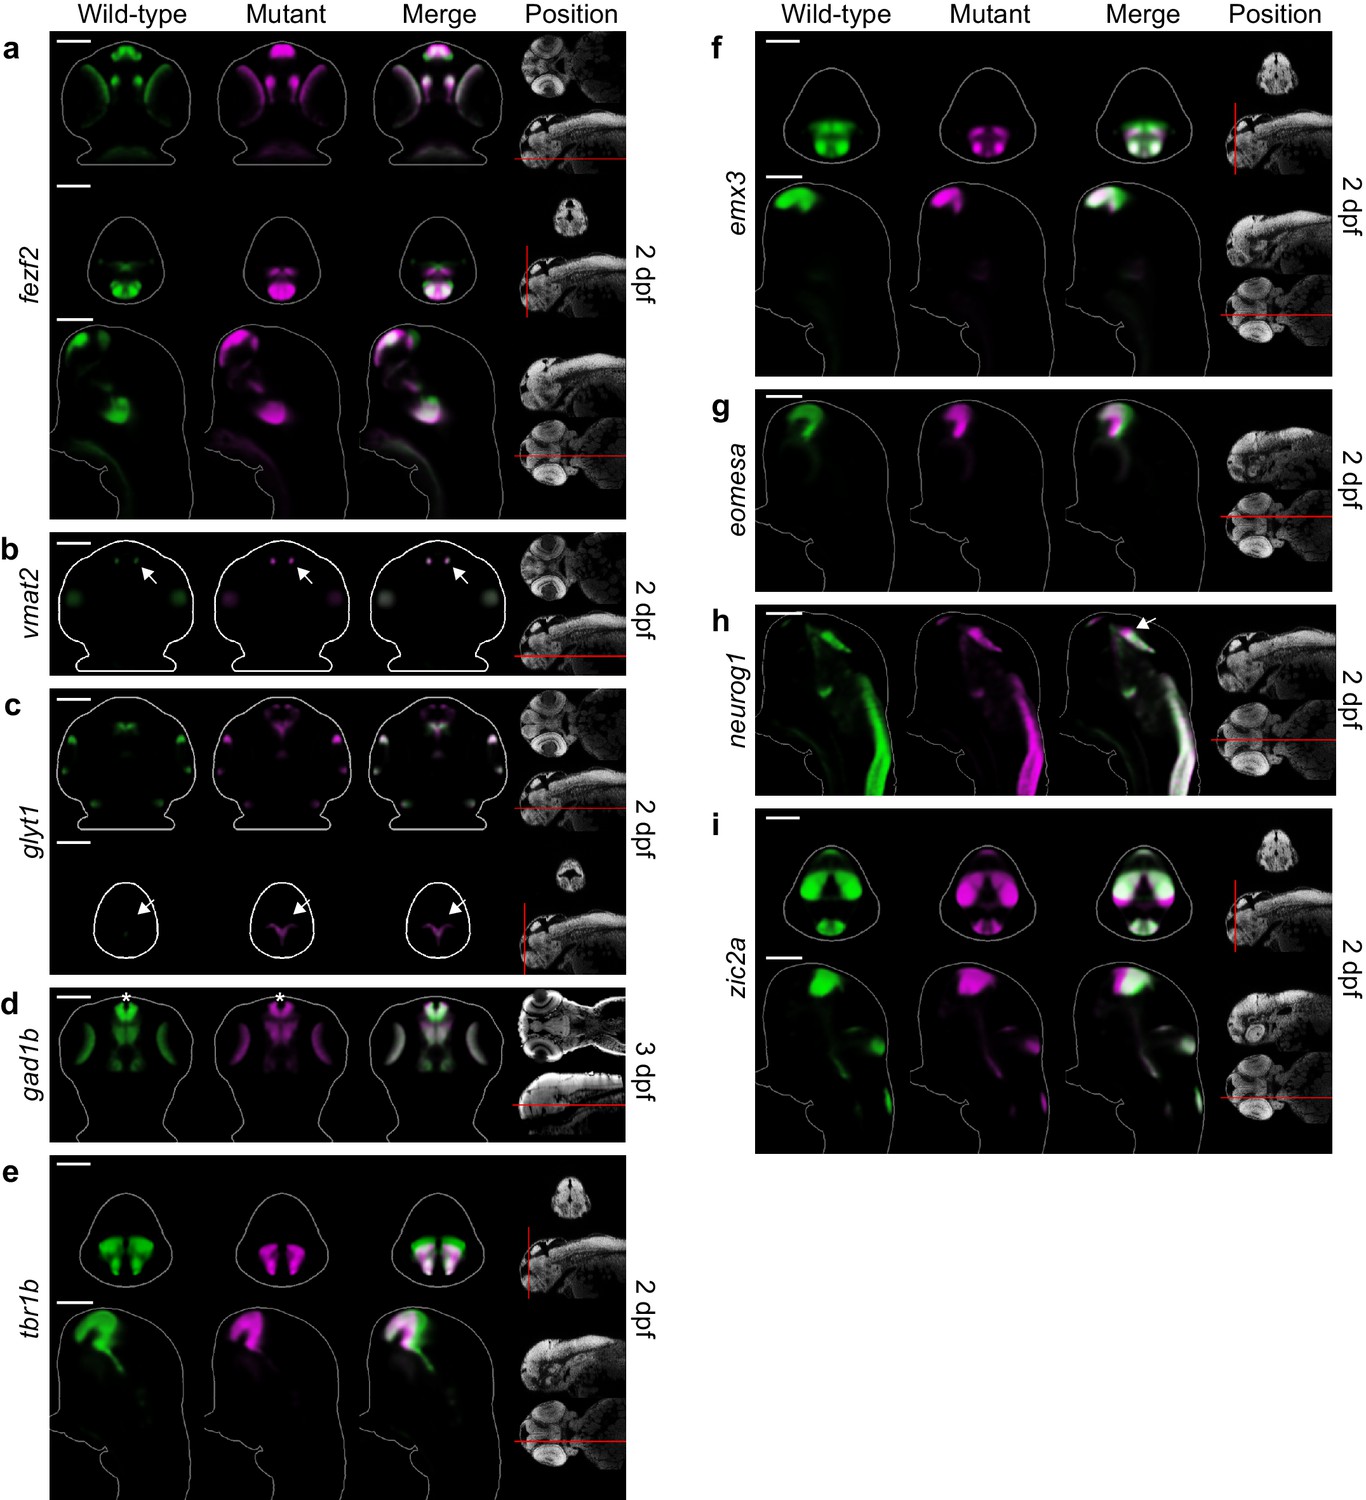
(A–I) Overlay analysis of in situ expression patterns in wild-type and fezf2 mutant embryos at 2 and 3 dpf. Wild-type expression patterns are shown in green and fezf2 mutants are shown in magenta. All 3D reconstructions are generated by averaging eight or more embryos per experimental group. The position and orientation of each 2D slice within the embryo is indicated on the Nissl-stained two photon reference image to the right of the panel. Scale bar: 100 μm. (A) the fezf2 expression domain is highly disorganized in multiple regions of the diencephalon and telencephalon. (B) Vmat2 expression is largely unaffected in DA clusters of the telencephalon (arrow). (C) Expression of glyt1, a marker of astrocytic and glycinergic neuronal differentiation, is upregulated in the ventricular zone of the dorsal telencephalon (arrow). (D) Telencephalic expression of the GABAergic marker gad1b undergoes a shift away from the midline in mutant embryos (asterisk) but is not significantly reduced. (E) Expression of tbr1b, a transcription factor that plays an essential role in specifying glutamatergic pyramidal neurons, is significantly reduced. (F) Expression of emx3, a transcription factor that is broadly expressed within the telencephalon, is significantly reduced. (G) Expression of the neural progenitor marker eomesa is substantially reduced. (H) The neural progenitor marker neurog1 undergoes an anterior shift in regions of the diencephalon that closely neighbor the telencephalon (arrow). (I) The neural progenitor marker zic2a is shifted ventrally and possibly expanded in the dorsal telencephalon and surrounding regions.
Figure 5—figure supplement 2
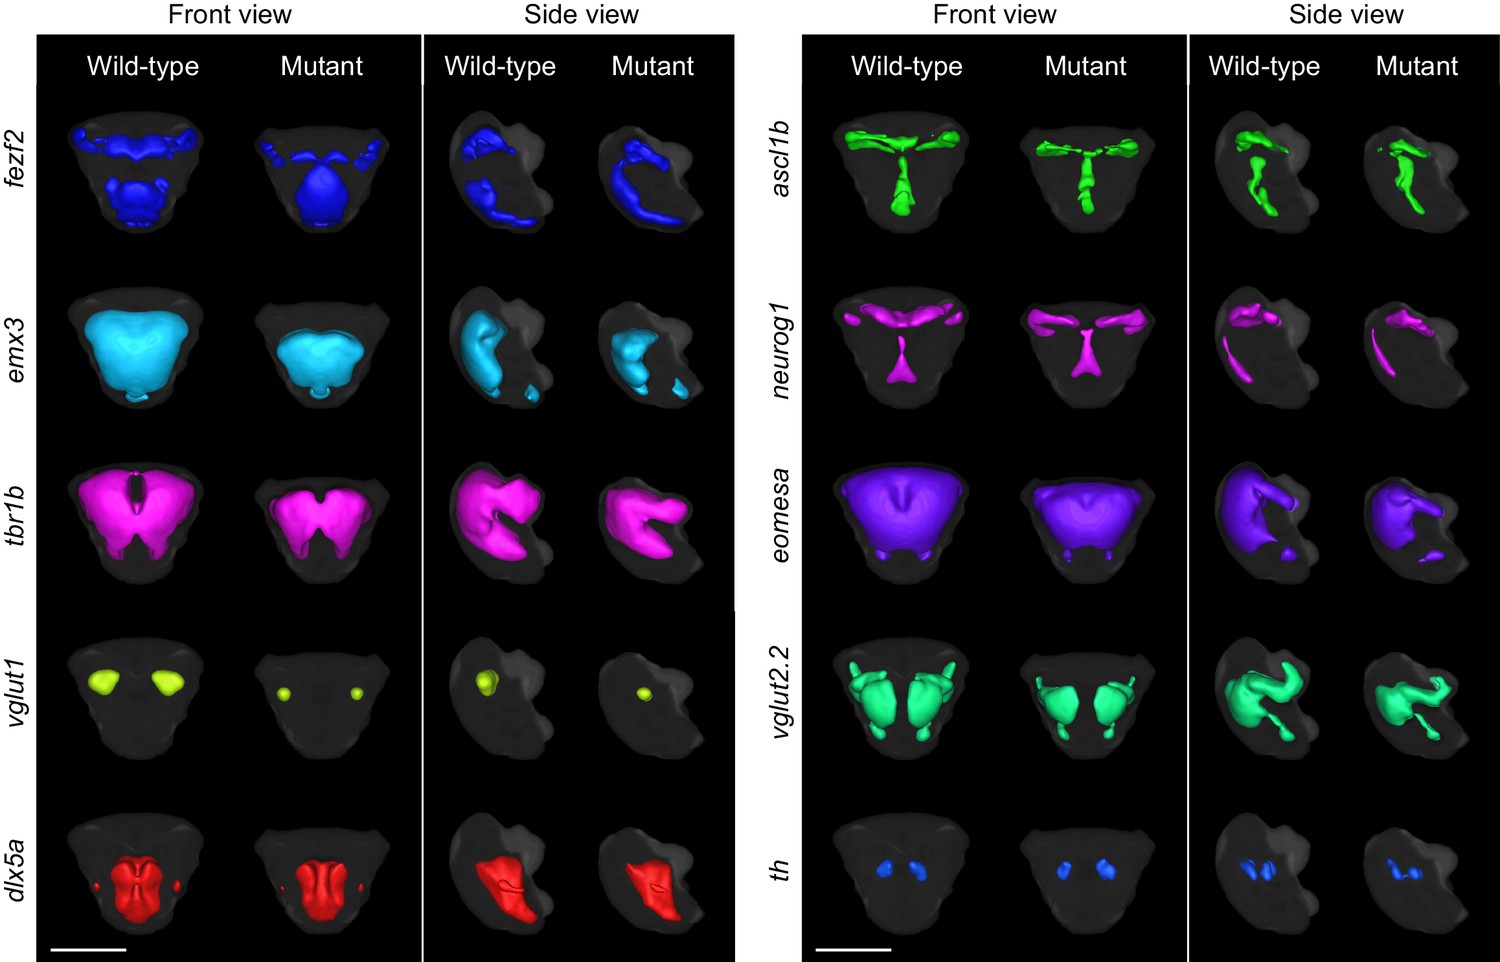
3D segmentations of telencephalic expression domains.
3D segmentations of gene expression domains within and immediately adjacent to telencephalon at 2 dpf are generated in a semi-automated manner using adaptive thresholding. The gray background segmentation represents the union of telencephalic segmentations for all probes in the library and serves as an estimation for the outline for the telencephalon. Segmentations were generated from averaged 3D reconstructions. All segmentations are shown in front view (dorsal is to the top) and side view (anterior is to the left) for both wild-type and fezf2 mutant embryos. Scale bar: 100 μm.
Figure 6 with 1 supplement
Segmentation and volume measurements.
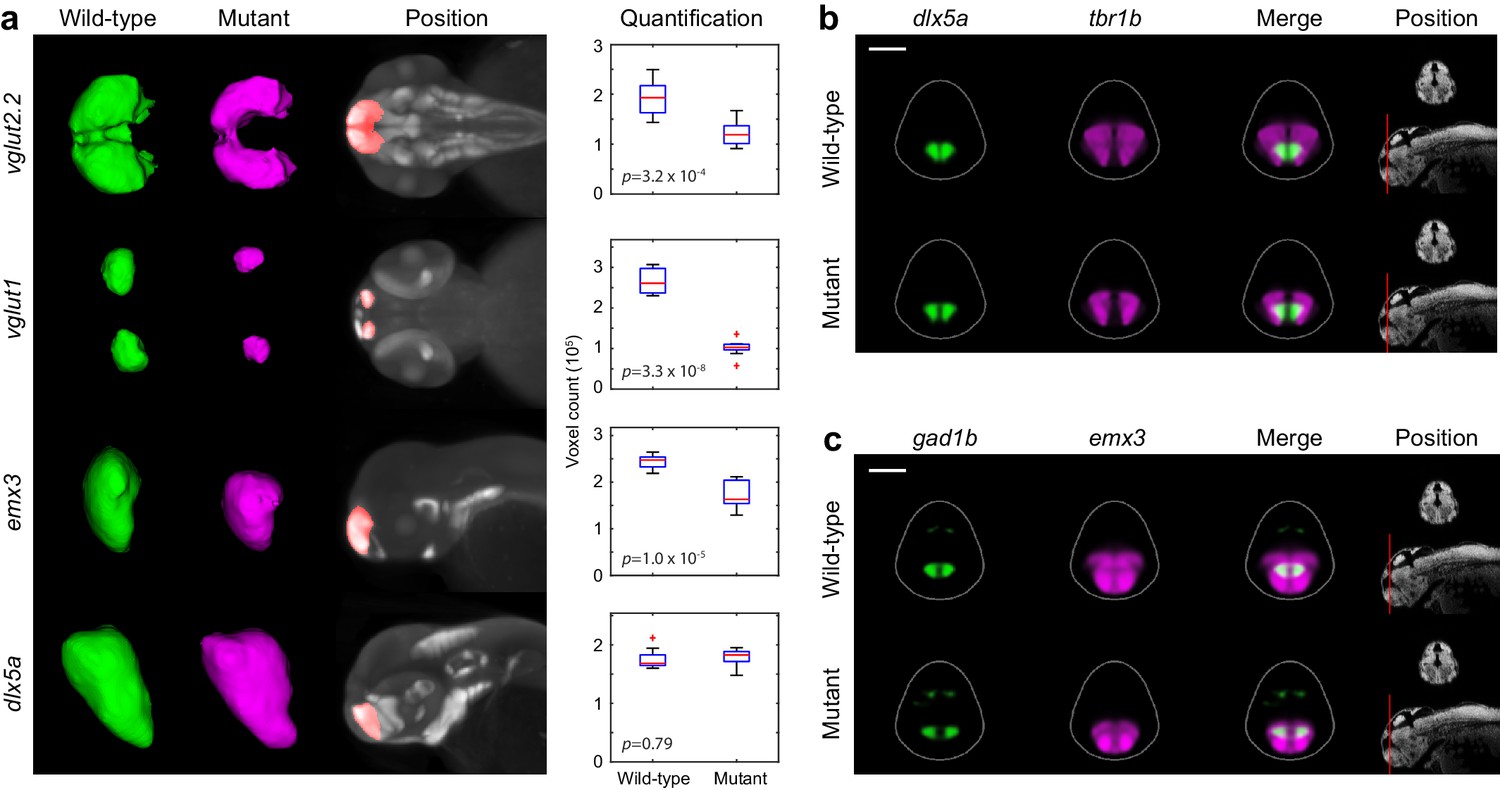
(A) 3D segmentations and volumetric quantification of gene expression domains in the telencephalon of wild-type (green) and fezf2 mutant (magenta) embryos at 2 dpf. 3D segmentations are done independently on eight or more embryos per experimental group; averaged wild-type and mutant segmentations are shown. Position of 3D segmentations is indicated on maximum intensity projections. Box-and-whisker plots show volume measurements from 3D segmentations of the indicated probes within the telencephalon. Tops and bottoms of each box represent the 25th and 75th percentiles of the samples, respectively. Whiskers are drawn from the ends of the interquartile ranges to the furthest observations that fall within ±1.5 times the interquartile range away from the top or bottom of the box. The line in the middle of each box is the sample median. Observations beyond the whisker length are marked as outliers (+ sign). Statistical significance was determined by two-tailed t-test. Volume measurements used for box-and-whisker plots are available in Figure 6—source data 1. (B–C) Multi-probe co-expression analysis of telencephalic deficits in fezf2 mutants. The position and orientation of each 2D slice within the embryo is indicated on the Nissl-stained two photon reference image to the right of the panel. Dorsal is to the top. Scale bar: 100 μm.
-
Figure 6–source data 1
- https://doi.org/10.7554/eLife.23379.021
Figure 6—figure supplement 1
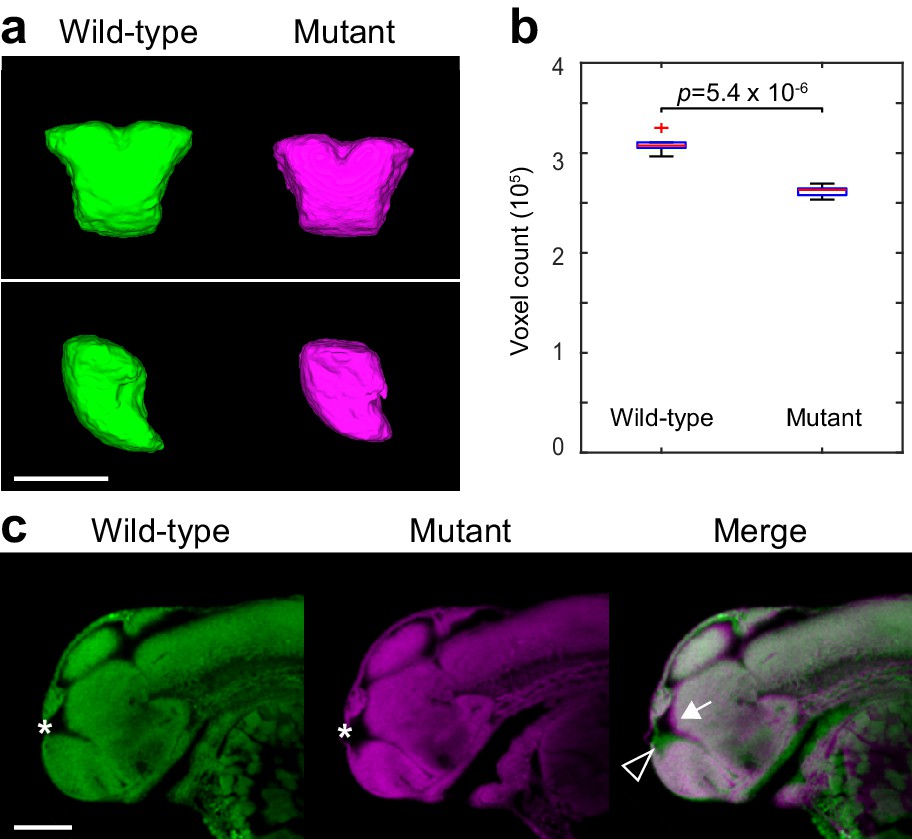
Two-photon analysis of telencephalon morphology.
(A) 3D segmentations of the telencephalon in 2 dpf Nissl-stained embryos. Six wild-type and six fezf2 mutant embryos from the same clutch were imaged using two-photon excitation microscopy and segmented manually based on anatomical landmarks. Averaged 3D segmentations are shown in front (top) and side (bottom) view. Dorsal is to the top. (B) Box-and-whisker plots showing results of volume measurements from 3D segmentations. Tops and bottoms of each box represent the 25th and 75th percentiles of the samples, respectively. Whiskers are drawn from the ends of the interquartile ranges to the furthest observations within the whisker length. The line in the middle of each box is the sample median. Observations beyond the whisker length are marked as outliers (+ sign). Statistical significance was determined by two-tailed t-test. Volume measurements used for box-and-whisker plots are available in Figure 6—source data 1. (C) Sagittal slices through averaged 3D reconstructions of Nissl-stained embryos showing reduced telencephalon volume (open arrowhead), enlarged ventricle (*), and concomitant anterior/ventral shift of the adjoining dorsal diencephalic regions (arrow). Anterior is to the left, dorsal is to the top. Scale bar: 100 μm.
Videos
Video 1
3D reconstruction of a wild-type 2 dpf embryo stained with tyrosine hydroxylase.
https://doi.org/10.7554/eLife.23379.007
Video 2
3D visualization of aggregate difference imaging at 2 days post fertilization.
Voxel intensity difference is calculated between wild-types and fezf2 mutants for each probe within each affected brain region. Summing the absolute value of the significant differences for all probes highlights phenotypic hotspots where multiple gene expression patterns are disrupted in mutant embryos.
Video 3
Visualization of vglut1 expression in wild-type and fezf2 mutant embryos.
The video shows overlay analysis of the vglut1 expression pattern in wild-types and mutants at 2 dpf. Wild-types are shown in green and mutants in magenta. The position and orientation of each 2D frontal slice within the embryo is indicated on the Nissl-stained two photon reference image to the left.
Additional files
-
Supplementary file 1
Whole mount in situ probe library.
All probes used for automated 3D phenotyping are listed along with the forward and reverse primers used in PCR cloning.
- https://doi.org/10.7554/eLife.23379.024
-
Supplementary file 2
Significance analysis overlaid on maximum Intensity projections (MIPs).
MIPs have been color coded to highlight all regions in which the expression of a given probe is significantly reduced (cyan) or increased (magenta) in mutant embryos (p<0.5 × 10⁻³). Significant intensity differences between mutants and wild-types were determined by performing a Mann-Whitney U-test to compare corresponding voxels for each probe within each brain region showing alterations in Automated Correlation Analysis. All MIPs show dorsal (left) and lateral (right) views.
- https://doi.org/10.7554/eLife.23379.025
Download links
A two-part list of links to download the article, or parts of the article, in various formats.
Downloads (link to download the article as PDF)
Open citations (links to open the citations from this article in various online reference manager services)
Cite this article (links to download the citations from this article in formats compatible with various reference manager tools)
Automated deep-phenotyping of the vertebrate brain
eLife 6:e23379.
https://doi.org/10.7554/eLife.23379


