Defining the biological basis of radiomic phenotypes in lung cancer
- Dana-Farber Cancer Institute, Brigham and Women’s Hospital, Harvard Medical School, United States
- Dana-Farber Cancer Institute, United States
- H. Lee Moffitt Cancer Center and Research Institute, United States
- Institut de recherches cliniques de Montreal, Canada.
- Maastricht University, Netherlands
- University Health Network, University of Toronto, Canada
- University of Toronto, Canada
- Brigham and Women’s Hospital, Harvard Medical School, United States
Figures
Figure 1
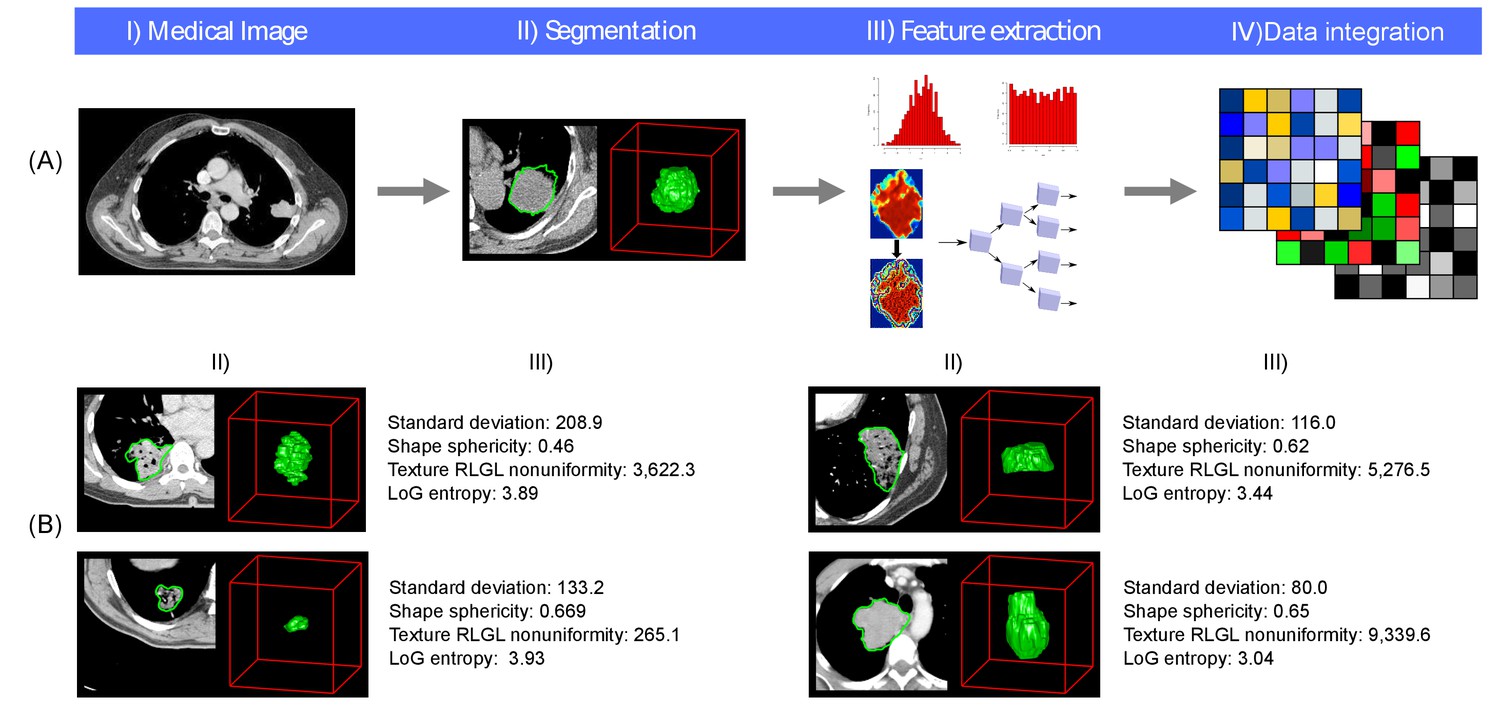
Radiomics approach.
(A) Workflow of extracting radiomic features: (I) A lung tumor is scanned in multiple slices. (II) Next, the tumor is delineated in every slice and validated by an experienced physician. This allows creation of a 3D representation of the tumor outlining phenotypic differences of tumors. (III) Radiomic features are extracted from this 3D mask, and (IV) integrated with genomic and clinical data. (B) Representative examples of lung cancer tumors. Visual and nonvisual differences in tumor shape and texture between patients can be objectively defined by radiomics features, such as entropy of voxel intensity values (‘How heterogeneous is the tumor?') or sphericity of the tumor (‘How round is the tumor?').
Figure 2
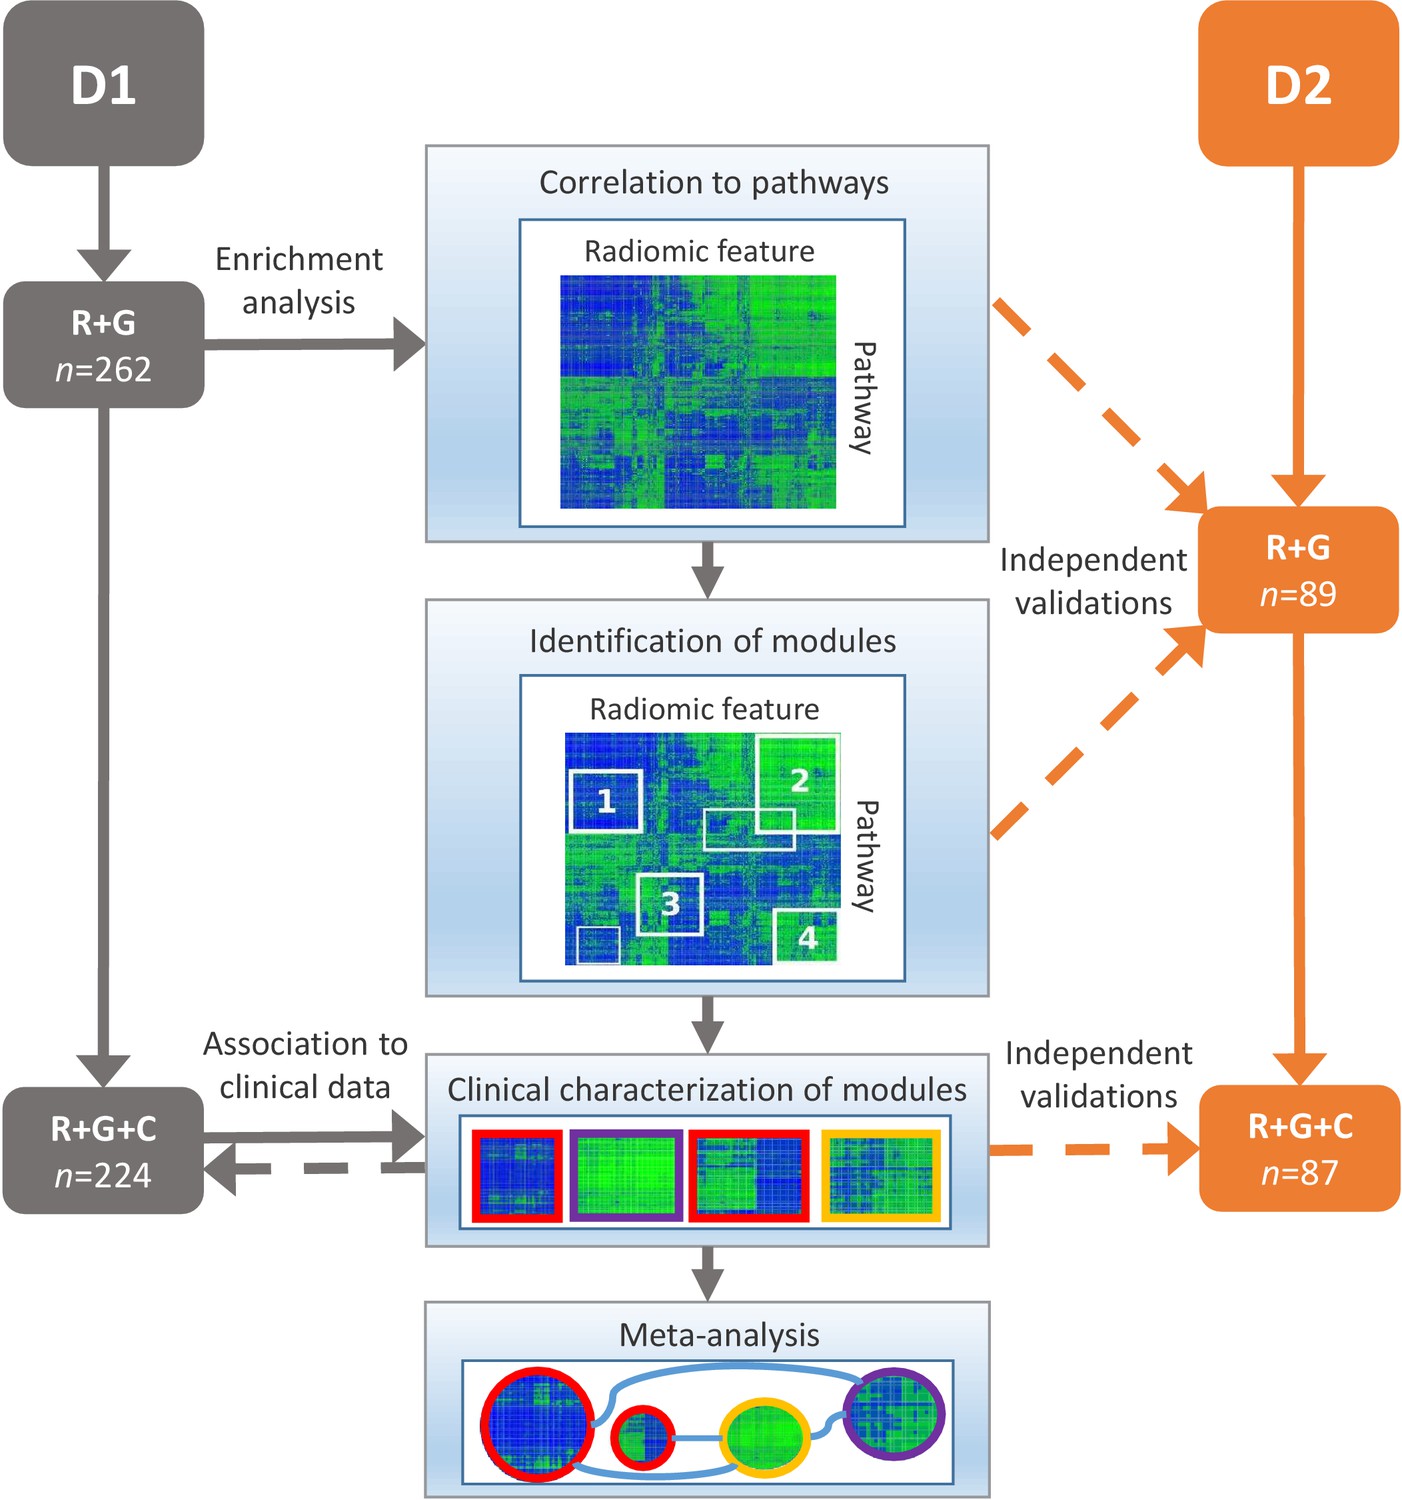
Schema of our strategy to define robust radiomic-pathway-clinical relationships.
Two independent lung cancer cohorts (D1 and D2) with radiomic (R), genomic (G), and clinical (C) data were analyzed. D1 (n = 262) was used as a discovery cohort and D2 (n = 89) was used to validate our findings. A gene set enrichment analysis (GSEA) approach assessed scores for radiomic-pathway associations. These scores were biclustered to modules that contain features and pathways with coherent expression patterns. These modules may overlap and vary in size. Clinical association to overall survival (red), pathologic histology (purple), and TNM stage (yellow) was statistically tested in both datasets, and results were combined in a meta-analysis to investigate relationships of modules.
-
Figure 2—source data 1
Dataset1.
Spreadsheet containing radiomic data, normalized gene expression, and clinical data of the discovery cohort.
- https://doi.org/10.7554/eLife.23421.005
-
Figure 2—source data 2
Dataset2.
Spreadsheet containing radiomic data, normalized gene expression, and clinical data of the validation cohort.
- https://doi.org/10.7554/eLife.23421.006
Figure 3 with 2 supplements
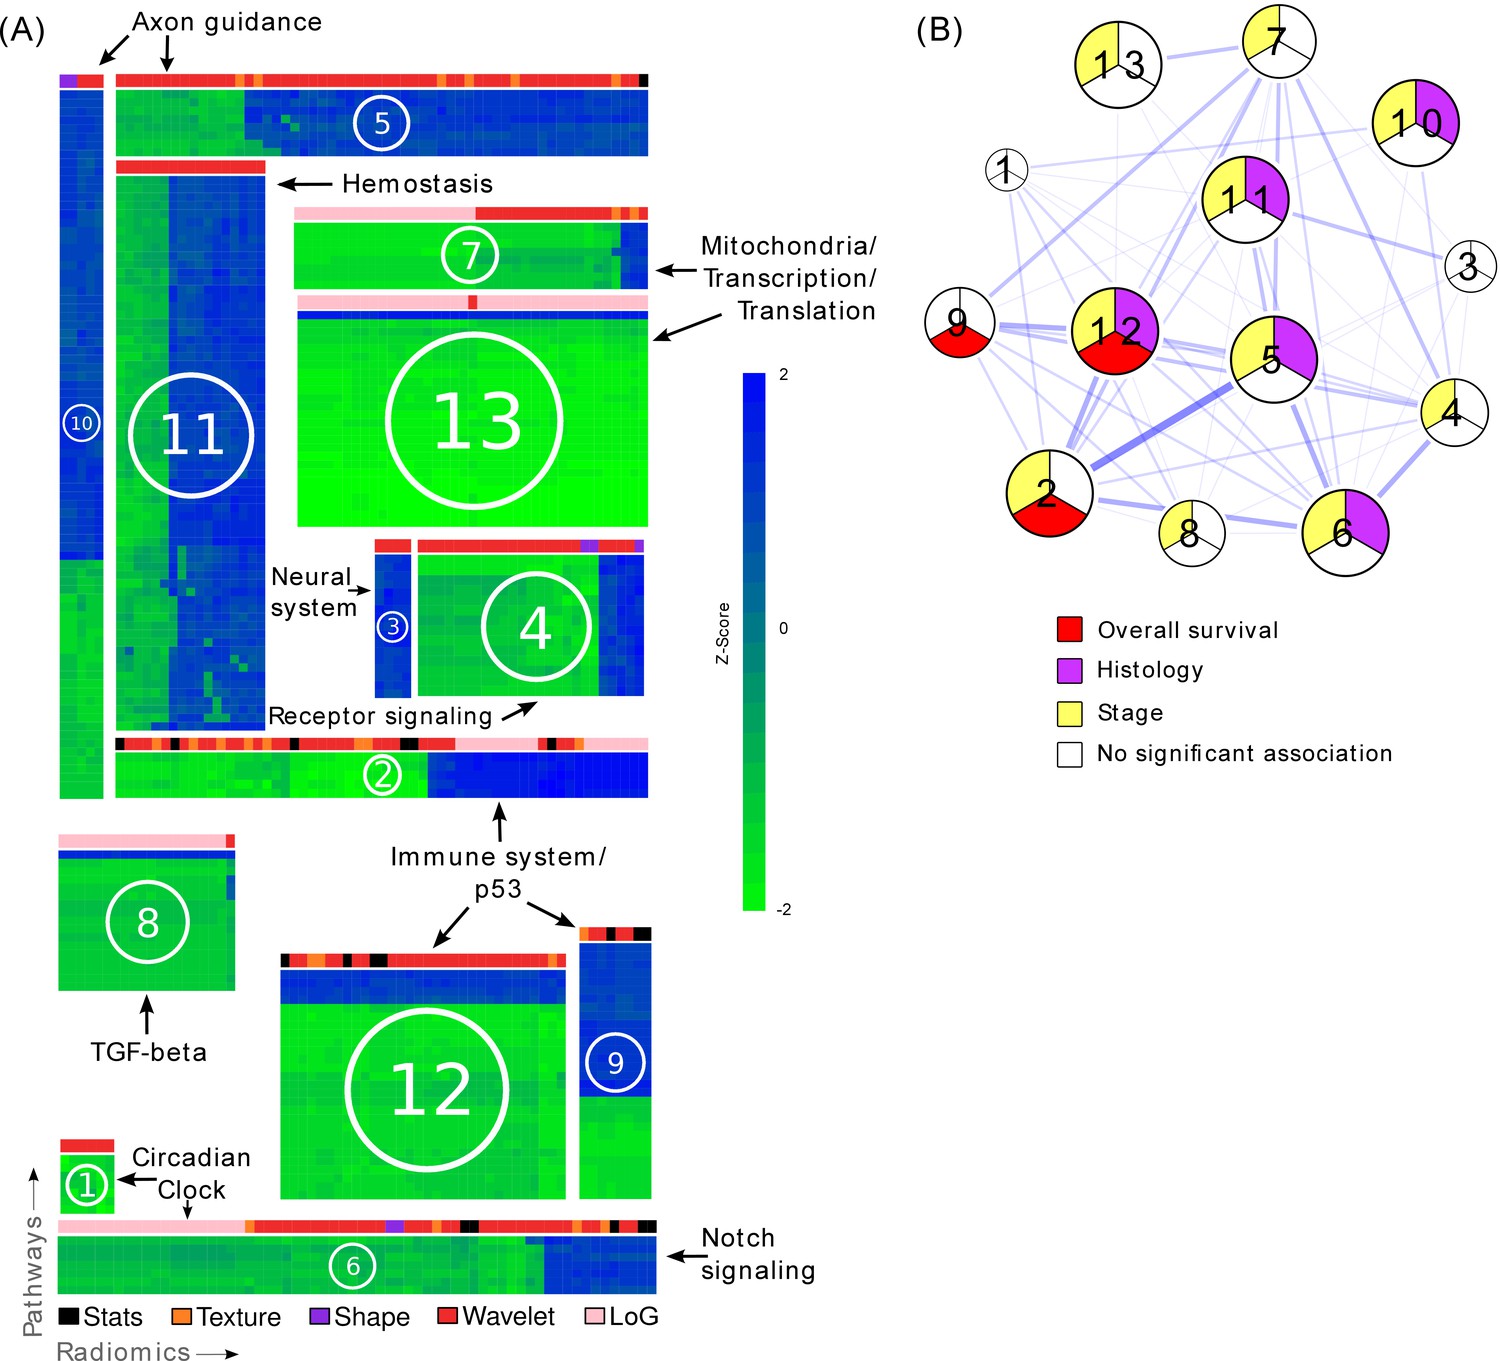
Radiomic-pathway-clinical modules.
(A) Clustering of significantly validated radiomic-pathway association modules (FDR < 0.05). Normalized enrichment scores (NESs) have been biclustered to coherently expressed modules. Every heatmap in this figure corresponds to a module (M1 - M13) with radiomic features in columns and pathways in rows. Heatmap sizes are proportional to module sizes. Elements are NESs given in Z-scores across features, and are displayed in blue when positive and green when negative. Horizontal color bars above every module indicate radiomic feature groups (black = first order statistics, orange = texture, purple = shape, red = wavelet, and pink = Laplace of Gaussian). Representative molecular pathways are displayed. (B) Clinical module network. We investigated if modules were associated with overall survival (red), stage (yellow), histology (purple), or no clinical factor (white). Relationships of modules based on their number of shared radiomic features (thickness of blue lines) are displayed by a network. While we found that most modules yield clinical information, overlaps of modules did not indicate relationships to similar clinical factors.
-
Figure 3—source data 1
Enlarged heatmaps of every module depicting normalized enrichment scores (NESs) of every pair of radiomic feature and molecular pathway clustered in a module.
- https://doi.org/10.7554/eLife.23421.009
Figure 3—figure supplement 1
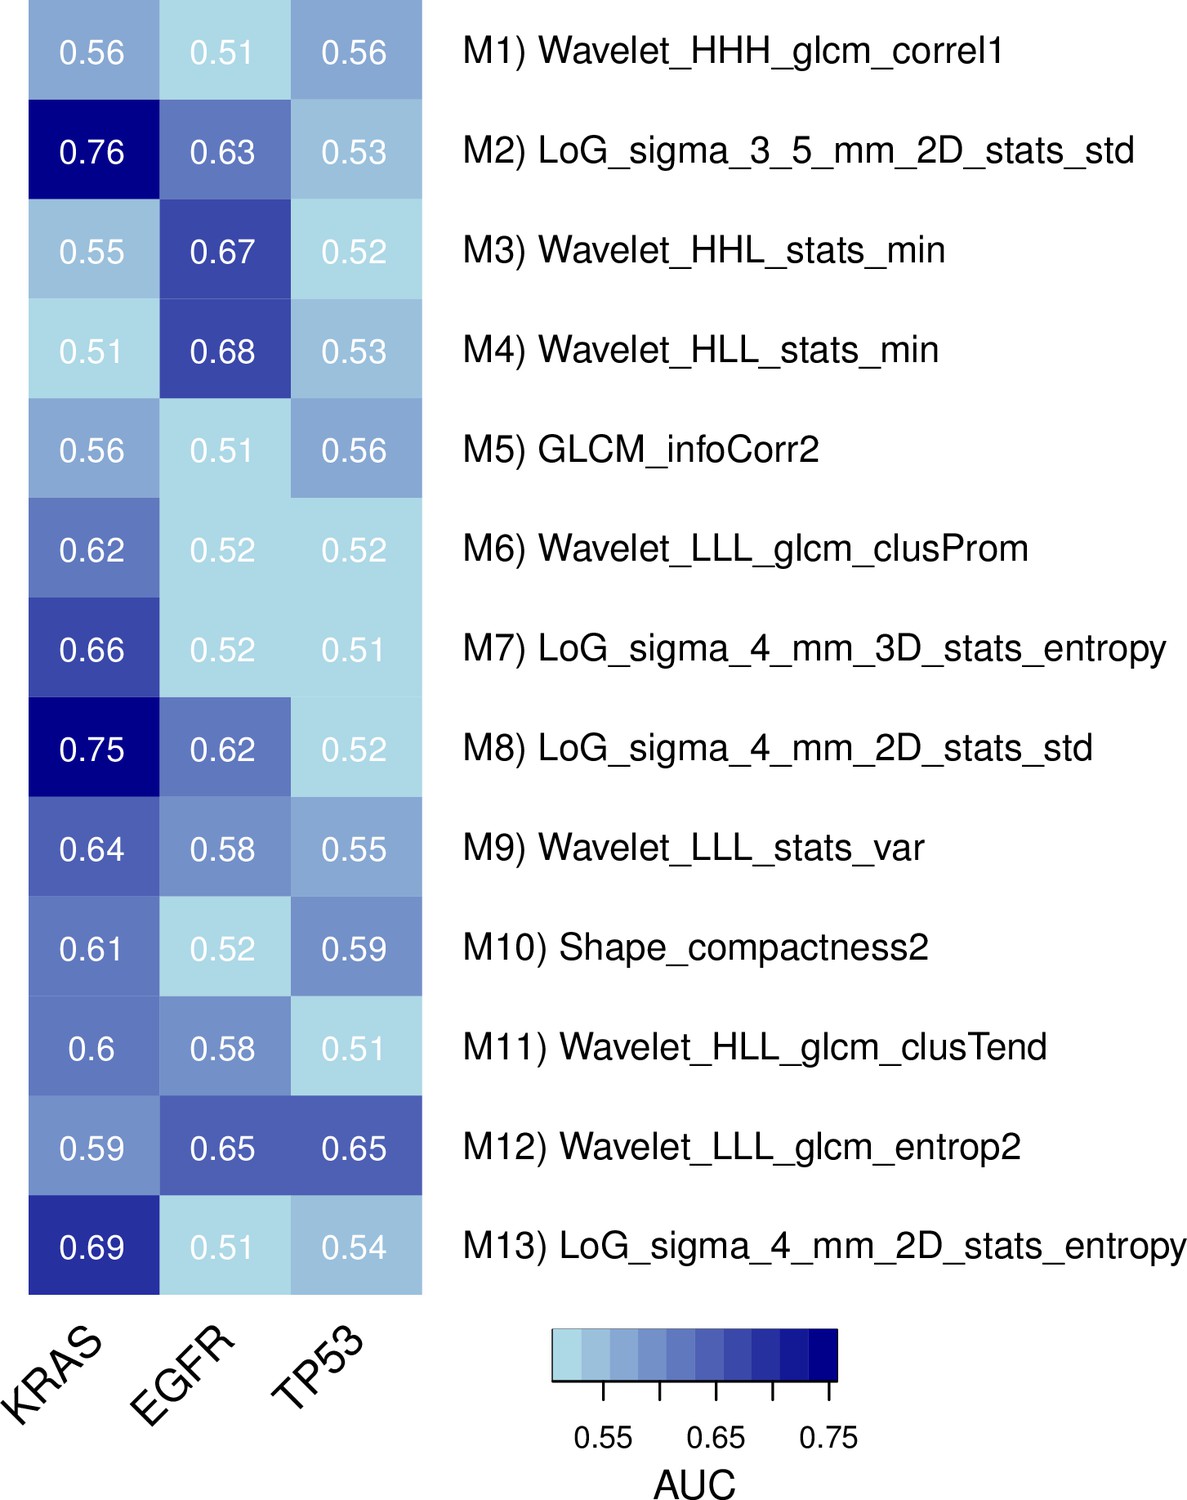
Predictive capabilities of representative radiomic features from every module for genetic mutations in KRAS, EGFR, and TP53 in a subset of the discovery cohort.
https://doi.org/10.7554/eLife.23421.010
Figure 3—figure supplement 2
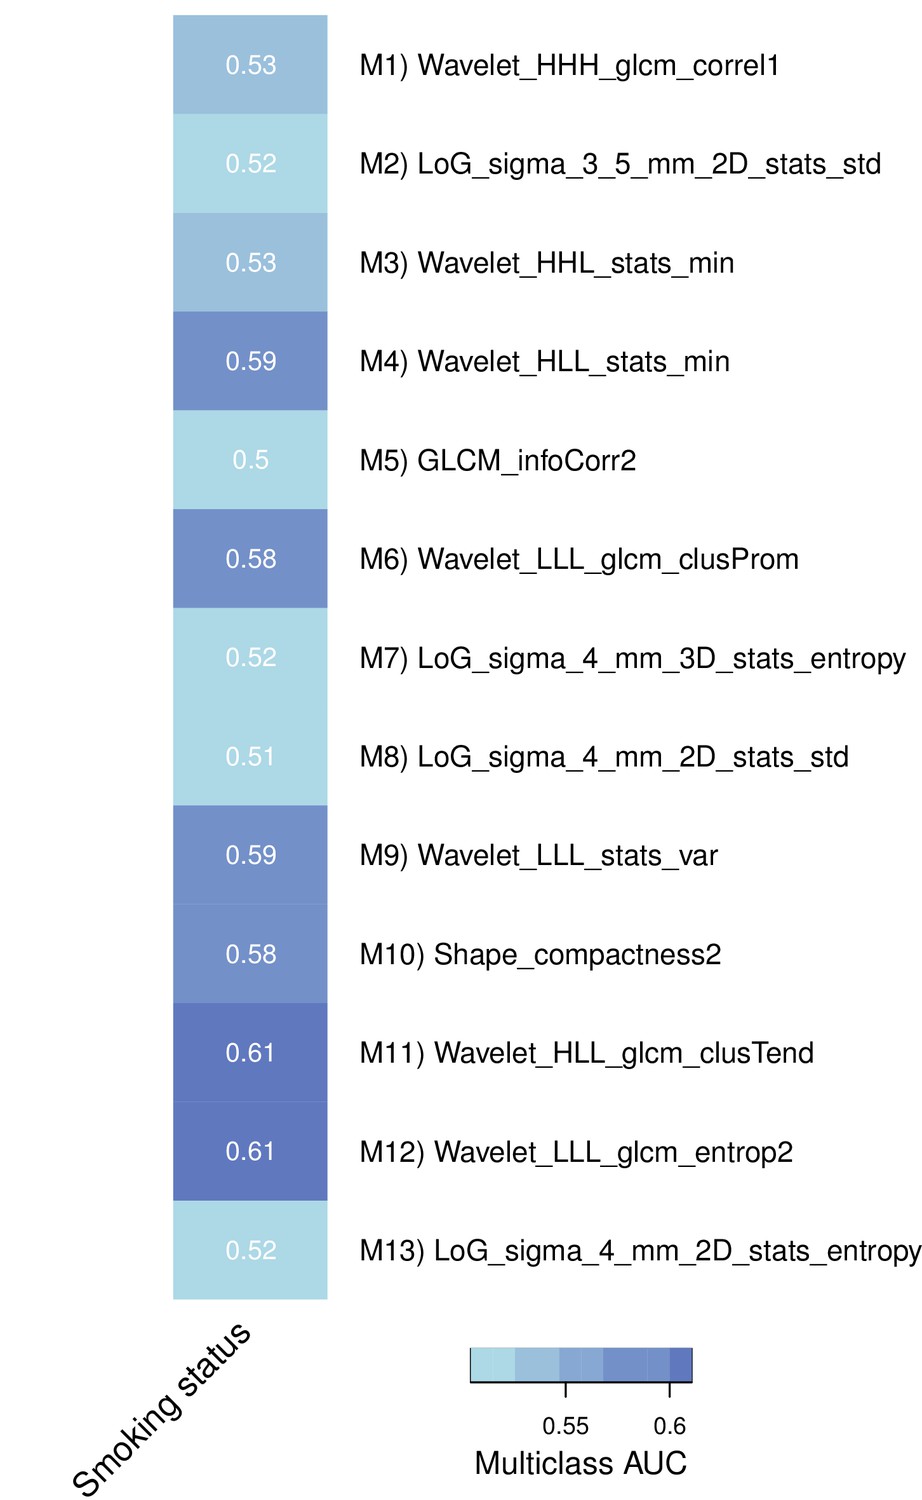
Association of representative features with smoking history in a subset of the discovery cohort.
https://doi.org/10.7554/eLife.23421.011
Figure 4 with 1 supplement

Test for agreement between radiomic and pathological immune response assessment.
Two representative cases are shown where radiomic predictions of immune response were confirmed by immunohistochemical staining for nuclear CD3 highlighting lymphocytes in brown. Each case is displayed in 0.6X and 2.0X magnification of the tumor slides, and an axial slice of the corresponding diagnostic CT scan and the total tumor volume is given for comparison. Automated quantifications of lymphocytes are displayed in addition to the radiomics score incorporated to classify into high and low responders.
Figure 4—figure supplement 1
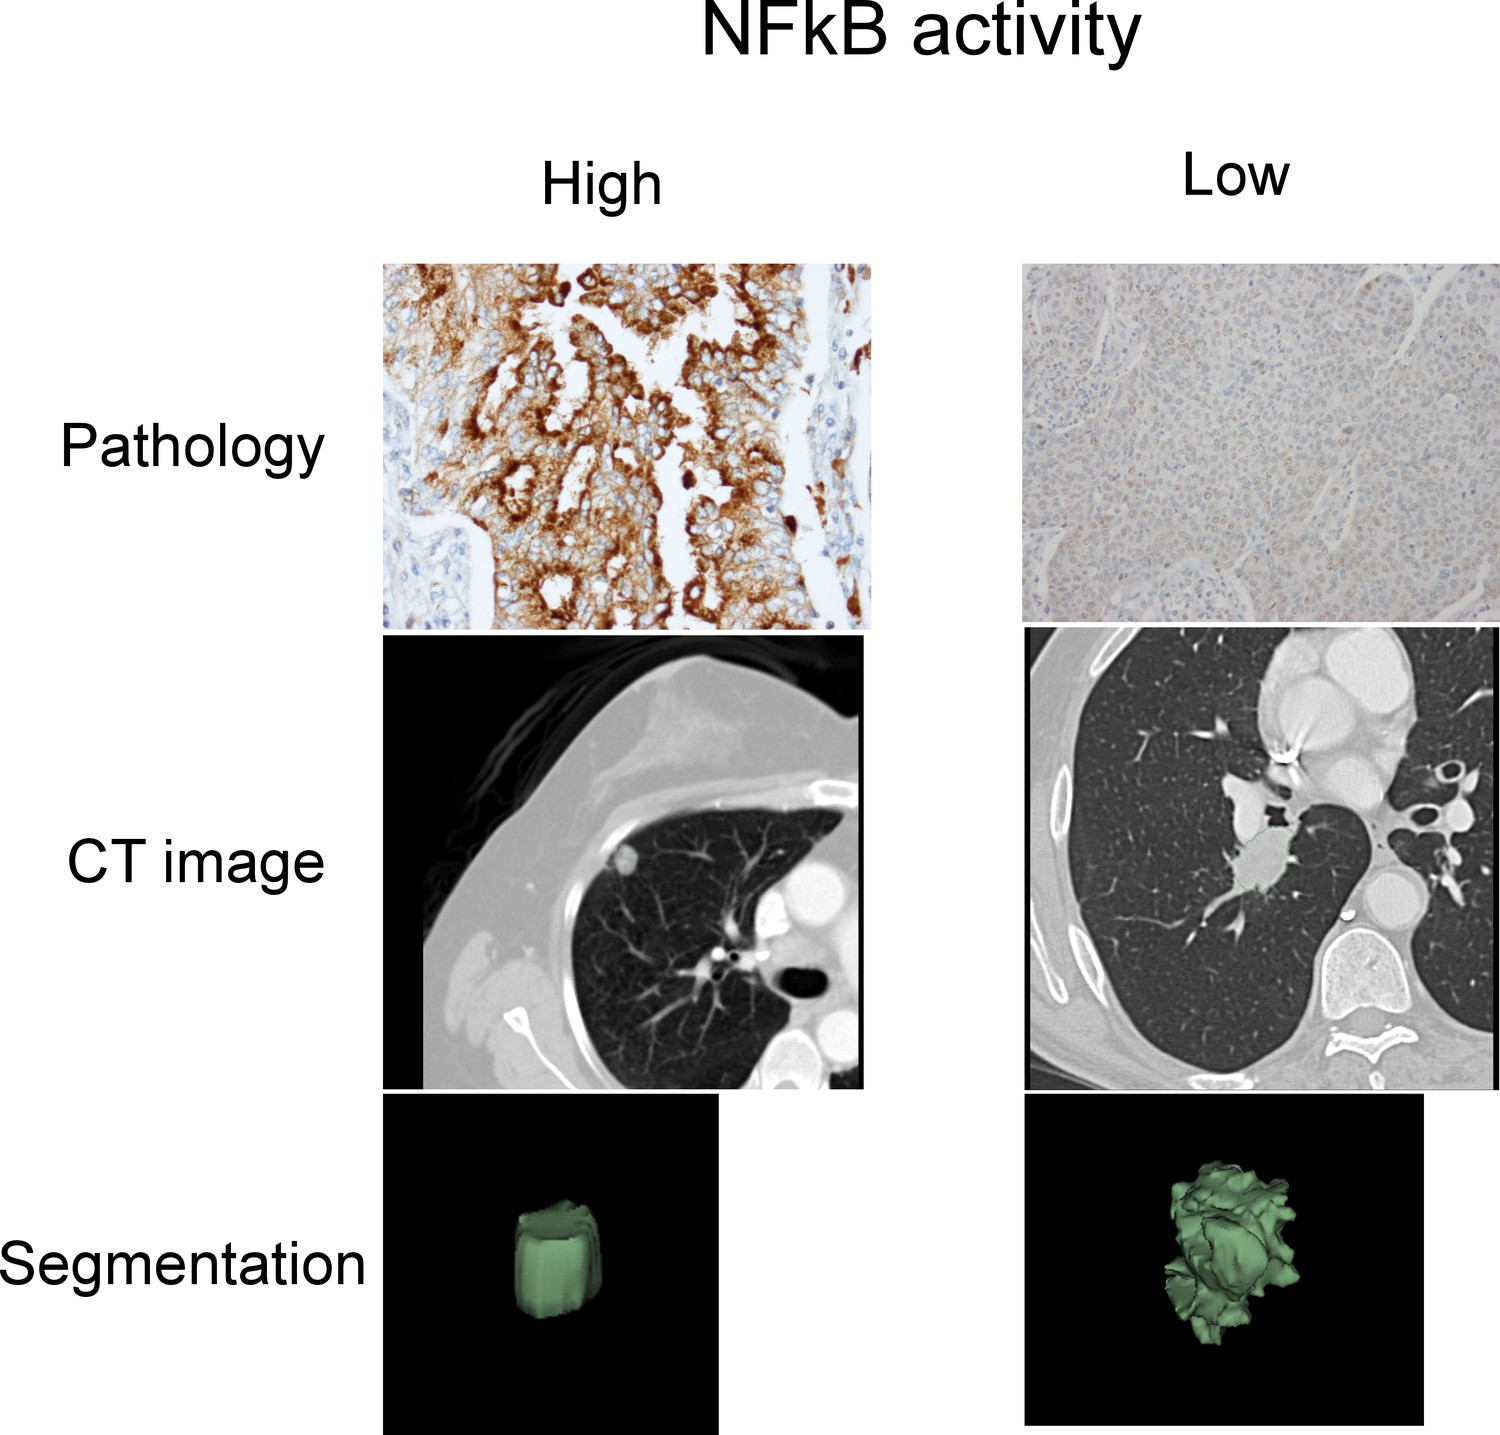
Representative cases of immunohistochemical staining for RelA.
https://doi.org/10.7554/eLife.23421.016
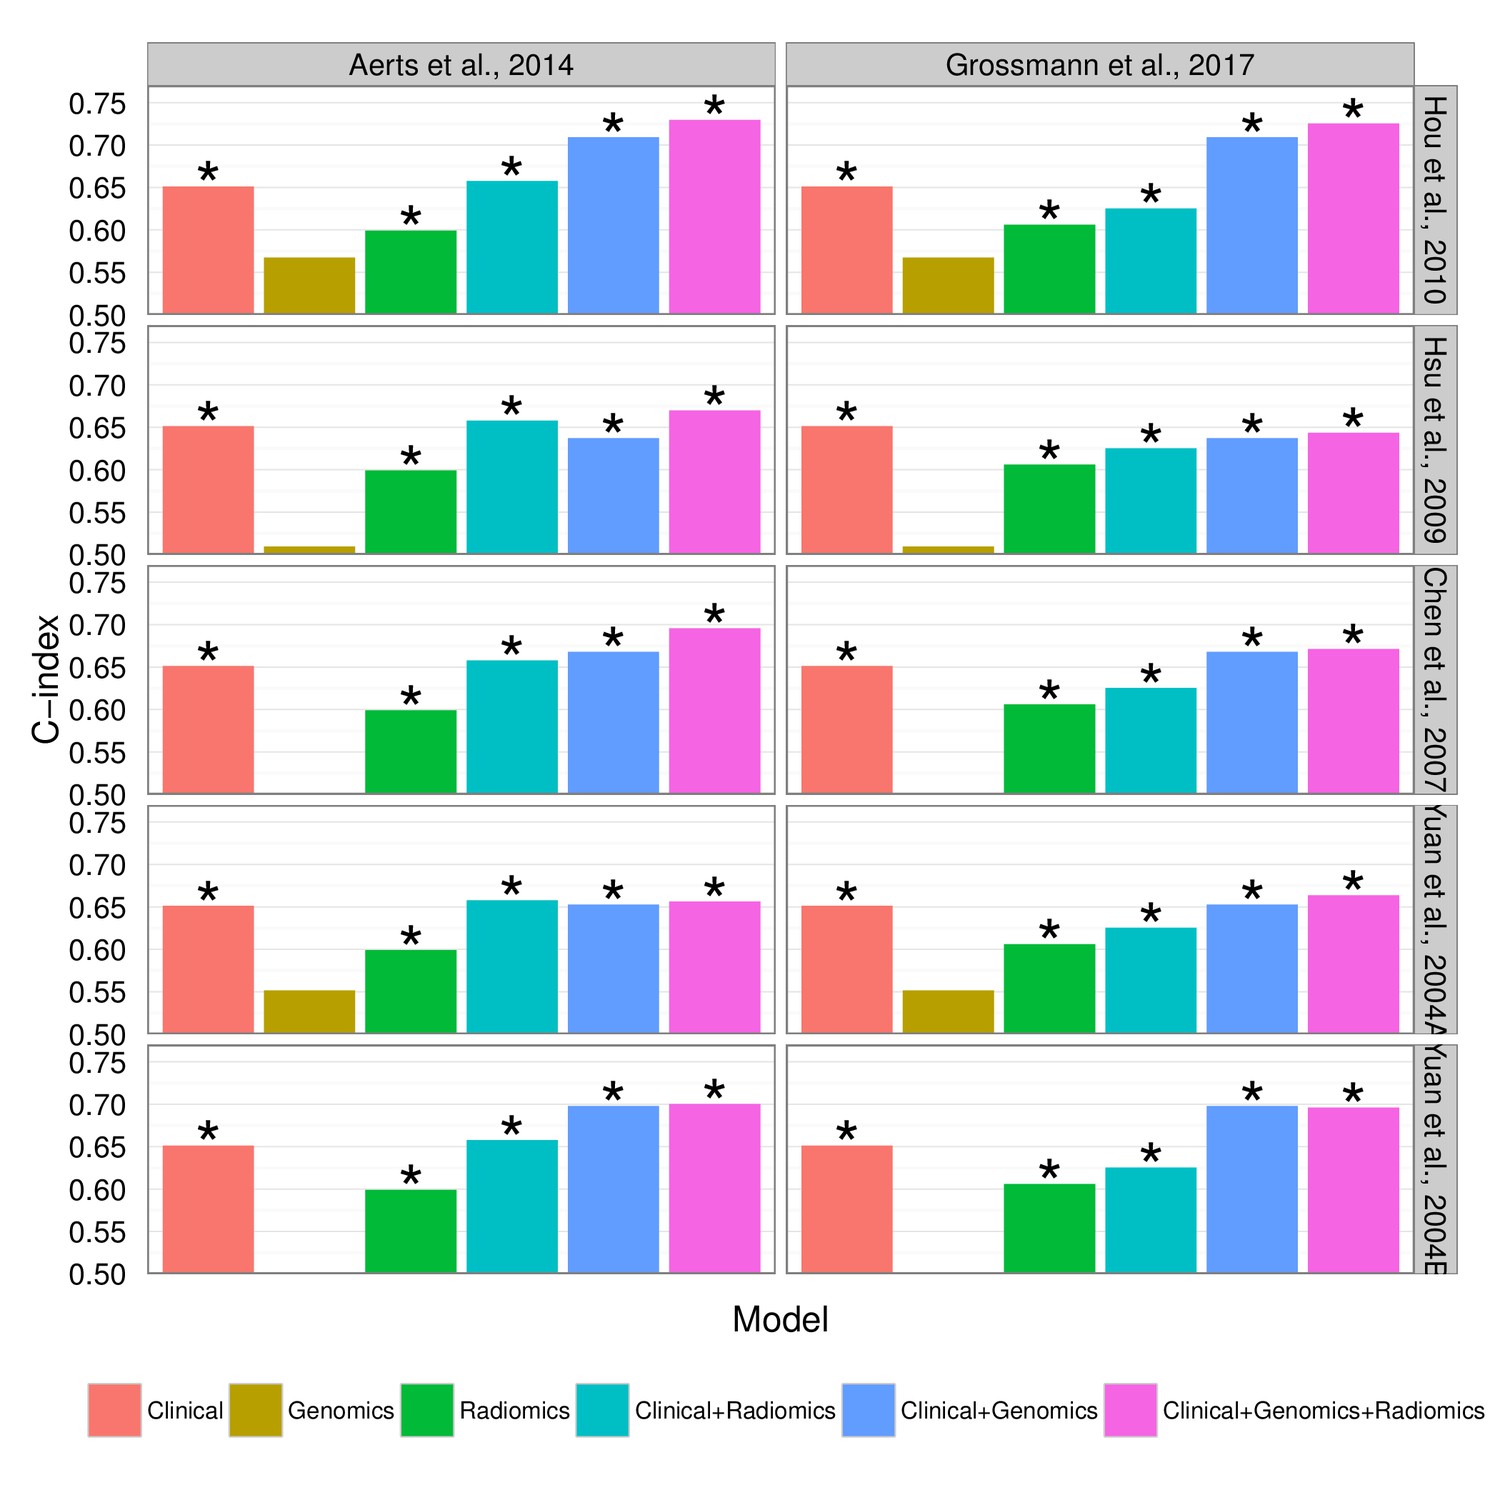
Figure 5 with 2 supplements
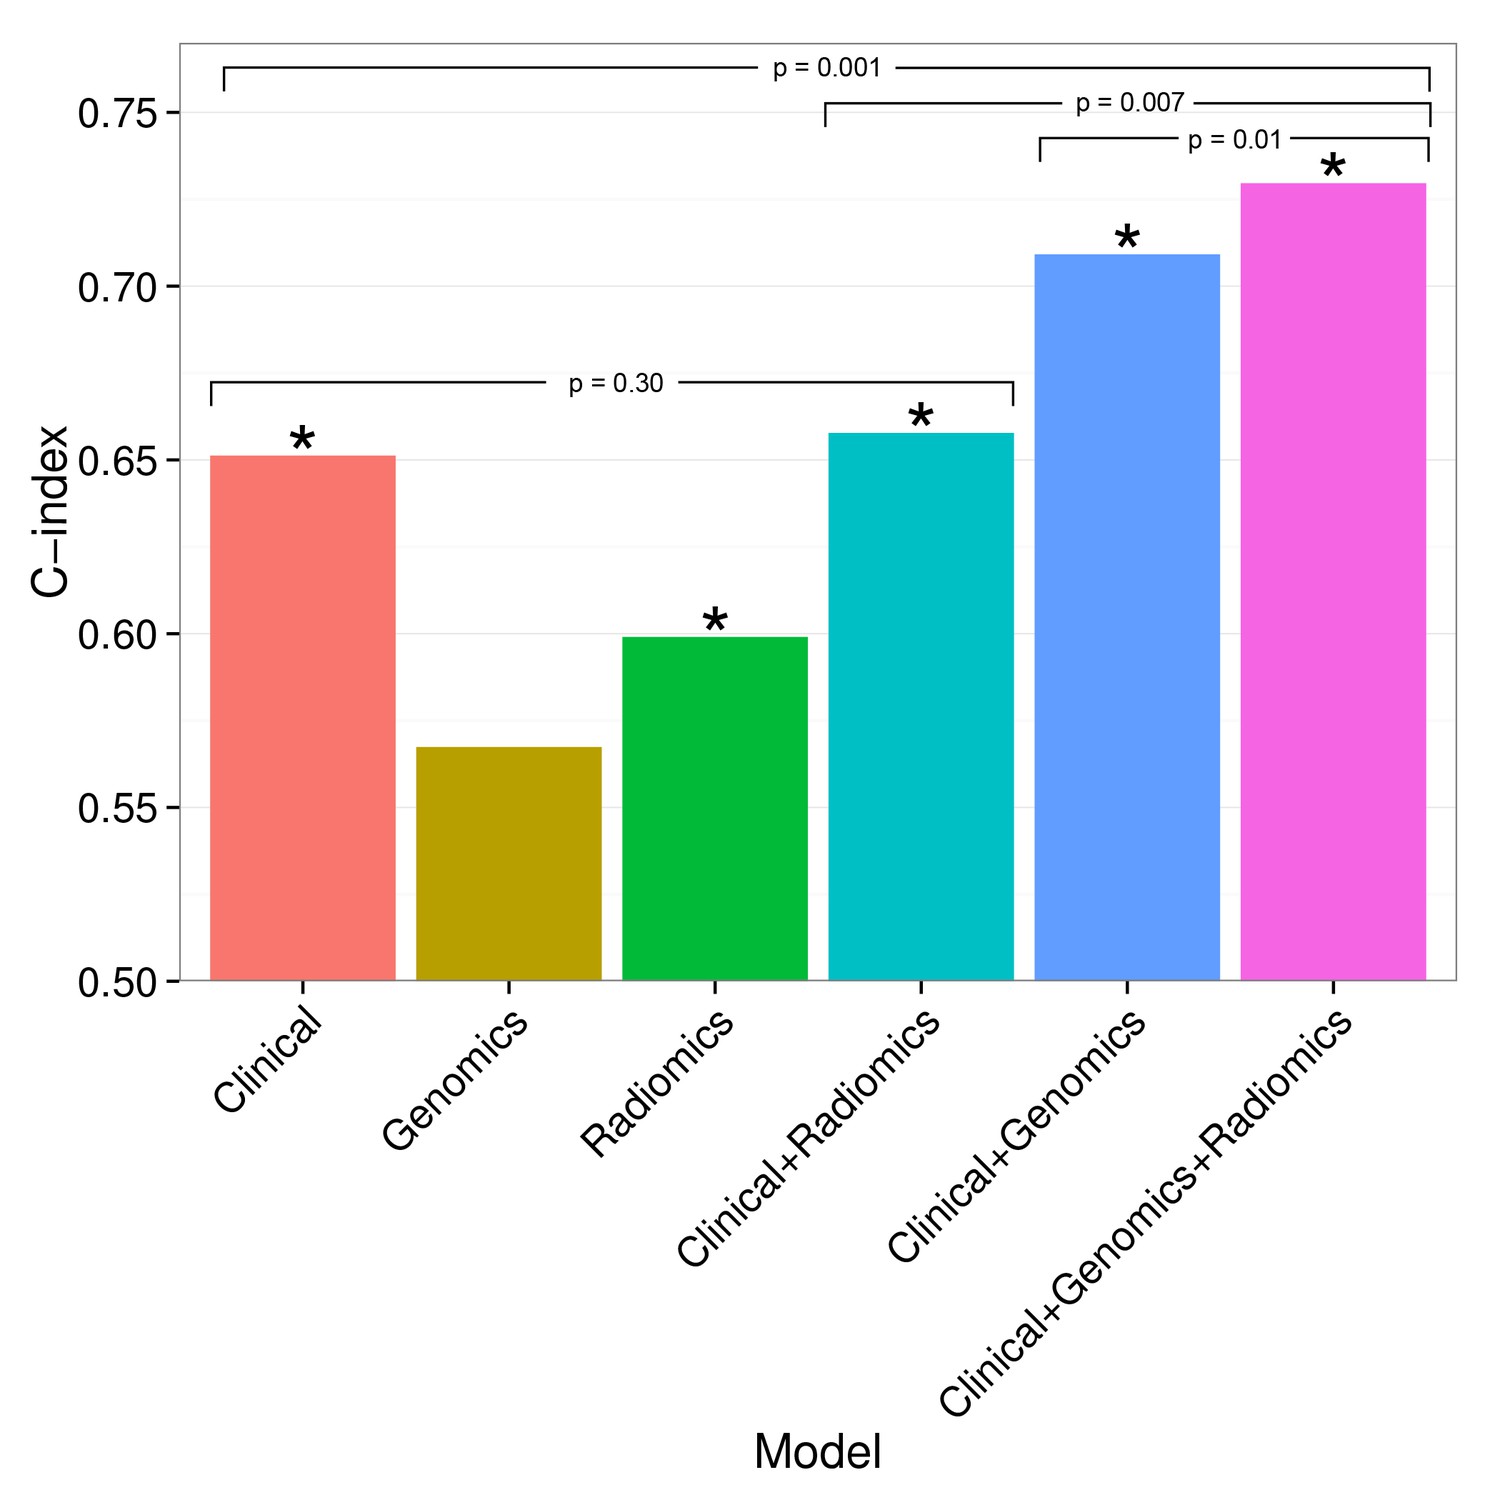
Combining prognostic signatures for overall survival.
We tested combinations of clinical, genomic, and radiomic signatures. To a clinical Cox proportional-hazards regression model with stage and histology, we first added a published gene signature and next a published radiomic signature. These models were fitted on Dataset1 and evaluated with the C-index (CI) on Dataset2. An asterisk indicates significance (p<0.05). Combining different data types resulted in increased prognostic performances. By adding radiomic and genomic information, the initial performance of the clinical model was increased from CI = 0.65 (Noether p=0.001) to CI = 0.73 (p=2×10⁻⁹).
Figure 5—figure supplement 1
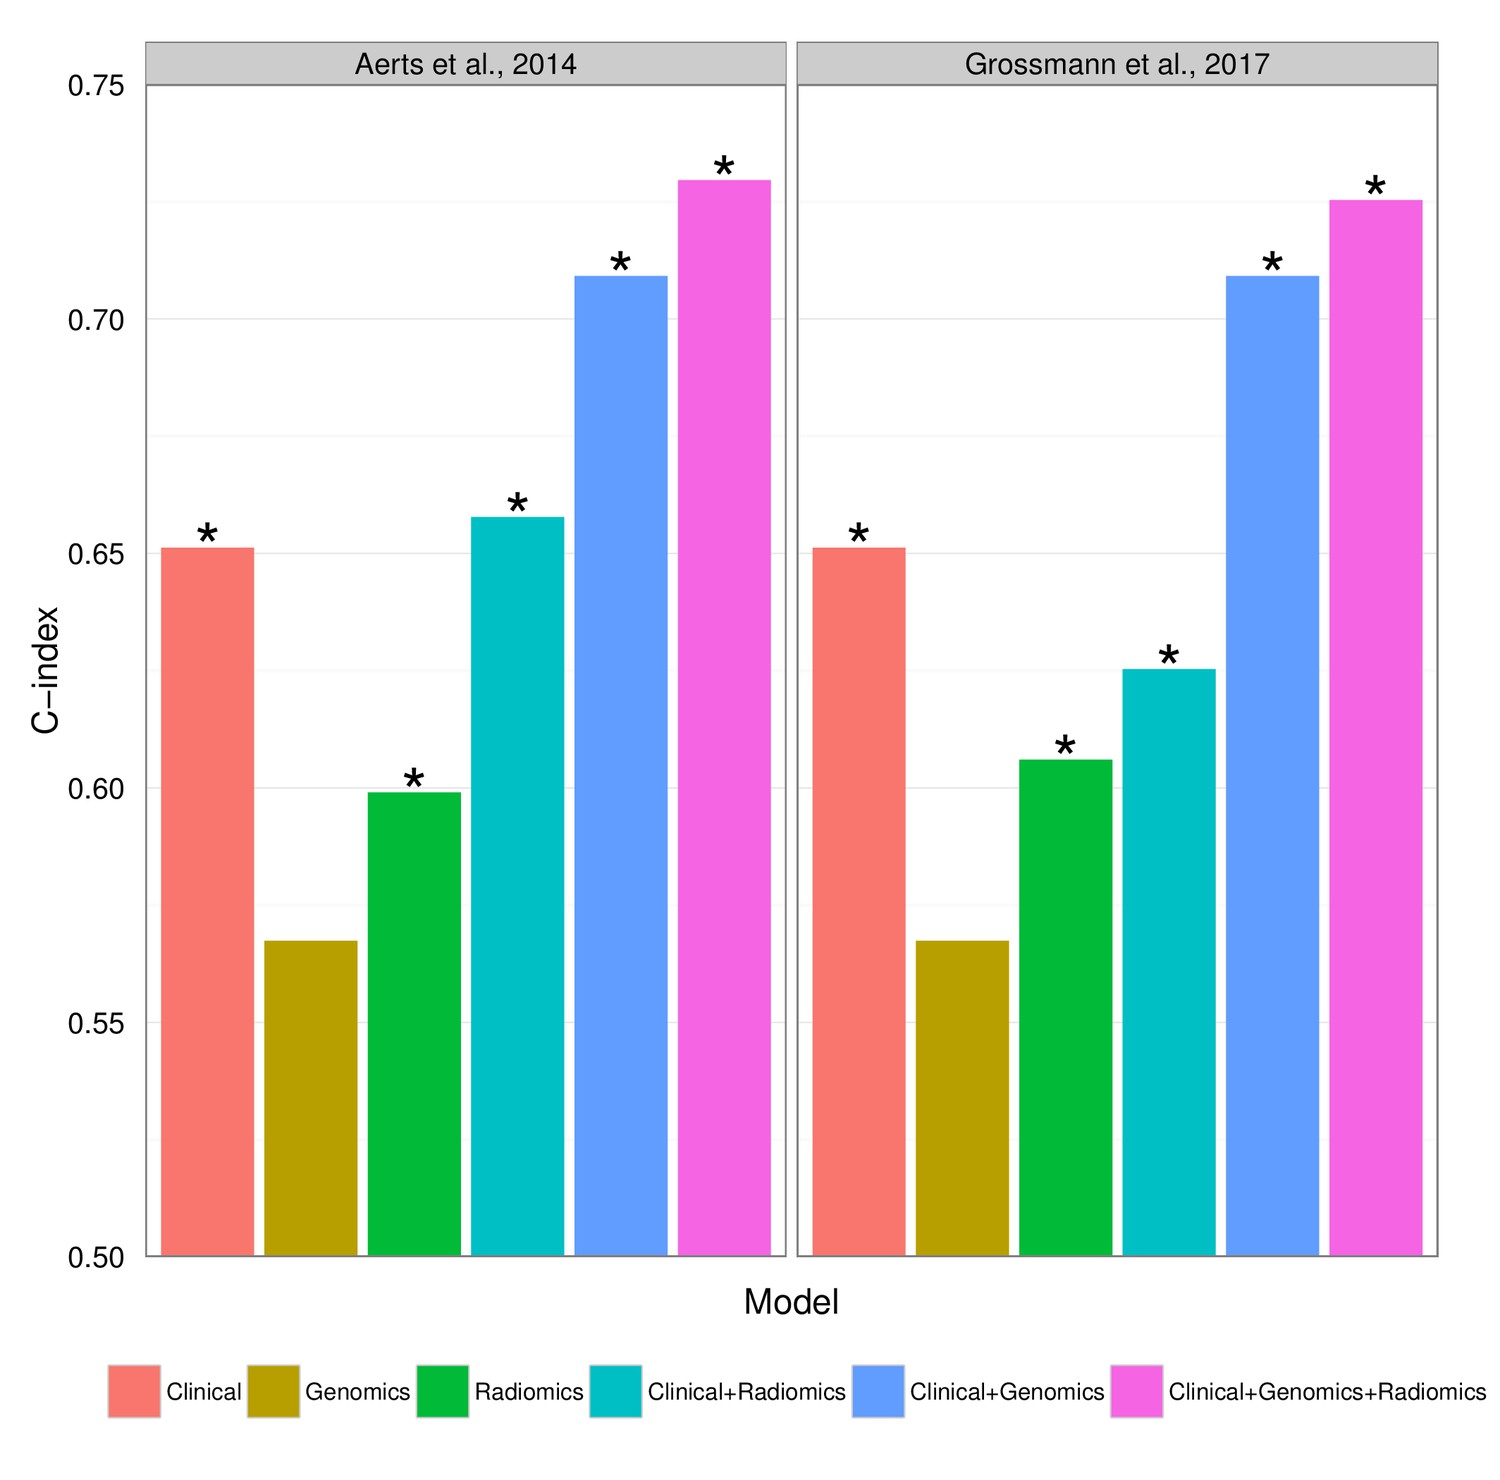
Prognostic performance of two radiomic signatures (i.e., a previously published and a novel signature) combined with genetic and clinical information.
https://doi.org/10.7554/eLife.23421.018
Figure 5—figure supplement 2
Prognostic performance of two radiomic signatures combined with different gene signatures and clinical information.
https://doi.org/10.7554/eLife.23421.019Tables
Table 1
Proportions of clinical characteristics in Dataset1 and Dataset2, Figure 2.
Histology and TNM stage were based on pathology were available.
| Dataset1 | Dataset2 | |
|---|---|---|
| Gender | ||
| Male | 100 (45%) | 59 (68%) |
| Female | 124 (55%) | 28 (32%) |
| Histology | ||
| Adenocarcinoma | 129 (58%) | 42 (48%) |
| Squamous | 61 (27%) | 33 (38%) |
| Other | 34 (15%) | 12 (14%) |
| Stage | ||
| I | 123 (55%) | 39 (45%) |
| II | 35 (15%) | 26 (30%) |
| III | 46 (21%) | 12 (14%) |
| Other | 20 (9%) | 10 (11%) |
| Smoking Status | ||
| Current | 66 (29%) | NA |
| Former | 141 (63%) | NA |
| None | 17 (8%) | NA |
| Tumor site | ||
| Primary | 224 (100%) | 87 (100%) |
| Endpoints | ||
| Overall survivals | 134 (60%) | 41 (47%) |
| Overall deaths | 90 (40%) | 46 (53%) |
| Follow up (median months) | 32 | 31 |
Table 2
Summary of common themes in all of the identified radiomic-pathway association modules. Columns 1–3 display the module name, the number of radiomic features (nr), and pathways (np), respectively. Columns 4–5 hold the radiomic and pathway themes present in each module.
| Module | nr | np | Radiomic | Pathway |
|---|---|---|---|---|
| M1 | 6 | 7 | Wavelet texture gray-level runs | Lipid and lipoprotein metabolism, Notch signaling, circadian clock |
| M2 | 58 | 5 | Wavelet intensity entropy; Laplace of Gaussian intensity standard deviation | Immune system, p53 |
| M3 | 4 | 17 | Wavelet minimum intensity | Neural system, axon guidance |
| M4 | 25 | 14 | Intensity variance and mean; wavelet minimum intensity min | Biological oxidations, signaling by insulin receptor, signaling by GPCR, neuronal system |
| M5 | 58 | 8 | Wavelet texture gray-level runs; wavelet intensity range and median; (wavelet) texture information correlation and cluster tendency | Axon guidance and synaptic transmission, lipoprotein metabolism, cell type determination |
| M6 | 64 | 7 | Laplace of Gaussian standard deviation; wavelet texture gray-level runs; wavelet texture cluster tendency | Circadian clock, signaling by Notch |
| M7 | 39 | 8 | Laplace of Gaussian intensity entropy; wavelet intensity variance; Laplace of Gaussian texture information correlation | Mitochondria, Pol III transcription |
| M8 | 20 | 17 | Laplace of Gaussian standard deviation | TCA cycle and electron transport, TGF-beta receptor signaling, response to stress, transcription regulation, protein synthesis, |
| M9 | 8 | 30 | Intensity variance; wavelet intensity variance | Immune system, p53, cell cycle regulation checkpoints, cell-cell interaction, circadian clock |
| M10 | 5 | 83 | Shape surface (SH); wavelet texture gray-level runs | Axon guidance, neuronal system, (innate) immune system, hemostasis, FGFR signaling, TGF-beta receptor signaling, Notch signaling, circadian clock |
| M11 | 17 | 66 | Wavelet intensity range; wavelet texture information correlation | Hemostasis, neural system |
| M12 | 32 | 27 | Wavelet texture entropy; intensity variance; wavelet texture cluster tendency | P53, immune system |
| M13 | 39 | 26 | Intensity entropy | Gene expression regulation, Pol II/III transcription |
Table 3
Pathway prediction and clinical association. For every module, the independent validation performance of the strongest radiomic based pathway predictors is indicated per module by the area under the curve (AUC) of the receiver operator characteristic. In addition, we highlight whether a module was significantly associated with overall survival (OS), TNM stage (ST), or pathologic histology (HI) (p<0.05).
| Module | Strongest radiomic based pathway prediction | AUC | OS | ST | HI |
|---|---|---|---|---|---|
| M1 | Wavelet (HHH) texture (GLCM) correlation → Cholesterol biosynthesis | 0.64, p=0.014 | |||
| M2 | Laplace of Gaussian intensity standard deviation → Autodegration of the E3 Ubiquitin ligase COP1 | 0.69, p=8e-4 | x | x | |
| M3 | Wavelet minimum intensity → Trafficking of GLUR2 containing AMPA receptors | 0.67, p=0.003 | |||
| M4 | Wavelet intensity minimum → Glutathione conjugation | 0.68, p=9e-4 | x | ||
| M5 | Texture information correlation → Trafficking of GLUR2 containing AMPA receptors | 0.69, p=7e-4 | x | x | |
| M6 | Wavelet texture cluster prominence → Notch1 intracellular domain regulation of transcription | 0.66, p=0.007 | x | x | |
| M7 | Laplace of Gaussian intensity entropy → RNA polymerase III transcription | 0.62, p=0.031 | x | ||
| M8 | Laplace of Gaussian intensity standard deviation → Pyruvate metabolism and citric acid TCA cycle | 0.72, p=6e-5 | x | ||
| M9 | Wavelet intensity variance → Trafficking of GLUR2 containing AMPA receptors | 0.64, p=0.020 | x | ||
| M10 | Shape compactness and shape sphericity → TRAF6 mediated NFkB activation | 0.66, p=0.003 | x | x | |
| M11 | Wavelet texture cluster tendency → Platelet aggregation plug formation | 0.69, p=6e-4 | x | x | |
| M12 | Wavelet texture entropy → G0 and early G1 | 0.65, p=0.007 | x | x | x |
| M13 | Laplace of Gaussian intensity entropy → RNA polymerase II transcription initiation and promoter opening | 0.68, p=0.001 | x |
-
Table 3—source data 1
Radiomic pathway predictors.
- https://doi.org/10.7554/eLife.23421.014
Additional files
-
Supplementary file 1
Radiomic feature definition and further description towards meaning of feature groups.
- https://doi.org/10.7554/eLife.23421.020
-
Source code 1
Analysis code.
Source code used to analyse data and generate figures.
- https://doi.org/10.7554/eLife.23421.021
-
Supplementary file 2
Exact p-values of modules and list of used R packages and their versions used for analysis.
- https://doi.org/10.7554/eLife.23421.022
-
Supplementary file 3
Methods for automated pathological call assessment.
- https://doi.org/10.7554/eLife.23421.023
Download links
A two-part list of links to download the article, or parts of the article, in various formats.
Downloads (link to download the article as PDF)
Open citations (links to open the citations from this article in various online reference manager services)
Cite this article (links to download the citations from this article in formats compatible with various reference manager tools)
Defining the biological basis of radiomic phenotypes in lung cancer
eLife 6:e23421.
https://doi.org/10.7554/eLife.23421


