A lncRNA fine tunes the dynamics of a cell state transition involving Lin28, let-7 and de novo DNA methylation
- University of Cambridge, United Kingdom
- University of California Berkeley, United States
- Cold Spring Harbor Laboratory, United States
- Babraham Institute, United Kingdom
- Wellcome Trust Sanger Institute, United Kingdom
- Integrated DNA Technologies, United States
Figures
Figure 1 with 2 supplements
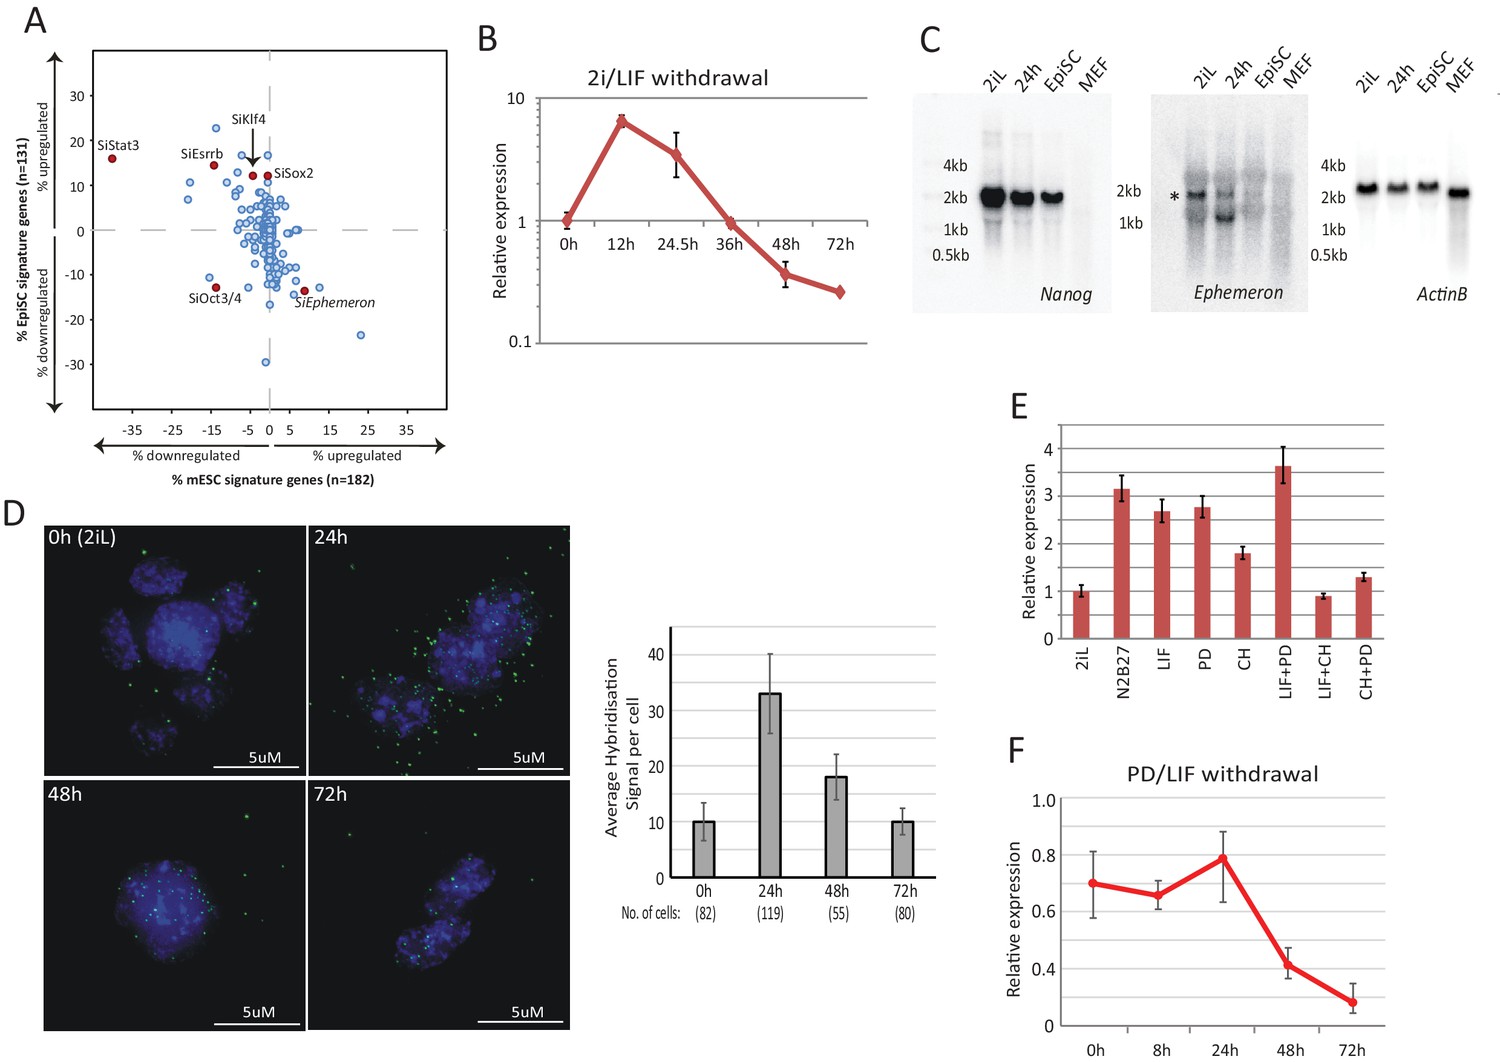
Dynamic expression of lncRNA Ephemeron during exit from naïve pluripotency.
(A) Bioinformatic analysis of potential lncRNA candidates in naïve state regulation based on published transcriptome data for lncRNA and pluripotency related gene knockdowns. Each dot represents the effect on ESC (x-axis) and EpiSC (y-axis) gene signatures when a given gene is knocked down. (B) RT-qPCR detection of Eprn expression relative to β-actin upon 2i/LIF withdrawal. Mean ±SD, n = 3. (C) Northern blotting of Eprn, Nanog and β-actin in ESCs in 2i/LIF or withdrawn from 2i/LIF for 24 hr, EpiSCs and MEF. * indicates a cross-hybridising RNA species since part of the probe region overlaps with LINE1-L1 and ERVK TEs. (D) RNA-FISH for Eprn upon 2i/LIF withdrawal with quantification of average hybridisation signals per cell. Mean value of total hybridisation signals for all cells ± SD, n = 2. (E) Eprn expression relative to β-actin upon 2i/LIF component withdrawal quantified by RT-qPCR. Cells cultured in 2i/LIF and were transferred to N2B27 containing indicated single or dual factors for 24 hr. Mean ±SD, n = 3. F, Eprn expression relative to β-actin upon PD/LIF withdrawal quantified by RT-qPCR. Mean ± SD, n = 3.
-
Figure 1—source data 1
Bioinformatics analysis of all lncRNAs and protein coding genes plotted in Figure 1A.
- https://doi.org/10.7554/eLife.23468.003
-
Figure 1—source data 2
Expression of potential lncRNA candidates in facilitating naïve state exit.
The genomic coordinates are based on mouse GRCm38/mm10 assembly.
- https://doi.org/10.7554/eLife.23468.004
Figure 1—figure supplement 1
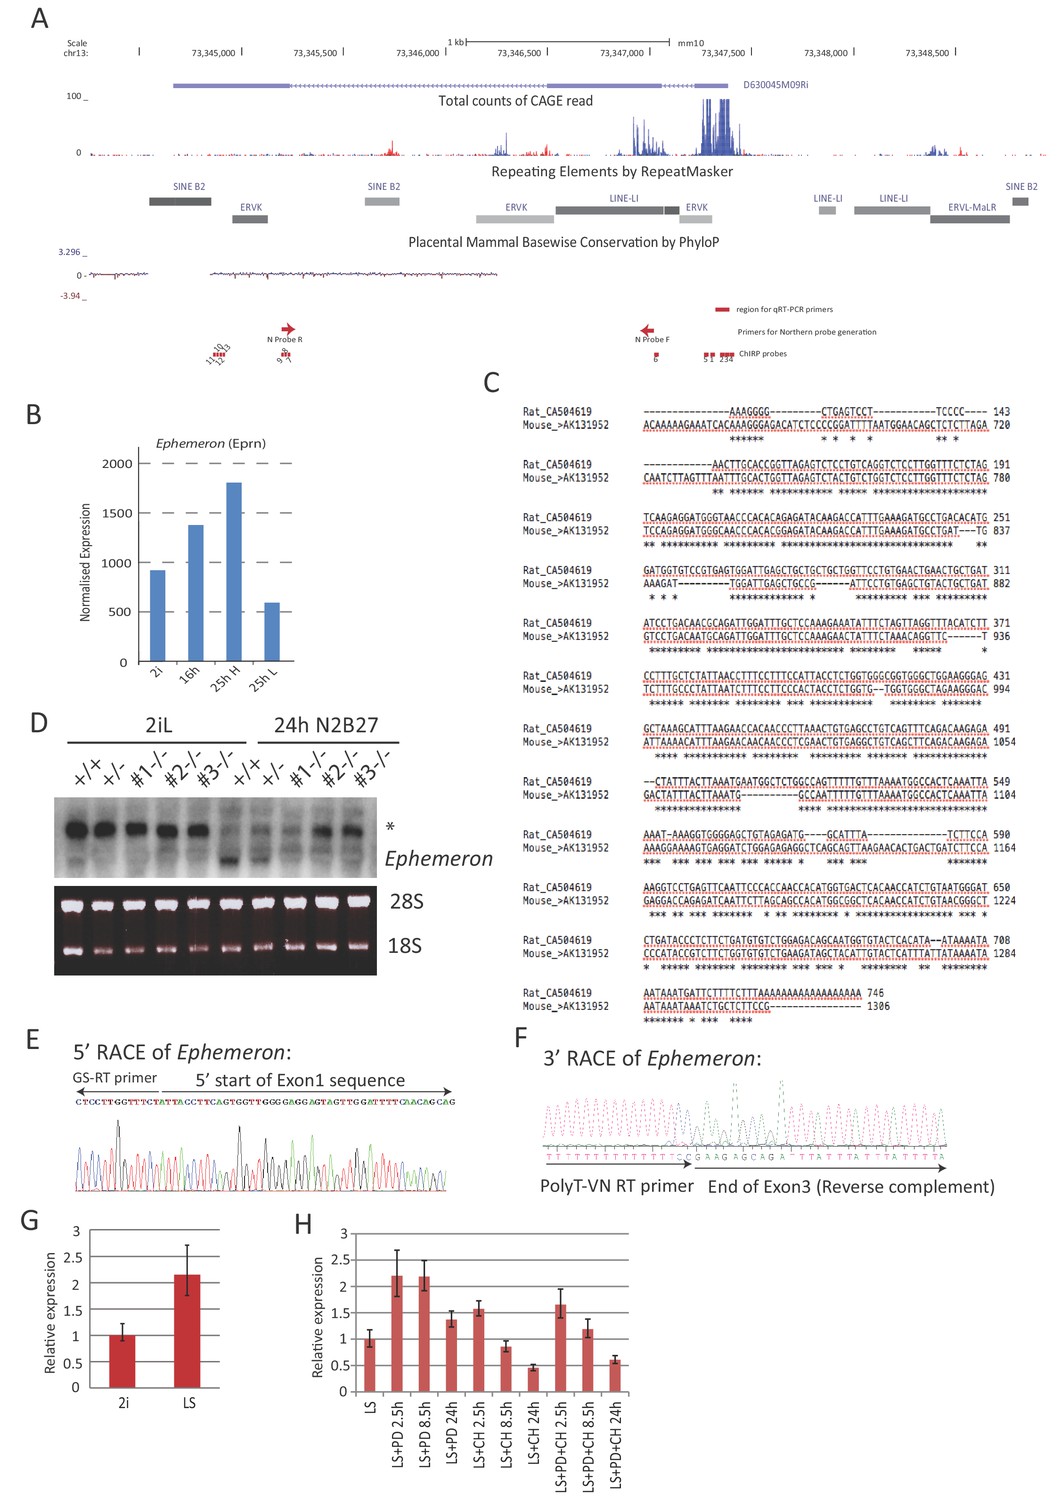
Molecular characterisation of Ephemeron.
(A) Eprn locus structure, TE content and mammalian conservation. The positions of Northern blotting, RNA-FISH and ChIRP probes were indicated. Note that Northern blotting probe region overlaps with a LINE element. Eprn expression was detectable by FANTOM5 CAGE expression. (B) Eprn expression upon 2i withdrawal in cells fractionated based on Rex1-GFP expression. 25hH and 25hL: Rex1-GFP high and low cells respectively sorted at 25 hr post 2i withdrawal. (C) Sequence alignment of Exon3 of Eprn and a rat EST transcribed from the syntenic region. Eprn EST, mouse AK131952; rat EST, CA504619. (D) Northern blot of wild type and Eprn KO cells in 2i/LIF and 24 hr post 2i/LIF withdrawal. * non-specific hybridisation. 28S and 18S gel electrophoresis served as loading control. (E) 5’RACE sequence confirming the 5’ start of Eprn RNA. (F) 3’RACE sequence confirming the 3’ end of Eprn RNA. (G) Eprn expression relative to β-actin measured by RT-qPCR upon 2i/LIF component addition to LIF/serum (LS) culture. PD or/and CH were added to cells maintained in LIF/serum for indicated time. Mean ±SD, n = 3.
Figure 1—figure supplement 2
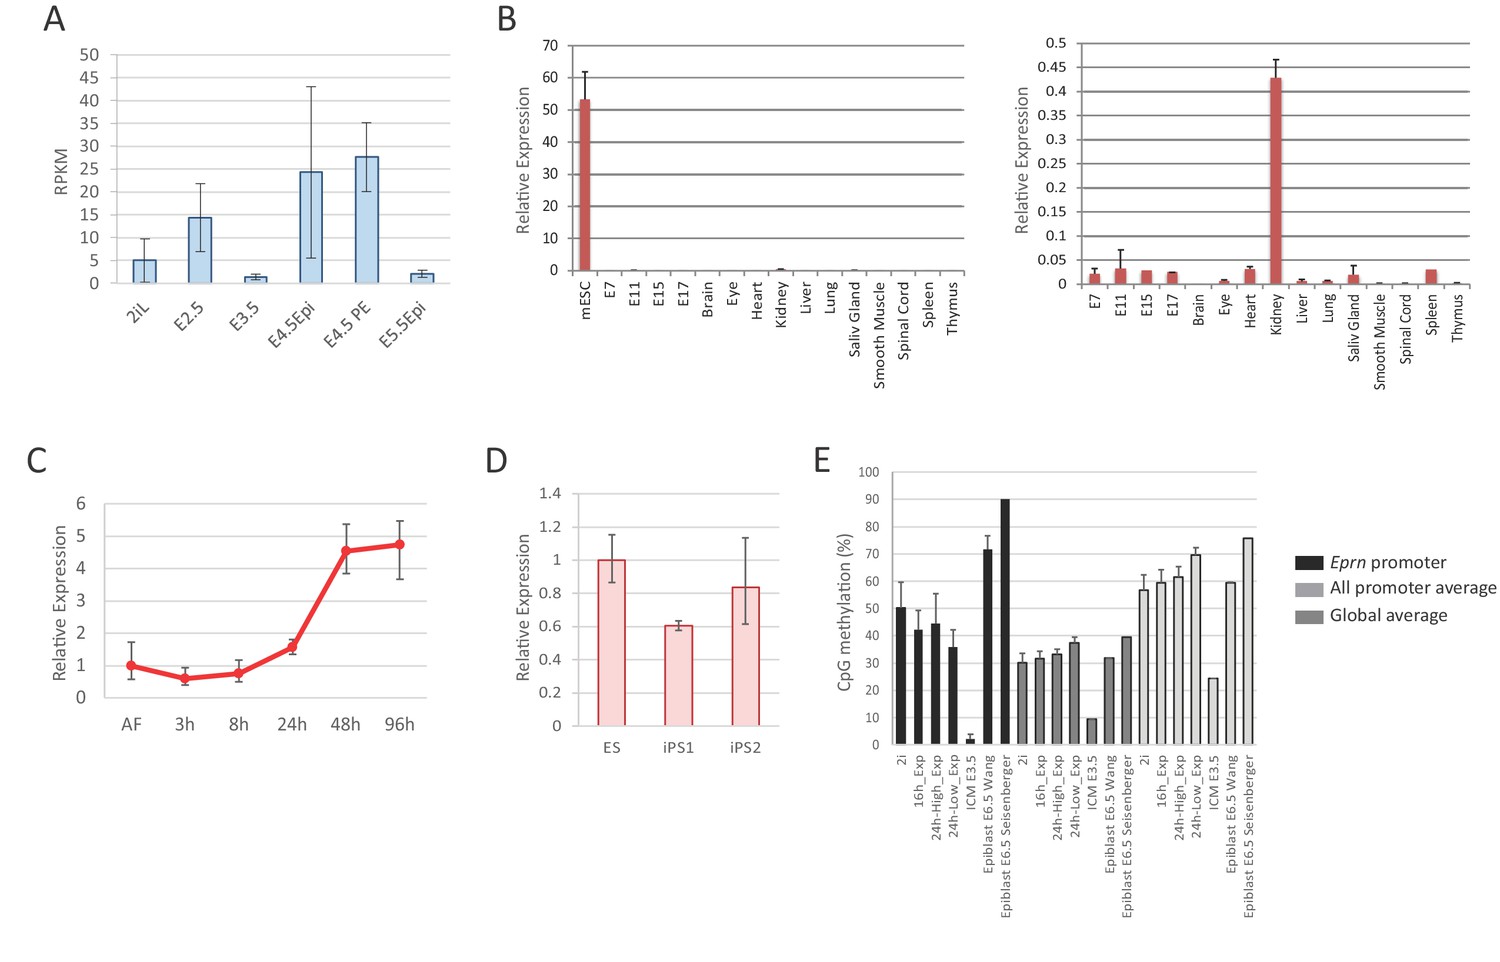
Eprn expression and promoter methylation.
(A) Eprn expression in early embryo development based on data from Boroviak et al. (2015). Mean ± S.E. n = 3. (B) Eprn expression in later stages of embryo development and a panel of adult tissues relative to Hprt. Mean ± SD, n = 3. (C) Eprn expression during EpiSC resetting. Mean ± SD, n = 3. (D) Eprn expression in established iPS clones. Mean ±SD, n = 3. (E) Percentage of CpG methylation at Eprn promoter, average of all promoters, and genome average upon 2i withdrawal and during early embryo development. Data are from Kalkan et al. (2017), Seisenberger et al. (2012), and Wang et al. (2014).
Figure 2 with 4 supplements
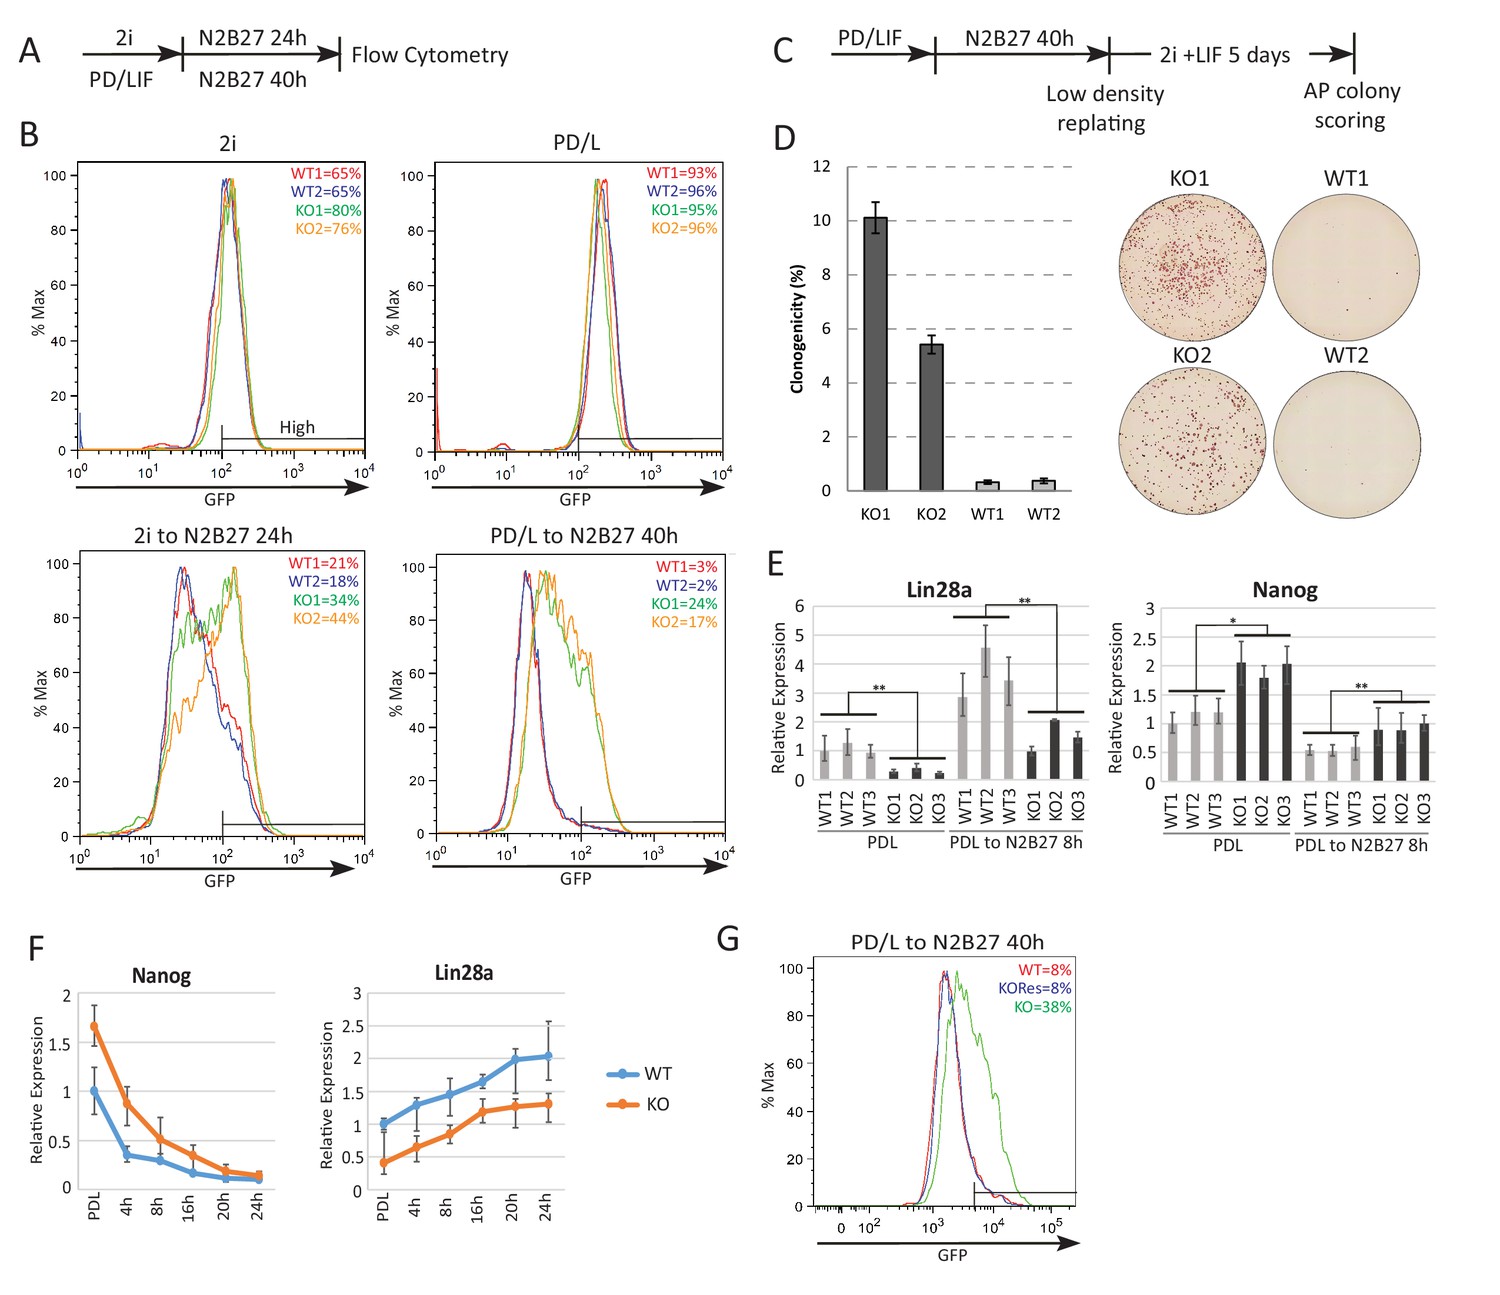
Absence of Ephemeron delays exit from naïve pluripotency.
(A) Experimental scheme for analysing naïve state exit using Rex1GFPd2 reporter cells. (B) Rex1-GFP flow cytometry profiles of wild type and Eprn KO cells in 2i and PD/LIF and during transition from these starting conditions. Two independent clones for wild type and Eprn KO cells were analysed. Percentage of GFP high cells were quantified. (C) Experimental scheme for colony formation assay. (D) Colony formation assay for wild type and Eprn KO cells in 2i/LIF 40 hr post PD/LIF withdrawal. Colonies were stained with alkaline phosphatase (AP), with representative images shown. Percentage clonogenicity was calculated by the number of AP positive colonies divided by the total number of cells plated. Mean ± SD, n = 3. (E) Lin28a and Nanog expression relative to β-actin in three independent wild type and Eprn KO cell lines measured by RT-qPCR. Mean ± SE, n = 3. *p<0.05, **p<0.01, student’s t-test. (F) Nanog and Lin28a expression kinetics upon PD/LIF withdrawal in wild type and Eprn KO cells. Mean ± SD, n = 3. (G) Rex1-GFP flow cytometry profile for wild type, Eprn KO and Eprn rescue cells 40 hr post PD/LIF withdrawal. Percentage of GFP high cells were quantified.
Figure 2—figure supplement 1
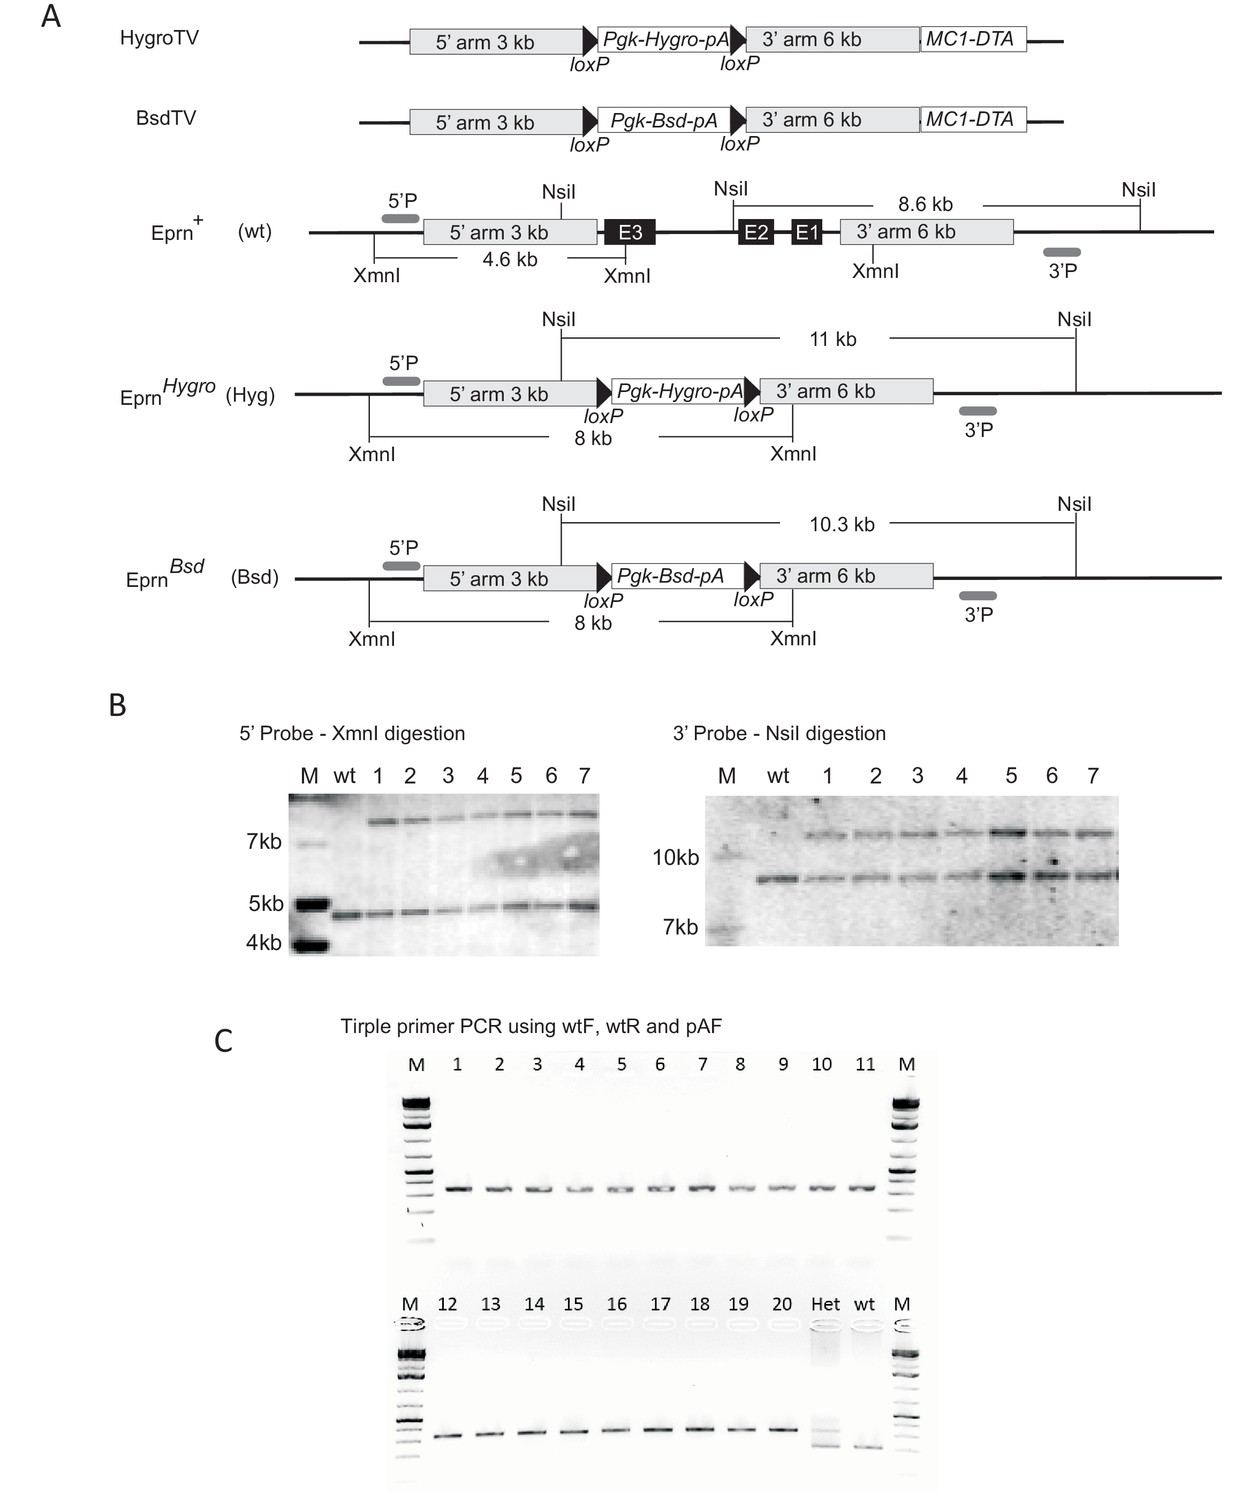
Generation of Eprn KO ESCs.
(A) Targeting vector, gene targeting and Southern blotting validation strategies. (B) Southern blotting confirming knockout of the first allele using an external probe. (C) Triple primer PCR confirming ESC clones with both alleles targeted. Wild type (wt) and single allele targeted (Het) ESCs were used as PCR controls. M, molecular marker. Primer sequences are shown in the Supplementary file 1C.
Figure 2—figure supplement 2
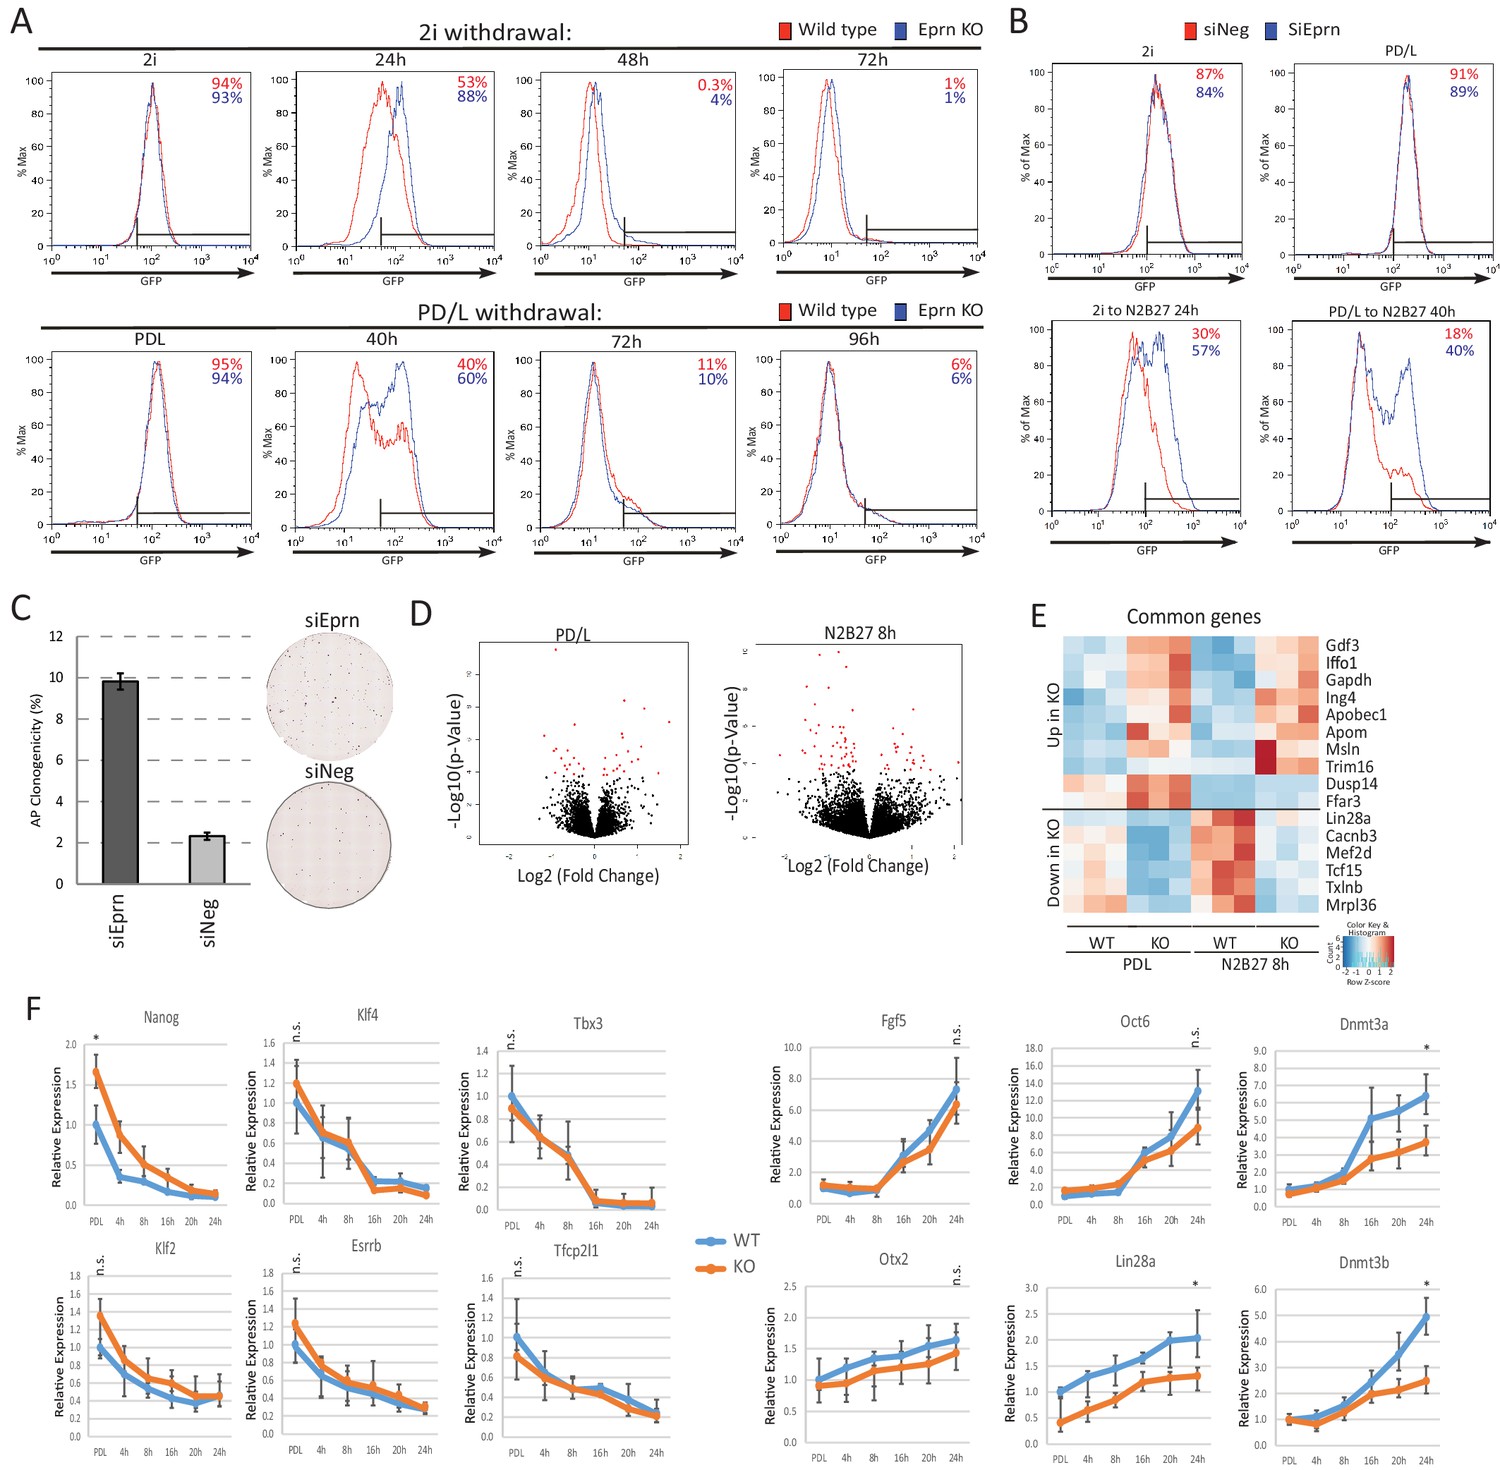
Phenotypic and molecular characterisation of Eprn KO during naïve state exit.
(A) Rex1-GFP flow cytometry profile over 2i and PD/LIF withdrawal time course for wild type and Eprn KO cells. (B) Rex1-GFP flow cytometry profile of Eprn knockdown in 2i and PD/LIF and after 24 hr and 40 hr in N2B27 respectively. (C) Colony formation capacity of Eprn knockdown cells 40 hr post PD/LIF withdrawal. Mean ± SD, n = 3. Representative AP staining images are shown. (D) Volcano plots of differentially expressed genes in Eprn KO compared to wild type ESC in PD/LIF and 8 hr after PD/LIF withdrawal. Red dots, statistically significant genes (Benjamini-Hochberg adjusted p<0.05) based on three independent wild type and KO lines. (E) Significantly differential expressed genes common in both PD/LIF and 8 hr N2B27 conditions with fold change >1.5 or <0.7. (F) Expression relative to β-actin of core naïve pluripotency factor network and peri-implantation epiblast genes in wild type and Eprn KO ESCs upon PD/LIF withdrawal. Mean ± SD, n = 3. *p<0.05, student t-test; n.s. not statistically significant.
Figure 2—figure supplement 3
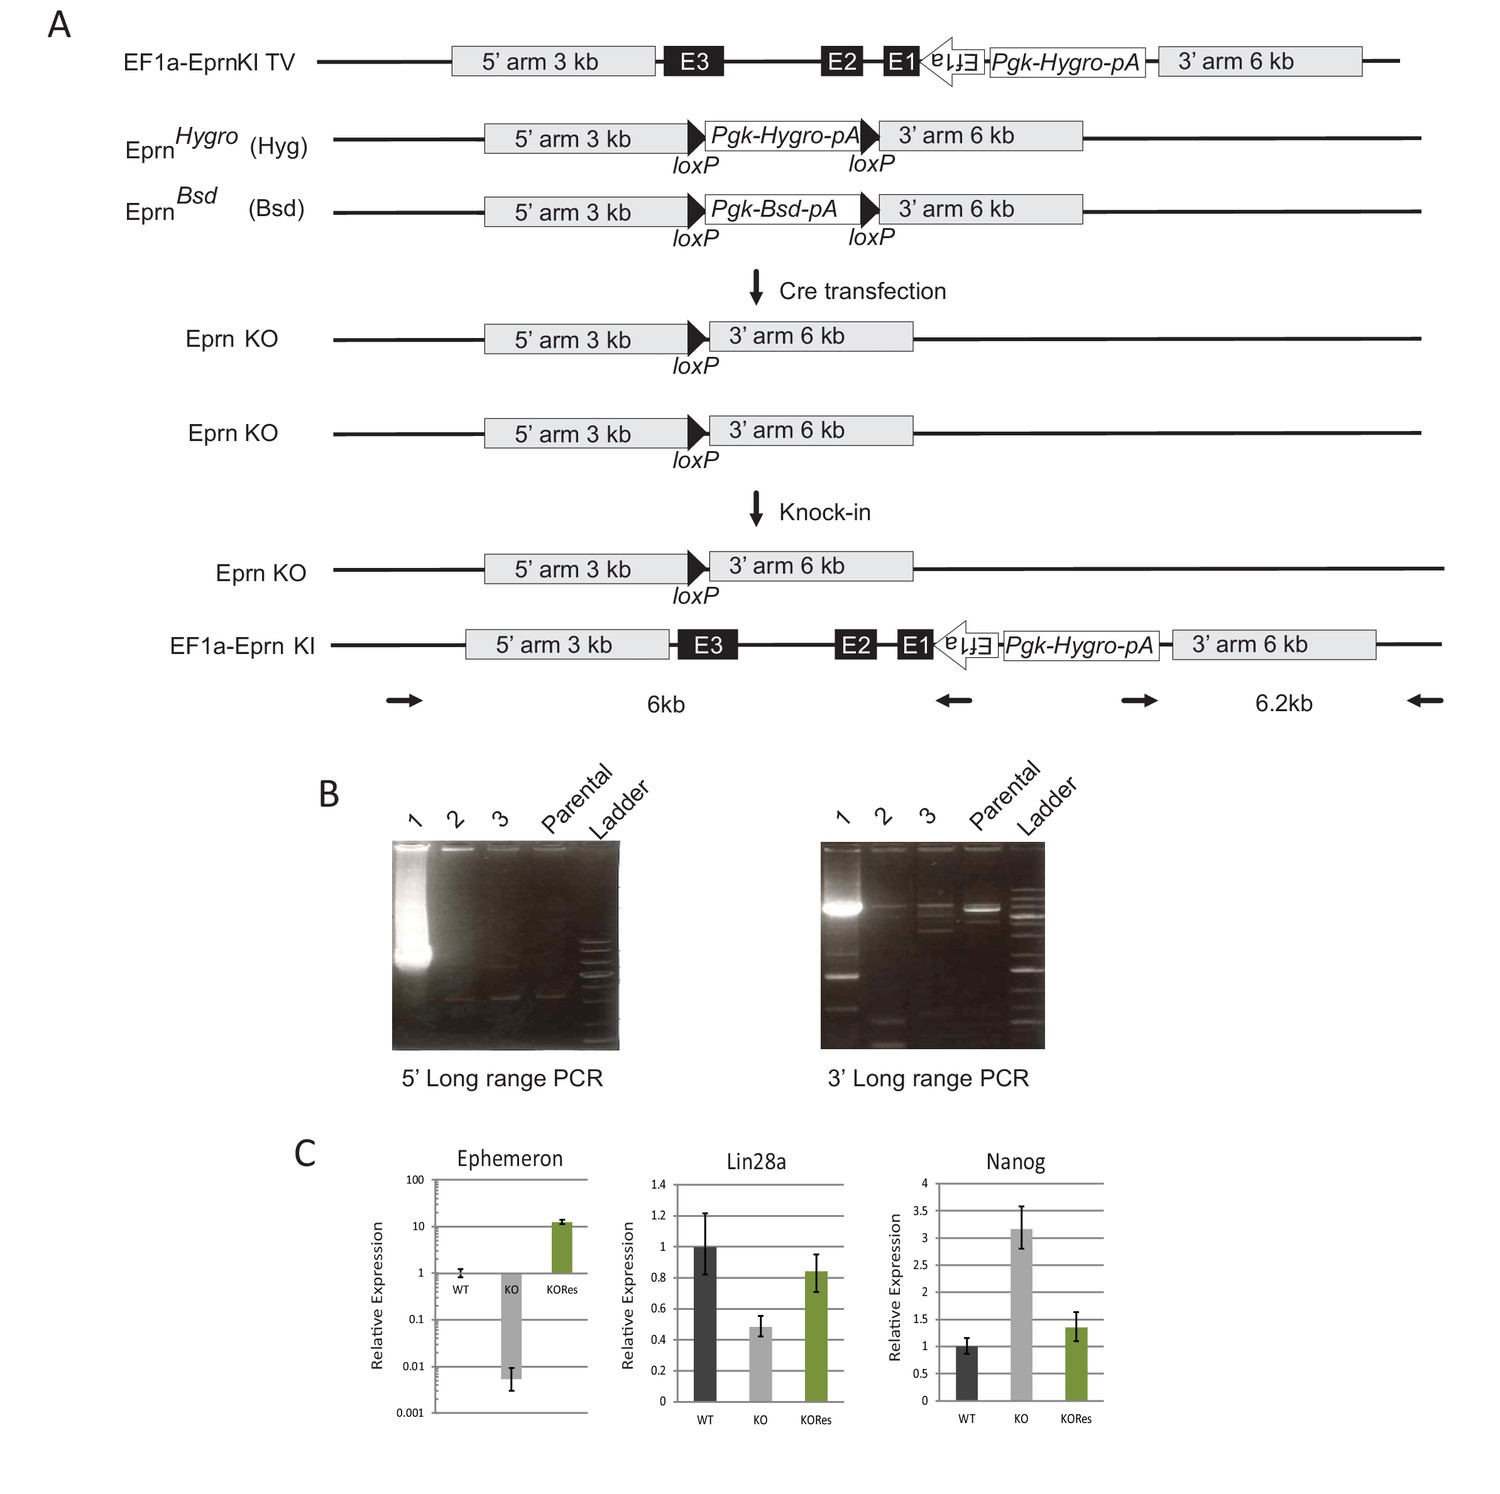
Generation of Ephemeron KO rescue ESCs.
(A) Generation of Eprn KO rescue cells by knock-in of the human EF1a promoter driving the genomic region containing all Eprn exons. The EF1a promoter TSS site was cloned to be directly upstream of the first base of Eprn exon 1. (B) Long-range PCR genotyping of targeted clone. 5’ long range PCR product, 6 kb; 3’ long range PCR product, 6.2 kb. (C) Expression of Eprn, Lin28a and Nanog relative to β-actin in PD/LIF measured by RT-qPCR. Mean ± SD, n = 3.
Figure 2—figure supplement 4
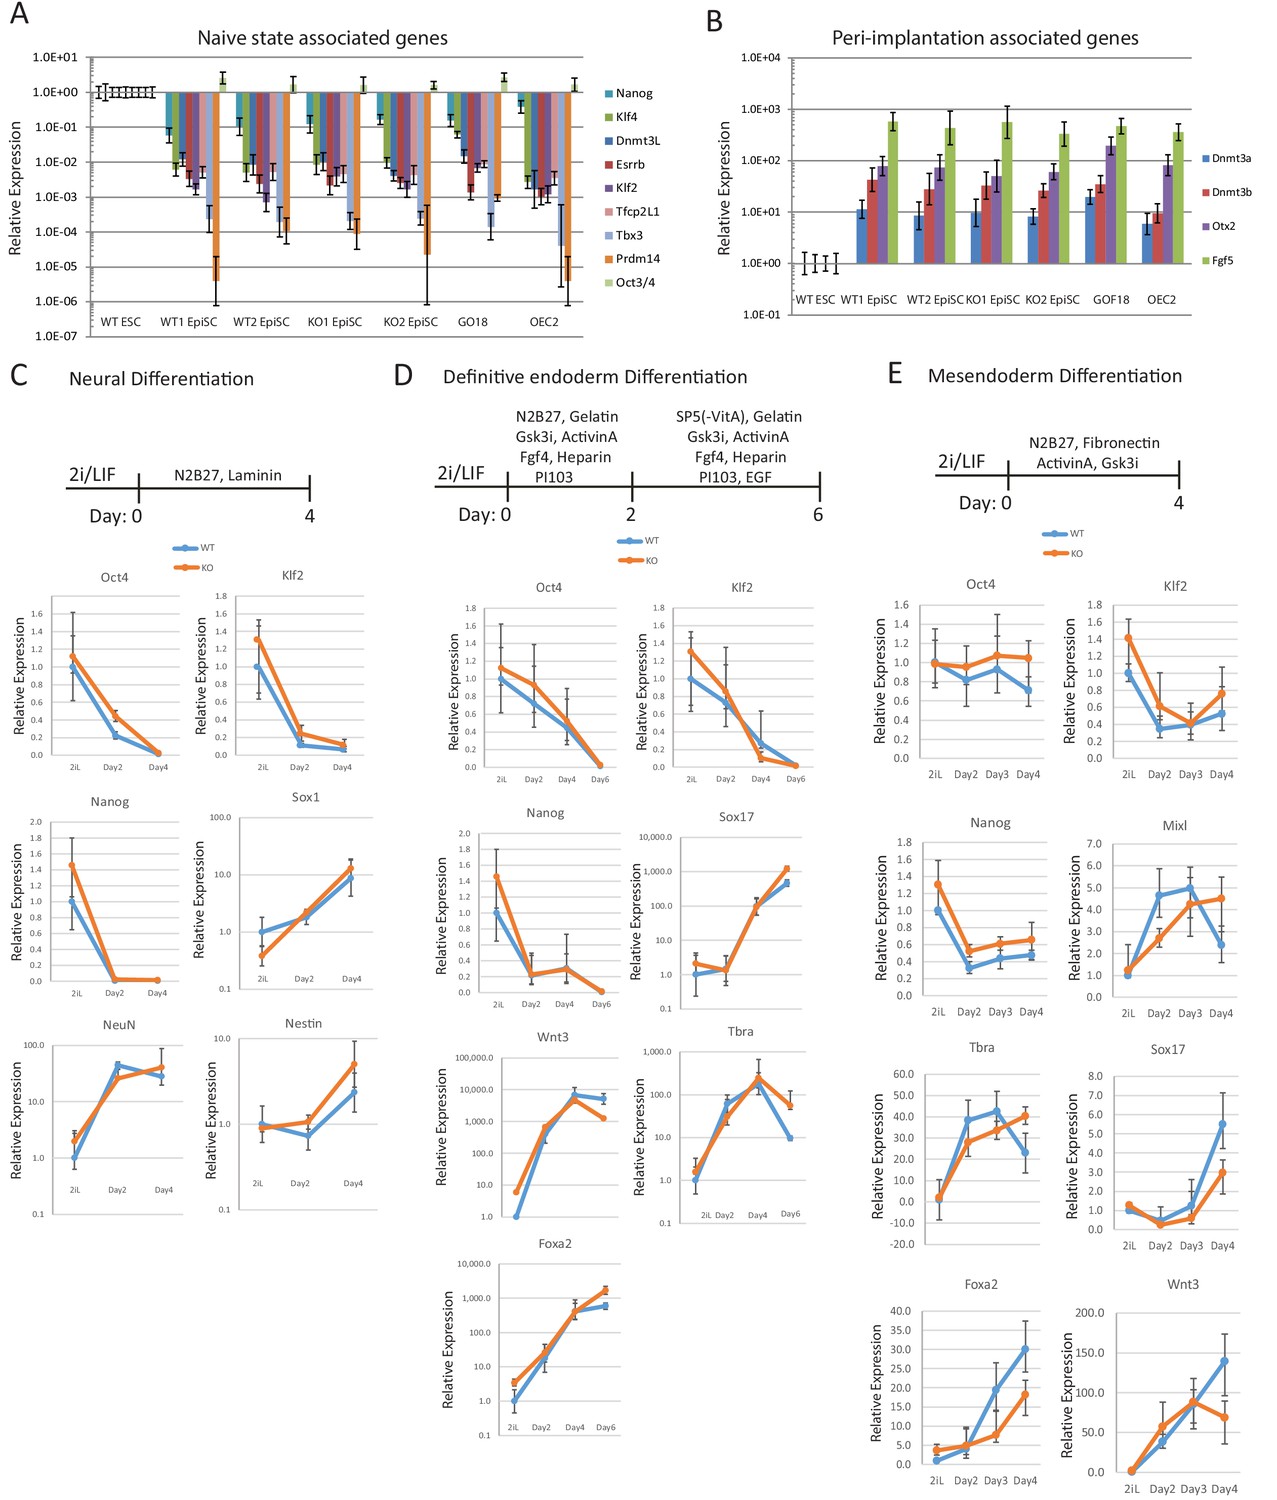
Differentiation capacity of Eprn KO ESCs.
(A,B) naïve associated (A) and early peri-implantation epiblast associated (B) gene expression relative to β-actin in wild type and Eprn KO ESC derived EpiSCs. Mean ± SD, n = 3. (C) Neuronal differentiation protocol and gene expression of wild type and Eprn KO ESCs relative to β-actin. Mean ± SD, n = 3. (D) Definitive endoderm differentiation protocol and gene expression of wild type and Eprn KO ESCs relative to β-actin. Mean ± SD, n = 3. (E) Mesendoderm differentiation protocol and gene expression of wild type and Eprn KO ESCs relative to β-actin. Mean ± SD, n = 3.
Figure 3 with 2 supplements
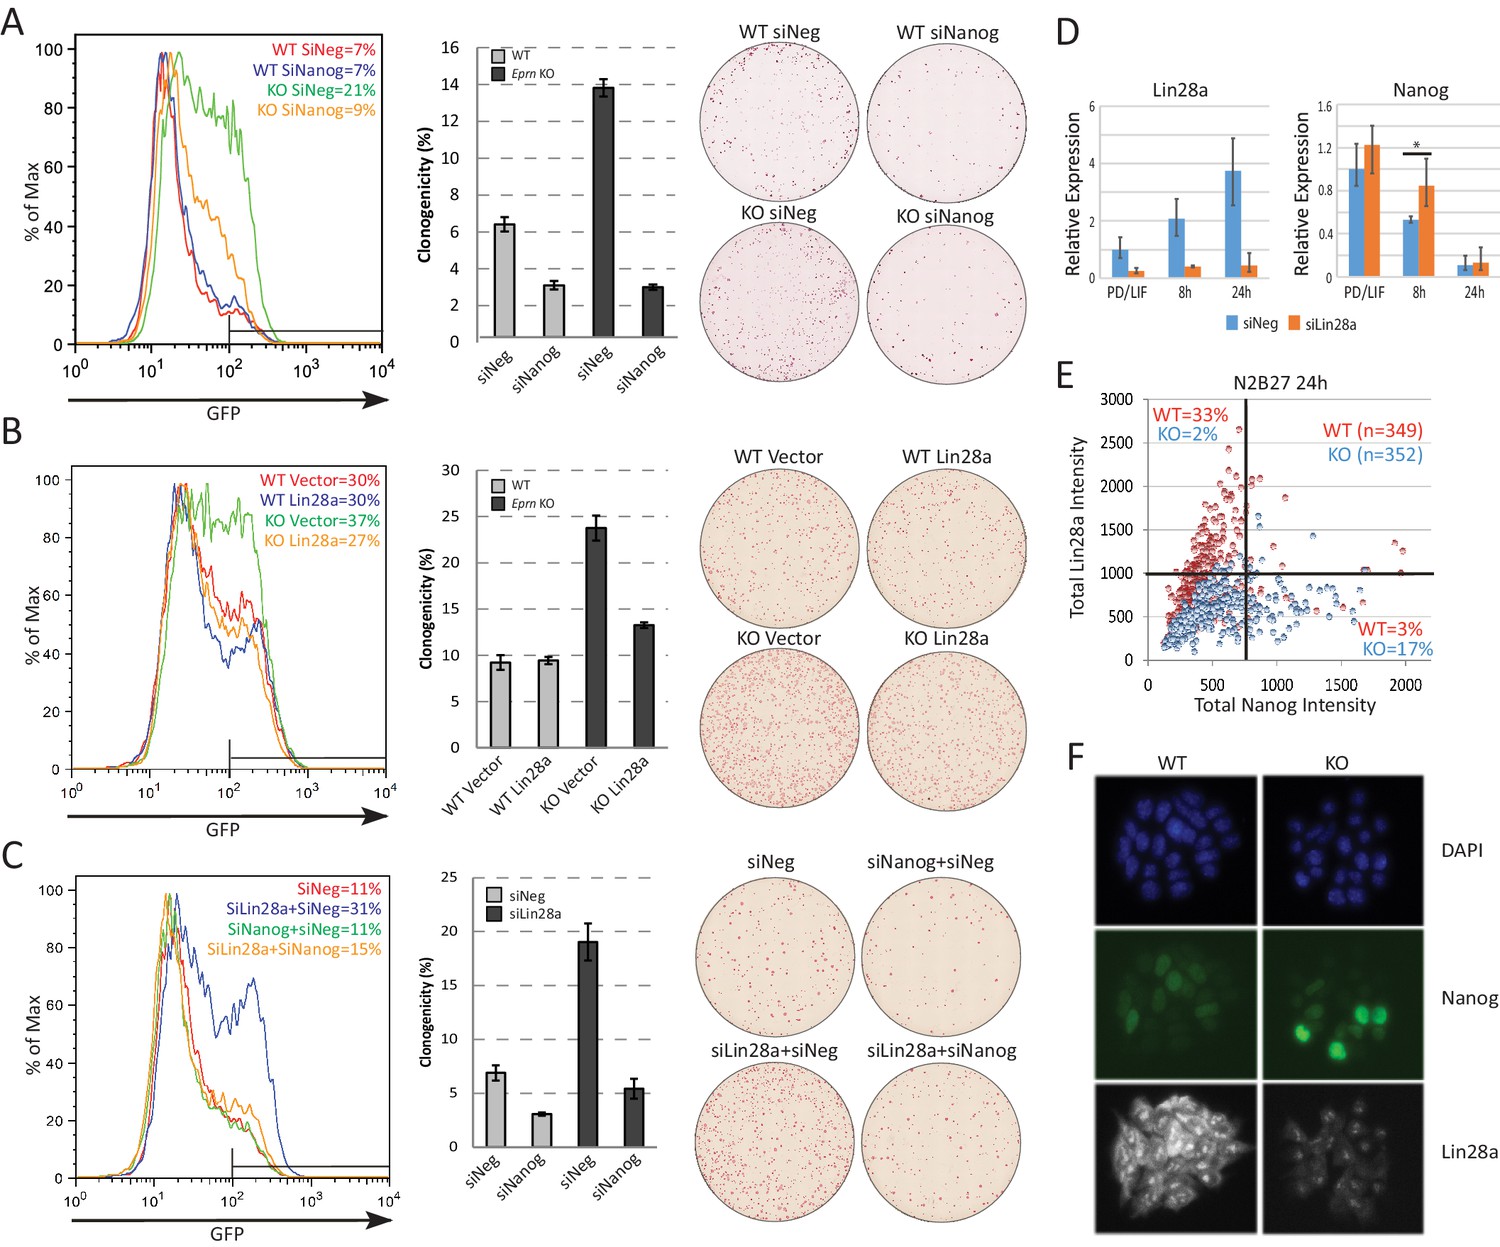
Lin28a is downstream of Ephemeron and regulates Nanog expression.
(A) Rex1-GFP flow cytometry profiles (Left) and colony formation capacity (Right) 40 hr post PD/LIF withdrawal for wild type and Eprn KO cells transfected with indicated siRNAs. (B) Rex1-GFP flow cytometry profiles and colony formation capacity 40 hr post PD/LIF withdrawal for wild type and Eprn KO cells transfected with Lin28a expression vector. (C) Rex1-GFP flow cytometry profile and colony formation capacity 40 hr post PD/LIF withdrawal with Nanog and Lin28a single or dual knockdowns in wild type cells. Quantification of percentage of GFP high cells were shown in (A-C). Percentage clonogenicity in (A-C) is measured by the number of AP positive colonies divided by the total number of cells plated, with representative AP staining images shown. Mean ± SD, n = 3. (D) Lin28a and Nanog expression relative to β-actin upon PD/LIF withdrawal in Lin28a knockdown and control cells. Mean ± SD, n = 3. *p<0.05, Student’s t-test. (E) Correlation of Nanog and Lin28a protein expression immunostaining in wild type and Eprn KO cells 24 hr post PD/LIF withdrawal. (F) Representative images of cells co-immunostained with Nanog and Lin28a and quantified in E.
Figure 3—figure supplement 1
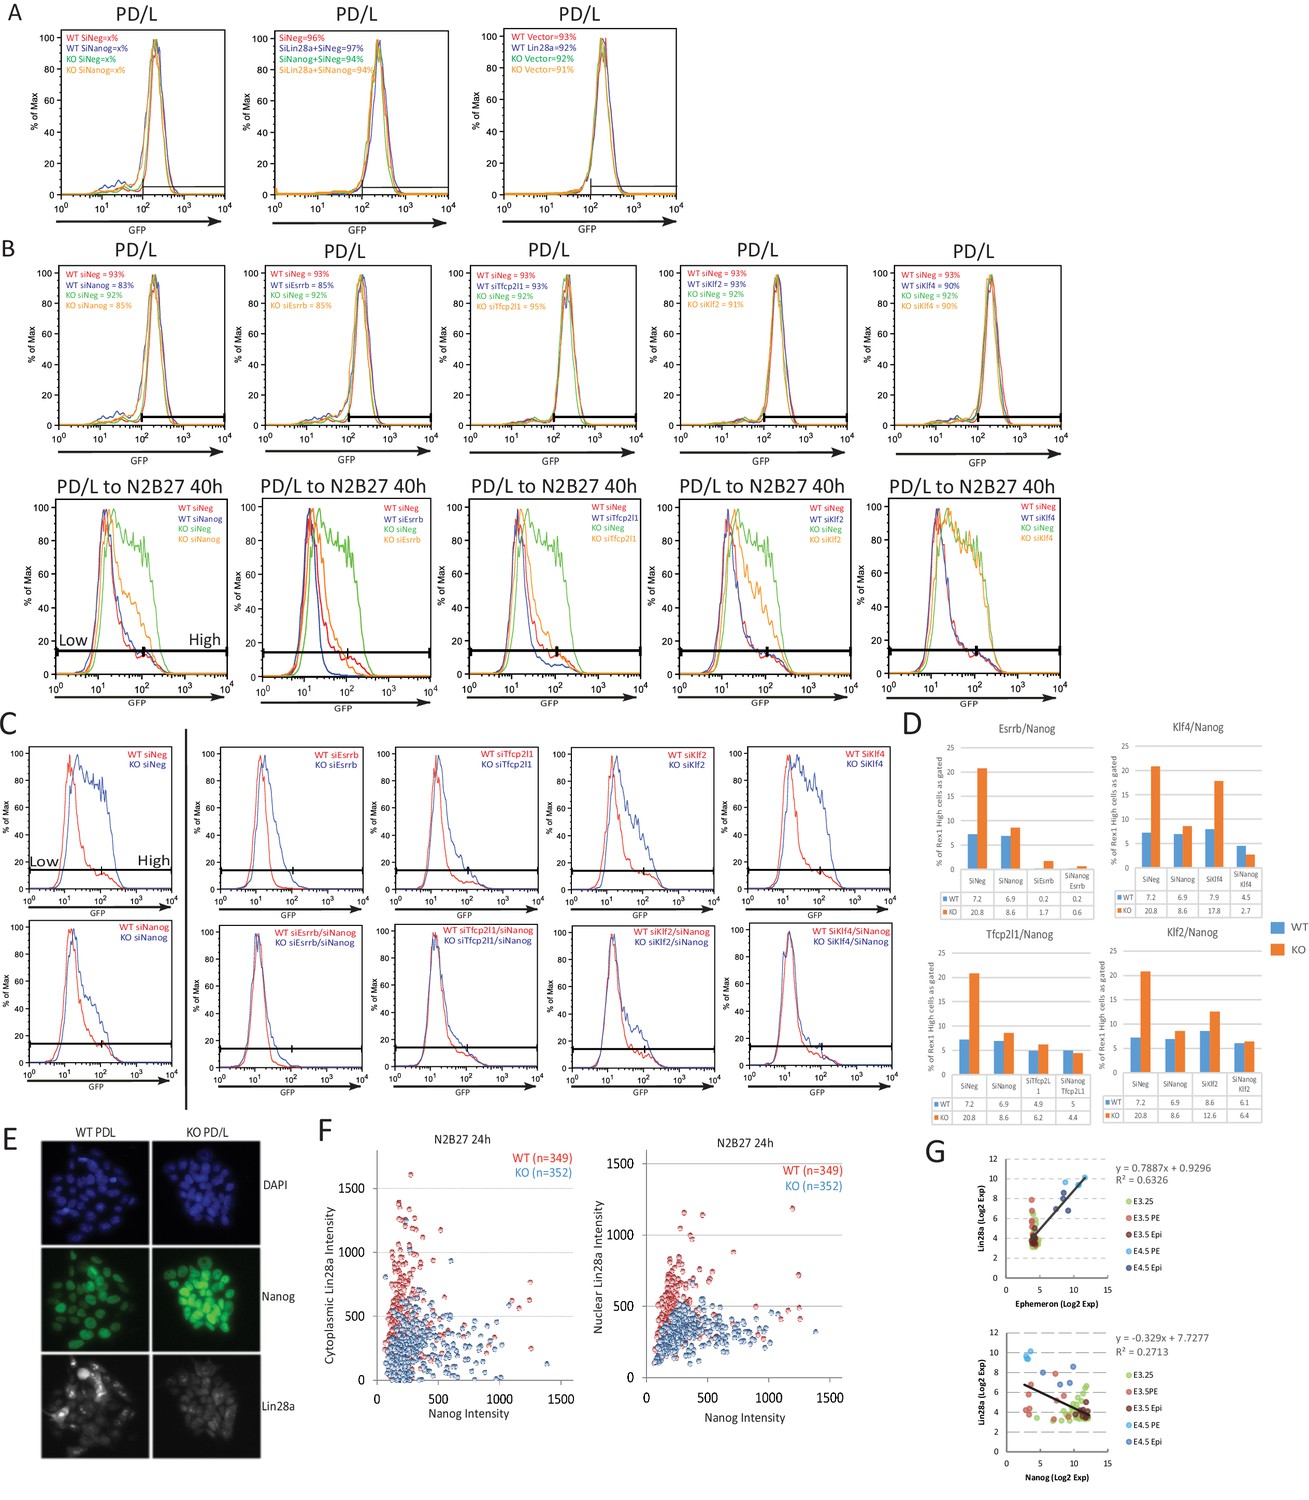
Characterisation of Eprn, Nanog and Lin28a genetic interaction.
(A) Rex1-GFP profiles of indicated genetic manipulations of wild type and Eprn KO cells in PD/LIF and 40 hr post PD/LIF withdrawal, related to Figure 3A–C. (B) Knockdown effects of several core pluripotency network factors on Rex1-GFP profile in wild type and Eprn KO cells in PD/LIF and upon 40 hr withdrawal. (C) Rex1-GFP profiles upon knockdown of core pluripotency factors singly or together with Nanog in wild type and Eprn KO cells at 40 hr post PD/LIF withdrawal. (D) Quantification of Rex1-GFP high population as gated in C in wild type and Eprn KO cells. (E) Representative immunostaining images of wild type and Eprn KO cells cultured in PD/LIF. (F) Correlation analysis of Nanog and Lin28a protein expression based on quantification of fluorescent intensity of individual cells in wild type and Eprn KO cells 24 hr post PD/LIF withdrawal. (G) Correlation analysis of Eprn, Lin28a and Nanog expression at single cell levels during pre-implantation embryo development based on published dataset (Ohnishi et al., 2014).
Figure 3—figure supplement 2
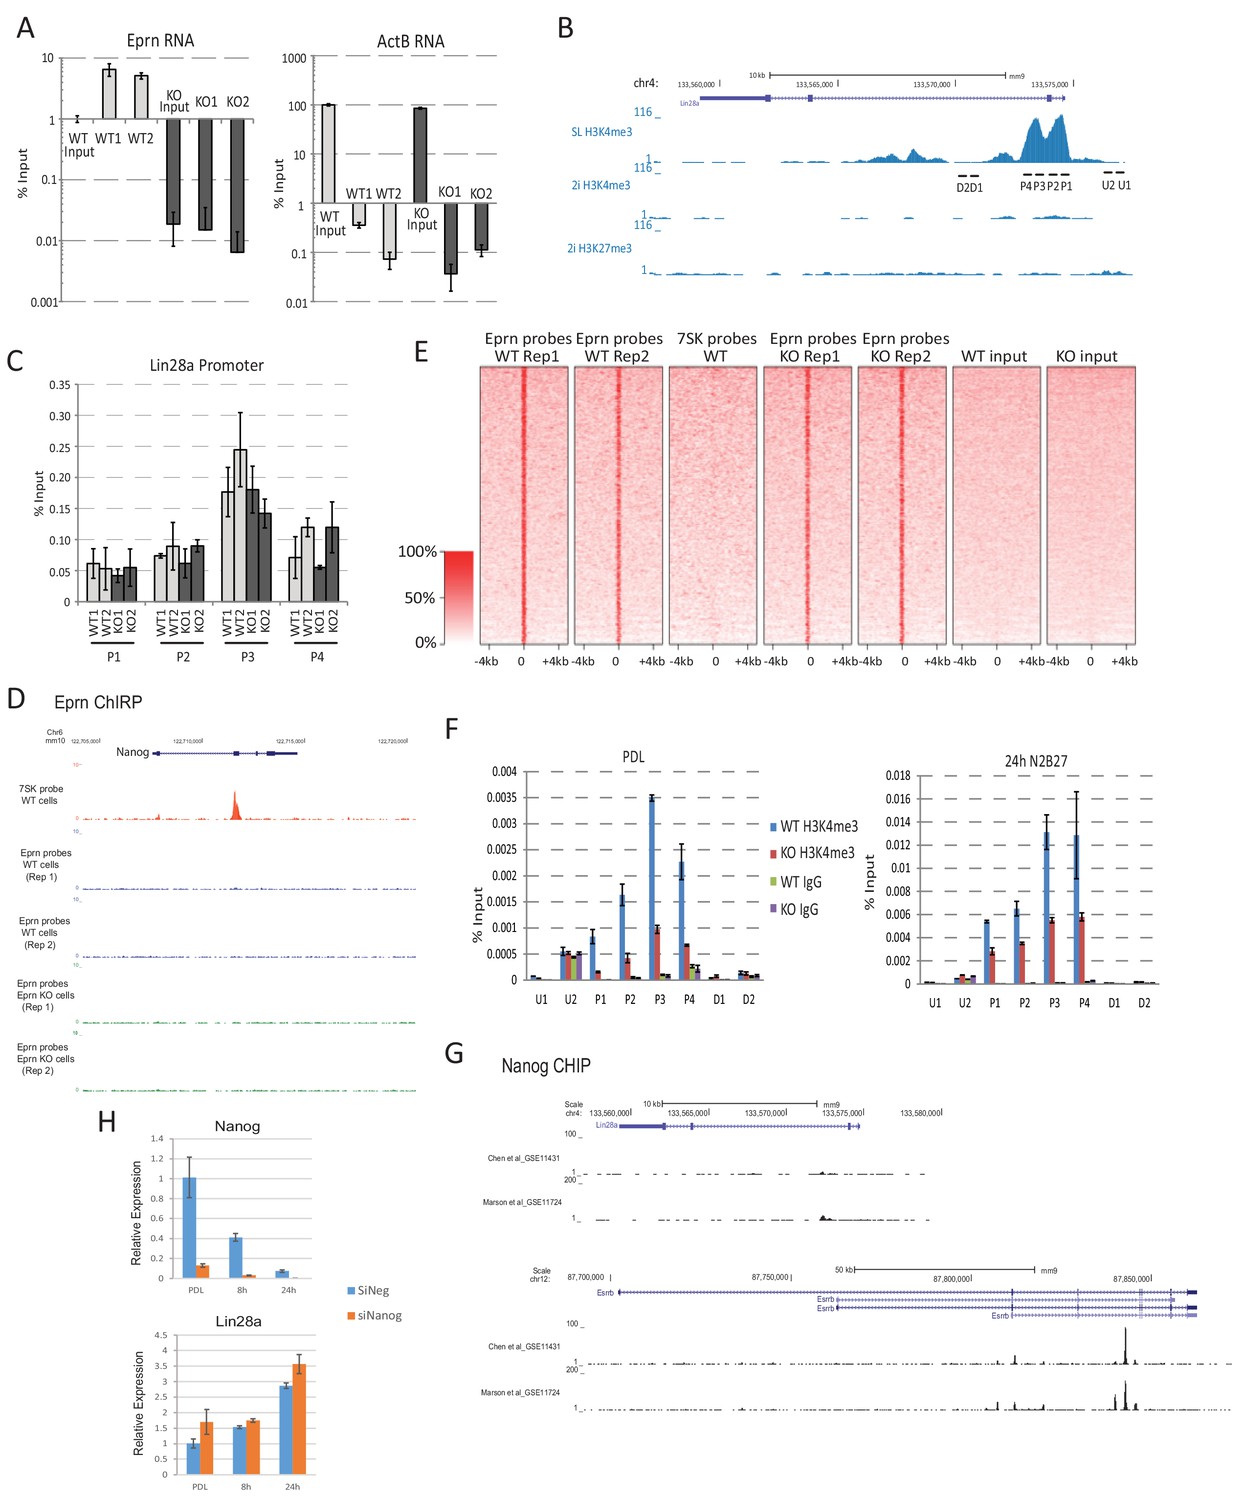
Eprn does not act on chromatin.
(A) ChIRP using probe sets recognising Eprn specifically enriched Eprn RNA quantified by RT-qPCR. Mean ± SD, n = 3. (B) Lin28a promoter region and H3K4me3 modification status base on published dataset (Marks et al., 2012). SL, serum/LIF. (C) ChIRP using Eprn probe set did not enrich Lin28a promoter chromatin quantified by qPCR. Mean ± SD, n = 3. The regions analysed are show in B. (D) Eprn ChIRP profile at Nanog locus. (E) Genome-wide Eprn ChIRP peaks in wild type and Eprn KO cells. 7SK ChIRP probe was used as a negative control. (F) Lin28a promoter region H3K4me3 modification in wild type and Eprn KO cells in PD/LIF and 24 hr post PD/LIF withdrawal. Mean ± SD, n = 3. (G) Nanog ChIP profile at Lin28a and Esrrb loci based on published datasets (Marson et al., 2008) and Chen et al., 2008). (H) Lin28a expression upon Nanog knockdown in PD/LIF and up to 24 hr post PD/LIF withdrawal. Mean ± S.D, n = 3.
Figure 4 with 1 supplement

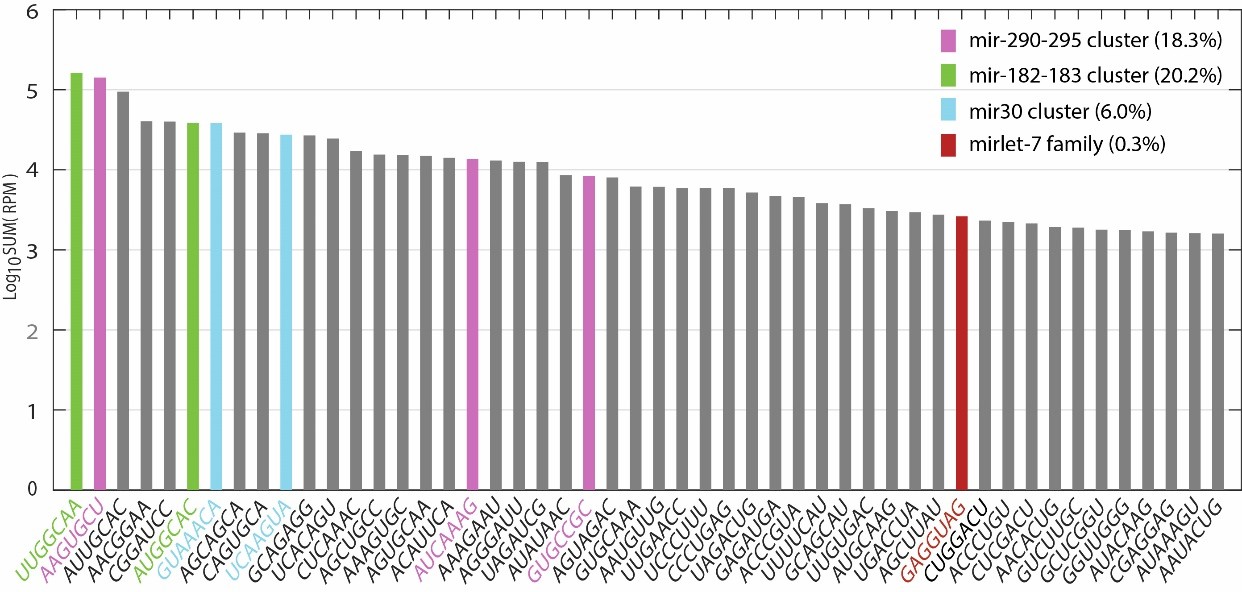
Lin28a function is mediated via members of let-7 miRNAs.
(A) Mature let-7 family microRNA expression quantified by RT-qPCR in 2i/LIF, 24 hr post 2i/LIF withdrawal, and EpiSCs. (B) Rex1-GFP flow cytometry profile upon forced expression of mature let-7g mimic during transition from 2i and PD/LIF. Quantification of percentage of GFP high cells was shown. (C) Colony formation assay in 2i/LIF of cells with forced expression of let-7g mimic and control 40 hr post PD/LIF withdrawal. Colonies were stained with alkaline phosphatase (AP). Percentage clonogenicity was calculated by the number of AP positive colonies divided by the total number of cells plated. Mean ± SD, n = 3. (D) Predicted target sites of let-7g in 3’UTRs of Dnmt3a and Dnmt3b by RNA22. (E) Dual luciferase assay measuring repression by let-7g mediated through 3’UTRs of Dnmt3a and Dnmt3b. Fold repression of Luc/Rluc relative to scramble was plotted. Mean ± SD, n = 3. (F) Relative expression normalised to β-actin of naïve and peri-implantation epiblast associated genes in ESCs with forced expression of let-7g mimics. Mean ± SD, n = 3.
Figure 4—figure supplement 1
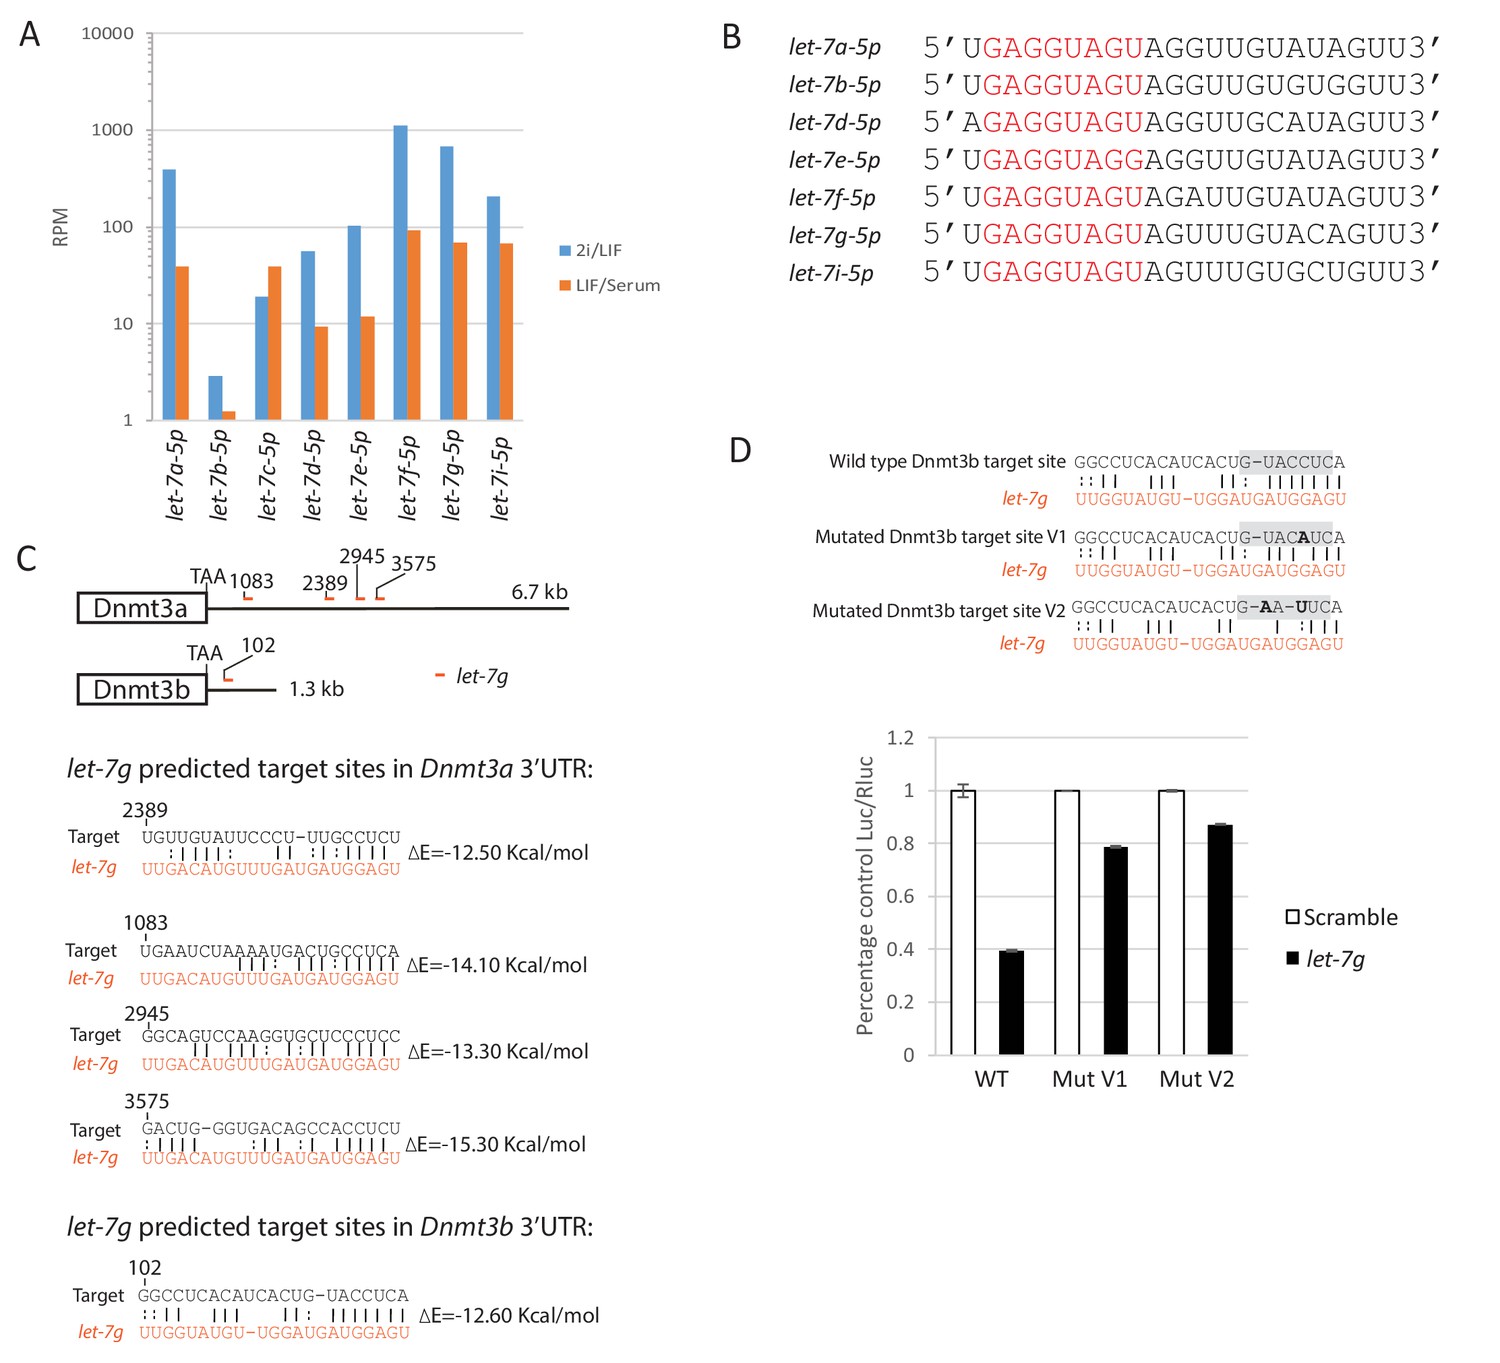
let-7 family mature miRNA expression, sequence and predicted let-7g sites in the 3’UTRs of Dnmt3a and Dnmt3b.
(A) let-7 family mature miRNA expression in ESCs cultured in 2i/LIF and Serum/LIF from published dataset (Pandolfini et al., 2016). (B) Mature miRNA sequence of Lin28a regulated let-7 members. Seed sequences are coloured in red. (C) Predicted let-7g target sites and target/miRNA heteroduplex structures and folding energy based on RNA22 V2 predictions. (D) Dual luciferase assay measuring repression by let-7g on the reporter mediated through wild type and mutated Dnmt3b 3’UTRs. Top, mutated reporter binding sites with the seed recognition site shaded grey and mutations highlighted in bold. Bottom, fold repression of Luc/Rluc relative to scramble was plotted. Mean ± SD, n = 3.
Figure 5 with 1 supplement
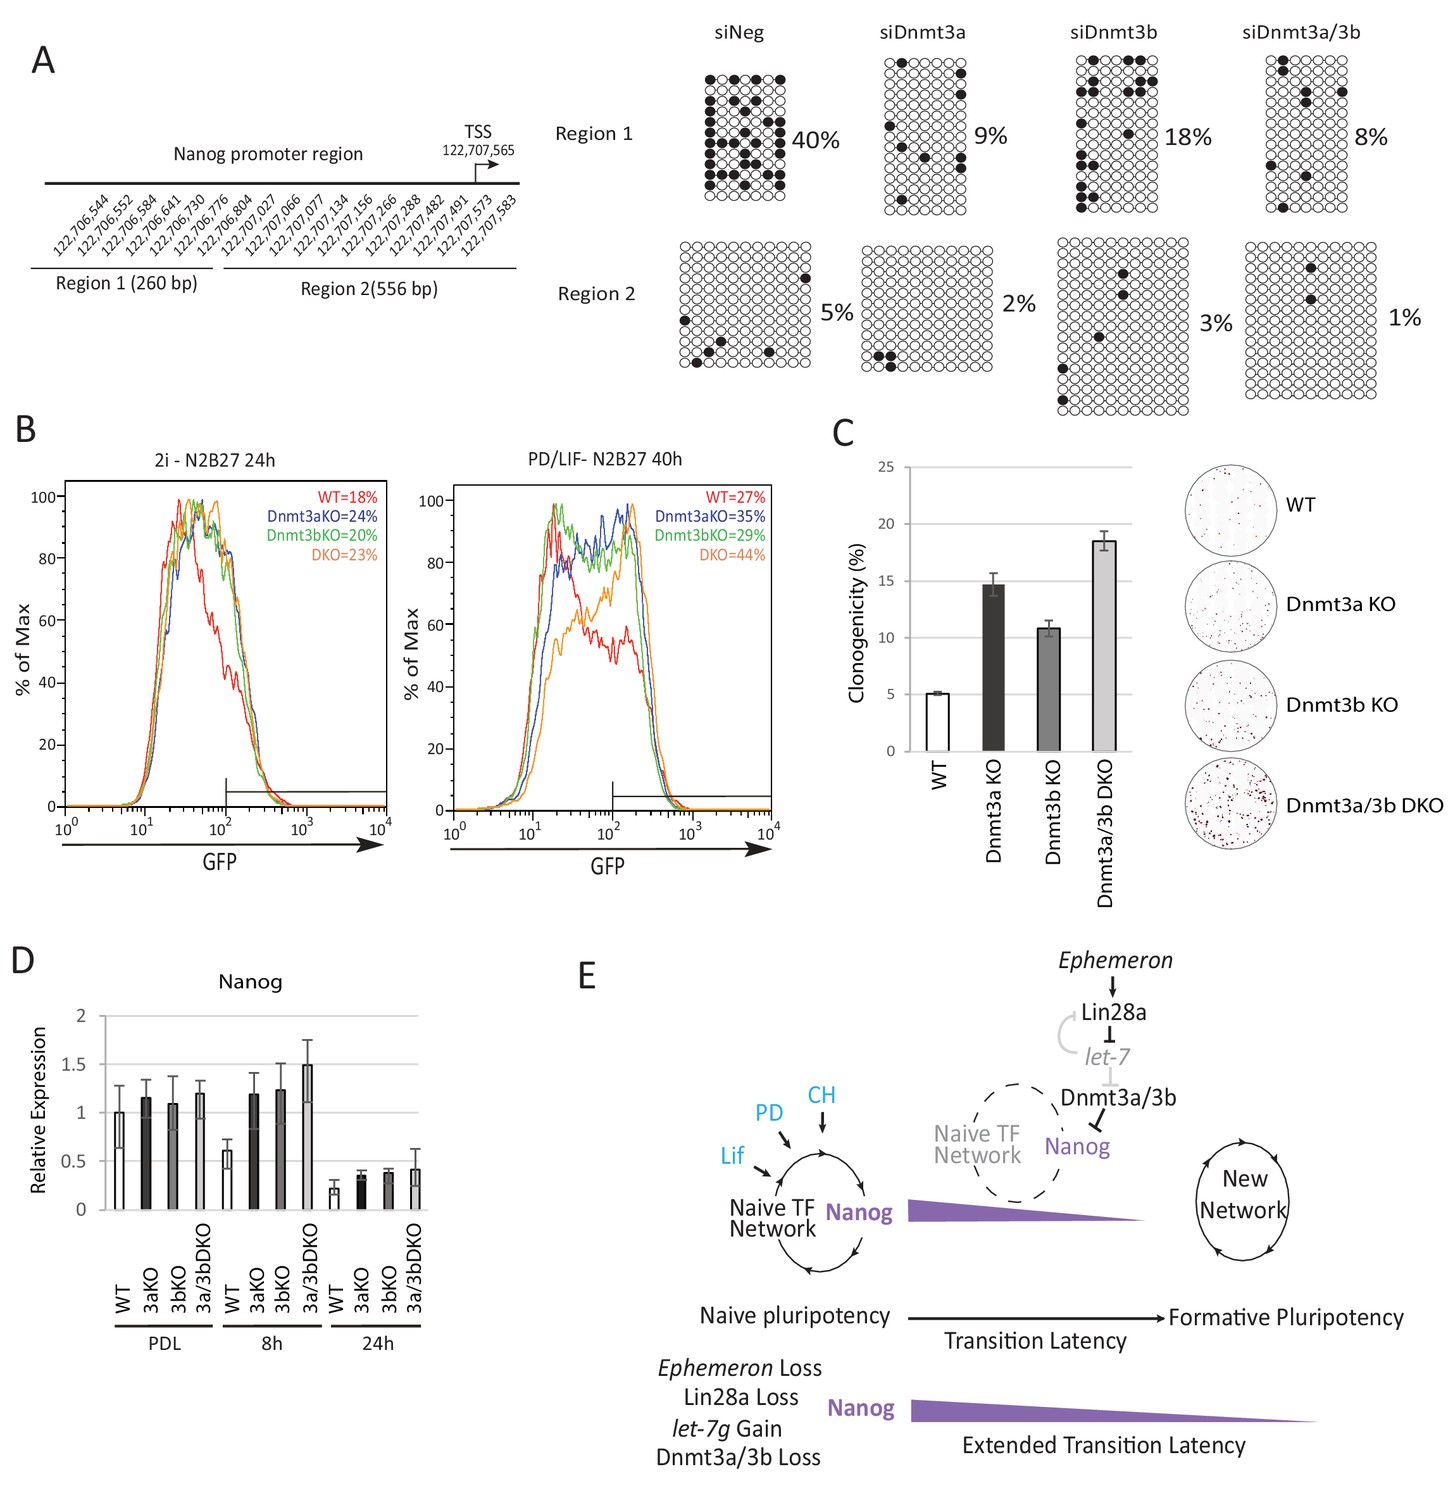
Loss of Dnmt3a and Dnmt3b delays naïve state exit associated with transient persistence of Nanog expression.
(A) Bisulfite sequencing analysis of Nanog proximal promoter CpG island DNA methylation in Dnmt3a and Dnm3b single and dual knockdown cells at 40 hr post PD/LIF withdrawal. The positions of cytosines analysed (mm10) are indicated on the left panel. Black and while circles represent methylated and unmethylated cytosine respectively. (B) Rex1-GFP flow cytometry profiles of Dnmt3a and Dnmt3b single and dual KO cells withdrawn from 2i or PD/LIF for 24 and 40 hr respectively. Percentage of GFP high cells were quantified. (C) colony formation capacity 40 hr post PD/LIF withdrawal for Dnmt3a and Dnmt3b single and compound KO cells. Percentage clonogenicity was measured by the number of AP positive colonies formed divided by the total number of cells plated, with representative AP staining images shown. Mean ± SD, n = 3. (D) Expression of Nanog relative to β-actin in Dnmt3a and Dnmt3b single and compound KO cells quantified by RT-qPCR. Mean ± SD, n = 2. (E) Schematic representation of the inferred Eprn pathway. Legends for Figures and Source Data.
Figure 5—figure supplement 1
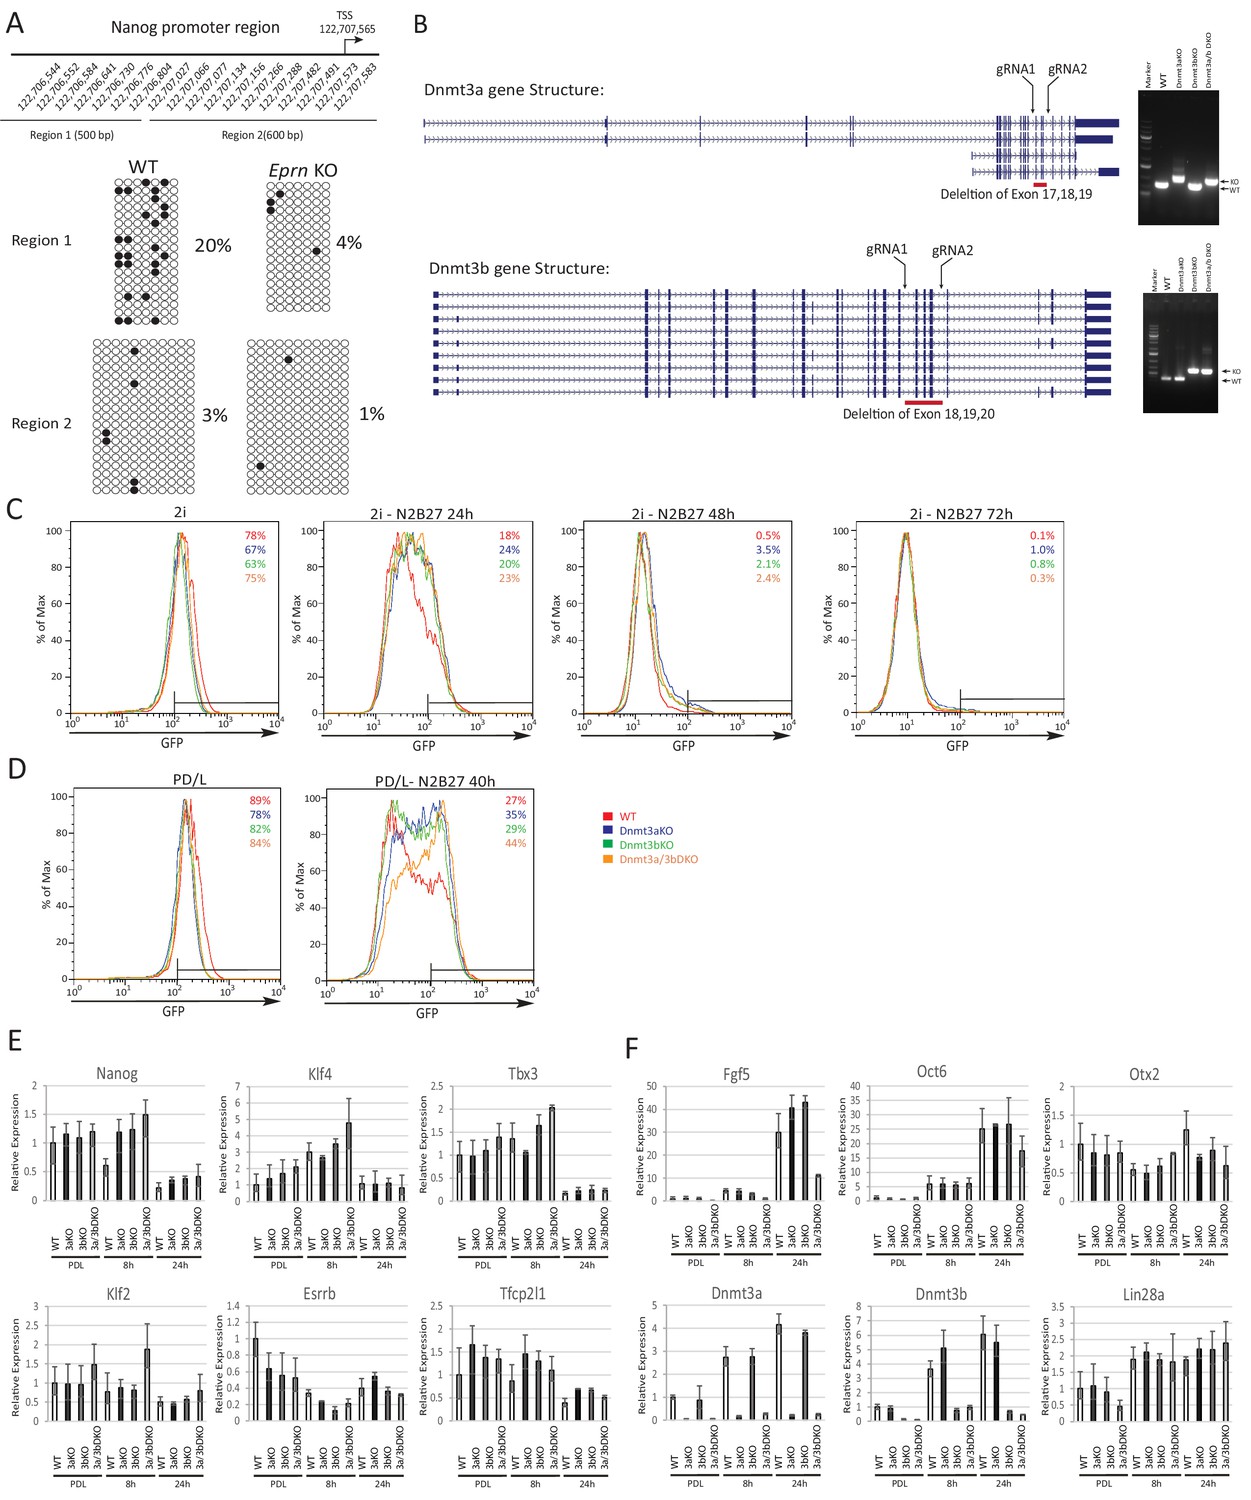
Phenotypic and molecular characterisation of Dnmt3a/3b KO in naïve state exit.
(A) Bisulfite sequencing analysis of Nanog proximal promoter CpG DNA methylation in wild type and Eprn KO cells at 40 hr post PD/LIF withdrawal. The positions of cytosines (mm10) analysed are indicated. Black and white circles represent methylated and unmethylated cytosine. (B) Dnmt3a and Dnmt3b variants with designed gRNA positions. Right panel, genotyping confirmation of homozygous deletions for Dnmt3a and Dnmt3b single and compound KO ESCs and the primer sequences are shown in Supplementary file 2B. (C) Rex1-GFP profiles over 2i withdrawal time course for wild type and Dnmt3a/3b single and compound KO ESCs. Percentage of Rex1-GFP high cells are quantified. (D) Rex1-GFP profiles for Dnmt3a/3b single and compound KO in PD/LIF and 40 hr post PD/LIF withdrawal. Percentage of Rex1-GFP high cells are quantified. (E) Expression of core pluripotency factors relative to β-actin in Dnmt3a/3b single and dual KO ESCs upon PD/LIF withdraw. Mean ± SD, n = 3. (F) Expression of peri-implantation markers relative to β-actin in Dnmt3/3b single and dual KO ESCs upon PD/LIF withdrawal. Mean ± SD, n = 3. Legends for Supplementary File.
Author response image 1
Additional files
-
Supplementary file 1
Primers for generating Eprn Targeting vector and genotyping.
- https://doi.org/10.7554/eLife.23468.019
-
Supplementary file 2
Primers for generating gRNAs vectors and genotyping for Dnmt3a/3b knockouts.
- https://doi.org/10.7554/eLife.23468.020
-
Supplementary file 3
siRNAs and mature miRNA mimics used in this study.
- https://doi.org/10.7554/eLife.23468.021
-
Supplementary file 4
Primers for generating Southern and Northern blotting probes by PCR.
- https://doi.org/10.7554/eLife.23468.022
-
Supplementary file 5
Primers for RACE and nested PCR amplification.
- https://doi.org/10.7554/eLife.23468.023
-
Supplementary file 6
Primers for Real-time quantitative RT-PCR.
- https://doi.org/10.7554/eLife.23468.024
-
Supplementary file 7
ChIRP probes used in this study.
- https://doi.org/10.7554/eLife.23468.025
-
Supplementary file 8
Primers used for Lin28a promoter ChIP PCR.
- https://doi.org/10.7554/eLife.23468.026
-
Supplementary file 9
Primers used for Nanog promoter DNA methylation analysis.
- https://doi.org/10.7554/eLife.23468.027
Download links
A two-part list of links to download the article, or parts of the article, in various formats.
Downloads (link to download the article as PDF)
Open citations (links to open the citations from this article in various online reference manager services)
Cite this article (links to download the citations from this article in formats compatible with various reference manager tools)
A lncRNA fine tunes the dynamics of a cell state transition involving Lin28, let-7 and de novo DNA methylation
eLife 6:e23468.
https://doi.org/10.7554/eLife.23468


