The N-terminus of the prion protein is a toxic effector regulated by the C-terminus
- Boston University School of Medicine, United States
- University of California, United States
- University of Delaware, United States
- Ruhr University Bochum, Germany
- Ludwig Maximilians University, Germany
Figures
Figure 1 with 2 supplements
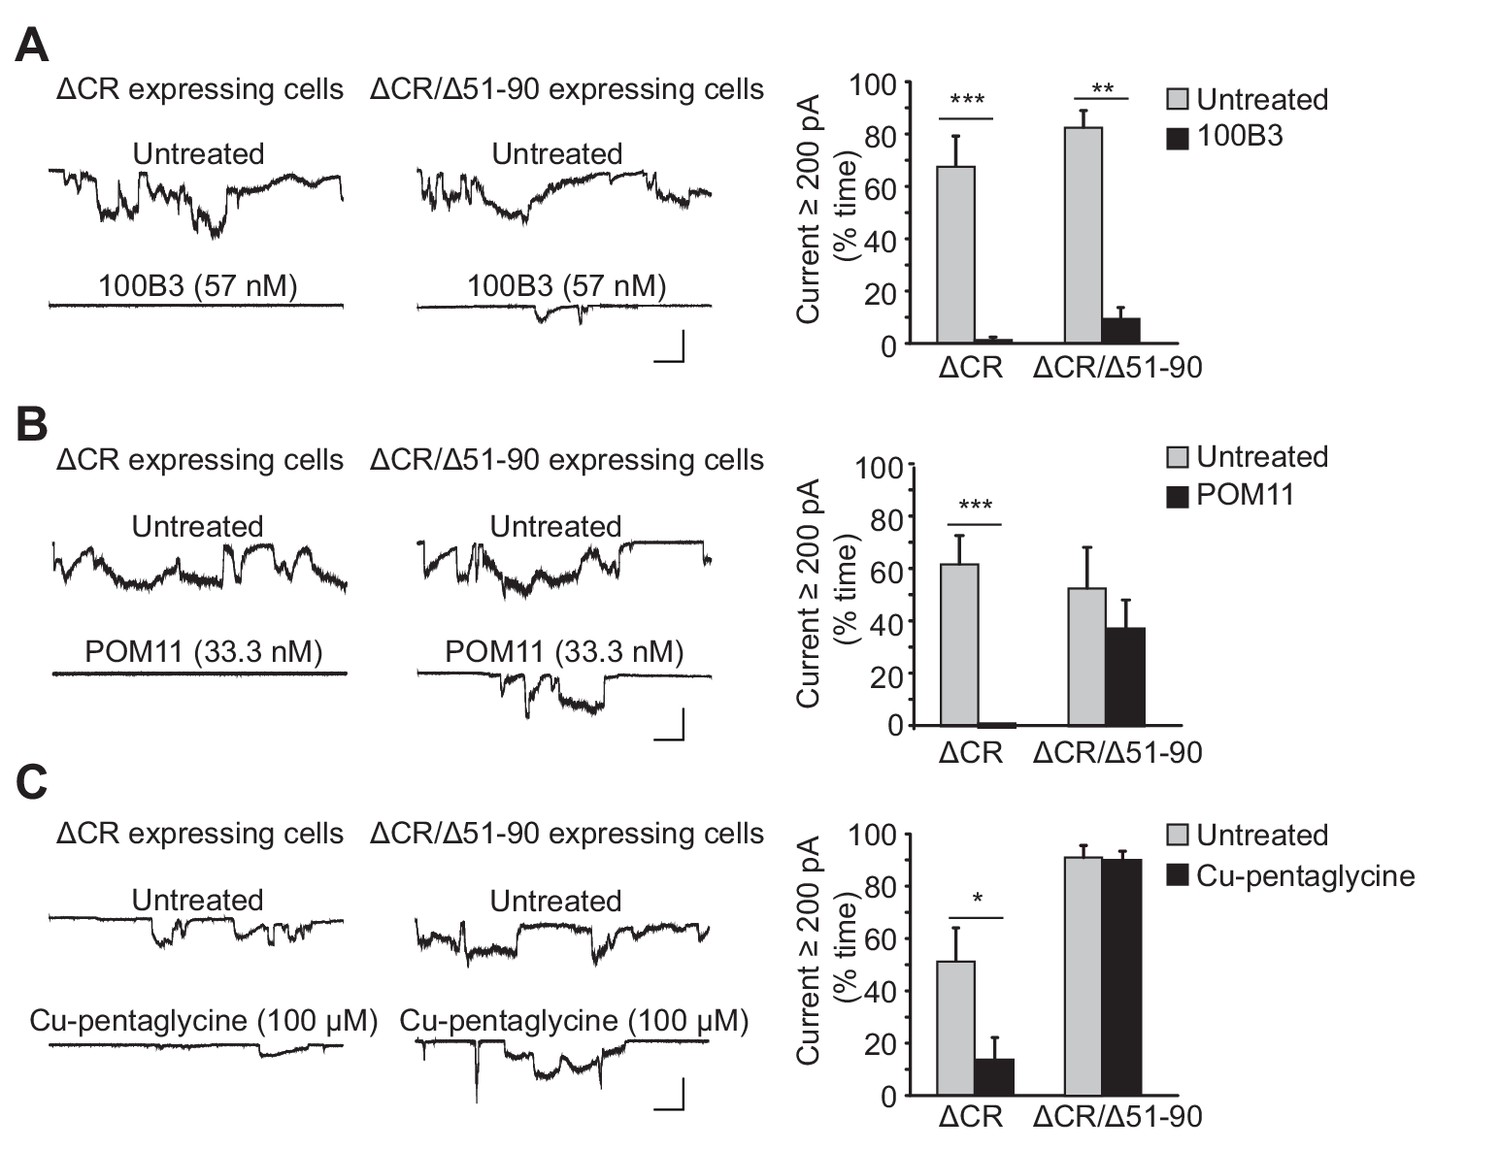
Ligands binding to the N-terminal domain of PrPC block ΔCR-induced currents.
(A) Left, representative traces of currents recorded from N2a cells expressing ΔCR or ΔCR/Δ51–90 PrP in the absence (upper traces) or presence (lower traces) of 100B3 (57 nM). Right, quantitation of the currents, plotted as the percentage of the total time the cells exhibited inward current ≥200 pA (mean ± S.E.M., n = 10). (B) Left, representative traces of currents recorded from N2a cells expressing ΔCR or ΔCR/Δ51–90 PrP in the absence (upper traces) or presence (lower traces) of POM11 (33.3 nM). Right, quantitation of the currents (mean ± S.E.M., n = 10). (C) Left, representative traces of currents recorded from N2a cells expressing ΔCR or ΔCR/Δ51–90 PrP in the absence (upper traces) or presence (lower traces) of Cu-pentaglycine (100 μM). Right, quantitation of the currents (mean ± S.E.M., n = 10). Scale bars in all panels: 1 nA, 30 s. *p<0.05; **p<0.01; ***p<0.005.
-
Figure 1—source data 1
Quantification of ΔCR PrP-induced currents w/o treatment of ligands binding to PrPC N-terminus.
- https://doi.org/10.7554/eLife.23473.004
Figure 1—figure supplement 1
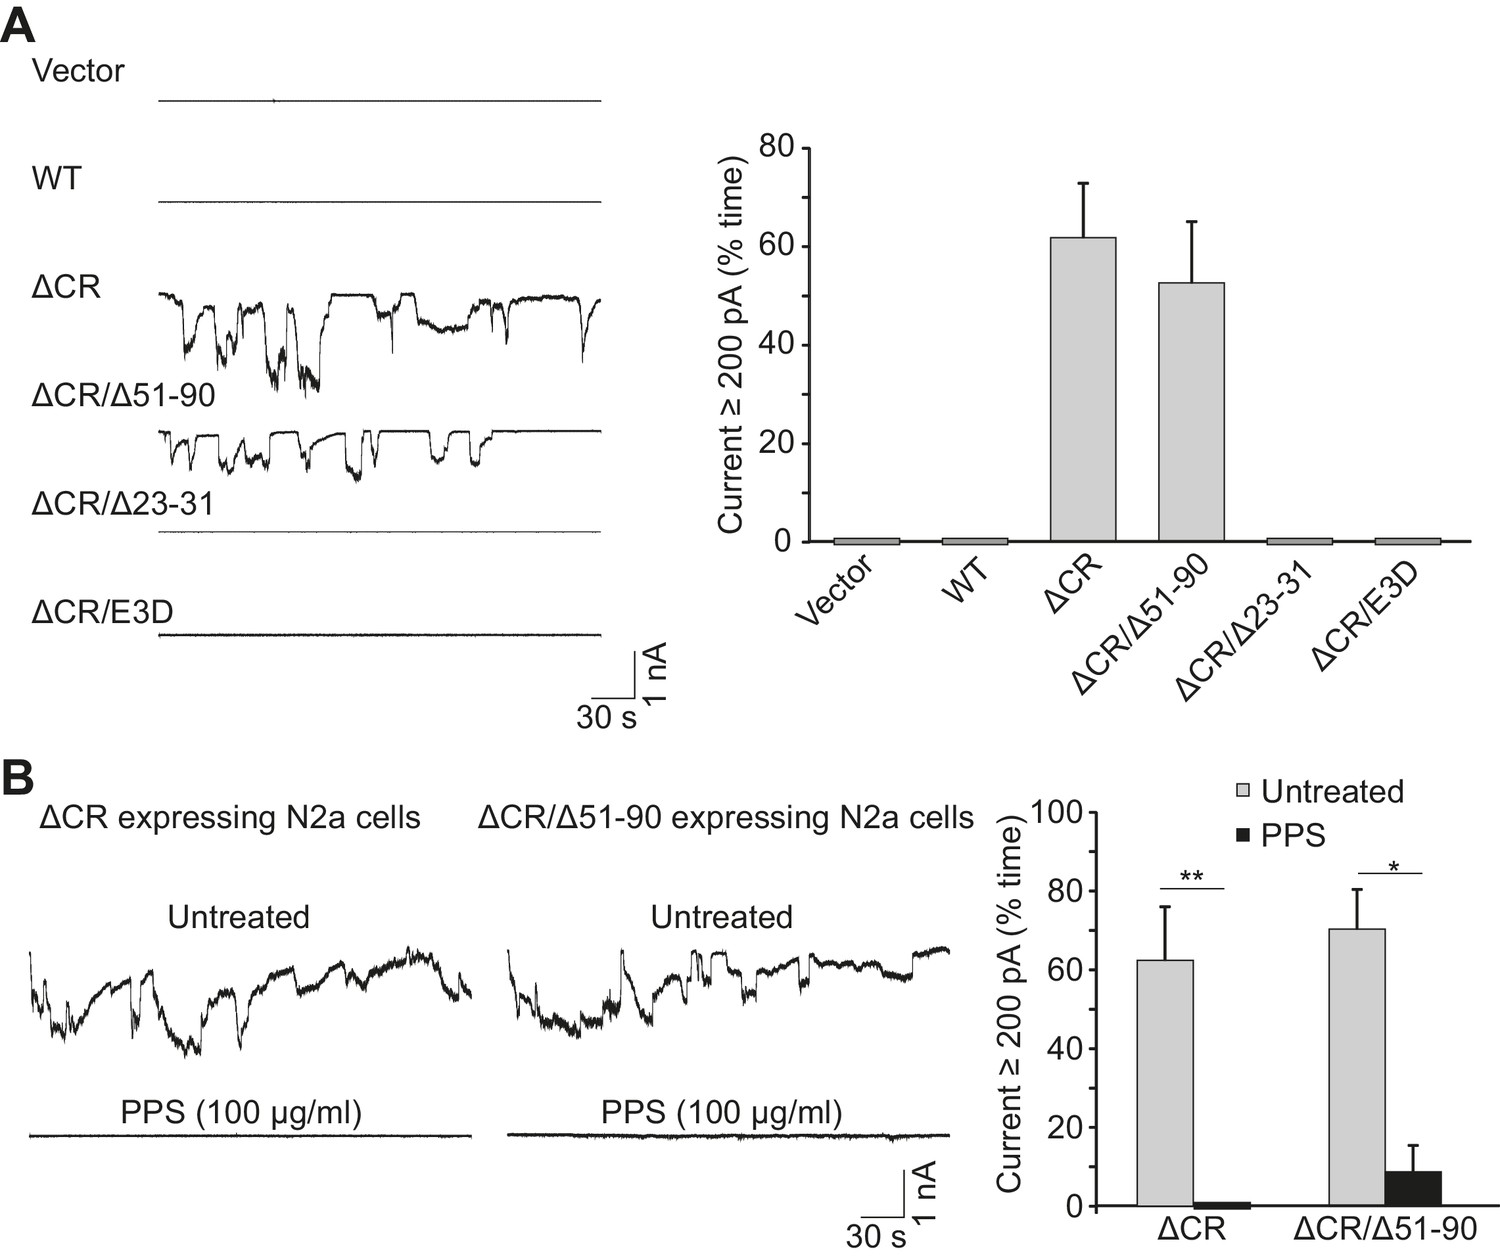
Mutated forms of PrP induce spontaneous currents.
(A) Left, whole cell recordings were made from N2a cells transfected with empty vector, or vector encoding WT, ΔCR, ΔCR/Δ51–90, ΔCR/Δ23–31, or ΔCR/E3D PrP. Right, quantitation of the currents, plotted as the percentage of the total time the cells exhibited inward current ≥200 pA (mean ± S.E.M., n = 10). (B) Left, representative traces of currents recorded from N2a cells expressing ΔCR or ΔCR/Δ51–90 PrP in the absence (upper traces) or presence (lower traces) of PPS (100 μg/ml). Right, quantitation of the currents (mean ± S.E.M., n = 10). *p<0.05, **p<0.01.
Figure 1—figure supplement 2
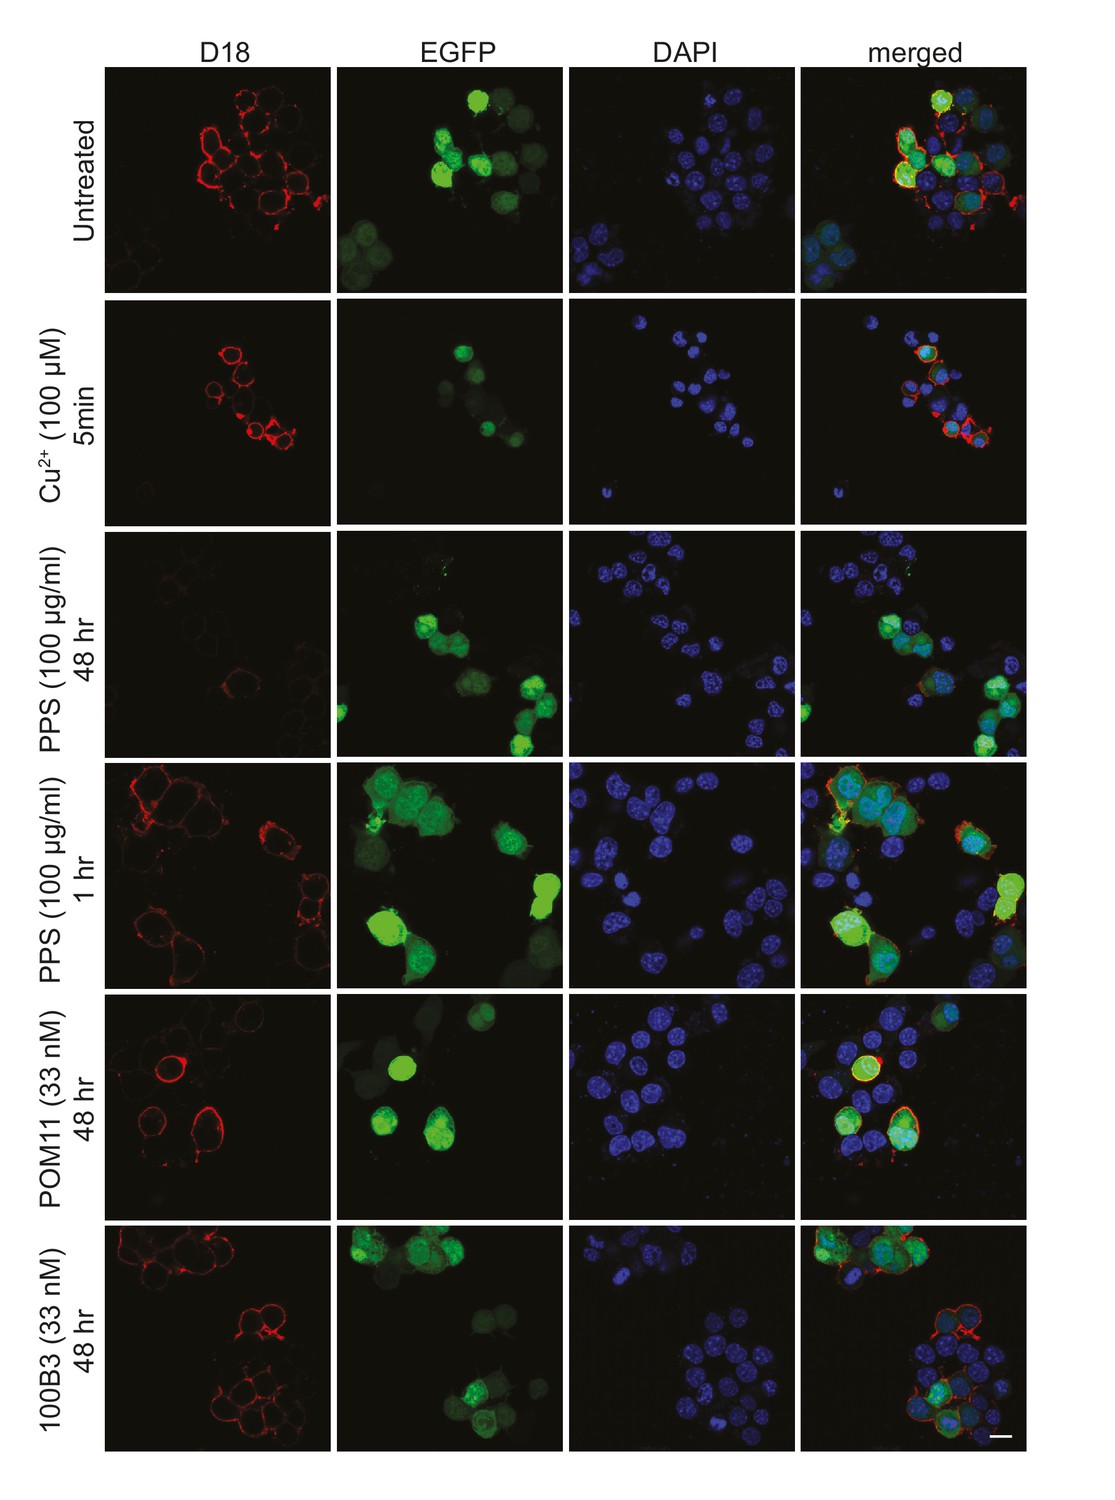
Surface immunofluorescence staining of PrPC on N2a cells expressing ΔCR after treatment with N-terminal ligands.
Living N2a cells co-transfected with a ΔCR PrP-encoding plasmid along with an EGFP marker plasmid were treated with the indicated ligands, and then stained with anti-PrP antibody D18, followed by fixation and incubation with red fluorescent secondary antibody. Representative fluorescence images show surface expression of PrP (red), EGFP fluorescence (green), and DAPI nuclear staining (blue). Scale bar: 20 μm.
Figure 2 with 1 supplement

The N-terminal domain of PrPC induces ionic currents in the absence of the C-terminal domain.
(A) Schematic of PrP(N)-EGFP-GPI constructs containing the N-terminus of PrP fused to EGFP and the PrP GPI attachment sequence. The colored blocks represent the signal sequence (blue), polybasic residues 23–31 (yellow), different portions of the N-terminus (grey), EGFP (green), and the GPI attachment sequence (magenta). (B) Fluorescence image of N2a cells expressing PrP(1-109)-EGFP-GPI, showing localization of the protein on the cell surface. Scale bar = 10 μm. (C) Left, representative traces of currents recorded from N2a cells expressing constructs with different lengths of the N-terminus (1–31, 1–58, 1–90, 1–109 and 32–109). Scale bars: 500 pA, 30 s. Right, quantitation of the currents, plotted as the percentage of the total time the cells exhibited inward current ≥200 pA (mean ± S.E.M., n = 5 cells). *p<0.05; **p<0.01.
-
Figure 2—source data 1
Quantification of N1-GFP-GPI-induced currents N2a cells.
- https://doi.org/10.7554/eLife.23473.008
Figure 2—figure supplement 1
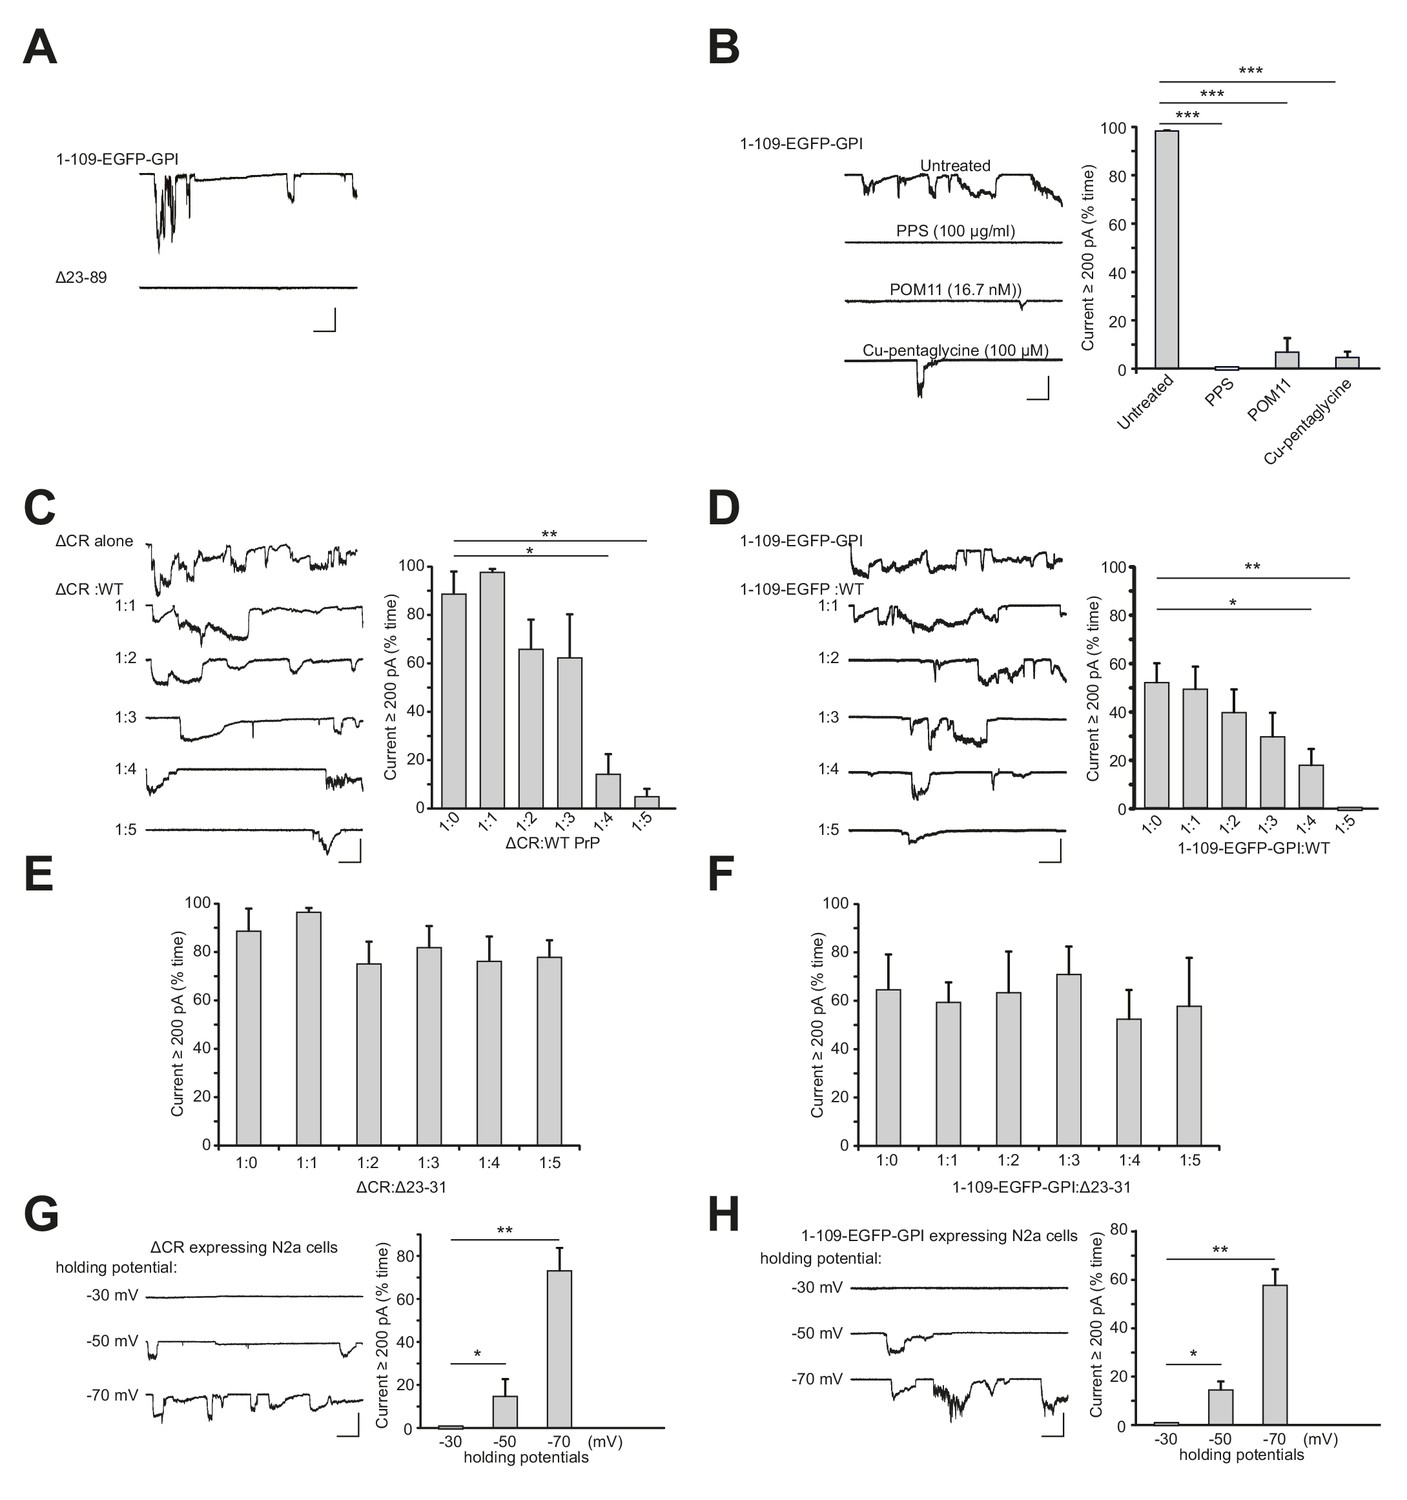
Currents induced by PrP(1-109)-EGFP-GPI have the same features as currents induced by ΔCR PrP.
(A) Representative traces of currents recorded from N2a cells expressing PrP(1-109)-EGFP-GPI or Δ23–89 PrP. (B) Left, representative traces of currents recorded from N2a cells expressing PrP(1-109)-EGFP-GPI in the absence of treatment, or in the presence of PPS (100 μg/ml), POM11 (16.7 nM) or Cu-pentaglycine (100 μM). Right, quantitation of the currents, plotted as the percentage of the total time the cells exhibited inward current ≥200 pA. (mean ± S.E.M., n = 10). (C) Left, representative traces of currents recorded from N2a cells transfected with a plasmid encoding ΔCR PrP, or co-transfected with plasmids encoding ΔCR PrP and WT PrP at the indicated ratios. Right, quantitation of the currents (mean ± S.E.M., n = 10). (D) Left, representative traces of currents recorded from N2a cells transfected with a plasmid encoding PrP(1-109)-EGFP-GPI, or co-transfected with plasmids encoding PrP(1-109)-EGFP-GPI and WT PrP at the indicated ratios. Right, quantitation of the currents (mean ± S.E.M., n = 10). (E) Quantitation of the currents recorded from N2a cells transfected with a plasmid encoding ΔCR PrP, or co-transfected with plasmids encoding ΔCR PrP and Δ23–31 PrP at the indicated ratios. (mean ± S.E.M., n = 10). (F) Quantitation of the currents recorded from N2a cells transfected with a plasmid encoding PrP(1-109)-EGFP-GPI, or co-transfected with plasmids encoding PrP(1-109)-EGFP-GPI and Δ23–31 PrP at the indicated ratios. (mean ± S.E.M., n = 10). (G) Left, representative traces of currents recorded from N2a cells expressing ΔCR PrP at holding potentials of −30 mV, −50 mV and −70 mV. Right, quantitation of the current at each holding potential (mean ± S.E.M., n = 10). (H) Left, representative traces of currents recorded from N2a cells expressing PrP(1-109)-EGFP-GPI at holding potentials of −30 mV, −50 mV and −70 mV. Right, quantitation of the current at each holding potential (mean ± S.E.M., n = 10). Except for panels G and H, the holding potential for all experiments was −70 mV. Scale bar in all panels: 1 nA, 30 s. *p<0.05, **p<0.01, ***p<0.005.
Figure 3 with 1 supplement

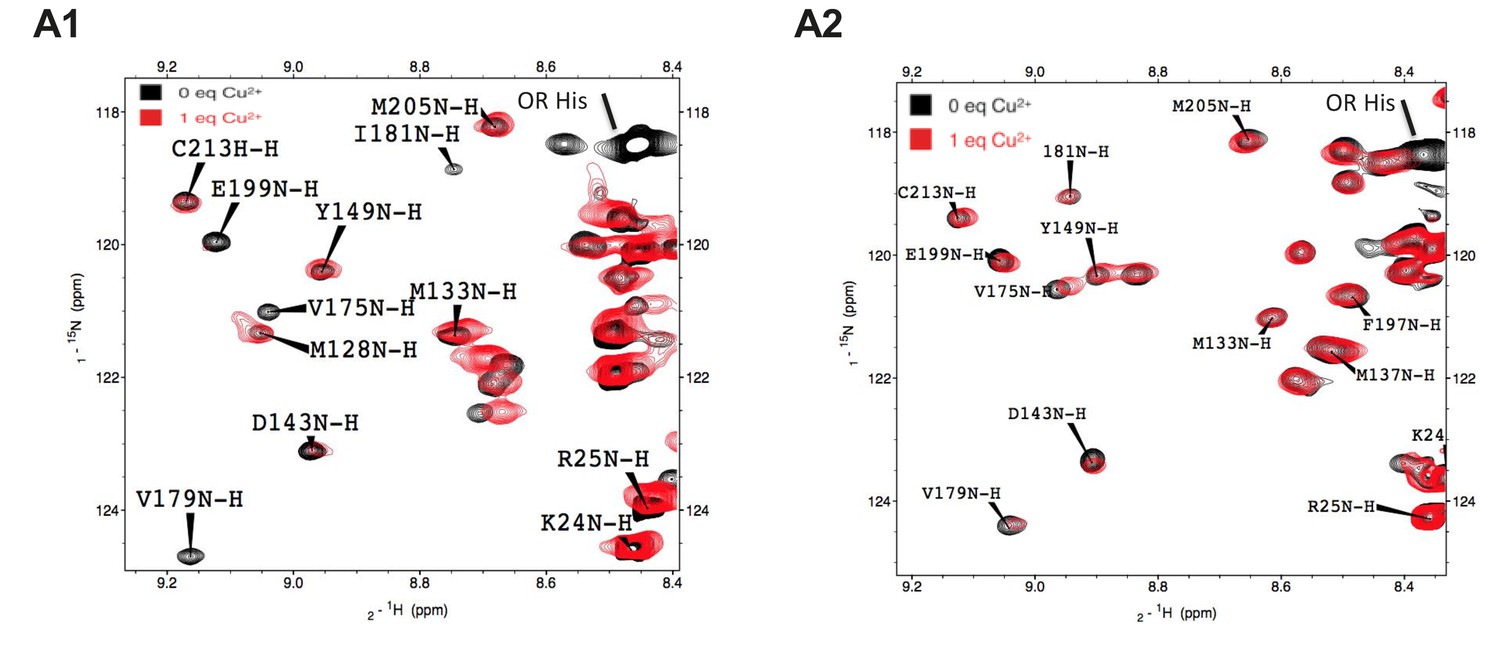
ΔCR PrP shows diminished interaction between N- and C-terminal domains based on NMR analysis.
(A) Reduction in peak intensities of 1H-15N HSQC spectra of WT PrP (A1) and ΔCR PrP (A2) in the presence of Cu2+. Data are shown only for the structured domain (residues 90–230). I/I0 values represent the ratios of peak heights in the presence and absence of 1 equivalent of Cu 2+. Residues with I/I0 values less than 1.0 SD below the mean (dotted line) are shown in red, with unassigned residues omitted. (B) Residues (labeled and colored magenta) of WT PrP (B1) and ΔCR PrP (B2) with I/I0values < 1.0 SD below the mean, mapped onto a ribbon representation of the NMR structure of mouse PrP(120-230) (PDB:1XYX). (C) Affected residues (magenta) of WT PrP (C1) and ΔCR PrP (C2) are mapped onto surface plots of mouse PrP(120-230) (PDB:1XYX).
Figure 3—figure supplement 1
NMR signals for C-terminal residues broaden in the presence of Cu2+ bound to the N-terminal octarepeats.
Selected regions of the 1H-15N HSQC paramagnetic relaxation enhancement NMR spectra of WT PrP (A1) and ΔCR PrP (A2) in the absence of metal (black) and in the presence of 1 equivalent of Cu2+ (red). Spectra were acquired on a Varian INOVA 600-MHz spectrometer at pH 5.5, 300 μM protein, and 37°C.
Figure 4 with 5 supplements
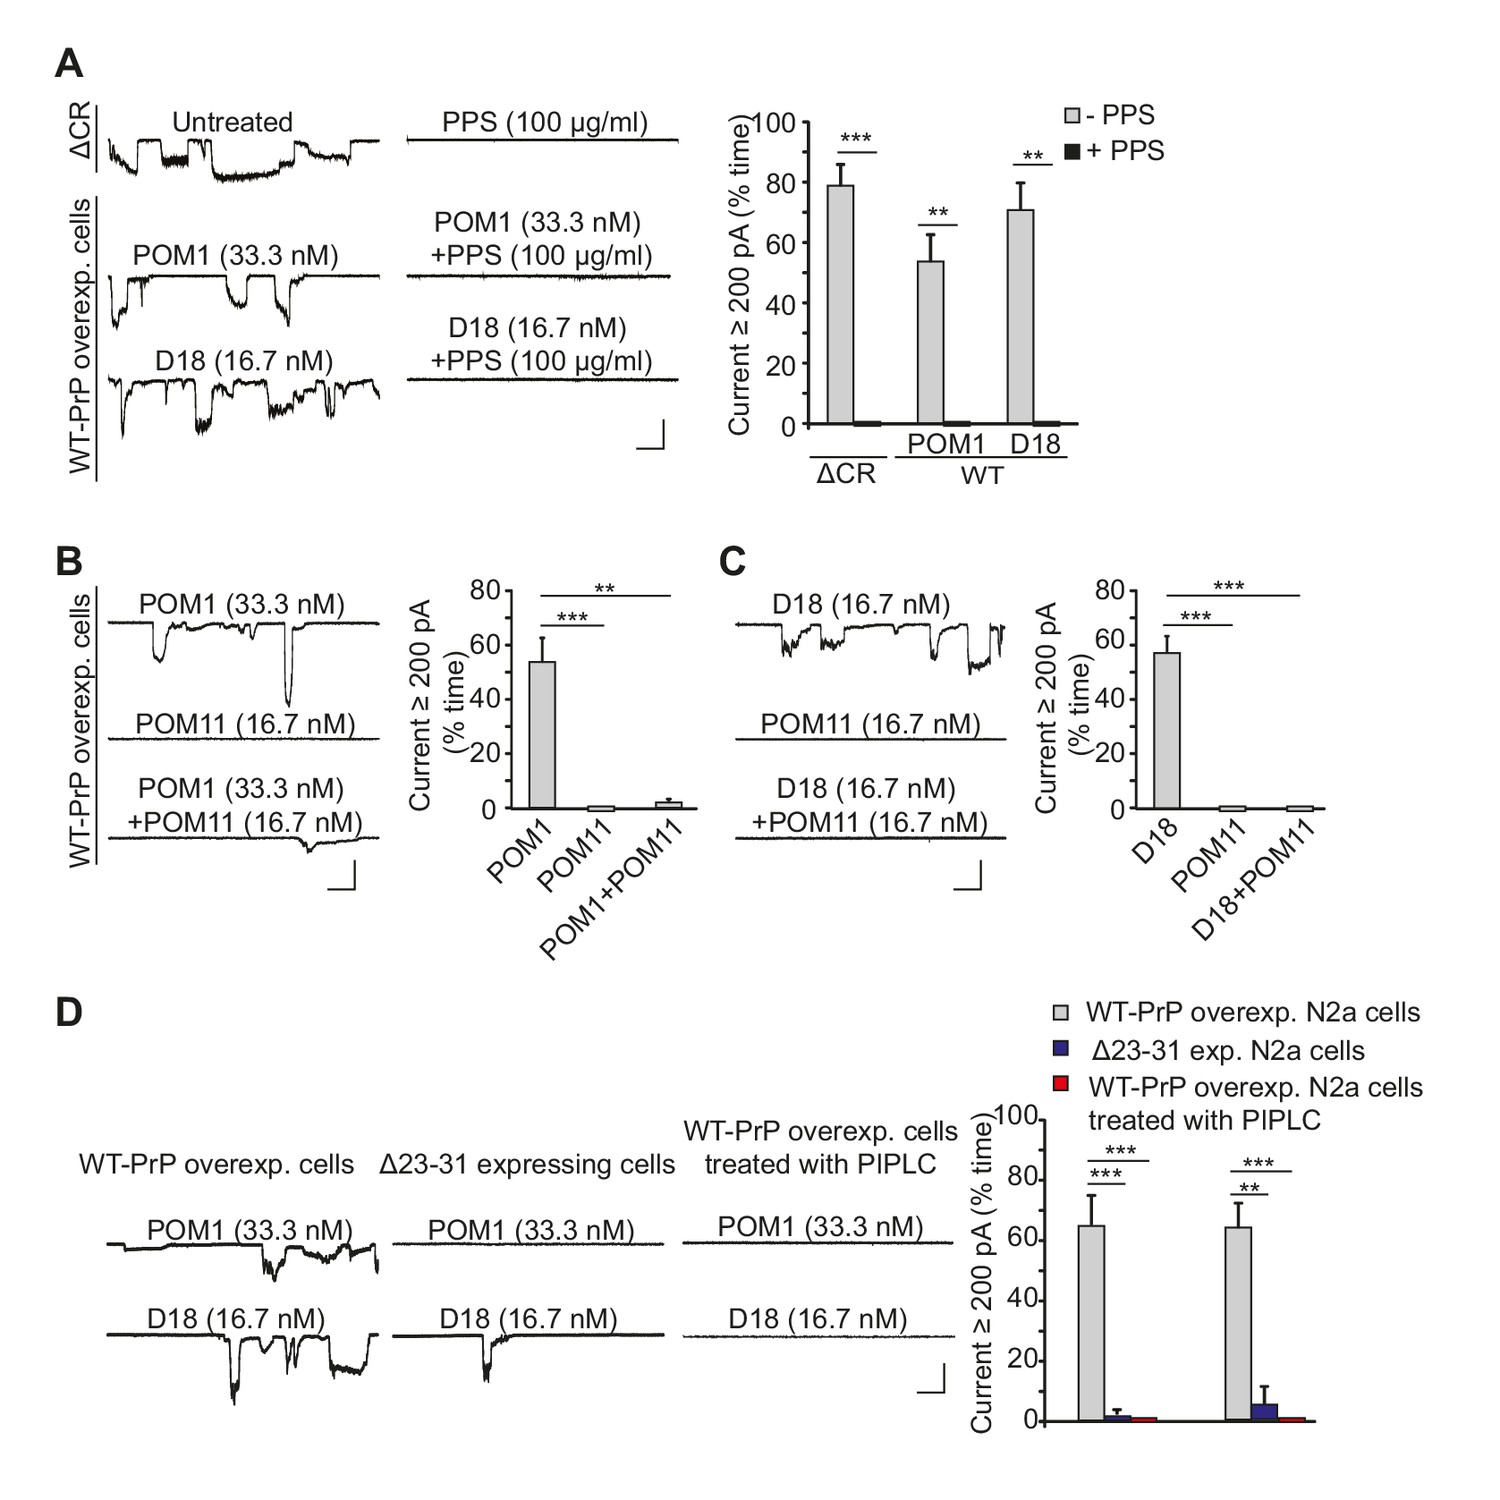
Antibodies against the C-terminal domain induce ionic currents in N2a cells expressing wild-type PrPC.
(A) Left, representative traces of spontaneous currents recorded from cells expressing ΔCR PrP (top traces), and currents induced by anti-prion antibodies (POM1 and D18) in cells expressing WT PrP (lower traces) in the absence (left-hand traces) or presence (right-hand traces) of PPS (100 ug/ml). Right, quantitative analysis of the currents, plotted as the percentage of the recording time the cells exhibited inward currents ≥200 pA. (mean ± S.E.M., n = 10). (B) Left, representative traces of currents recorded from cells expressing WT PrP in the presence of POM1, POM11, or POM1+POM11. Right, quantitative analysis of the currents (mean ± S.E.M., n = 10). (C) Left, representative traces of currents recorded from cells expressing WT PrP in the presence of D18, POM11, or D18+POM11. Right, quantitative analysis of the currents (mean ± S.E.M., n = 10). (D) Left, representative traces of currents induced by POM1 (upper traces) or D18 (lower traces) in cells expressing WT PrP (left-hand traces) or Δ23–31 PrP (center traces), or in cells expressing WT PrP after pretreatment with PIPLC (1.0 units/ml for 4 hr at 37°C) (right-hand traces). Right, quantitative analysis of the currents (mean ± S.E.M., n = 10). Scale bars in all panels: 1 nA, 30 s. **p<0.01; ***p<0.005.
-
Figure 4—source data 1
Quantification of anti-prion antibody-induced currents on N2a cells.
- https://doi.org/10.7554/eLife.23473.013
Figure 4—figure supplement 1
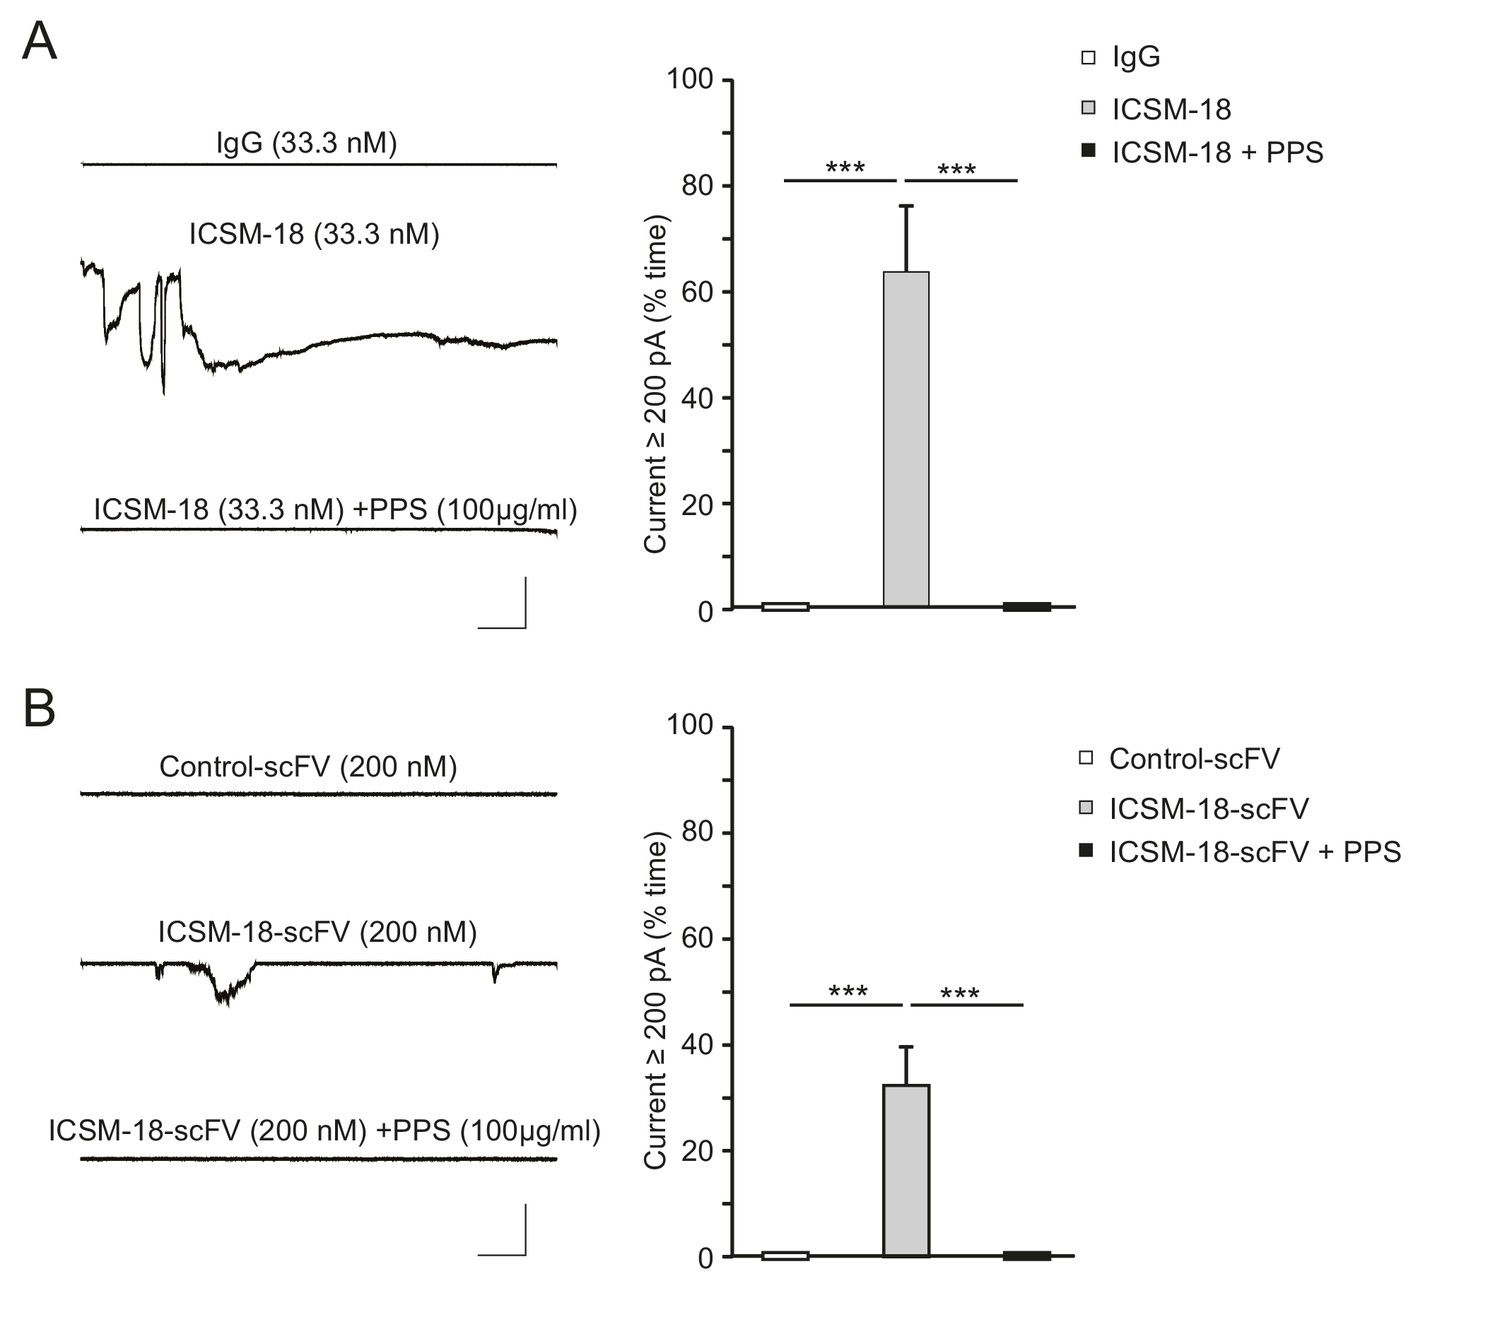
ICSM-18 induces currents in N2a cells.
(A) Left, representative traces of currents induced in N2a cells over-expressing WT PrP by non-specific IgG (33.3 nM) (upper trace), ICSM-18 (33.3 nM) (middle trace) or ICSM-18 (33.3 nM) in the presence of PPS (100 μg/ml) (lower trace). Right, quantitative analysis of the currents, plotted as the percentage of the recording time the cells exhibited inward currents ≥200 pA. (mean ± S.E.M., n = 5). **p<0.01. (B) Left, representative traces of currents induced in N2a cells over-expressing WT PrP by control scFv antibody (anti-fluorescein, 200 nM) (upper trace), ICSM-18 scFv (200 nM) (middle trace), or ICSM-18 scFv (200 nM) in the presence of PPS (100 μg/ml) (lower trace). Right, quantitative analysis of the currents, plotted as the percentage of the recording time the cells exhibited inward currents ≥200 pA. (mean ± S.E.M., n = 20). **p<0.01.
Figure 4—figure supplement 2
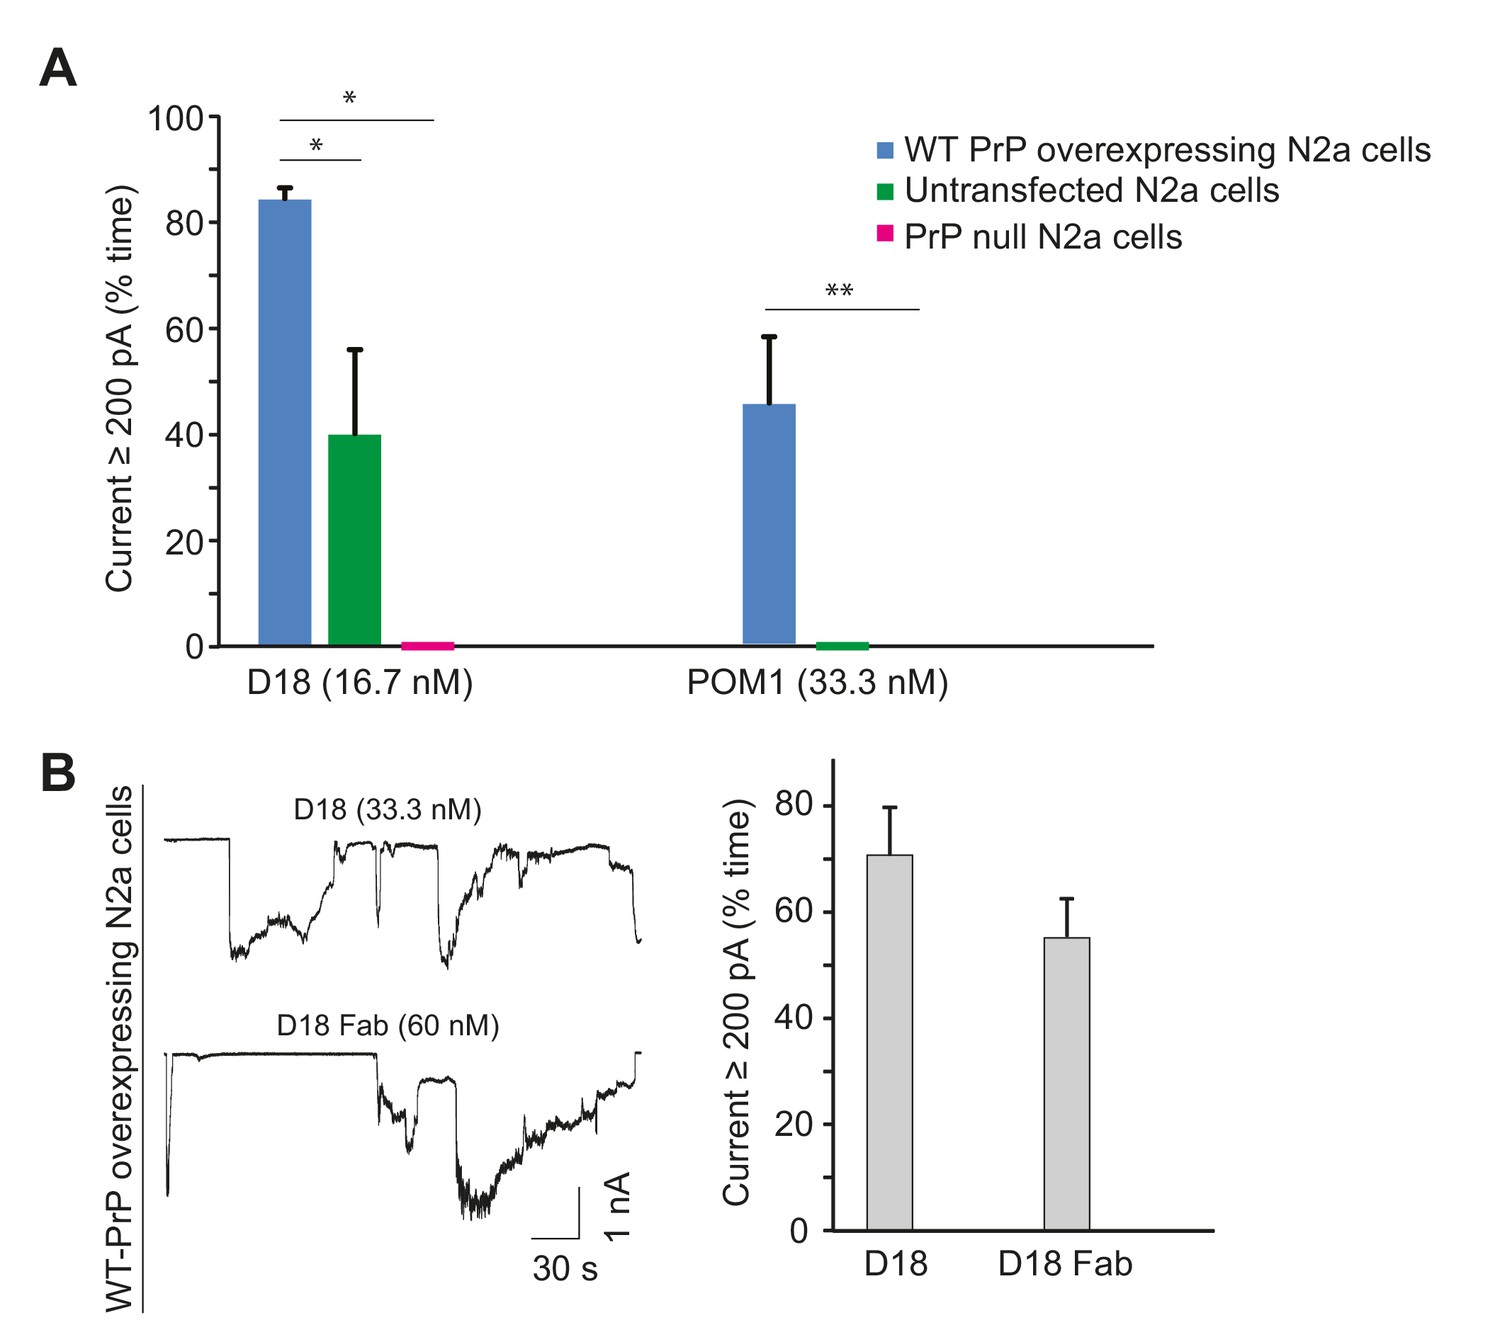
Antibody-induced currents are dependent on PrPC expression level and are produced by Fab fragments.
(A) Quantitation of currents produced by D18 or POM1 treatment of transfected N2a cells over-expressing WT PrP, untransfected N2a cells, or PrP-null N2a cells. Currents are plotted as the percentage of the recording time the cells exhibited inward currents ≥200 pA. (mean ± S.E.M., n = 10). *p<0.05, **p<0.01. (B) Left, representative traces of currents recorded from PrP-over-expressing N2a cells in the presence of D18 or an Fab fragment of D18. Right, quantitative analysis of the currents (mean ± S.E.M., n = 10).
Figure 4—figure supplement 3
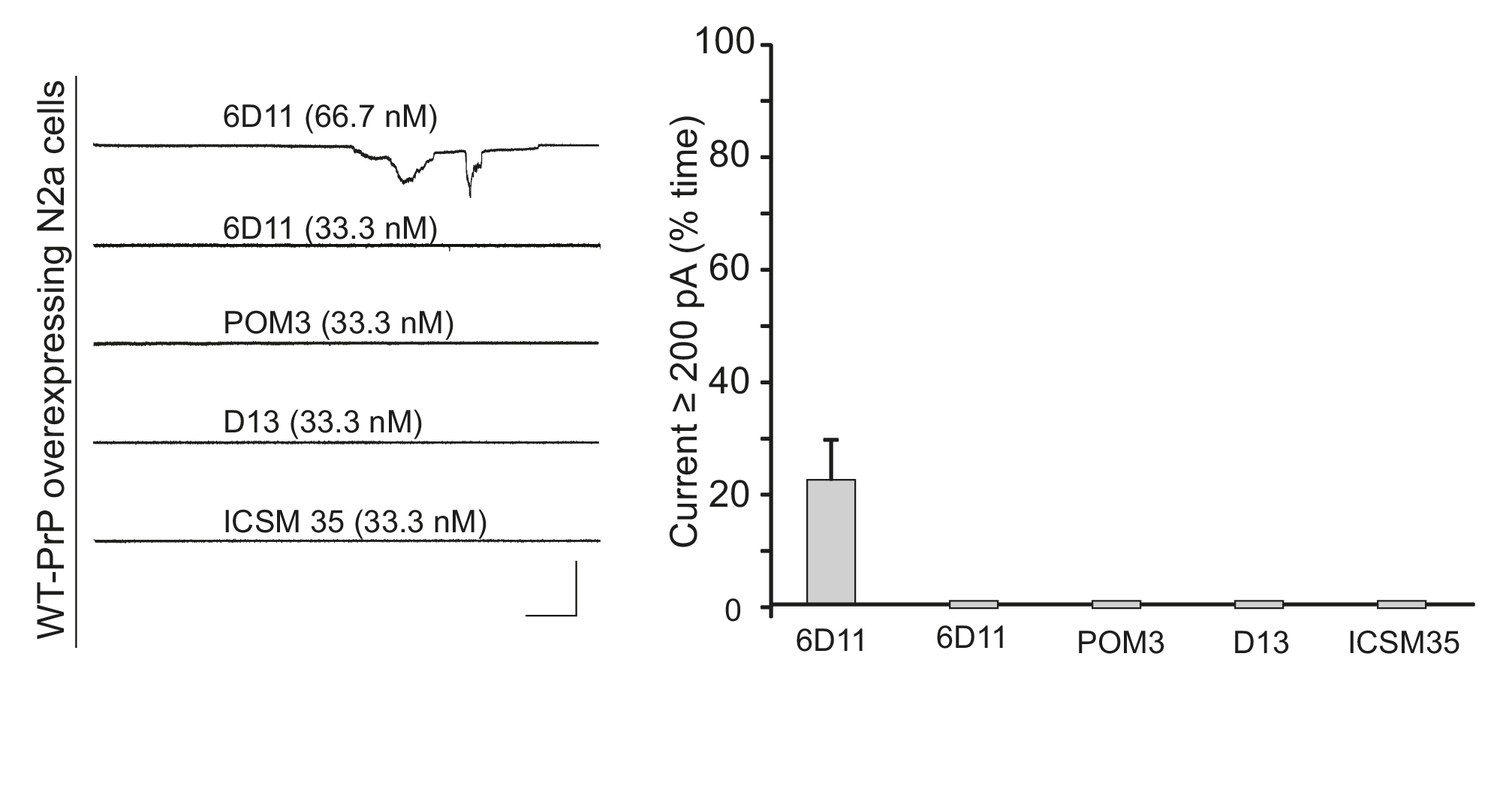
6D11, but not other central region antibodies, weakly induces currents in N2a cells.
Left, representative traces of currents induced by antibodies 6D11, POM3, D13, and ICSM-35 at the indicated concentrations in N2a cells over-expressing WT PrP. Scale bar: 1 nA, 30 s. Right, quantitation of the currents, plotted as the percentage of the recording time the cells exhibited inward currents ≥200 pA. (mean ± S.E.M., n = 10).
Figure 4—figure supplement 4
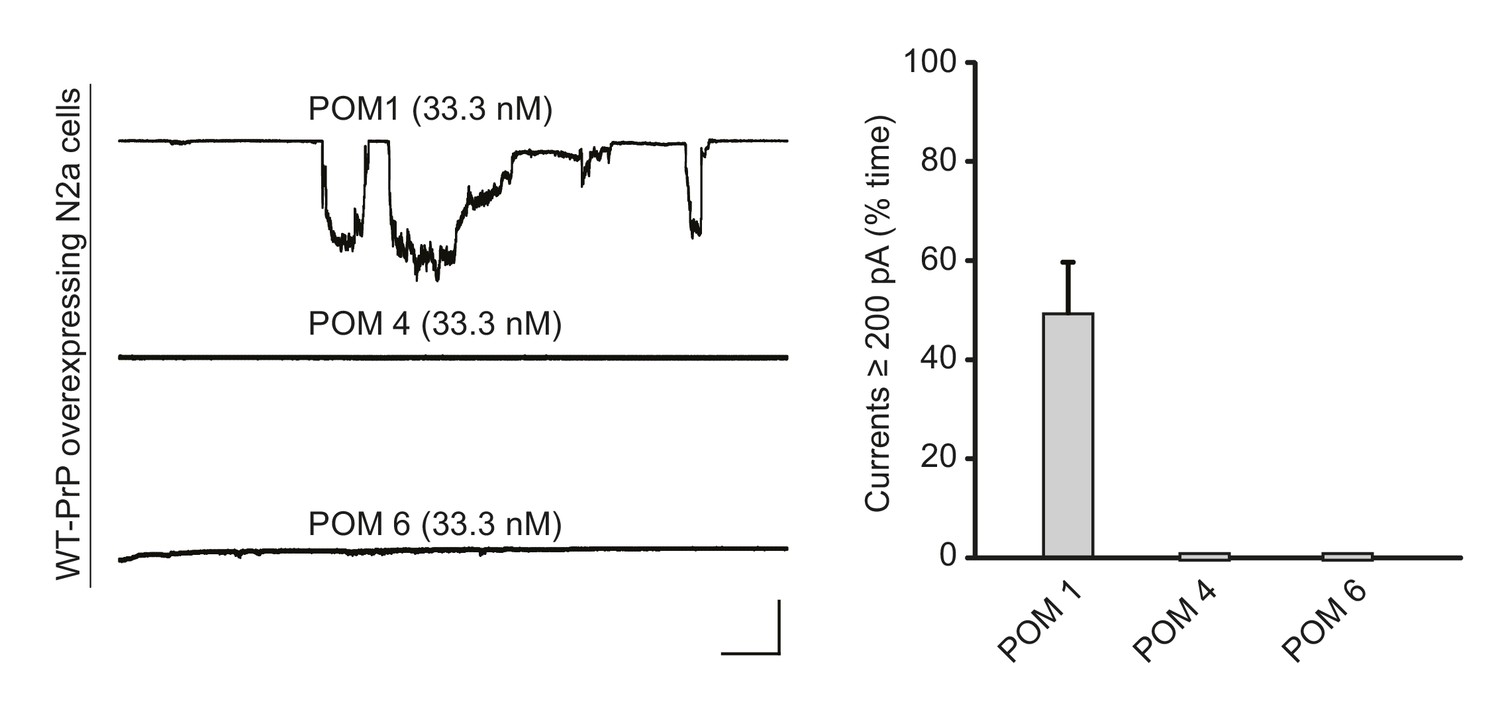
POM1, but not antibodies recognizing other regions of the C-terminal domain, induces currents.
Left, representative traces of currents induced by antibodies POM1, POM4 and POM6 at the indicated concentrations in N2a cells over-expressing WT PrP. Scale bar: 1 nA, 30 s. Right, quantitation of the currents, plotted as the percentage of the recording time the cells exhibited inward currents ≥200 pA (mean ± S.E.M., n = 10).
Figure 4—figure supplement 5
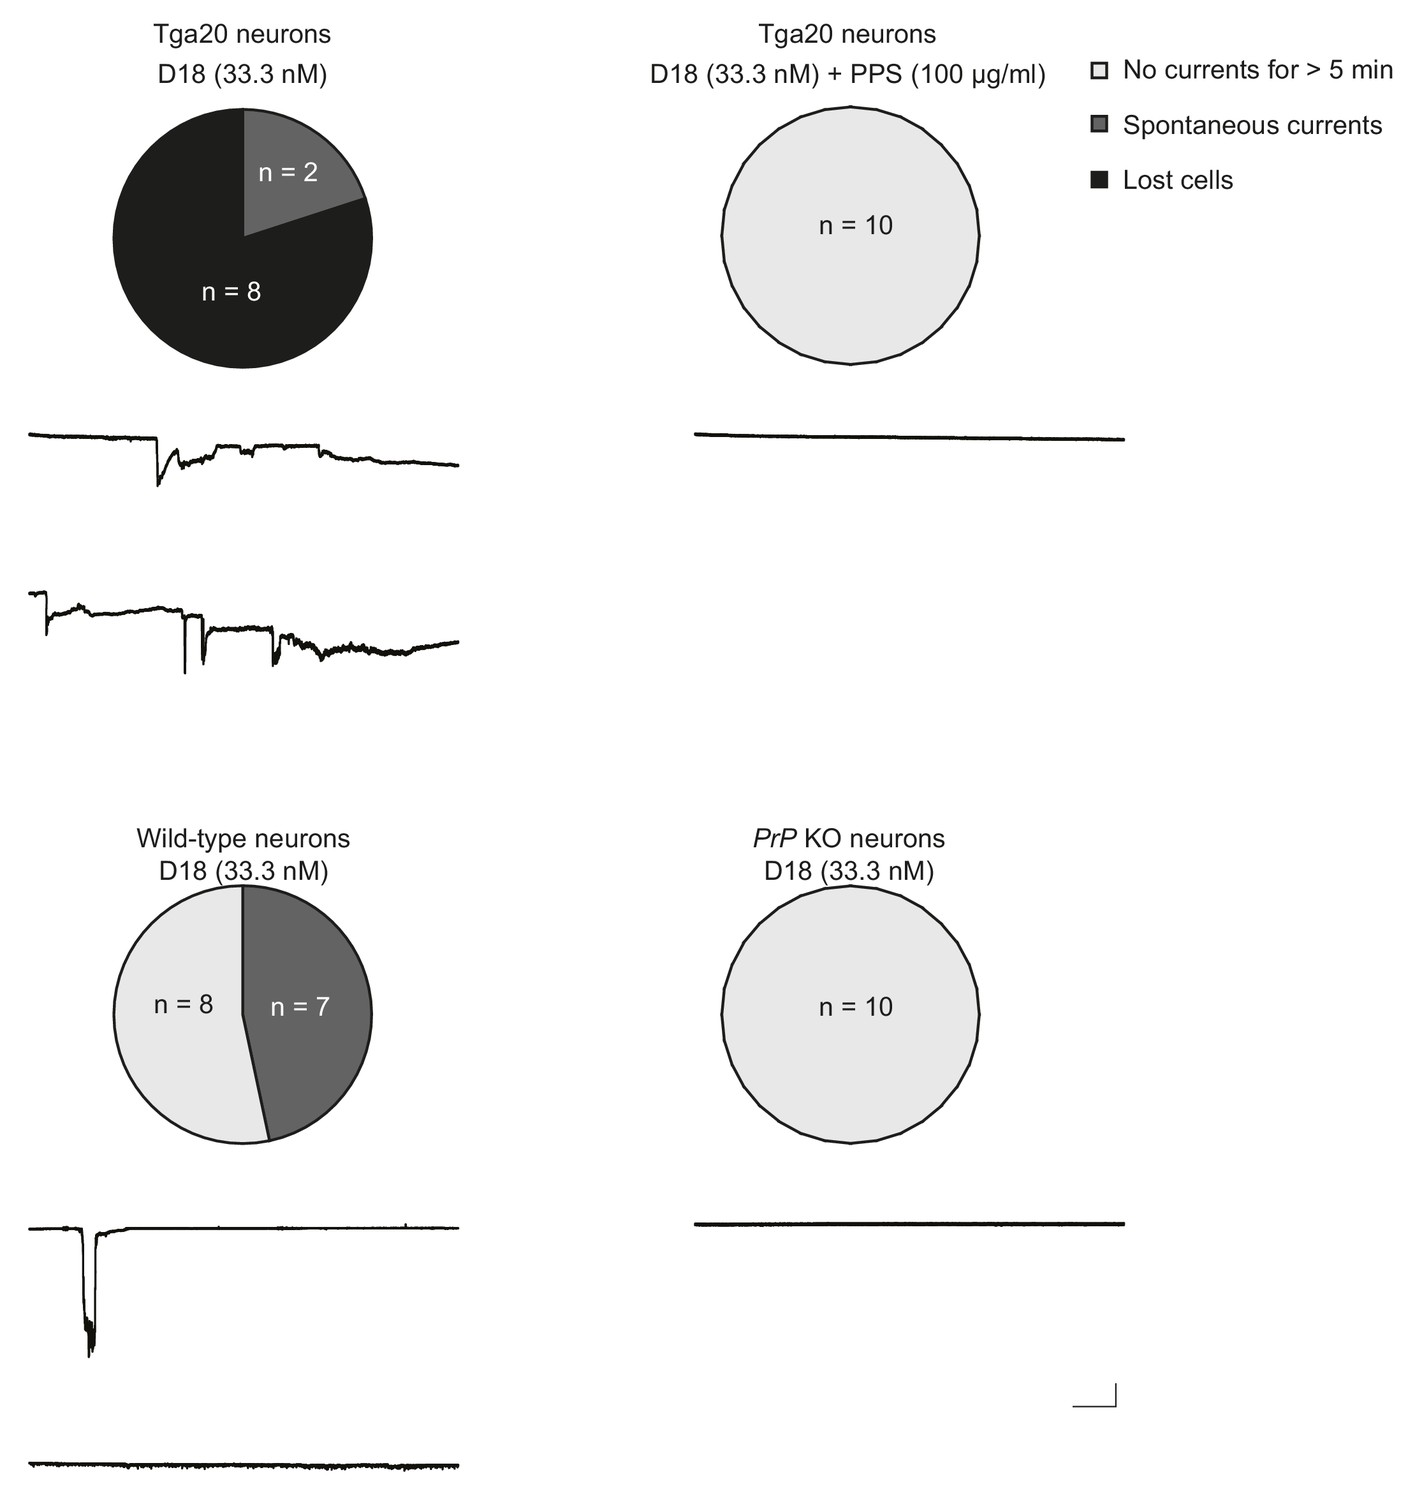
D18 induces currents in Tga20 hippocampal neurons over-expressing WT PrP and in wild-type neurons, but not in PrP knock-out (KO) neurons.
Top, D18 induces currents in Tga20 hippocampal neurons in the absence (left) but not the presence (right) of PPS (100 μg/ml). Scale bar: 1 nA, 30 s. Bottom, D18 induces weak currents in wild-type hippocampal neurons (left), but not in PrP KO neurons (right). Scale bar: 1 nA, 30 s. Pie charts show the proportions of three categories of neurons: Light grey represents neurons from which recordings were made for >5 min without any currents; dark grey represents neurons that exhibited spontaneous currents, and in which voltage-clamped could be maintained throughout the 5 min recording period; black represents neurons in which voltage-clamp was lost during the 5-min recording period.
Figure 5 with 2 supplements
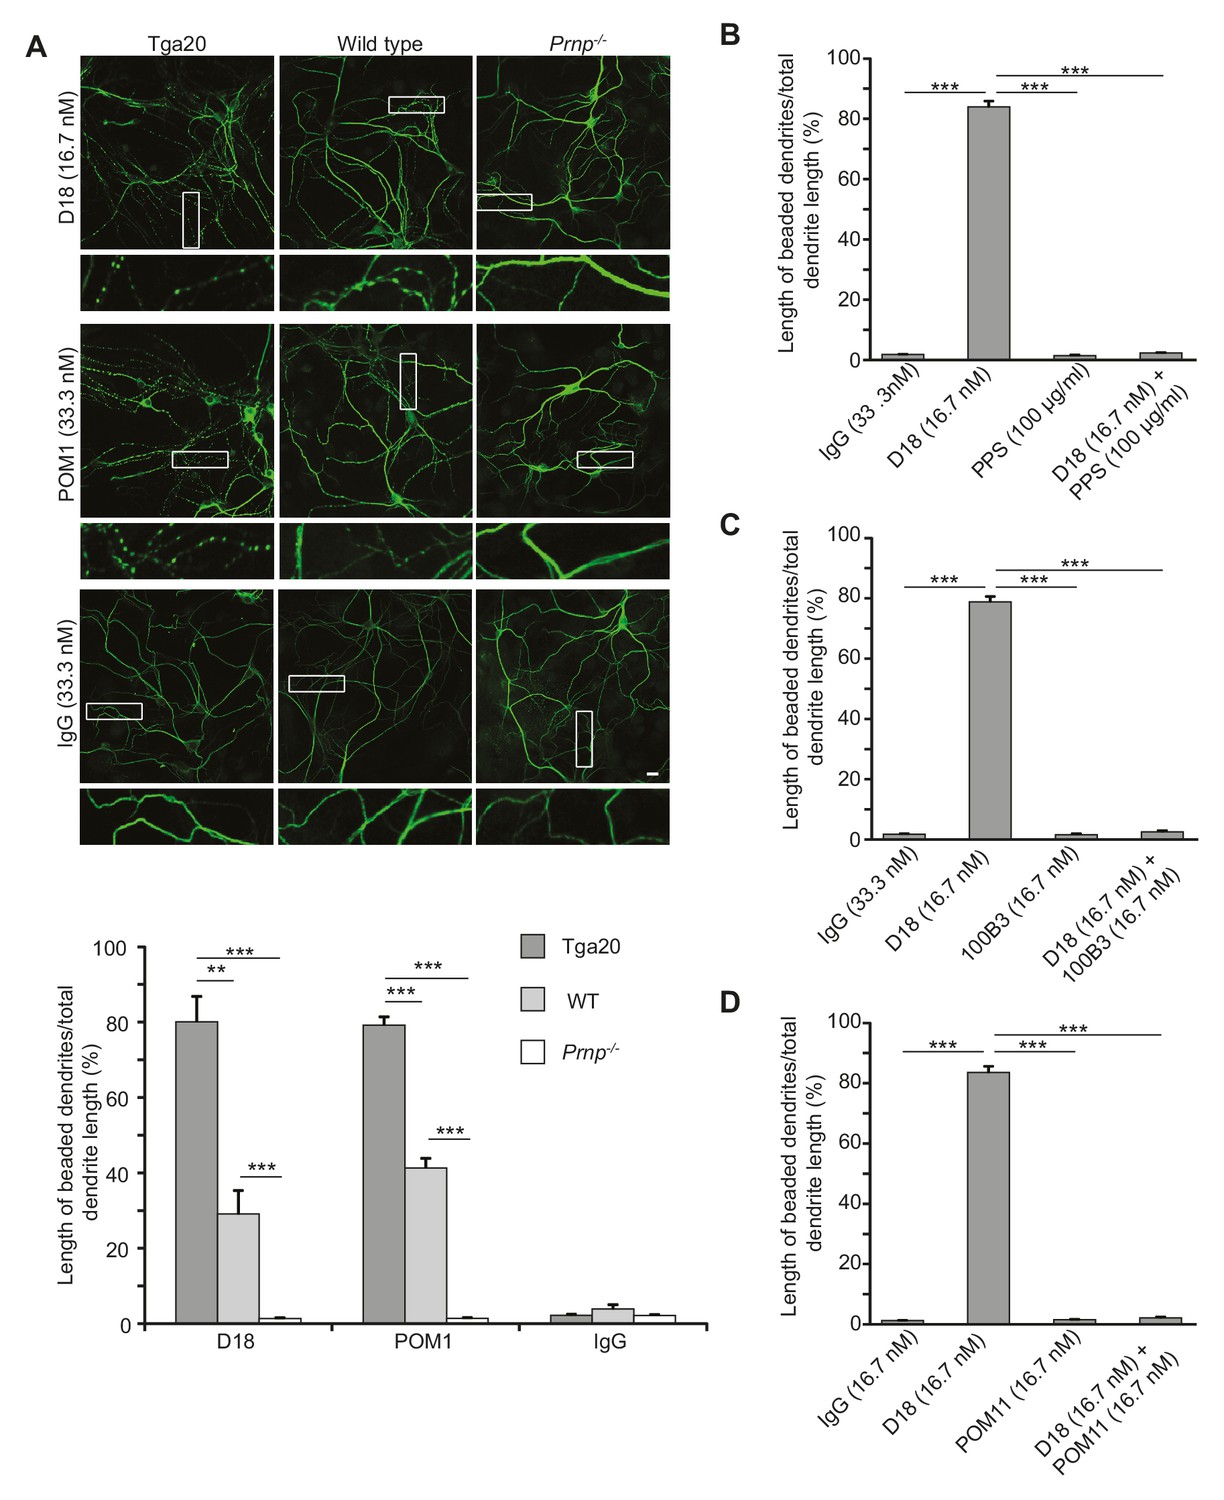
Antibodies recognizing the C-terminal domain of PrPC induce dendritic degeneration in hippocampal neurons.
(A) Top, representative images showing dendrite morphology of cultured hippocampal neurons from Tga20 mice (which over-express WT PrPC), WT mice, or Prnp−/− mice after treatment for 48 hr with D18 (16.7 nM), POM1 (33.3 nM) or non-specific IgG (33.3 nM). The cells were stained with an antibody to MAP2 to visualize dendrites. Boxed areas are enlarged below each image. Scale bar = 10 µm. Bottom, quantitation of dendritic degeneration, expressed as the length of beaded dendrite segments as a percentage of total dendrite length, from 10 images in three independent cultures for each experimental condition. Data represent mean ± S.E.M. **p<0.01; ***p<0.005. (B–D) Quantitation of dendritic beading following treatment with IgG, D18 alone, N-terminal ligand (PPS, 100B3, or POM11) alone, or D18 together with the N-terminal ligand. Data represent mean ± S.E.M. ***p<0.005.
-
Figure 5—source data 1
Quantification of dendritic degeneration, expressed as the length of beaded dendrite segments as a percentage of total dendrite length.
- https://doi.org/10.7554/eLife.23473.020
Figure 5—figure supplement 1
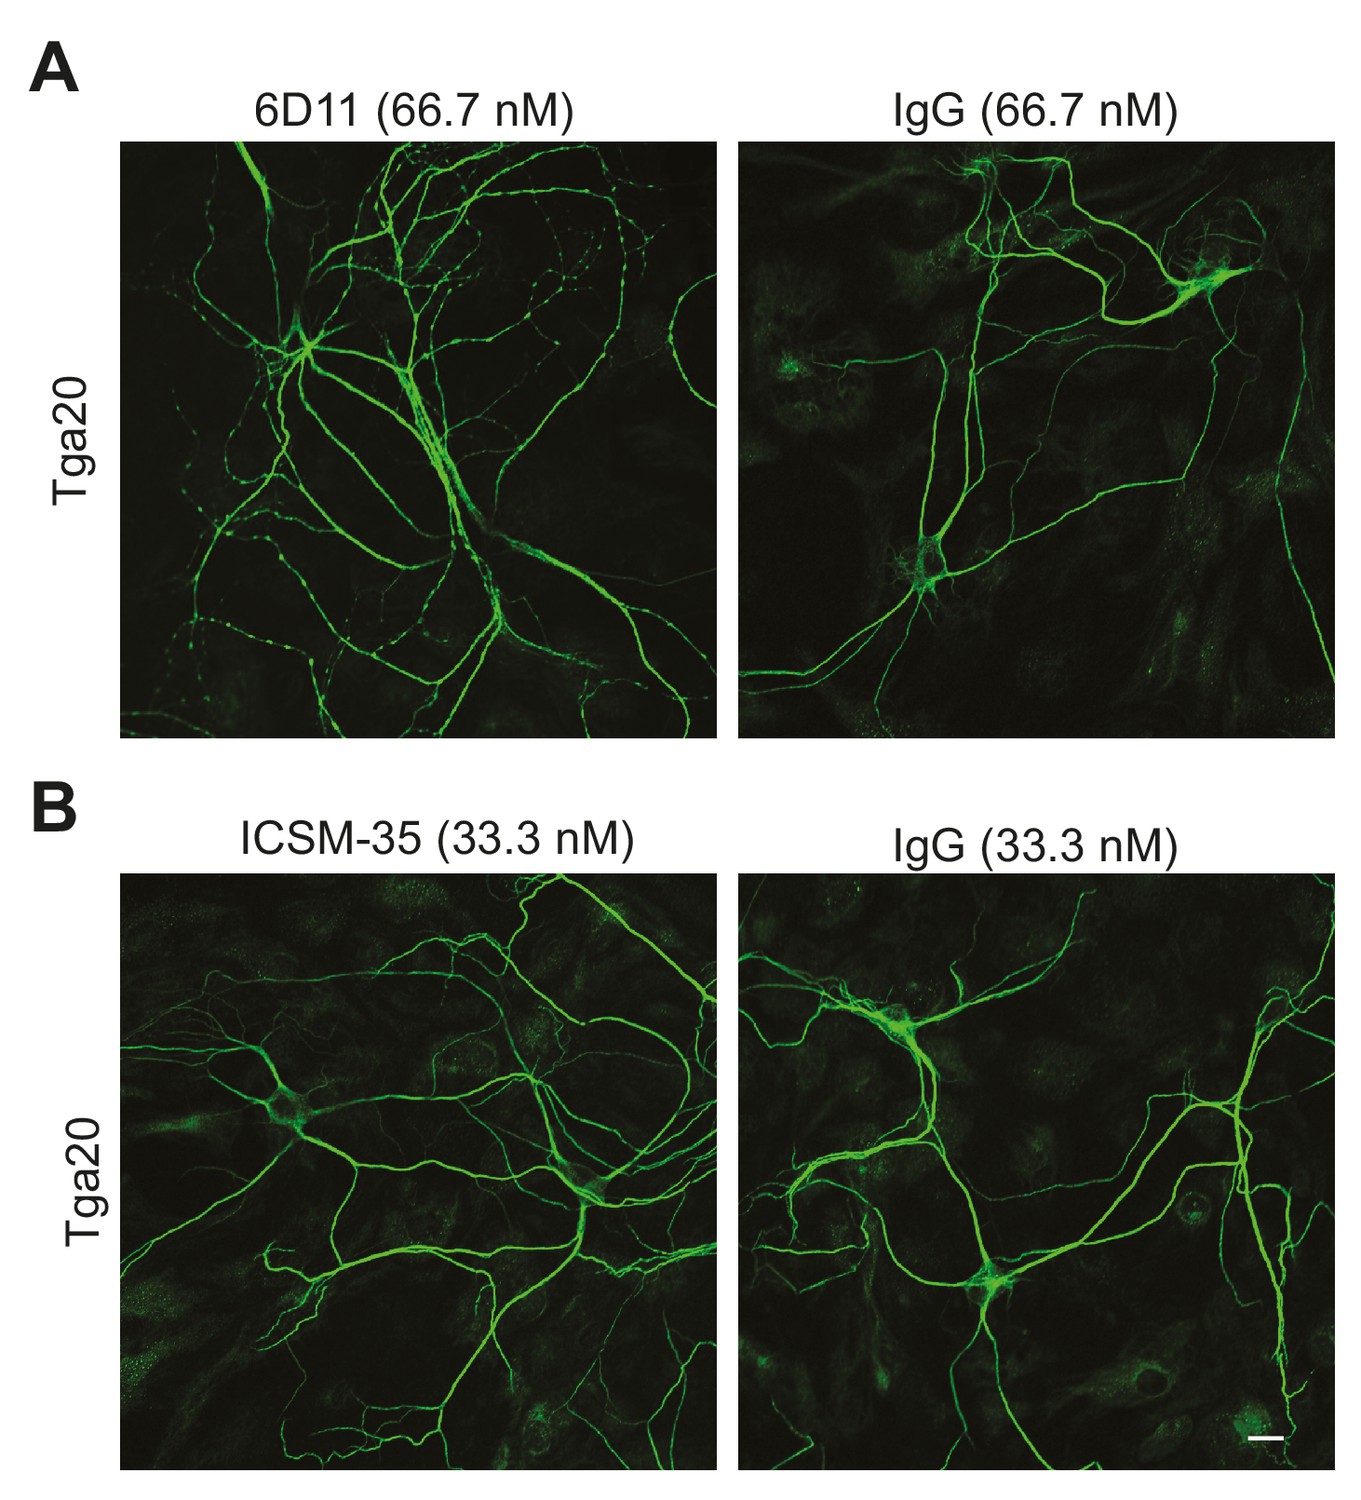
6D11, but not ICSM35, has a weak effect on the dendritic morphology of Tga20 hippocampal neurons.
(A) Representative images showing dendrite morphology after treatment with 6D11 or non-specific IgG (66.7 nM each). (B) Representative images showing dendrite morphology after treatment with ICSM-35 or non-specific IgG (33.3 nM each). Neurons were stained for an antibody to MAP2 to visualize dendrites. Scale bar: 20 μm.
Figure 5—figure supplement 2
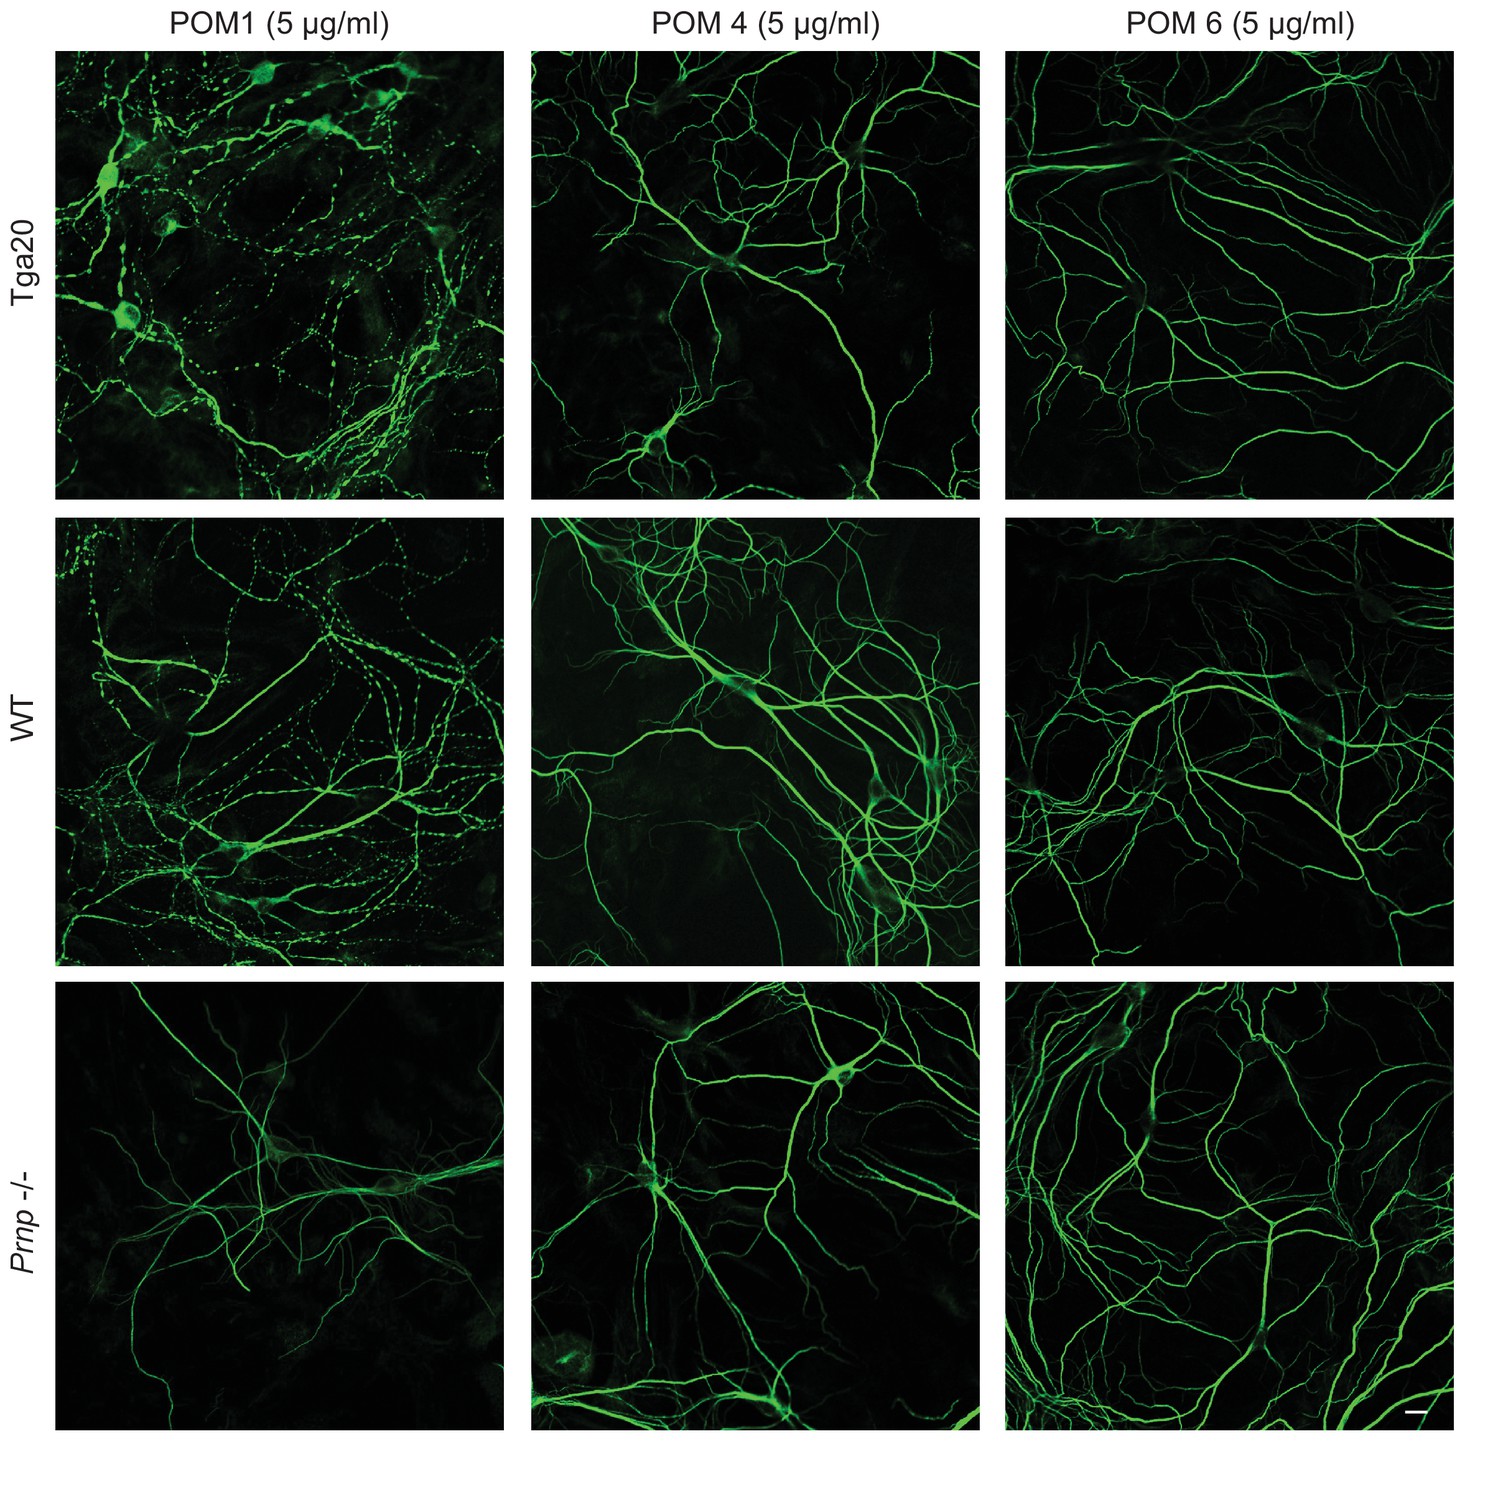
POM4 and POM6 have no effect on the dendritic morphology of Tga20 hippocampal neurons.
Representative images showing dendrite morphology of cultured hippocampal neurons from Tga20 mice (upper panels), WT mice (middle panels), or Prnp−/− mice (lower panels) after treatment for 48 hr with POM1 (33.3 nM) (left-hand panels), POM4 (33.3 nM) (center panels), or POM6 (33.3 nM) (right-hand panels). Scale bar: 10 μM.
Figure 6
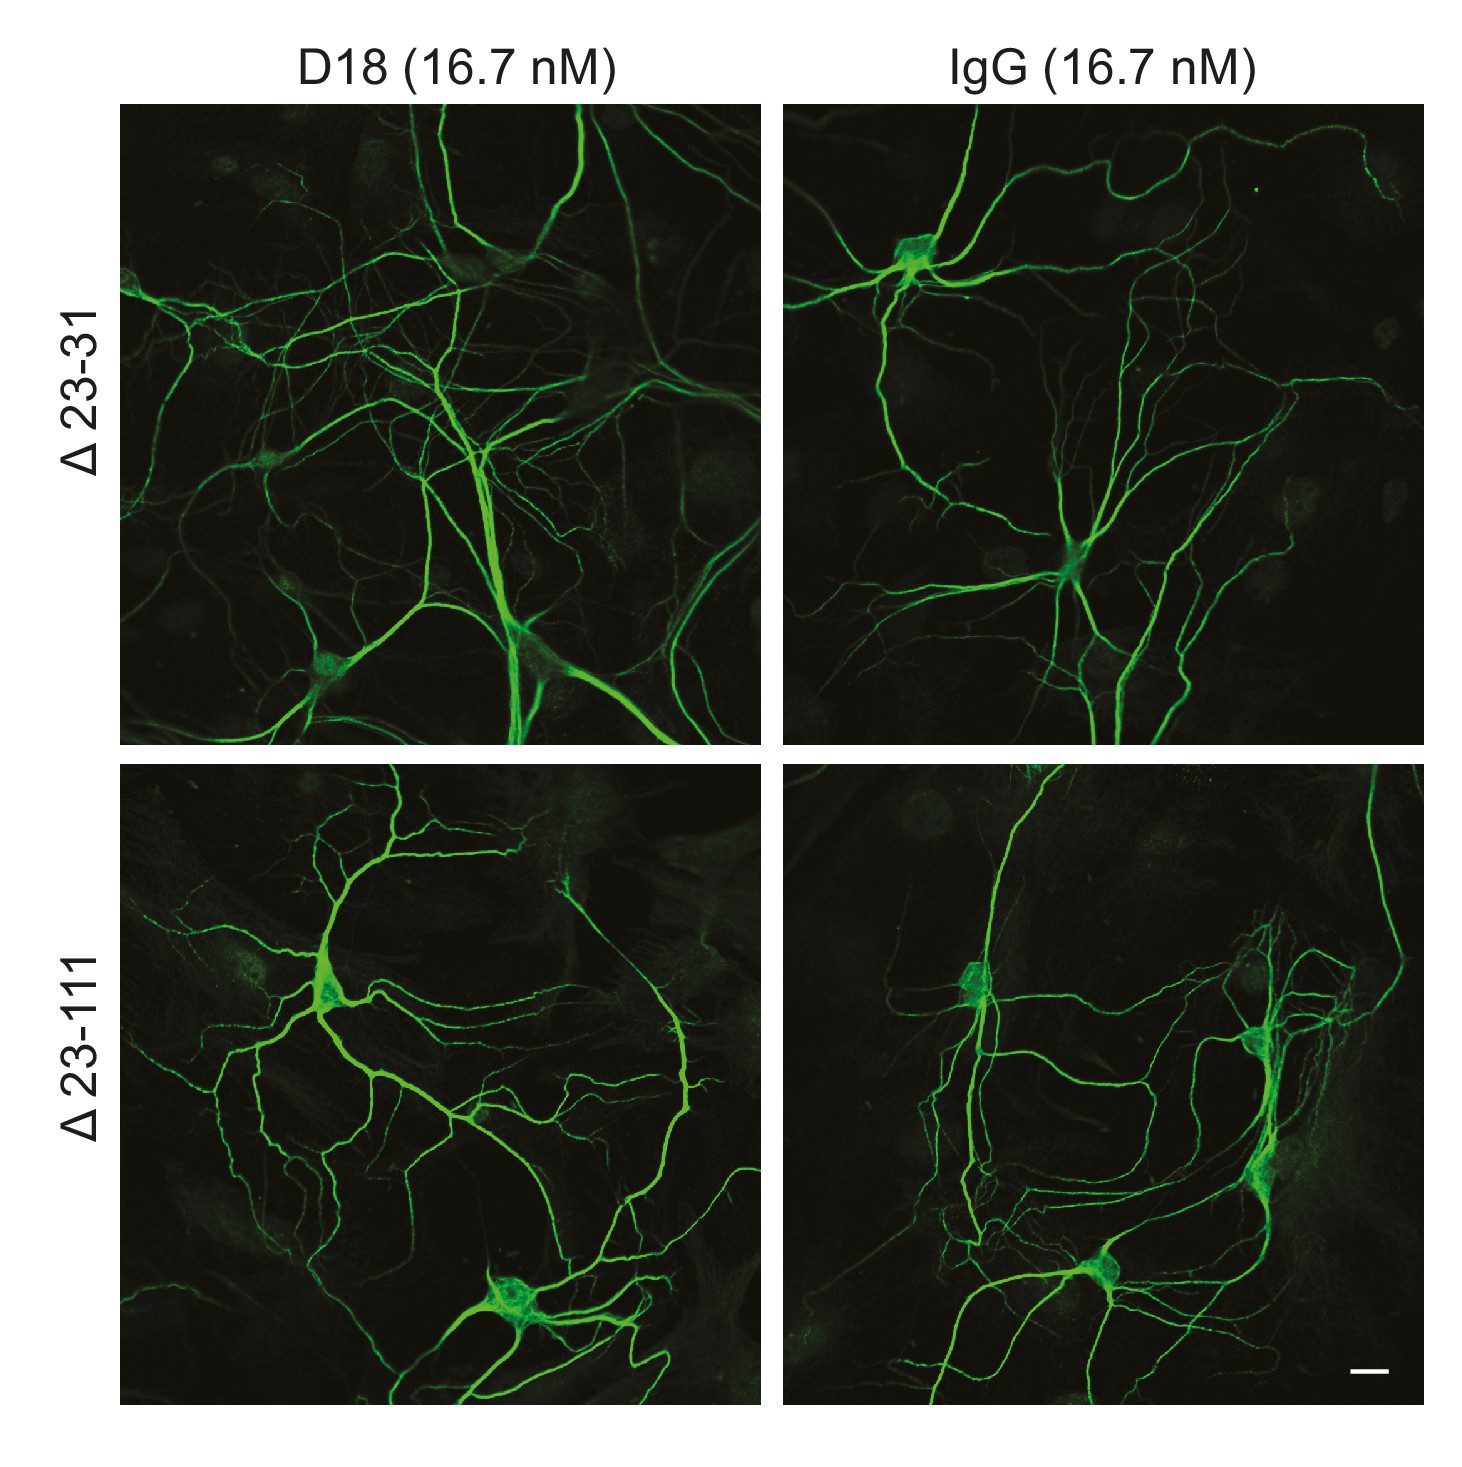
D18 does not induce dendritic degeneration in hippocampal neurons cultured from Δ23–31 or Δ23–111 transgenic mice on the Prnp−/− background.
Representative images showing dendrite morphology of cultured hippocampal neurons from mice expressing Δ23–31 PrP (upper panels) or Δ23–111 PrP (lower panels) after treatment for 48 hr with D18 (16.7 nM) (left-hand panels) or non-specific IgG (16.7 nM) (right-hand panels). Neurons were stained for an antibody to MAP2 to visualize dendrites. Scale bar: 20 μm.
Figure 7
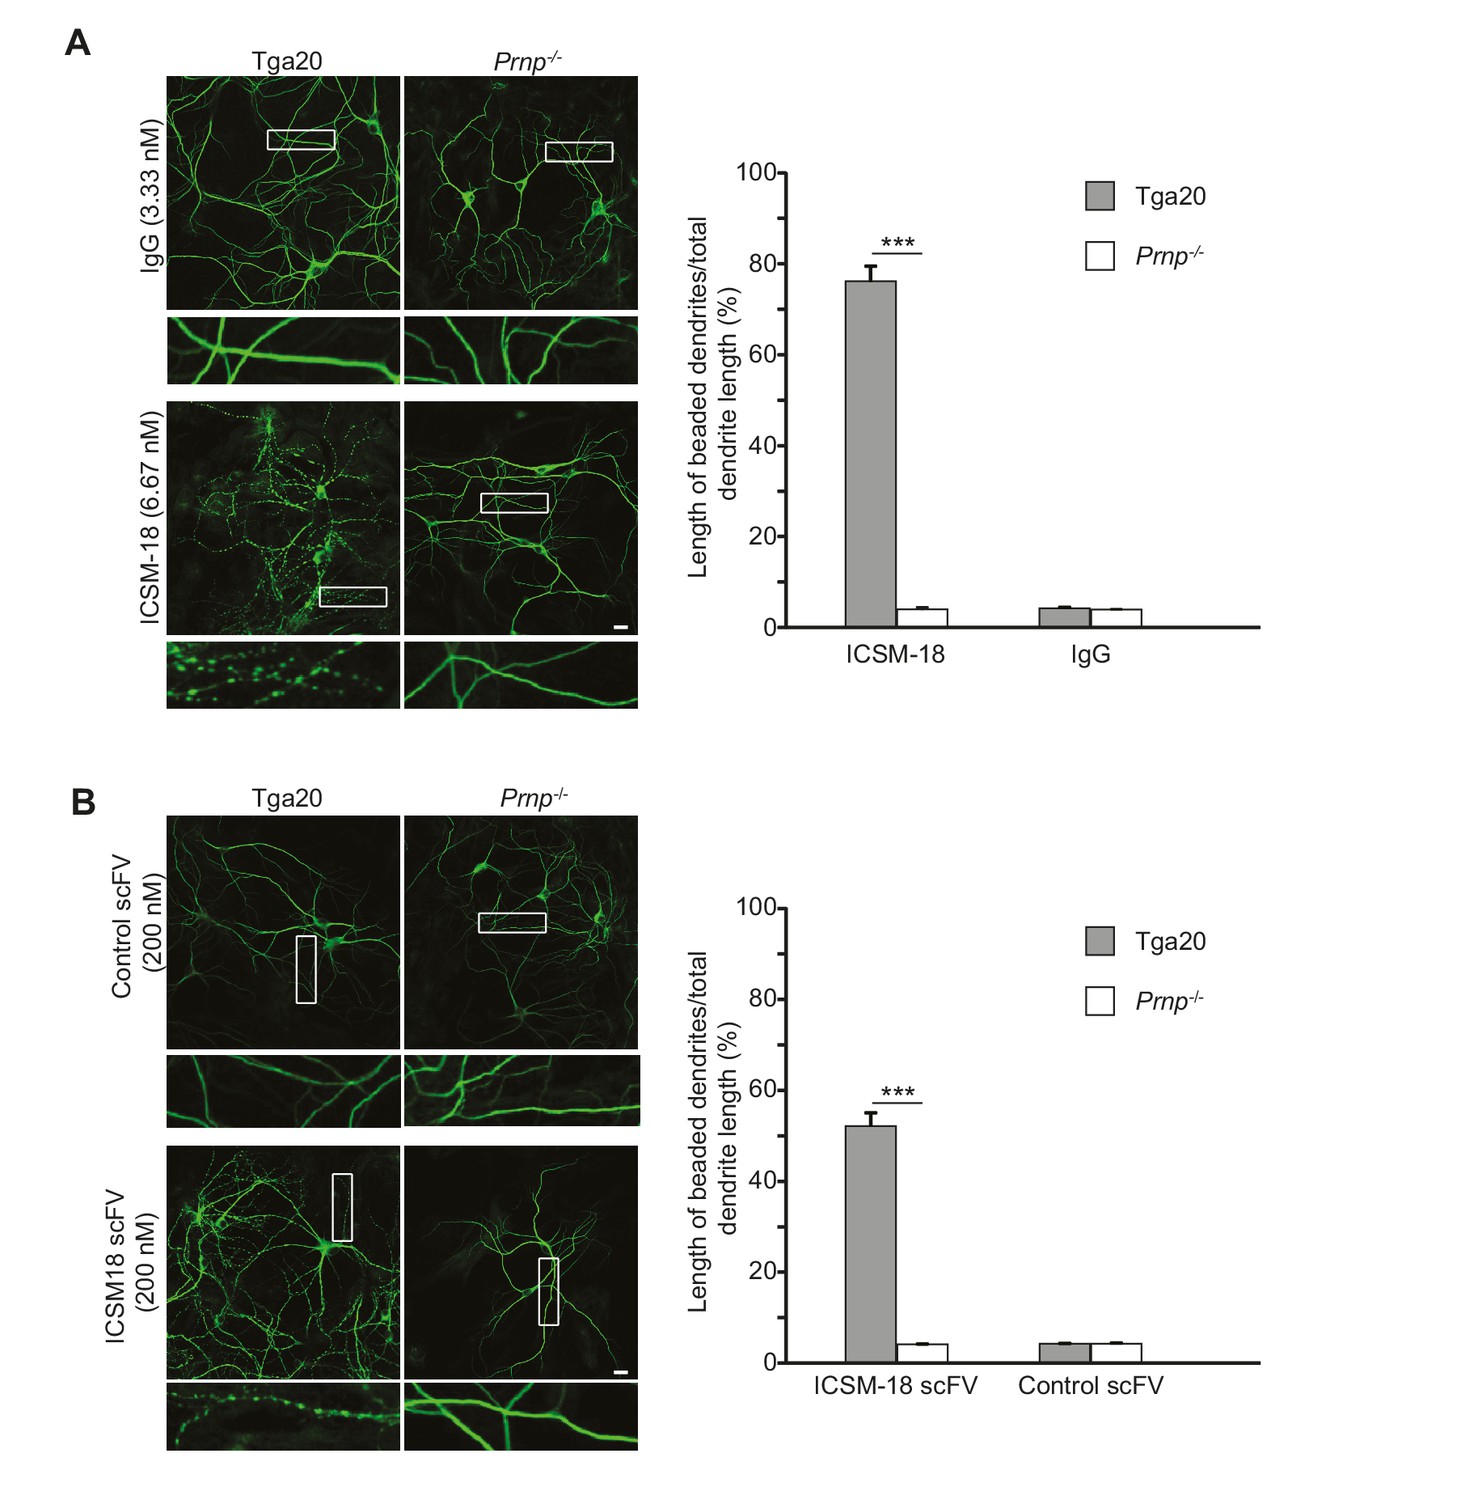
Anti-prion antibody ICSM-18 induces dendritic degeneration in hippocampal neurons.
(A) Left, representative images showing dendrite morphology of cultured hippocampal neurons from Tga20 mice (which over-express WT PrPC) (left-hand panels) or Prnp−/− mice (right-hand panels) after treatment for 48 hr with non-specific IgG (6.67 nM) (upper panels) or ICSM-18 (6.67 nM) (lower panels). The cells were stained with an antibody to MAP2 to visualize dendrites. Boxed areas are enlarged below each image. Scale bar = 10 µm. Right, quantitation of dendritic degeneration, expressed as the length of beaded dendrite segments as a percentage of total dendrite length, from 10 images in three independent cultures for each experimental condition. Data represent mean ± S.E.M. ***p<0.005. (B) Left, representative images showing dendrite morphology of cultured hippocampal neurons from Tga20 mice (left-hand panels) or Prnp−/− mice (right-hand panels) after treatment for 48 hr with control scFv (anti-fluorescein, 200 nM) (upper panels) or ICSM-18 scFv (200 nM) (lower panels). The cells were stained with an antibody to MAP2 to visualize dendrites. Boxed areas are enlarged below each image. Scale bar = 10 µm. Right, quantitation of dendritic degeneration, expressed as the length of beaded dendrite segments as a percentage of total dendrite length, from 10 images in three independent cultures for each experimental condition. Data represent mean ± S.E.M. ***p<0.005.
Figure 8
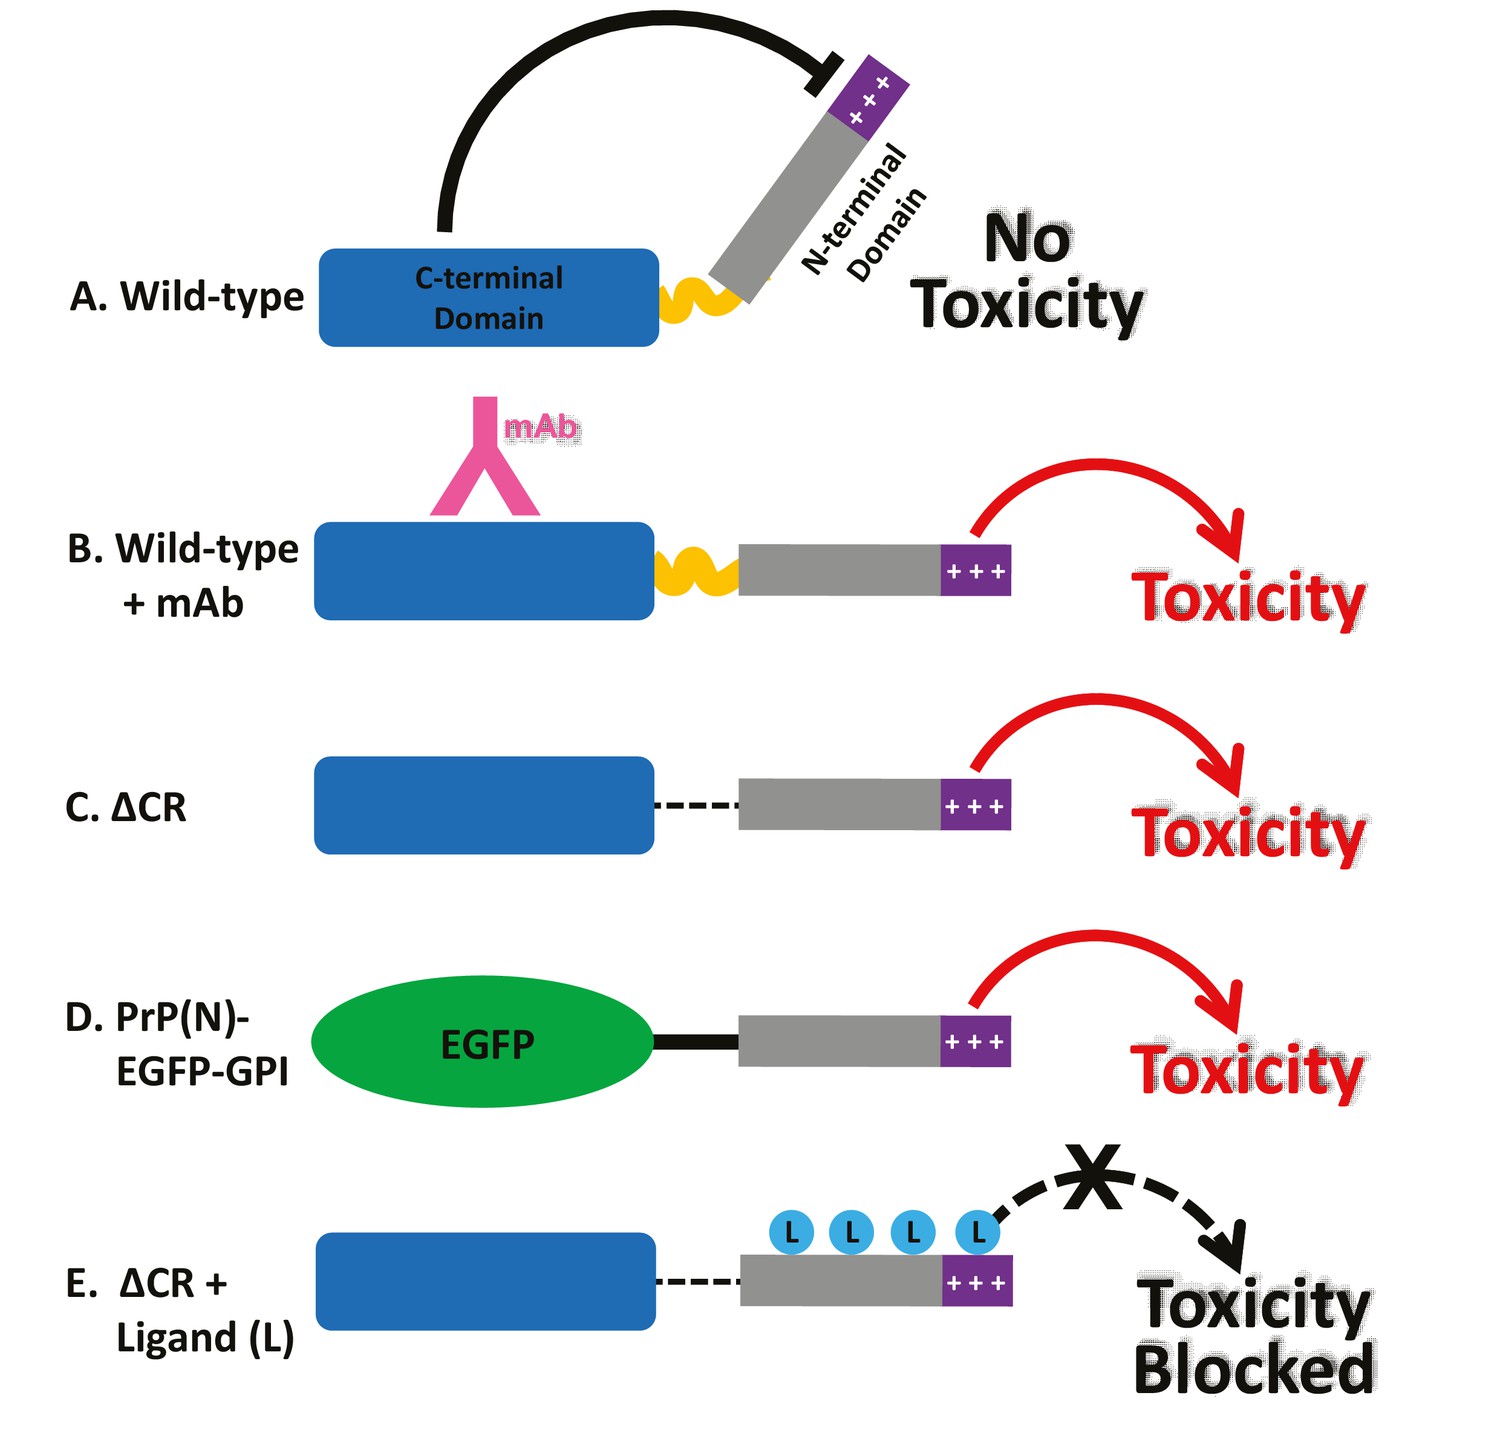
Models for the neurotoxic effects of PrP.
(A) The C-terminal domain of PrPC negatively regulates the toxic effector function of the N-terminal domain. +++, basic residues within the 23–31 region at the extreme N-terminus, which are essential for the toxic action of PrP. (B) Binding of monoclonal antibodies to the C-terminal domain disrupts this regulatory interaction, releasing the N-terminal domain to produce toxic effects. (C) Deletion of the central region, as in ΔCR PrP, produces a similar loss of regulation, with toxic consequences. (D) When EGFP is substituted for the C-terminal domain of PrPC, regulation is also lost. (E) Binding of ligands (PPS, antibodies, Cu2+) to the N-terminal domain of ΔCR PrP blocks its ability to exert toxic effects. These ligands would have a similar, inhibitory effect on PrP(N)-EGFP-GPI (not shown).
Tables
Table 1
Anti-prion antibodies used in this study, and their ability to induce ionic currents and dendritic toxicity.
| Antibody | Epitope | Currents | Dendritic toxicity |
|---|---|---|---|
| D18 (holo and Fab) | 132–156 (α1) | Yes | Yes |
| POM1 | 138-147/204,8,12 (α1/α3) | Yes | Yes |
| ICSM18 (holo and scFv) | 143–156 (α1) | Yes | Yes |
| 6D11 | 93-109/97-100 | Weak | Weak |
| ICSM35 | 93–105 | No | No |
| D13 | 95–105 | No | No |
| POM4 | 121-134/218-21 (β1/α3) | No | No |
| POM6 | 140/145/174/177 (α1/ α2) | No | No |
| POM11* | 51–90 (octarepeats) | No | No |
-
*Blocks currents induced by D18 and POM1.
Download links
A two-part list of links to download the article, or parts of the article, in various formats.
Downloads (link to download the article as PDF)
Open citations (links to open the citations from this article in various online reference manager services)
Cite this article (links to download the citations from this article in formats compatible with various reference manager tools)
The N-terminus of the prion protein is a toxic effector regulated by the C-terminus
eLife 6:e23473.
https://doi.org/10.7554/eLife.23473


