An essential dual-function complex mediates erythrocyte invasion and channel-mediated nutrient uptake in malaria parasites
- NIAID, National Institutes of Health, United States
Figures
Figure 1

RhopH2 and RhopH3 are membrane-associated proteins whose genes cannot be disrupted.
(A) Immunoblots showing that members of this complex are membrane-associated, but extractable by Na2CO3 (CO3); membr, integral membrane pool resistant to CO3. Only CLAG3 is cleaved by external pronase E, as indicated by an additional ~35 kDa band. (B) Immunofluorescent antibody (IFA) imaging of mature schizont-infected cells with indicated antibodies. Punctate labeling indicates that these proteins localize to rhoptry organelles in daughter merozoites. Scale bar, 5 µm. (C) IFA of trophozoite-infected cells, showing that each protein localizes to the host membrane and to the vacuole surrounding the intracellular parasite. Scale bar, 5 µm. (D) Matched-loading immunoblots from parasite stages shows production in schizonts (schz), incomplete delivery to invaded erythrocytes (ring- and trophozoite-infected cells), and release into culture supernatant (spent). CM, culture medium prior to cultivation is shown as a negative control. In each sample, proteins remain associated with membrane pellets (P) and are not soluble (S). (E) Schematic illustrates two plasmid transfection to produce knockouts (pL6-rhoph-KO), or transfection control that verifies sgRNA efficacy through repair with a codon-optimized version encoding an unmodified protein (pL6-rhoph-con). Streptococcus pyogenes Cas9 is expressed from pUF1-Cas9 (Ghorbal et al., 2014). (F) Ethidium-stained gel showing PCR-confirmed integration (Int) of positive control transfections (con) for each sgRNA on both genes, but retention of a wild-type site (WT) and pL6 episomes (P) in knockout transfections (KO).
Figure 2
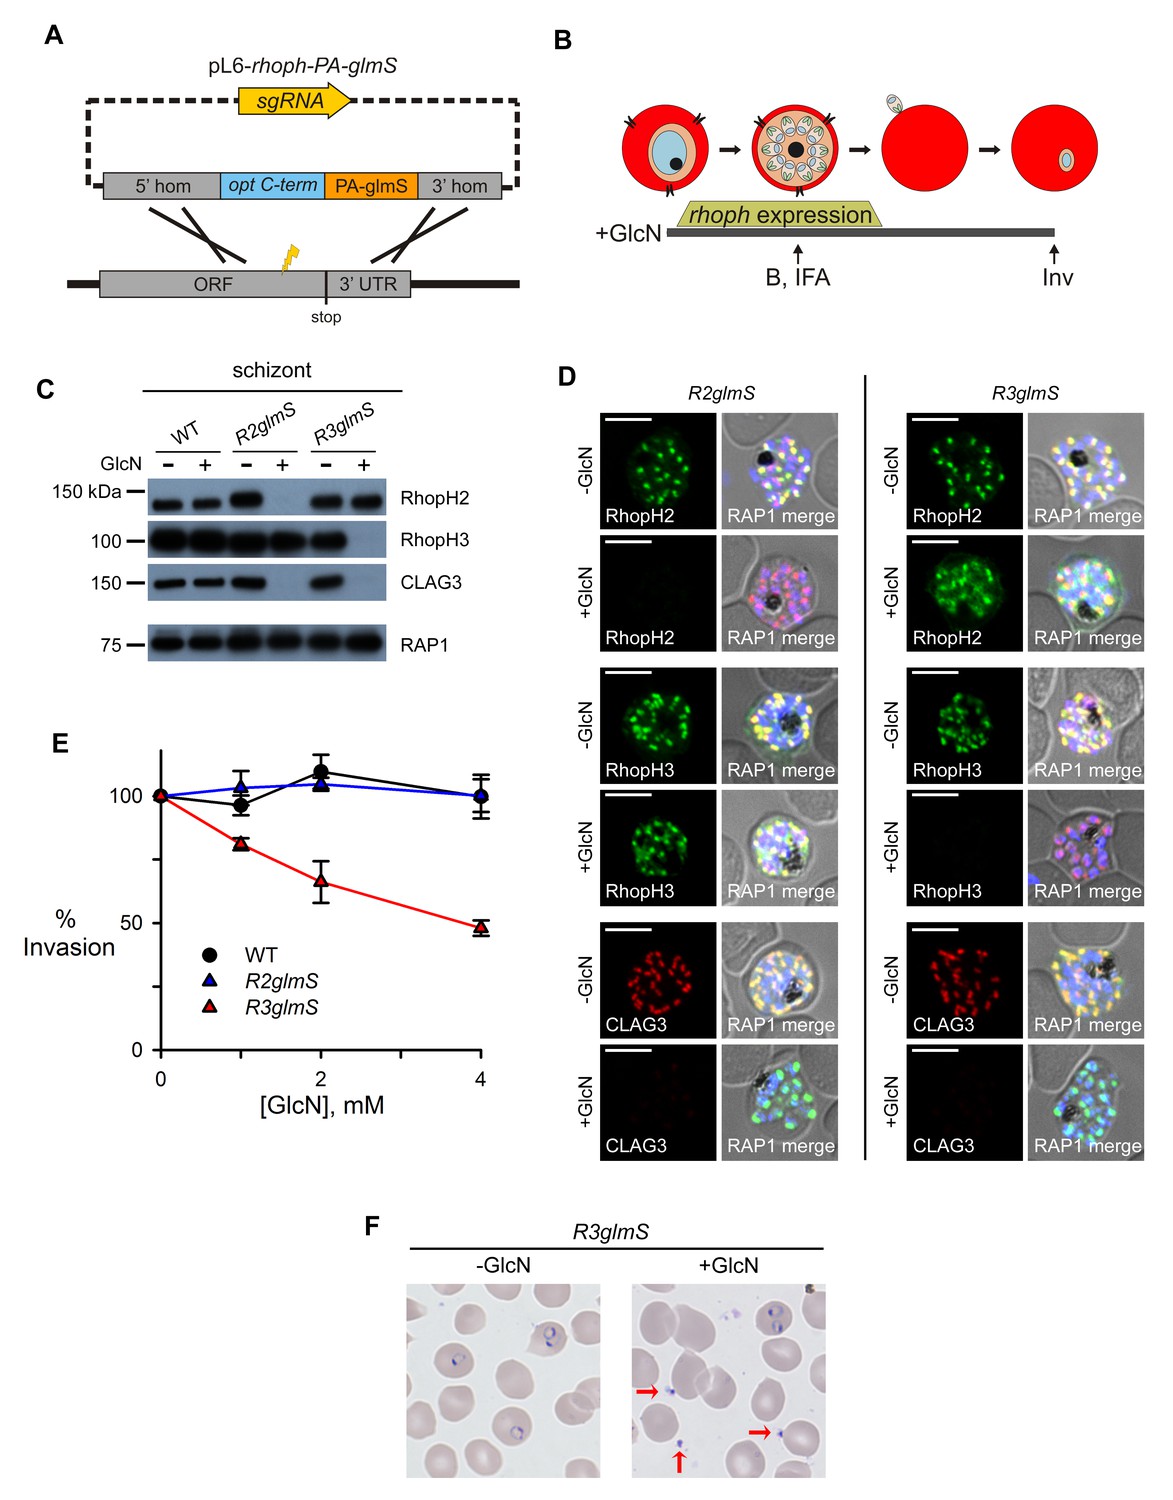
Assembly-dependent trafficking in merozoites and a role in host cell invasion for RhopH3 alone.
(A) Strategy for the introduction of the PA epitope tag followed by a stop codon and a glmS riboswitch at the 3’ end of rhoph genes. (B) Schematic showing GlcN exposure timed to cover the expression of rhoph genes and the subsequent harvest of cells for immunoblotting (B), indirect immunofluorescence assays (IFA), and invasion studies (Inv). (C) Immunoblots of matched lysates from schizont-stage parasites with or without exposure to 4 mM GlcN. Knockdown eliminates targeted gene product and also CLAG3. RAP1, an unassociated rhoptry protein, is preserved. (D) IFA of indicated proteins in R2glmS and R3glmS at schizont stage; the colocalization of a protein with RAP1 and apical puncta in daughter merozoites indicates rhoptry trafficking. Scale bars, 5 µm. (E) GlcN dose responses (mean ± S.E.M.) for merozoite invasion by each parasite. (F) Giemsa-stained micrographs of R3glmS showing extracellular merozoites (red arrows) after GlcN treatment, but not in the untreated control. Immature ring-infected erythrocytes are also apparent.
Figure 3 with 1 supplement
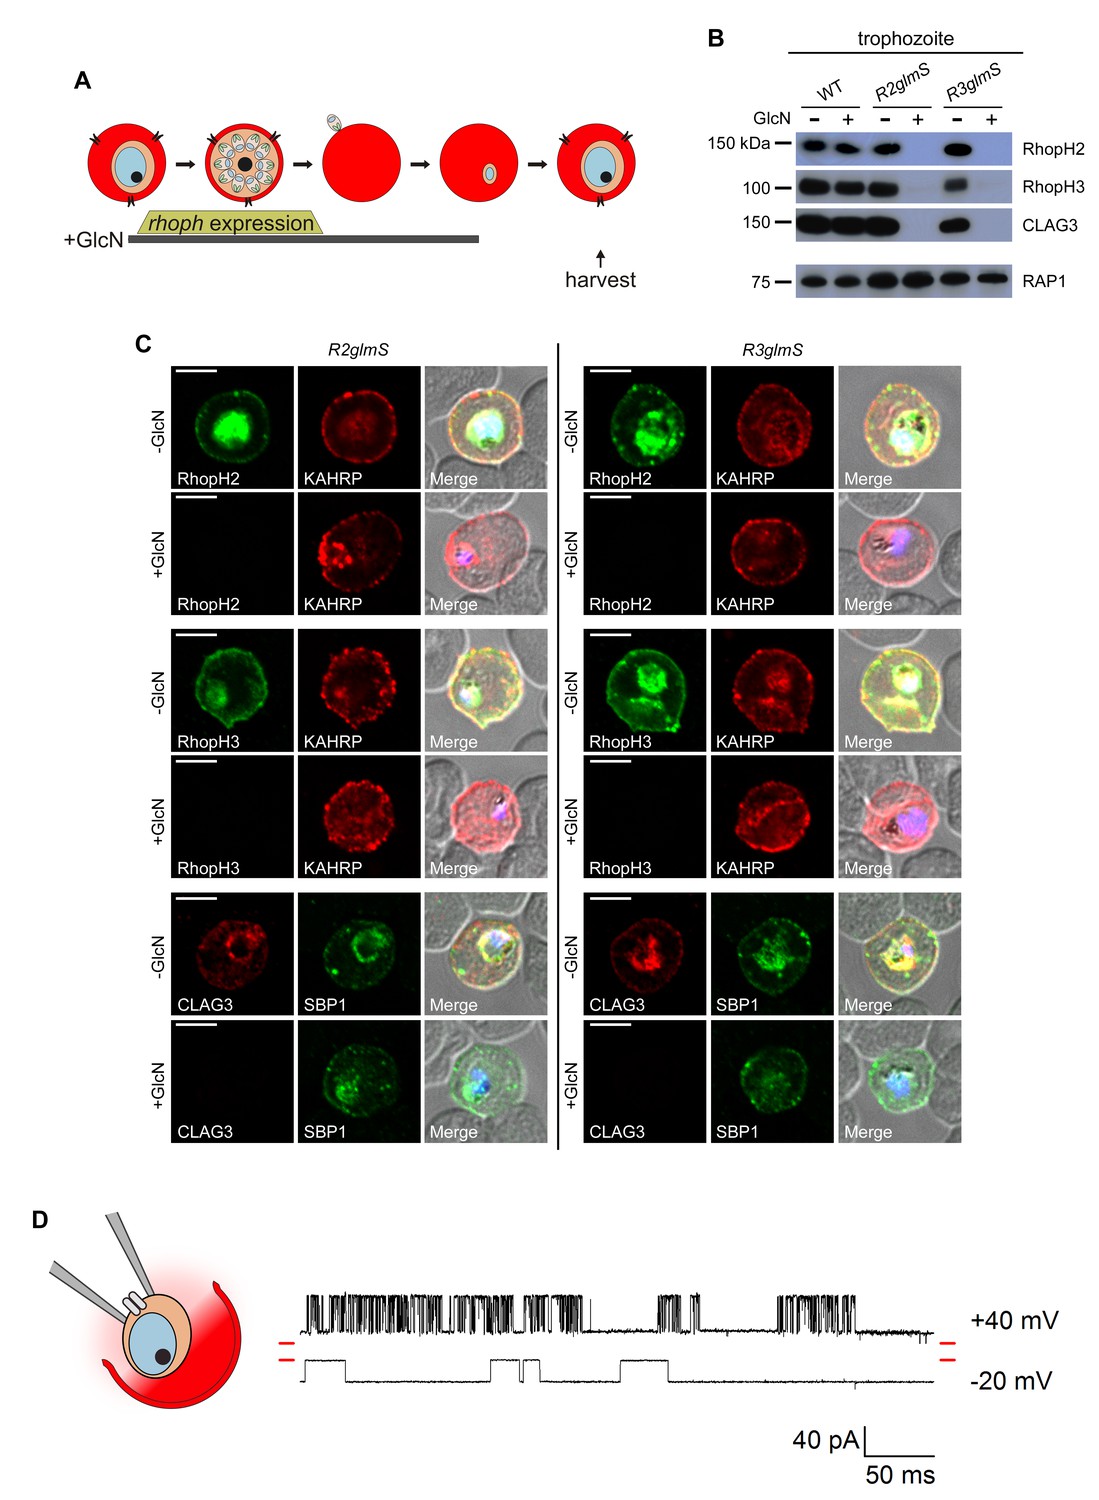
Transfer of intact complexes to new host cells and no role for RhopH proteins in vacuolar function.
(A) Schematic showing timeline for GlcN exposure, rhoph gene expression, and subsequent harvest of trophozoite-infected cells. (B) Immunoblots of matched lysates from trophozoite-stage parasites with or without exposure to 4 mM GlcN. Both knockdown parasites lack all three associated proteins, indicating that only intact complexes are transferred during host cell invasion. RAP1 does not depend on RhopH proteins for its transfer. (C) IFA of indicated proteins in R2glmS and R3glmS at the trophozoite stage. Each member of the complex is undetectable in GlcN-treated cells, but KAHRP and SBP1 are exported to the host compartment normally. Scale bars, 5 µm. (D) Single-channel patch-clamp recordings on the PVM of R3glmS after cultivation with 4 mM GlcN, showing stochastic transitions of the large conductance channel at this membrane. The RhopH complex is not required for this channel activity. The membrane potential at the patch (negative of the pipette potential) is indicated to the right of each trace; red dashes at both ends of traces correspond to the closed channel levels. 460 ms of recording is shown at each membrane potential. The schematic on the left shows a patch-clamp pipette sealed on the PVM after parasite extraction from a host erythrocyte.
Figure 3—figure supplement 1
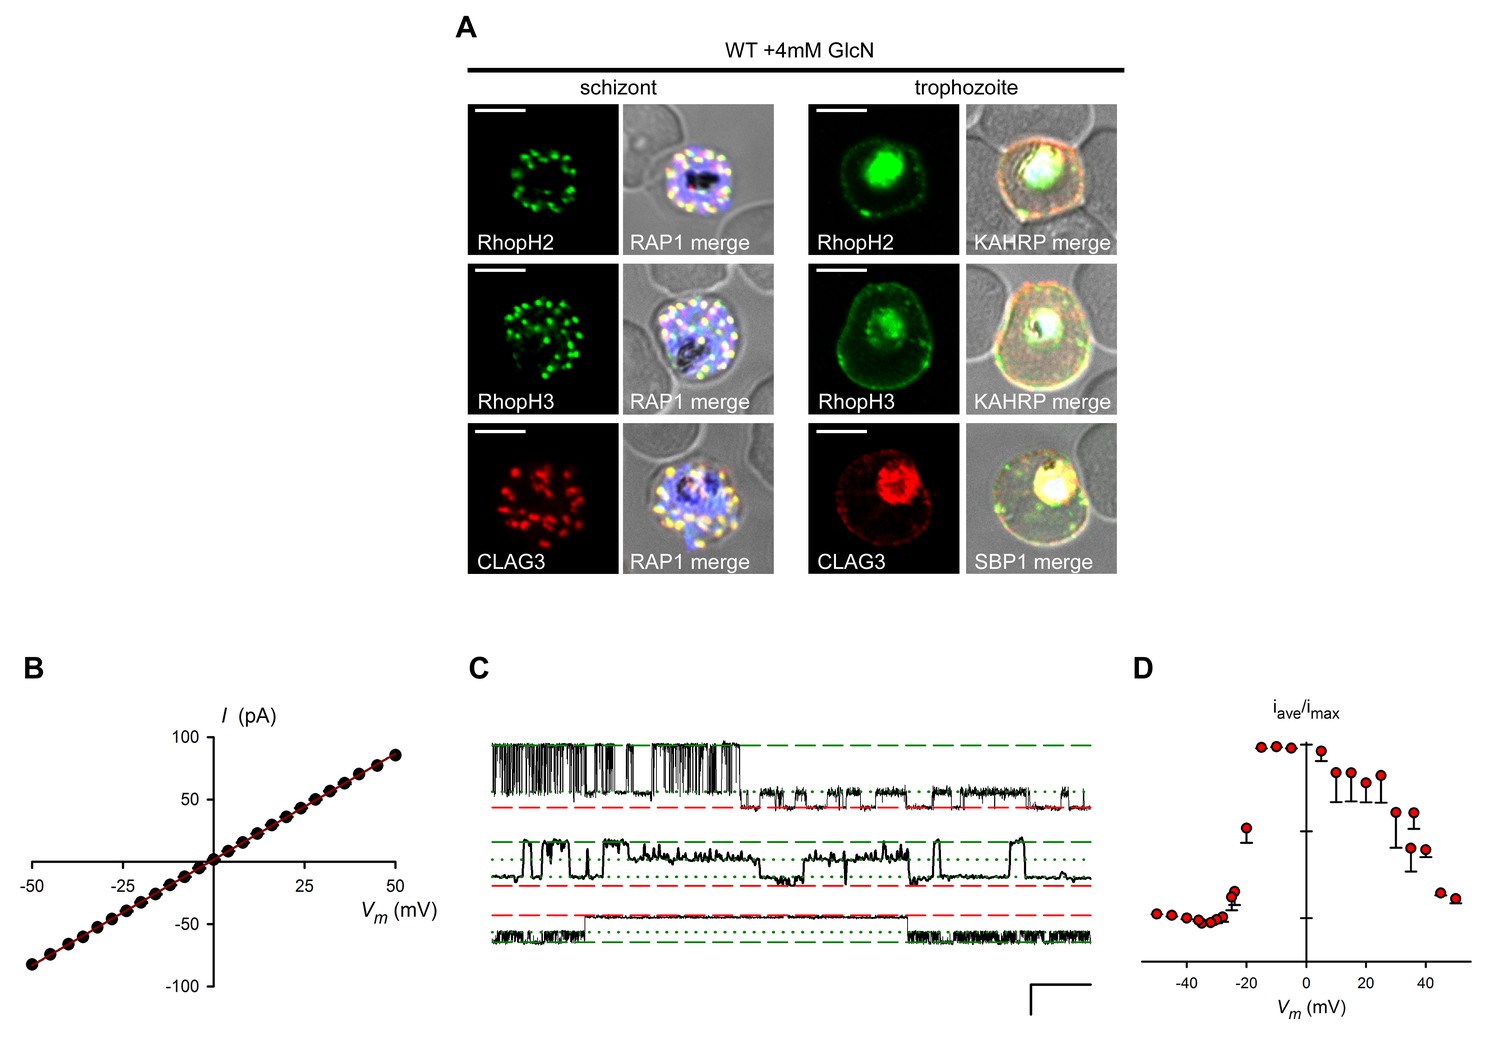
GlcN affects neither RhopH complex proteins in untransfected parasites nor PVM channel biophysical properties.
(A) IFA of wild-type parasites grown with 4 mM GlcN. Schizont- and trophozoite-infected cells are shown for the indicated RhopH members. Colocalization with RAP1 indicates protein in schizont rhoptries. Colocalization with KAHRP and SBP1 indicates export to erythrocyte membrane in trophozoites. Scale bars, 5 μm. (B) Mean ± S.E.M. maximal open channel currents (I) for PVM channel recordings on R3glmS cultivated with 4 mM GlcN. Currents are shown at imposed membrane potentials (Vm, calculated as the negative of the pipette potential). The chord conductance, 1.7 nS, was determined by linear regression (solid line). (C) Single channel recordings from a PVM patch on R3glmS cultivated with 4 mM GlcN showing closed, open, and subconductance levels (red dashed, green dashed, and green dotted lines, respectively). Traces were recorded at membrane potentials of +40 mV, +35 mV, and −21 mV (top to bottom traces, respectively). Scale bar at bottom right represents 50 ms horizontal/30 pA vertical. (D) PVM channel open probability (mean ± S.E.M.) for R3glmS grown with 4 mM GlcN. Values were calculated as the mean time-averaged current divided by the maximal open channel current and plotted against imposed Vm.
Figure 4 with 1 supplement
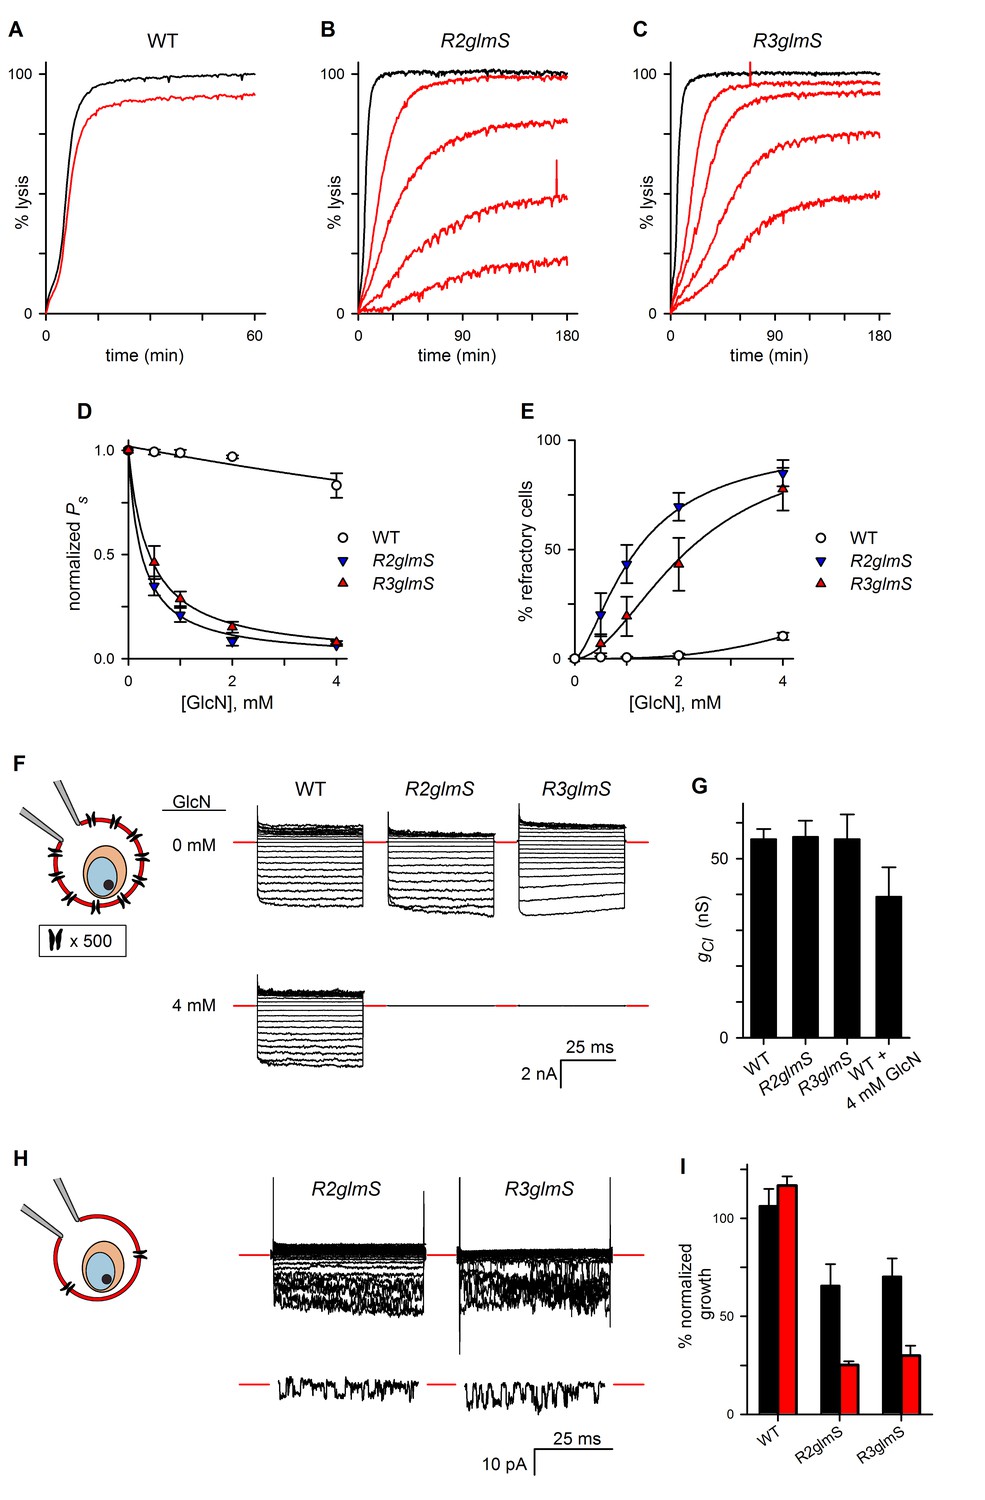
RhopH complex abundance correlates with PSAC activity.
(A) Osmotic lysis kinetics resulting from sorbitol uptake by wild-type parasites with or without exposure to 4 mM GlcN (red and black traces, respectively). (B–C) Lysis kinetics for transfectant parasites without (black) or with 0.5, 1, 2, or 4 mM GlcN (top to bottom red traces, respectively). Note the extended time scales for osmotic lysis. (D) Normalized sorbitol permeabilities (mean ± S.E.M.) for each parasite at indicated GlcN concentrations. Solid lines represent best fits to y = a/(1 + (x/K0.5)). (E) Percentage of cells refractory to osmotic lysis (mean ± S.E.M.) at each [GlcN]. Solid lines represent best fits to a two-parameter logistic curve. (F) Whole-cell currents from individual trophozoite-infected erythrocytes, presented as the ensemble responses to membrane voltages (Vm) between −100 and +100 mV in 10 mV increments. 4 mM GlcN specifically abolishes currents on knockdown parasites. Red dashes indicate zero current levels. The schematic on the left shows the whole-cell patch-clamp configuration; the recording pipette measures currents resulting from ion flow through channels on the cell surface; the measured currents correspond to ~4000 channels on infected cells not subjected to GlcN knockdown. (G) Chord conductances (gCl) (mean ± S.E.M.) for each parasite without GlcN, calculated from whole-cell currents between Vm of 0 and −100 mV. Statistics were calculated from up to 15 cells each. The value for wild-type cells after 4 mM GlcN treatment is also shown. (H) Whole-cell ensemble currents for transfectants cultivated with 4 mM GlcN, taken from panel (F) but presented at an increased gain. Single traces beneath each ensemble show stochastic transitions that are due to openings of individual channels detected in the whole-cell configuration; Vm, −90 and −70 mV for traces shown at bottom in R2glmS and R3glmS, respectively. These transitions and the reduced ensemble amplitudes indicate a marked reduction in PSAC copy number. Horizontal and vertical scale bars represent 25 ms and 10 pA, respectively, for all traces. The schematic on the left shows the whole-cell patch-clamp configuration and a reduced number of channels. (I) Parasite growth (mean ± S.E.M.) over 72 hr in standard medium or PGIM (black and red bars, respectively) after exposure to 1 mM GlcN. For each parasite, growth was normalized to 100% for matched controls using the same parasite and culture medium without GlcN treatment.
Figure 4—figure supplement 1
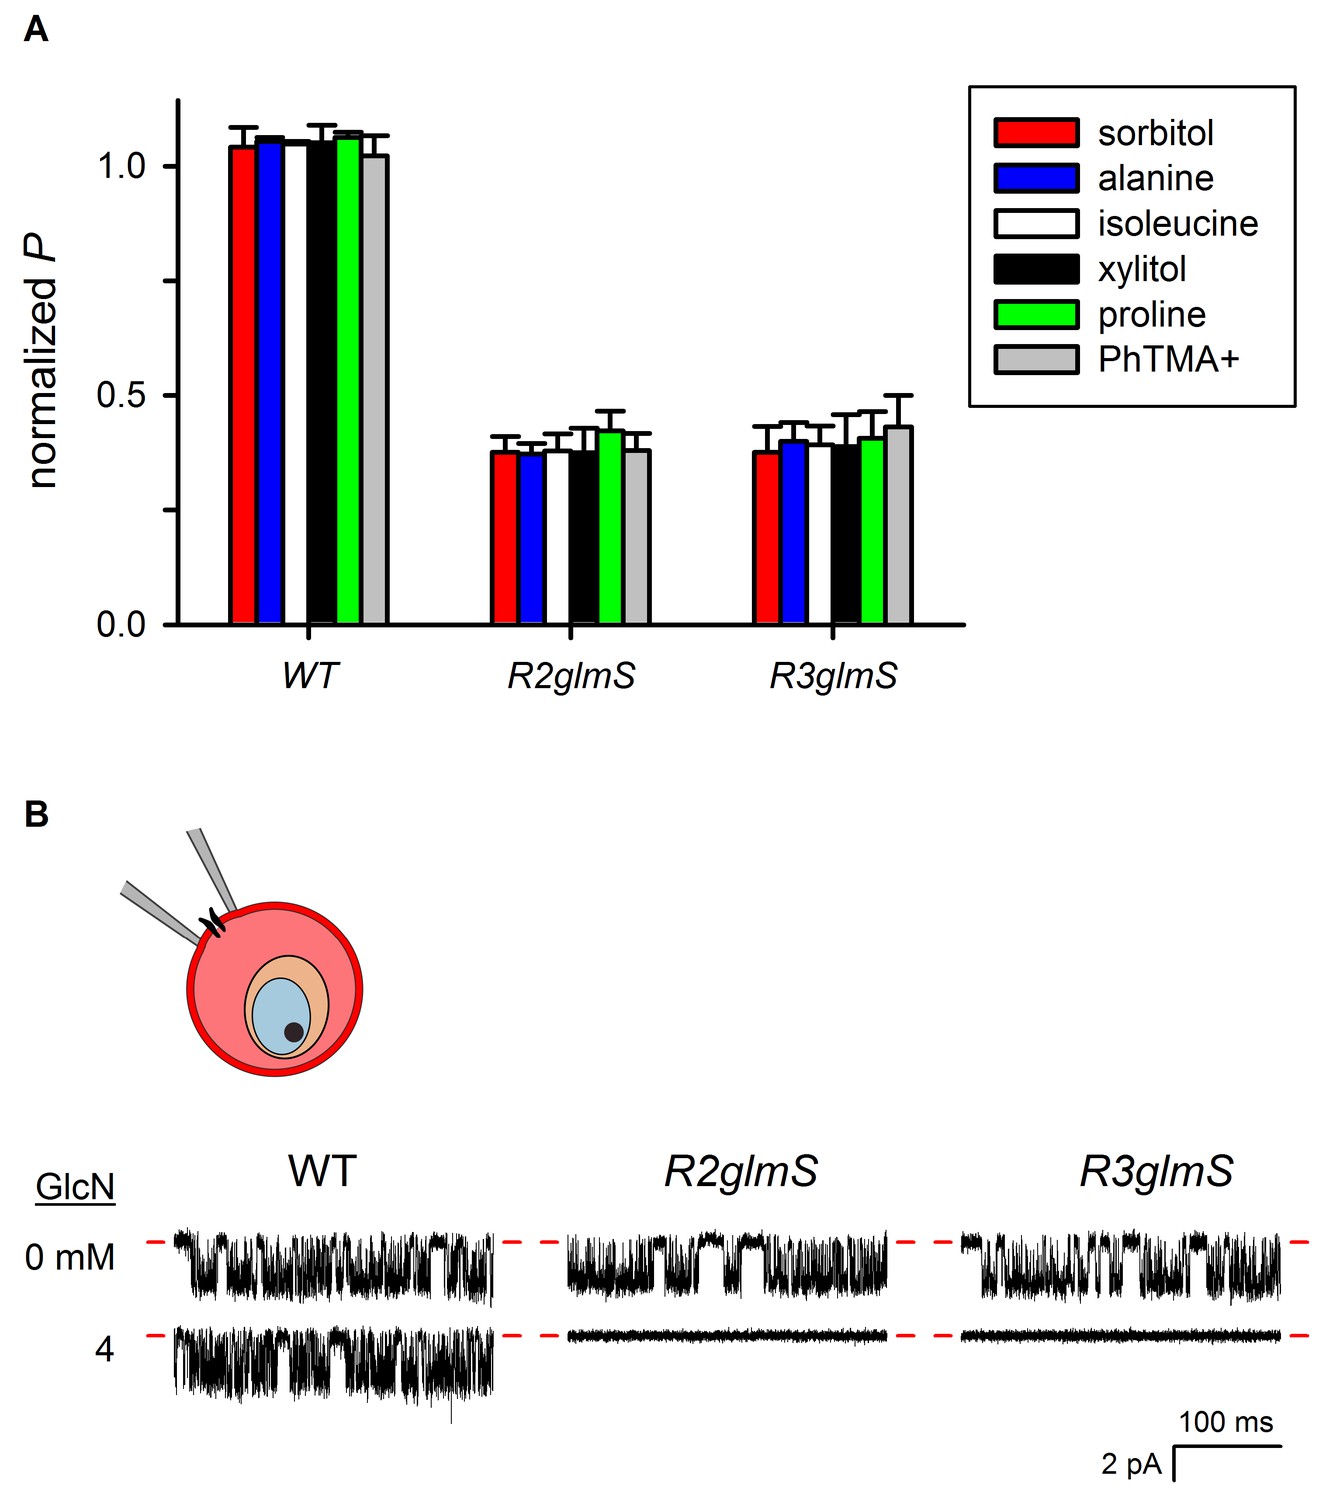
Organic solute permeabilities and cell-attached patch-clamp of wild-type and glmS knockdown parasites.
(A) Permeabilities (P) (mean ± S.E.M.) of the indicated organic solutes in wild-type and transfectant infected cells grown with 1 mM GlcN treatment. PhTMA+, phenyl trimethyl-ammonium cation. Values were determined from osmotic lysis kinetic experiments and normalized to matched cultures without GlcN. Reductions in solute permeabilities were uniform for both transfectant parasites (p>0.9, One-way ANOVA). (B) Cell-attached recordings on erythrocyte membranes from cells infected with indicated parasites without or with 4 mM GlcN treatment. Downward deflections in each trace reflect openings of single channels in the membrane patch. Red dashes indicate closed channel currents. Representative of up to 41 patches in each condition. Imposed membrane protentials, −100 mV; scale bars represent 100 ms horizontal and 2 pA vertical for all traces. The schematic shows cell-attached patch-clamp of an infected erythrocyte; a single PSAC is shown in the membrane patch being recorded.
Figure 5
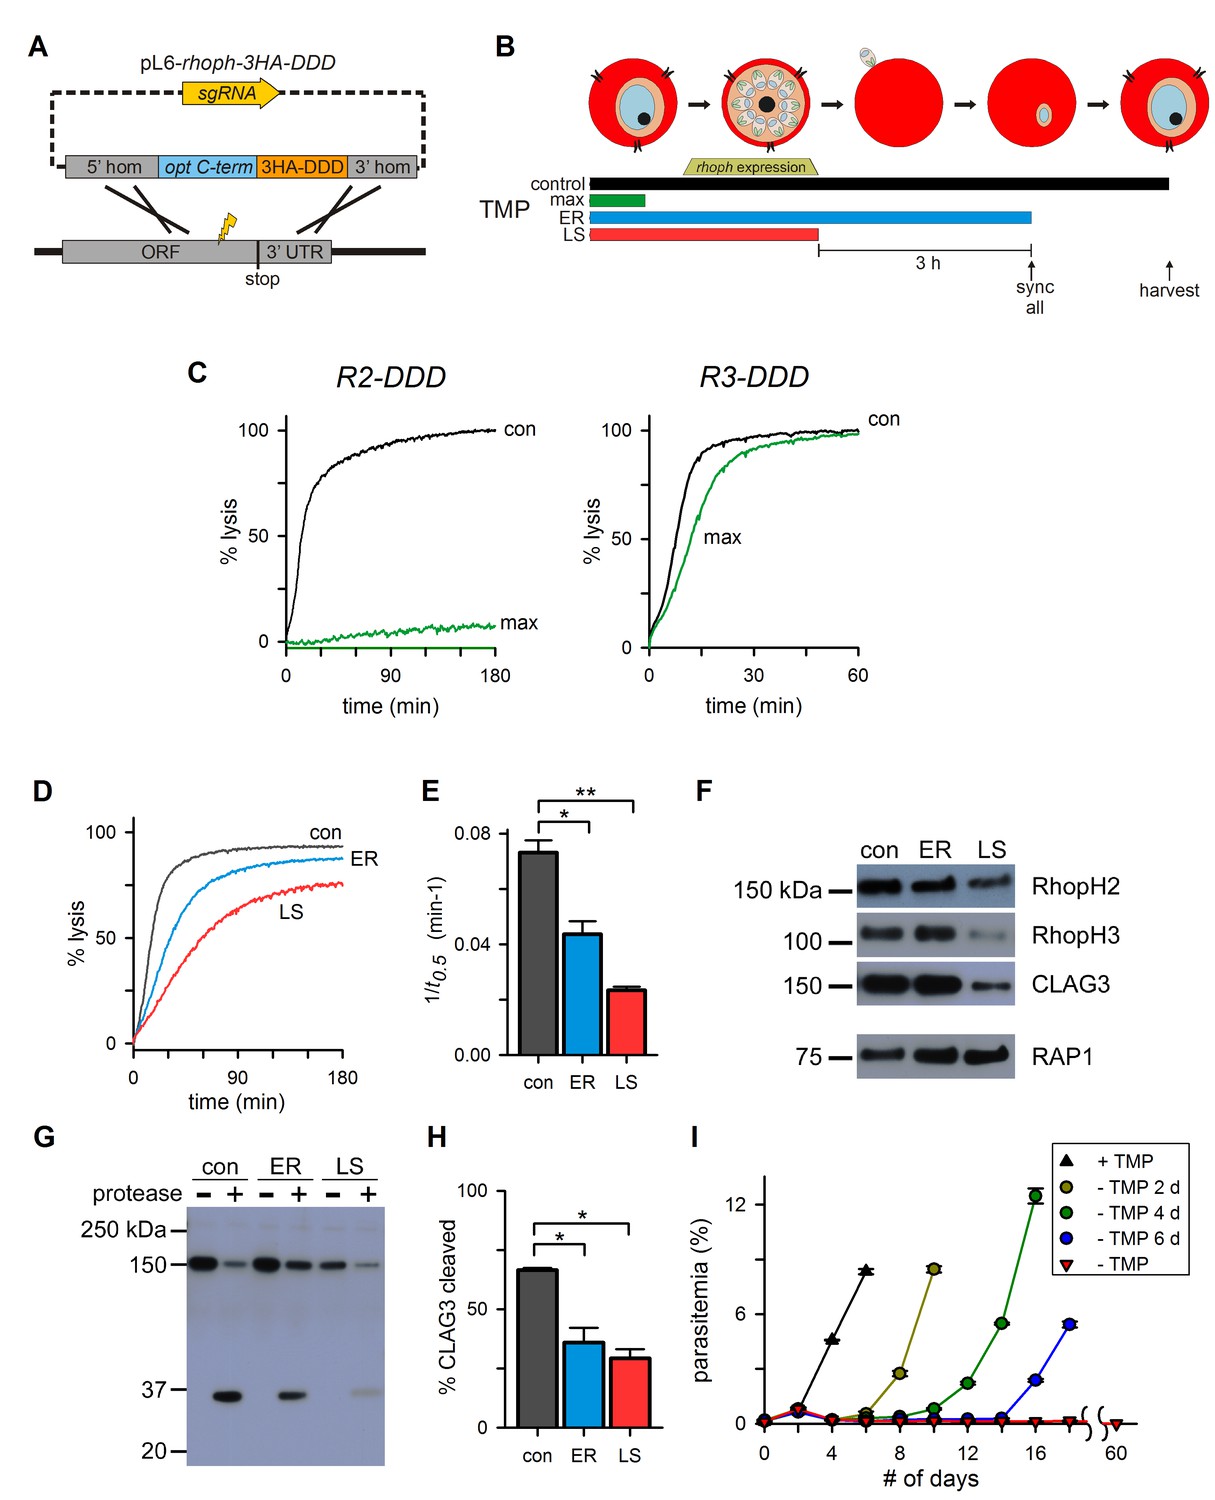
Post-translational knockdown reveals a requirement for RhopH2 after invasion.
(A) Strategy for the introduction of a tandem 3xHA-DDD tag at the protein’s C-terminus. (B) Schematic showing the timeline for the stage-specific removal of TMP and harvest of trophozoite-stage parasites. Horizontal bars below the schematic indicate the presence of TMP. control, TMP is present continuously; max, maximal knockdown is achieved with TMP removal prior to the onset of gene transcription; ER, TMP is removed after invasion and synchronization of early rings; LS, TMP is removed from late schizonts after protein trafficking to rhoptries. (C) Sorbitol-induced osmotic lysis kinetics for each transfectant after continuous cultivation with TMP (con) or withdrawal for maximal knockdown (‘max’, as illustrated in panel [B]). (D) Osmotic lysis kinetics for R2-DDD with TMP removal as indicated in panel (B). Traces are color-coded to match panel (B). (E) Mean ± S.E.M. of the reciprocal of sorbitol-induced osmotic lysis halftime (t0.5) for control and each stage-specific R2-DDD knockdown. *p=0.02; **p<10−3. (F) Immunoblots of trophozoite-stage R2-DDD parasites after stage-specific knockdown as indicated. While late-schizont TMP removal (LS) reduces each protein’s abundance in newly invaded cells, early ring removal does not affect protein levels (ER). (G) Immunoblot showing CLAG3 protease susceptibility as an indicator of host membrane insertion for indicated stage-specific knockdowns. (H) Mean ± S.E.M. of fractional CLAG3 cleavage, quantified from three independent trials as in panel (G). *p<0.01. (I) Parasite expansion without or with TMP removal for two, four, or six days. Viable parasites could not be detected over a 60-day period when TMP was not restored.
Figure 6
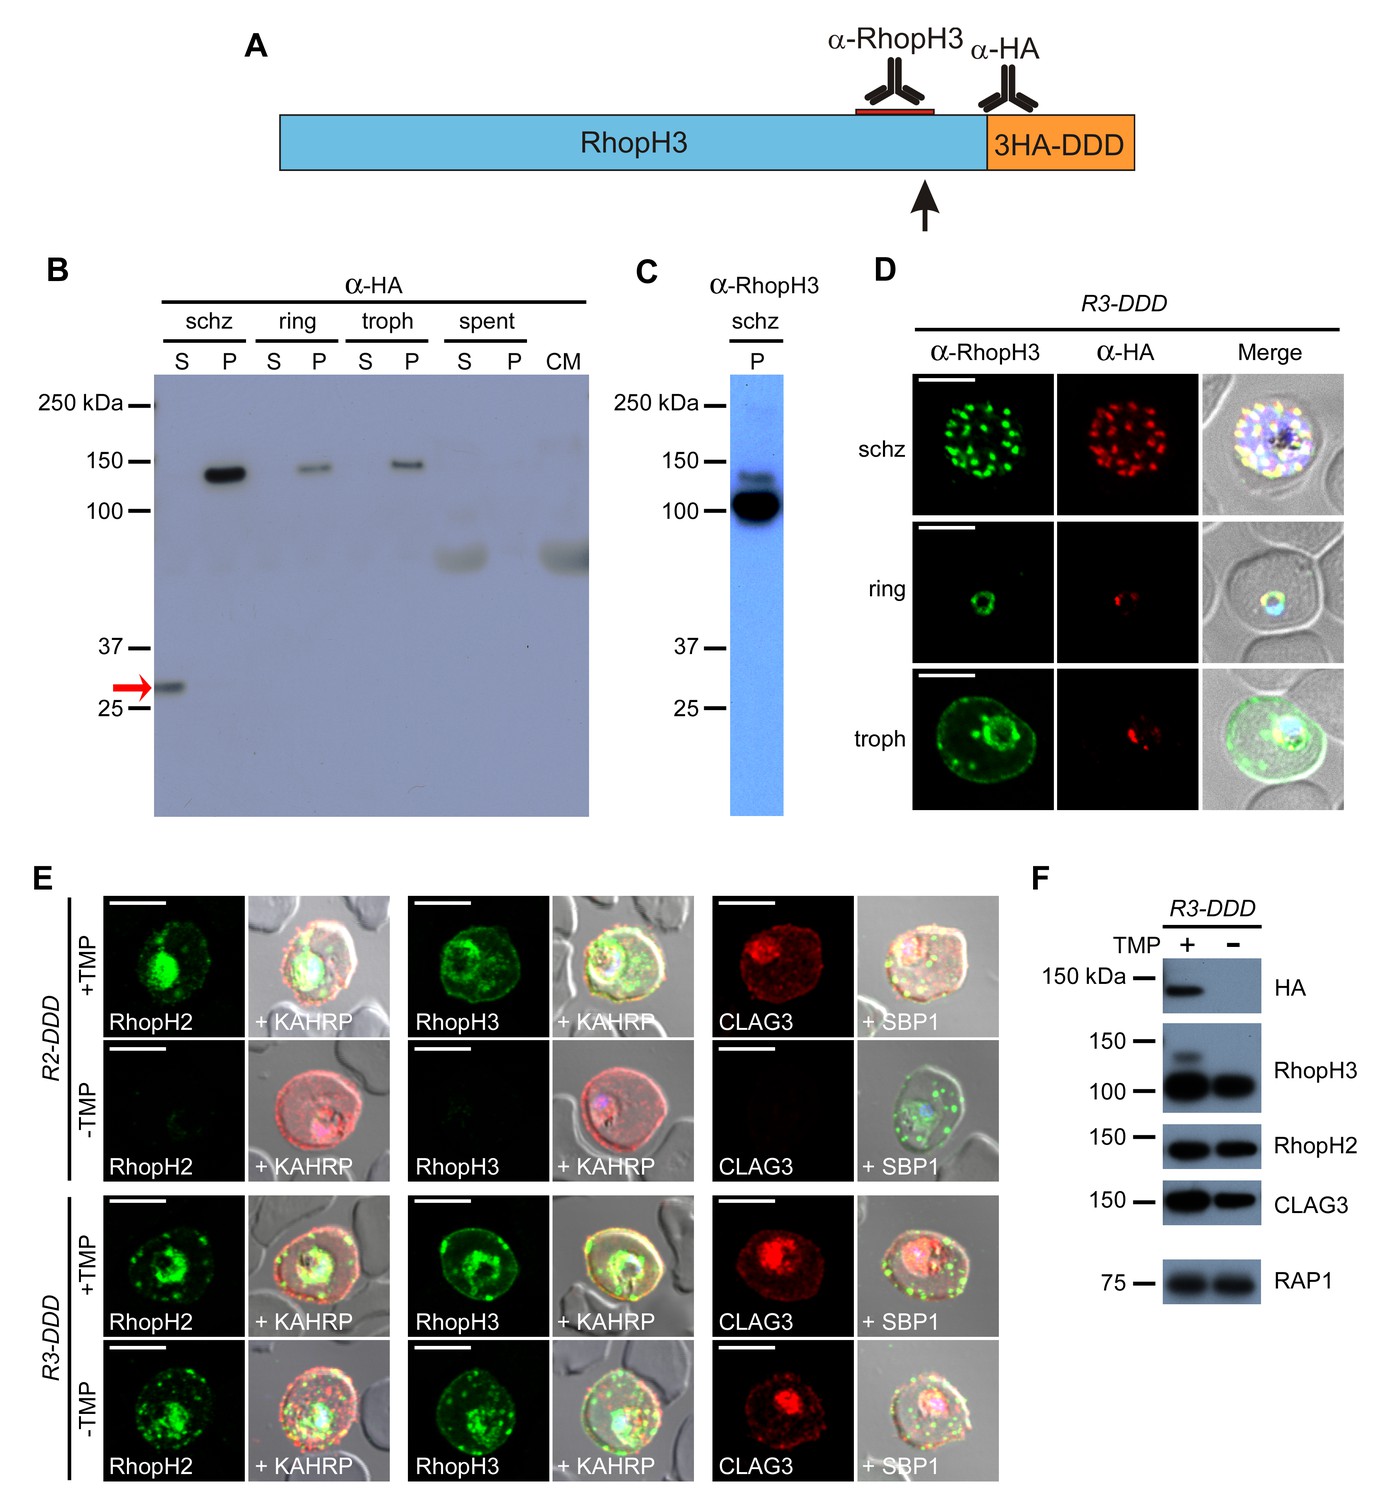
Proteolytic processing of RhopH3 compromises post-translational knockdown and accounts for the preserved PSAC activity in R3-DDD parasites.
(A) Ribbon schematic showing RhopH3 (blue), the engineered C-terminal 3HA-DDD tag (orange), and the sites recognized by the indicated antibodies. The ribbon and the red bar indicating the epitope used to produce anti-RhopH3 antibody are drawn to scale. The data in this figure implicate proteolytic processing at a site marked with a black arrow. (B) Immunoblot of schizont-, ring-, and trophozoite-infected cell lysates from R3-DDD and of spent culture medium collected after invasion of synchronous cultures, probed with anti-HA. A red arrow points to the soluble cleavage product detected in schizonts. CM, culture medium not exposed to parasites. S and P, soluble and ultracentrifugation pellet fractions. (C) Immunoblot of a schizont-infected R3-DDD membrane fraction, probed with anti-RhopH3. A primary 100 kDa processed band and a less intense 130 kDa unprocessed band are apparent. (D) IFA of R3-DDD probed with the indicated antibodies at each parasite stage. Note that both antibodies detect protein in schizont rhoptries, but that only the anti-RhopH antibody detects export to the host membrane in trophozoites. Scale bars, 5 µm. (E) Trophozoite-stage IFAs of indicated parasites cultivated with and without TMP for 48 hr, showing that knockdown abolishes each member of the complex in R2-DDD but not in R3-DDD. Co-localization is shown with the exported parasite proteins KAHRP or SBP1 (red or green in merge panels, respectively). Scale bars, 5 µm. (F) Trophozoite-stage immunoblots using the indicated antibodies. R3-DDD was cultivated with or without TMP for 48 hr (the ‘max’ knockdown culture in Figure 5B).
Figure 7
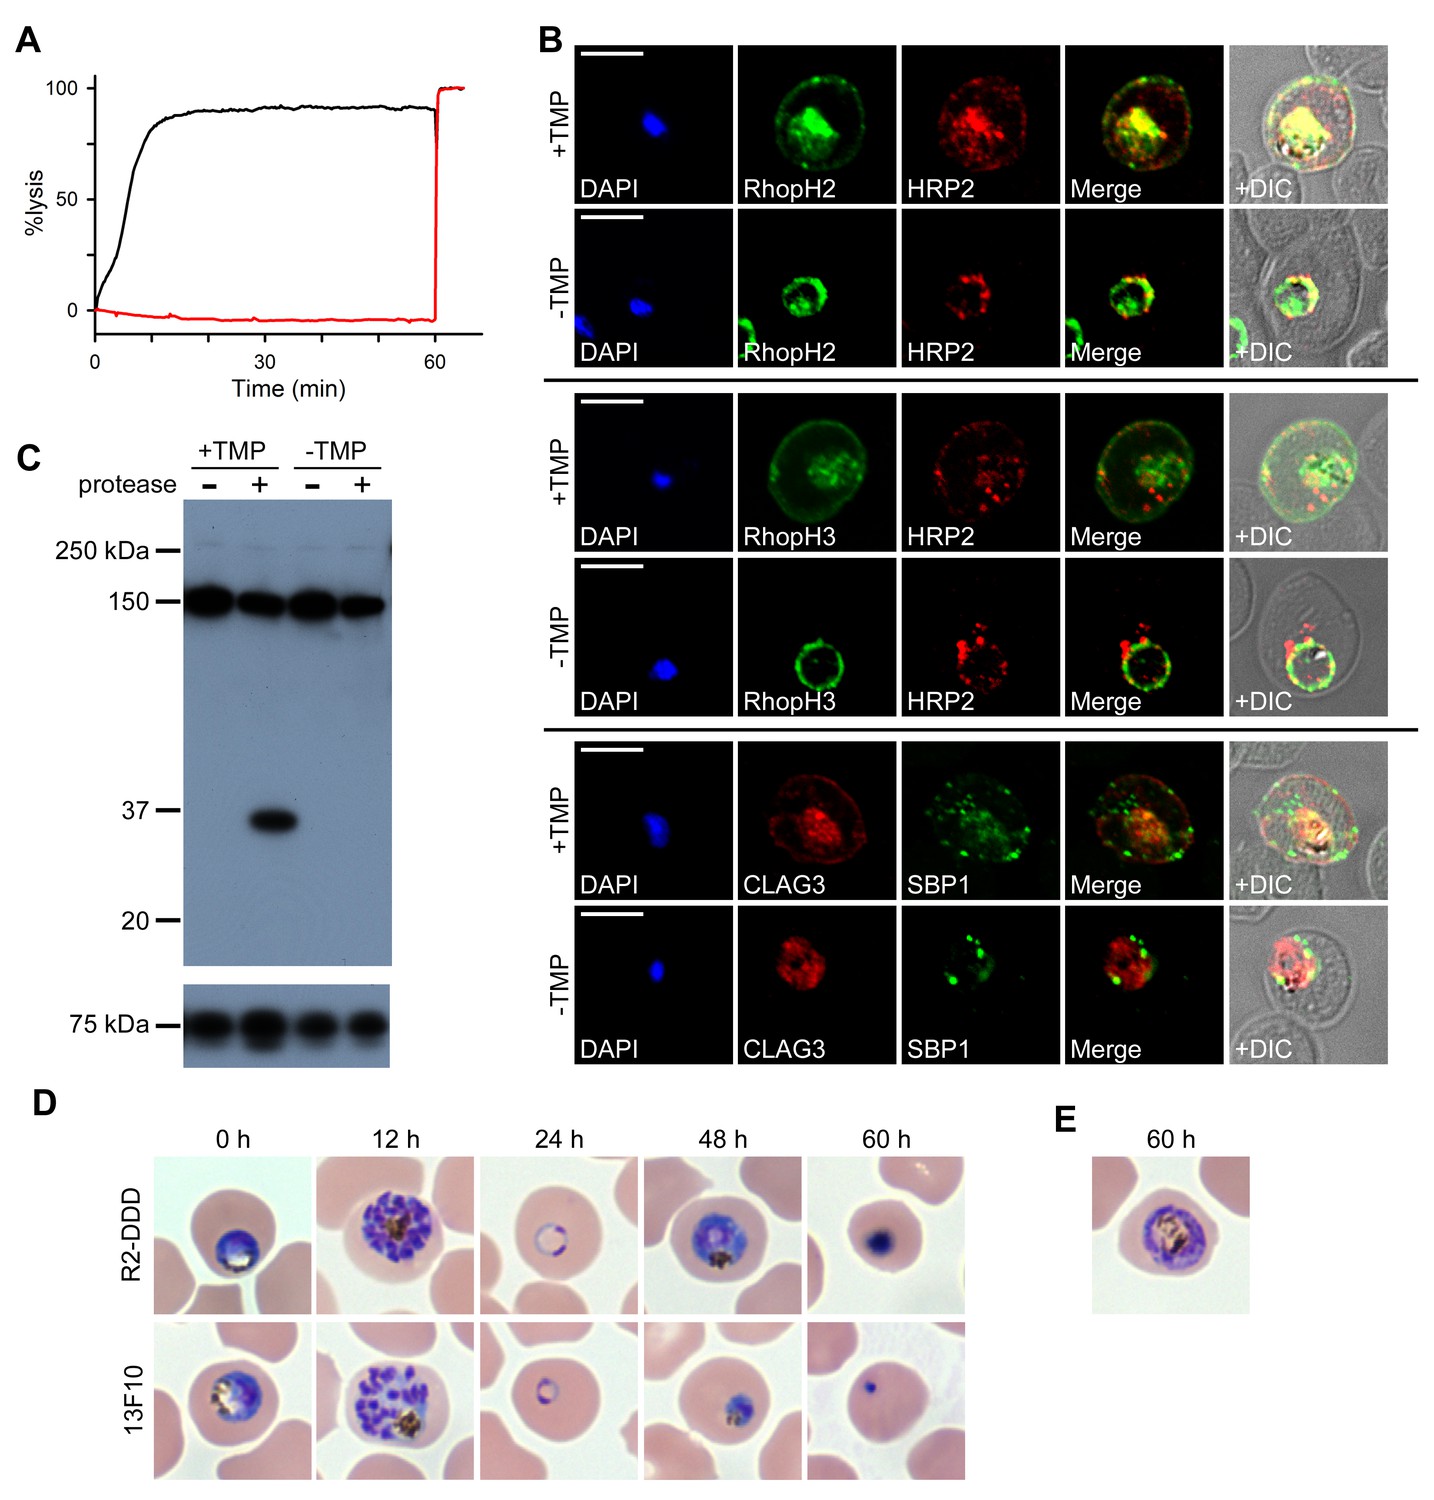
RhopH proteins are deposited in the PV and exported via PTEX.
(A) Sorbitol-induced osmotic lysis of 13F10 parasites cultivated with or without 10 µM TMP (black and red traces, respectively). Cells were lysed by the addition of 0.5% saponin at 60 min. (B) IFA of 13F10 showing export of RhopH proteins after growth with or without TMP for 48 hr. Colocalization with exported HRP2 or SBP1 is indicated. Scale bars, 5 µm. (C) Immunoblot of 13F10 membrane fractions harvested after cultivation with or without TMP for 48 hr, probed with anti-CLAG3. A 35 kDa cleavage product of pronase E treatment indicates that CLAG3 is integral to the host membrane. (D) Giemsa-stained micrographs of R2-DDD and 13F10 at indicated intervals after TMP removal. (E) Alternate morphology of some arrested R2-DDD cells.
Figure 8
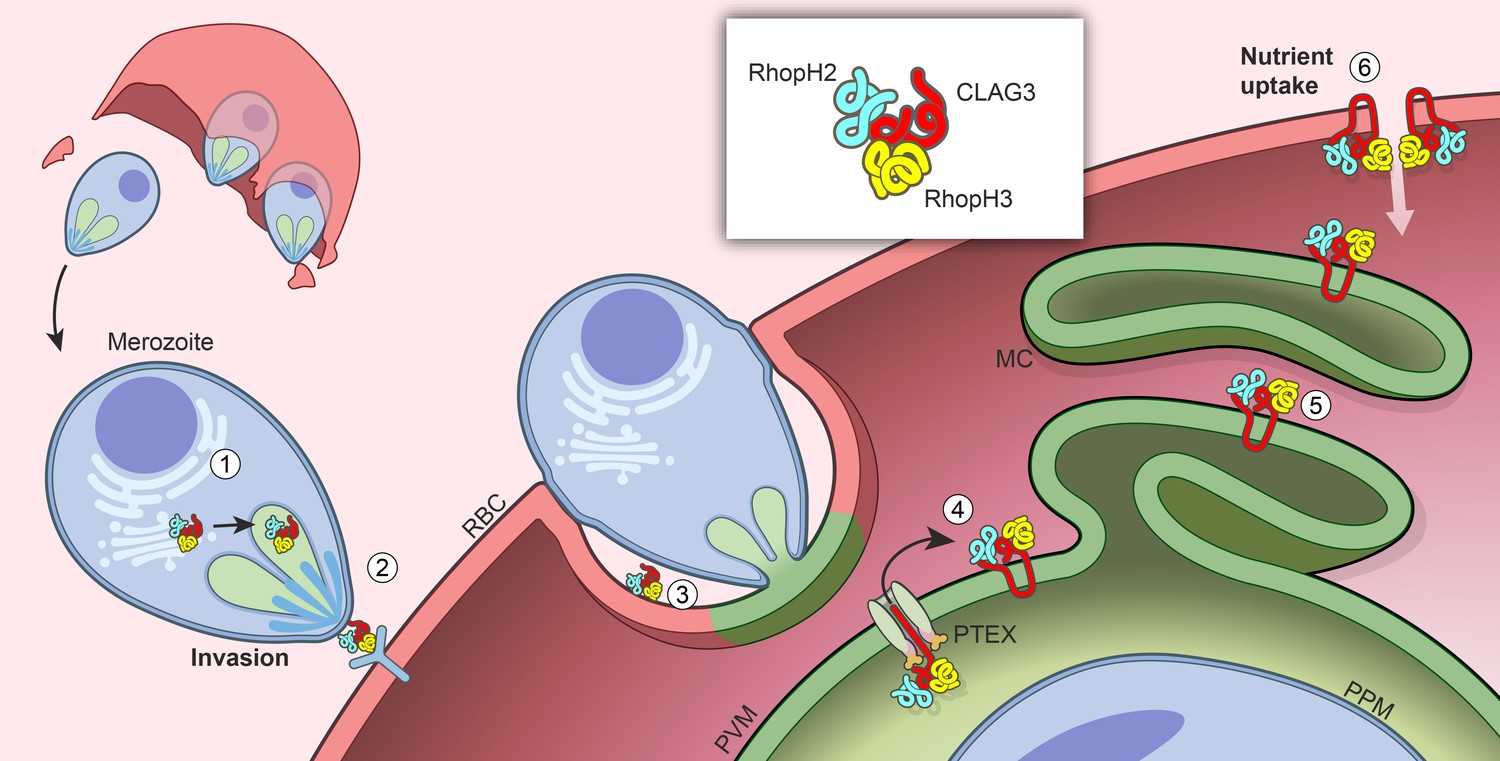
Model for trafficking of the RhopH complex and its roles throughout the parasite cycle.
Cotranslational assembly of the three-member RhopH complex enables trafficking to the rhophtry (‘1’). After merozoite egress, only RhopH3 contributes to invasion (‘2’); the complex is then deposited into the PV (‘3’), from where it is exported via PTEX (‘4’) and trafficked via the Maurer’s clefts (MC, ‘5’) to the host RBC membrane. There, the complex determines nutrient uptake via PSAC (‘6’).
Additional files
-
Supplementary file 1
Primers used in this study.
Underlined sequences represent overhangs for In-Fusion cloning (Clontech).
- https://doi.org/10.7554/eLife.23485.013
Download links
A two-part list of links to download the article, or parts of the article, in various formats.
Downloads (link to download the article as PDF)
Open citations (links to open the citations from this article in various online reference manager services)
Cite this article (links to download the citations from this article in formats compatible with various reference manager tools)
An essential dual-function complex mediates erythrocyte invasion and channel-mediated nutrient uptake in malaria parasites
eLife 6:e23485.
https://doi.org/10.7554/eLife.23485


