The Hippo pathway effector YAP is an essential regulator of ductal progenitor patterning in the mouse submandibular gland
- Boston University School of Medicine, United States
- Boston University School of Dental Medicine, United States
- Boston University, United States
- Biogen, United States
Figures
Figure 1

Nuclear Yap marks distinct populations of developing SMG ductal epithelial cells.
(A) Illustration depicting the early developing SMG epithelium, with the positioning of relevant multipotent progenitor cells highlighted. (B,C) Two different magnified IF microscopy images of the bud-duct transition zone showing the localization of Yap (green) in E13.5 mouse SMG epithelium. (D) Images from IF microscopy analysis of Yap (green) together with Krt14 (K14, white) shows prominent nuclear Yap in Krt14-positive cells. (E) Illustration depicting the maturing stratified SMG ductal epithelium with relevant cell populations highlighted, and a description of our observed localization pattern for Yap. (F) Images from IF microscopy analysis of total Yap (green) and phospho-S112 Yap (red) in E15.5 mouse SMGs. In luminal cells, Yap phosphorylation levels are elevated and Yap is excluded from the nucleus, while many basal cells exhibit prominent nuclear Yap localization. (G) Images from IF microscopy analysis of E18.5 mouse SMG ducts for Yap (green) and Krt5 (K5, red) showing prominent nuclear Yap localization in a subset of Krt5-positive basal cells and cytoplasmic Yap in Krt5-negative luminal cells. White arrows highlight prominent nuclear Yap localization in the basal cells in (F) and (G). DAPI was used to mark the nuclei (blue) in all images, and for clarity the basal surface of the epithelium is outlined with a white dotted line. Scale bar = 20 µm. All images represent observations made from a minimum of three biological repeats.
Figure 2
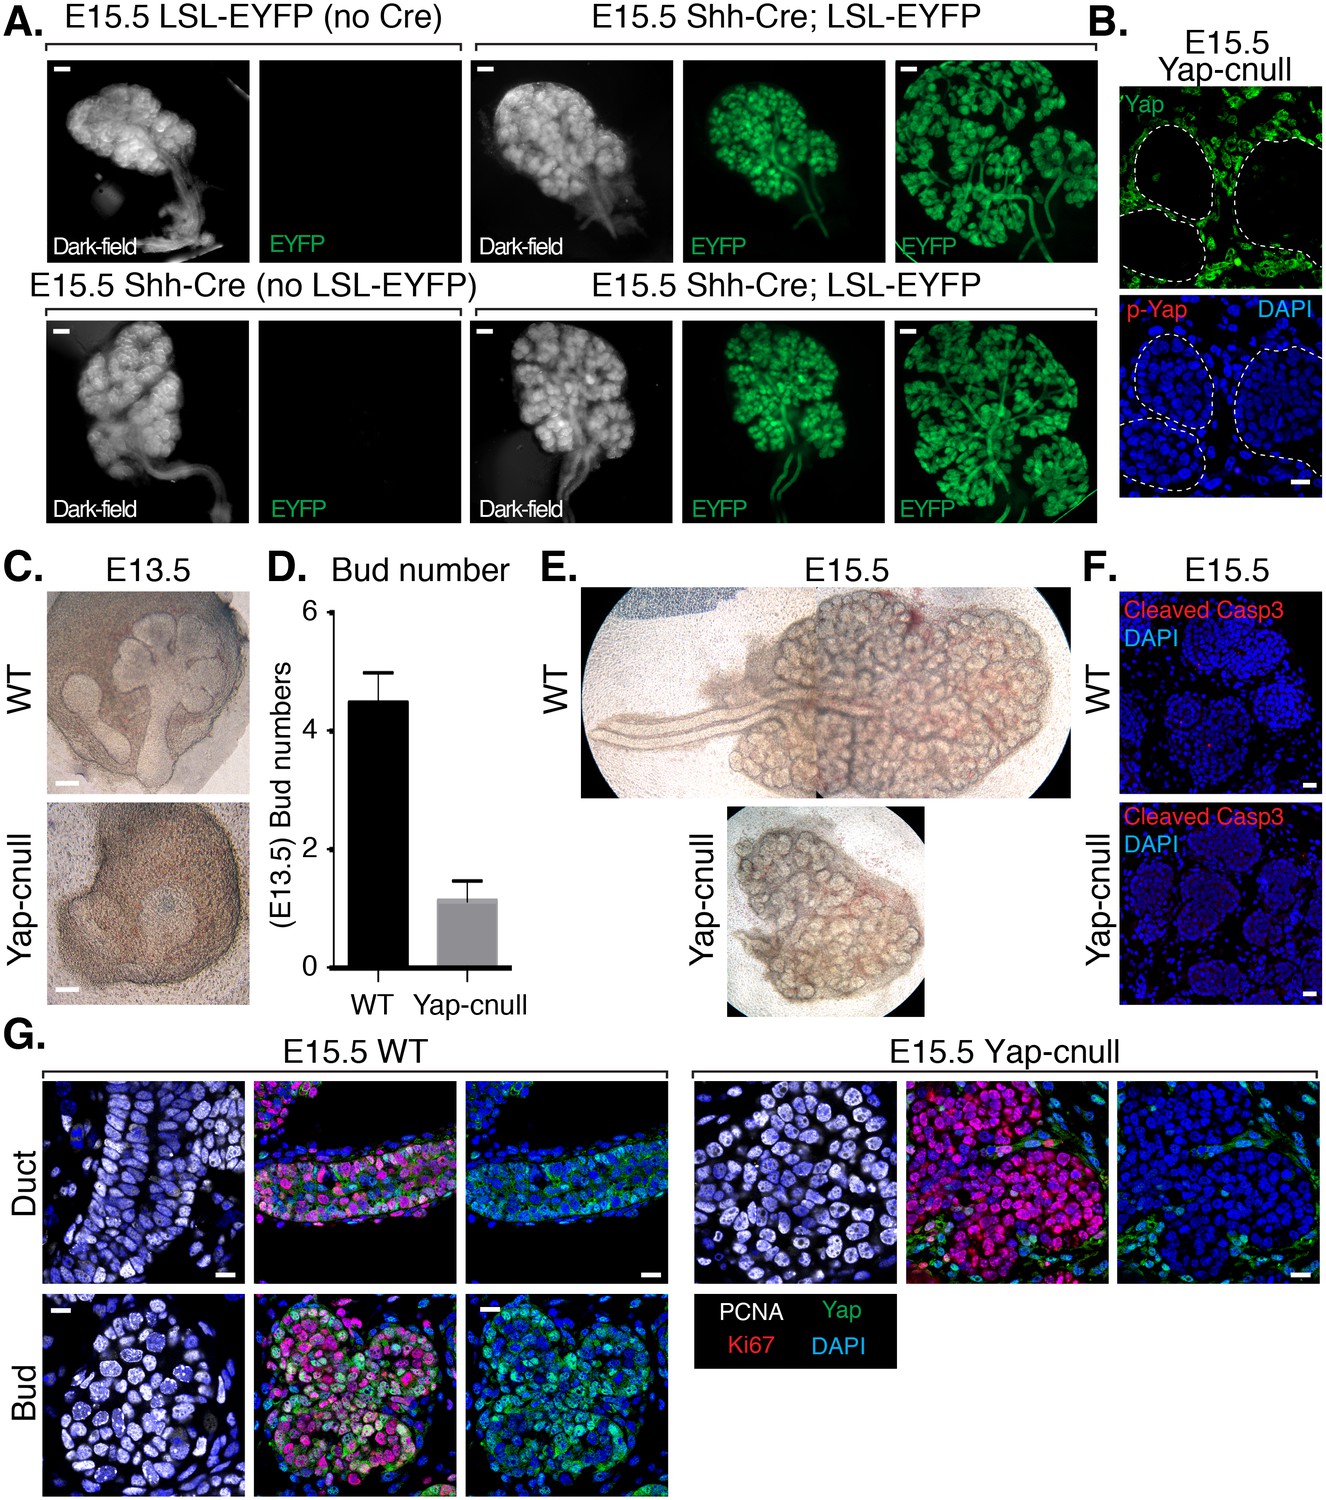
Deletion of Yap in developing SMG epithelium results in severe branching defects and defective ductal domain patterning.
(A) Lineage tracing using Shh-Cre; ROSA26-lox-STOP-lox-EYFP reporter mouse. E15.5 mouse SMGs of the indicated genotypes were dissected and immediately imaged on an inverted microscope in dark-field for the left panels and for fluorescent EYFP signal in the right panels. In the furthest right panels, the SMGs were compressed under a coverslip to highlight the EYFP-positive epithelial branches. Scale = 200 μm (B) Images from IF microscopy imaging of E15.5 Shh-Cre-Yap-null (Yap-cnull) SMGs for total Yap (green) and phospho-S112 Yap (red) showing efficient deletion of Yap in the SMG epithelium (outlined by a dotted white line). (C) Phase-contrast images of E13.5 WT and Yap-cnull SMGs showing severe morphogenesis defects in Yap-cnull SMGs. Scale = 100 μm. (D) Quantitation of bud number from E13.5 WT and Yap-cnull SMGs (n = 23). (E) Phase-contrast images of E15.5 WT and Yap-cnull SMGs indicating a disorganized bud structure and lack of ductal trees in Yap-deficient SMGs. Note that the image from the WT SMG is stitched together from two images. (F) Images from IF microscopy analysis of Cleaved-caspase 3 in E15.5 WT and Yap-cnull SMGs showing no apparent defect in apoptosis. Note, that the Cleaved-caspase 3 antibody activity was validated in parallel slides containing positive cells. Scale = 20 μm. (G) Images from IF microscopy analysis of E15.5 WT and Yap-cnull SMGs for Yap (green), Ki-67 (red), or PCNA (white) showing no apparent proliferation defects in Yap-deleted epithelium. Scale = 10 μm. DAPI was used to mark the nuclei (blue). All images represent observations made from a minimum of three biological repeats.
Figure 3
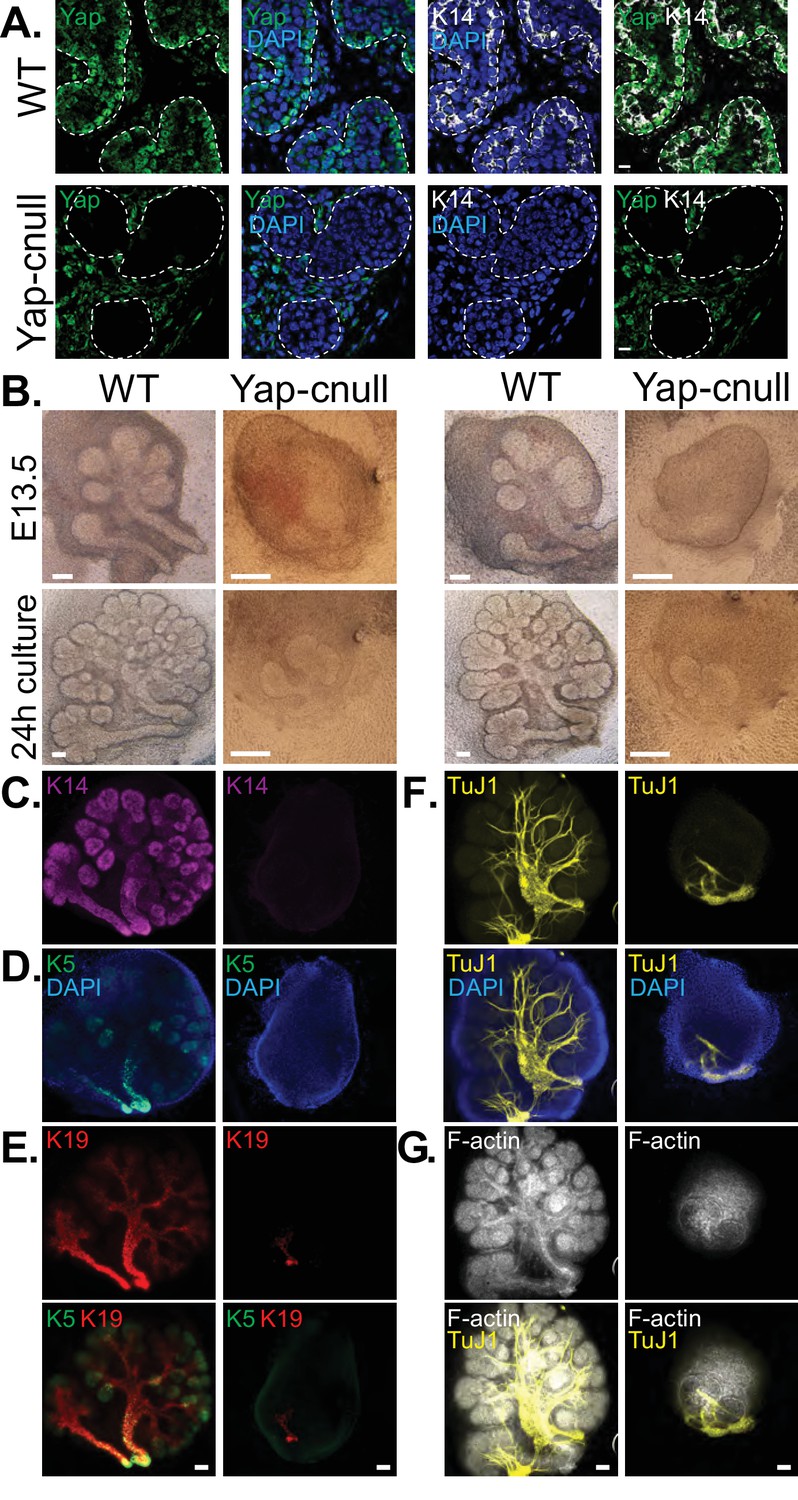
Yap is required for SMG ductal epithelial patterning.
(A) IF analysis of Yap (green) and Krt14 (K14, white) in E15.5 WT and Yap-cnull SMGs. Scale = 10 µm. (B–G) E13.5 WT and Yap-cnull SMGs were dissected and cultured for 24 hr ex vivo and then examined by microscopy. (B) Phase-contrast images of E13.5 WT and Yap-cnull SMGs at the time of dissection and 24 hr after culture. The same SMGs (each column is one SMG) were analyzed by IF for (C) Krt14 (K14, magenta), (D) Krt5 (K5, green), (E) Krt19 (K19, red), (F) TuJ1 (yellow), and (G) F-actin (white, Phalloidin). DAPI was used to mark the nuclei (blue). Scale = 100 μm. All images represent observations made from a minimum of three biological repeats.
Figure 4
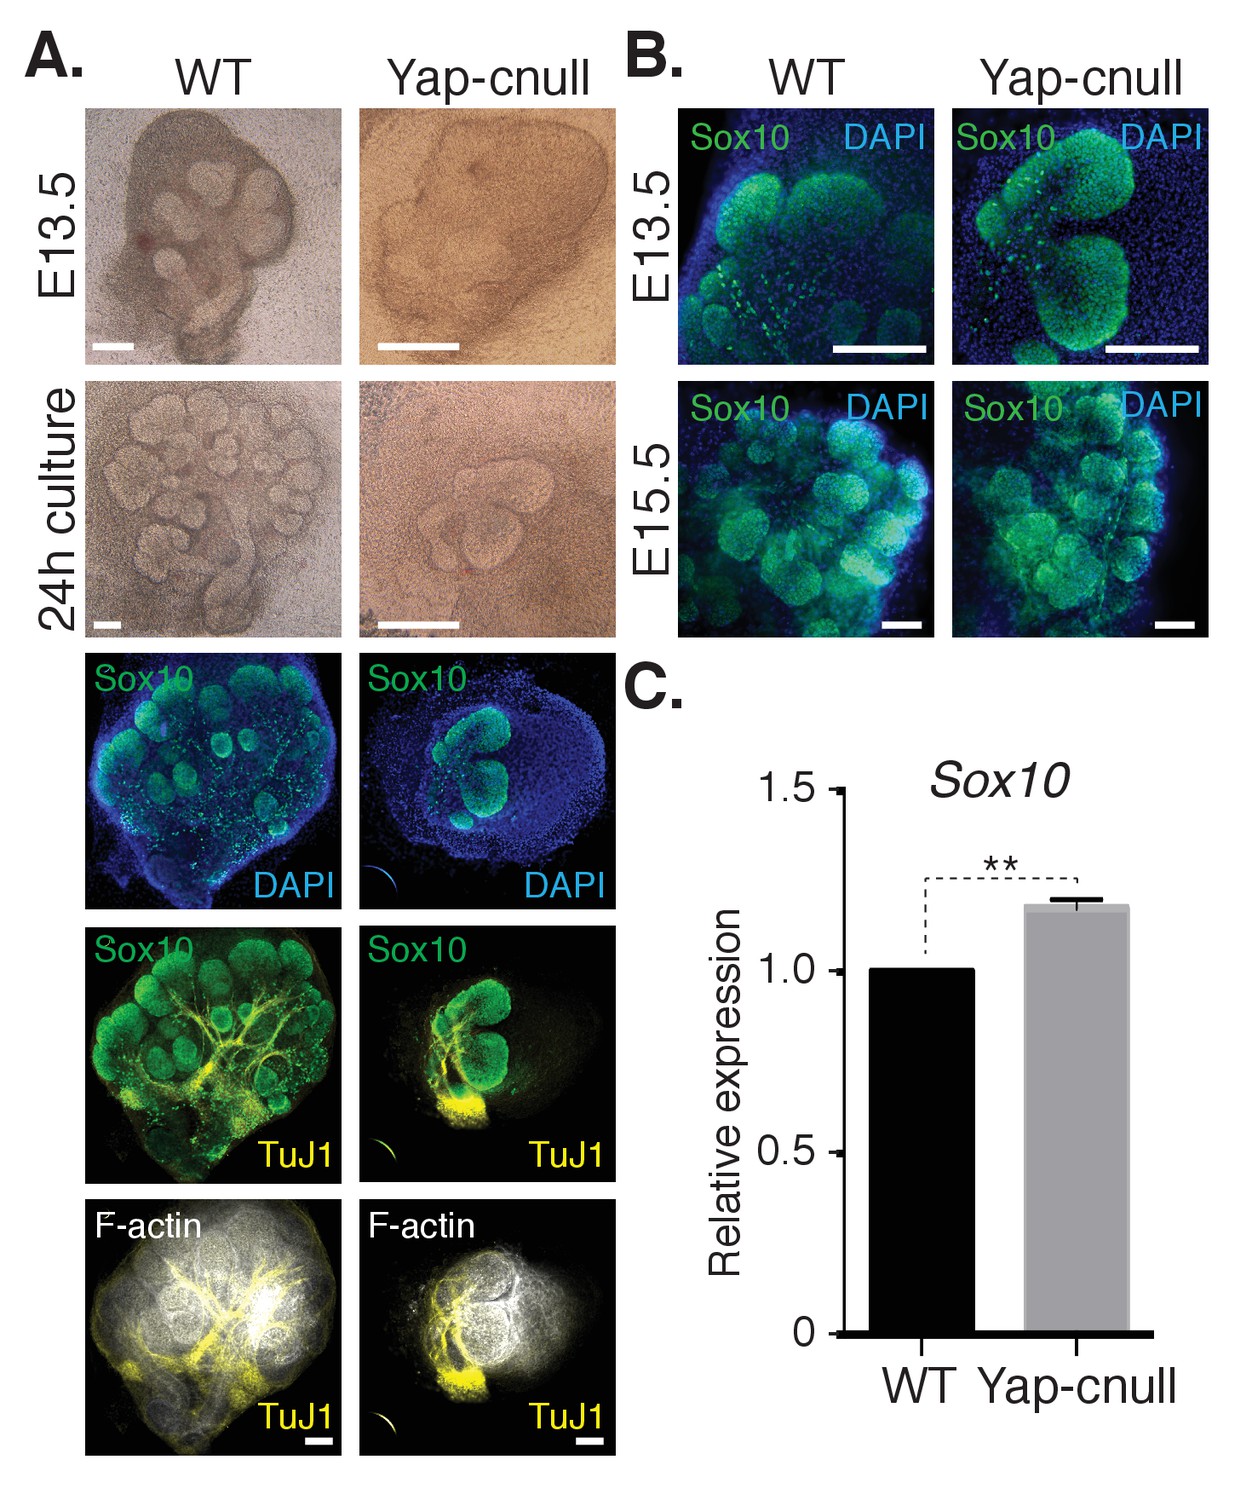
A relative increase in the number of cells expressing the bud marker Sox10 is observed in Yap-cnull SMGs.
E13.5 WT and Yap-cnull SMGs were dissected and cultured for 24 hr ex vivo and then examined by microscopy. (A) Phase-contrast images were taken of E13.5 WT and Yap-cnull SMGs at the time of dissection and 24 hr after culture. The same SMGs (each column is one SMG) were analyzed by IF for Sox10 (green), TuJ1 (yellow), and F-actin (white). DAPI was used to mark the nuclei (blue). Scale = 100 µm. (B) Images from IF microscopy analysis of Sox10 in E13.5 (zoomed in from (A)) and E15.5 WT and Yap-cnull SMGs. DAPI was used to mark the nuclei (blue). Scale = 100 μm. (C) qPCR analysis of Sox10 expression in E15.5 WT and Yap-cnull SMGs. The average of three experiments is shown +S.E.M. [one sample t-test: **p<0.001]. All images represent observations made from a minimum of three biological repeats.
Figure 5

Global gene expression analysis of Yap-cnull SMGs indicates the aberrant regulation of genes encoding secreted factors and cell fate regulators.
(A) Cluster analysis of microarray-generated gene expression data from E15.5 WT vs. Yap-cnull SMGs showing genes with a > 2-fold-change and FDR q (filtered) <0.01. Red depicts increased and blue depicts decreased gene expression. Relevant genes are highlighted in blue including canonical Yap targets (Ctgf, Cyr61) as well as relevant SMG epithelial markers (Krt14, Krt5, and Kit). (B) qPCR analysis of Yap, Krt14, and Krt5 expression in E15.5 WT and Yap-cnull SMGs. The average of three SMGs from different litters is shown +S.E.M. (one sample t-test: ***p<0.0001). (C) DAVID pathway analysis of genes in (A) that are reduced and induced in Yap-cnull SMGs. (D) GSEA of significantly downregulated genes in Yap-cnull SMGs shows enrichment for negative regulation of cell differentiation.
-
Figure 5—source data 1
Genes differentially expressed in Yap-cnull vs WT (FDRq <0.01; fold change >2).
Differential expression analysis was performed on microarray data obtained from wild type and Yap-cnull E15.5 SMGs. Shown below are genes with a FDRq < 0.01 that exhibit a fold change of twofold or greater when data from Yap-cnull was compared wild type SMGs. Genes showing reduced expression in the Yap-cnull vs. WT (DOWN) are shown in the left two columns, and genes showing increased expression in the Yap-cnull vs. WT (UP) are shown in the right two columns.
- https://doi.org/10.7554/eLife.23499.008
-
Figure 5—source data 2
Gene Set Enrichment Analysis (GSEA) of genes differentially expressed in Yap-null versus WT SMGs.
GSEA (version 2.2.1) was used to identify biological terms, pathways and processes that are coordinately up- or down-regulated within each pairwise comparison. The Entrez Gene identifiers of the human homologs of the genes interrogated by the array were ranked according to the t statistic computed between the Yap-cnull and wild-type groups. Mouse genes with multiple human homologs (or vice versa) were removed prior to ranking, so that the ranked list represents only those human genes that match exactly one mouse gene. This ranked list was then used to perform pre-ranked GSEA analyses (default parameters with random seed 1234) using the Entrez Gene versions of the Hallmark, Biocarta, KEGG, Reactome, Gene Ontology (GO), and transcription factor and microRNA motif gene sets obtained from the Molecular Signatures Database (MSigDB), version 5.0.
- https://doi.org/10.7554/eLife.23499.009
Figure 6
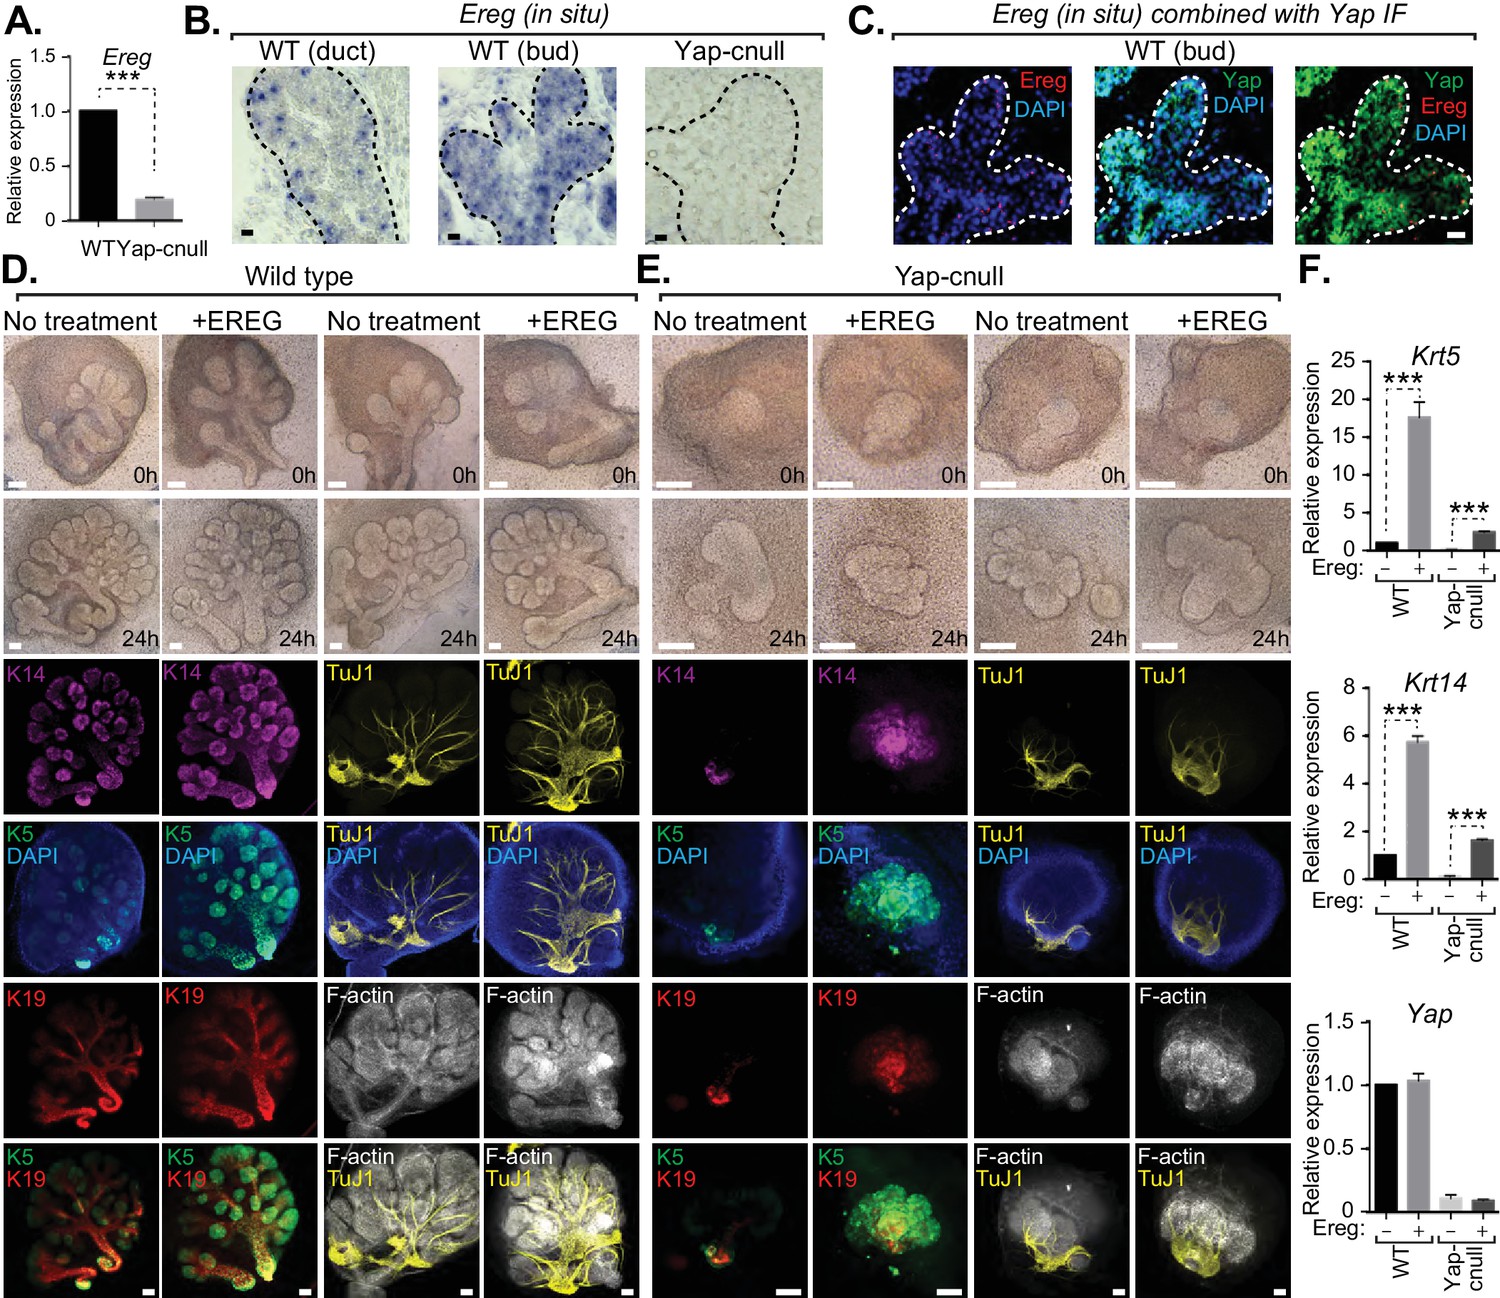
Yap-induced Epiregulin (Ereg) expression directs ductal progenitor specification.
(A) qPCR analysis of Ereg expression in E15.5 WT vs. Yap-cnull SMGs. The average of three SMGs from different litters is shown +S.E.M. [one sample t-test: ***p<0.0001]. (B) In situ hybridization of Ereg mRNA in E13.5 WT (duct and bud) and Yap-cnull (bud) SMGs. (C) Combined in situ hybridization for Ereg mRNA (red) and IF for Yap (green) in E13.5 WT SMGs. (D,E) E13.5 WT and Yap-cnull SMGs were dissected and cultured for 24 hr in the presence or absence of 0.5 μg/mL of exogenous Ereg protein and analyzed by phase-contrast and IF for Krt14 (K14, magenta), Krt5 (K5, green), Krt19 (K19, red), TuJ1 (yellow), and F-actin (white, Phalloidin). DAPI was used to mark the nuclei (blue). Scale = 100 μm. (F) qPCR analysis of Yap, Krt5, and Krt14 expression in the conditions of (D) and (E). The average of three SMGs from different litters is shown +S.E.M. [one sample t-test: ***p<0.0001]. All images represent observations made from a minimum of three biological repeats.
Figure 7
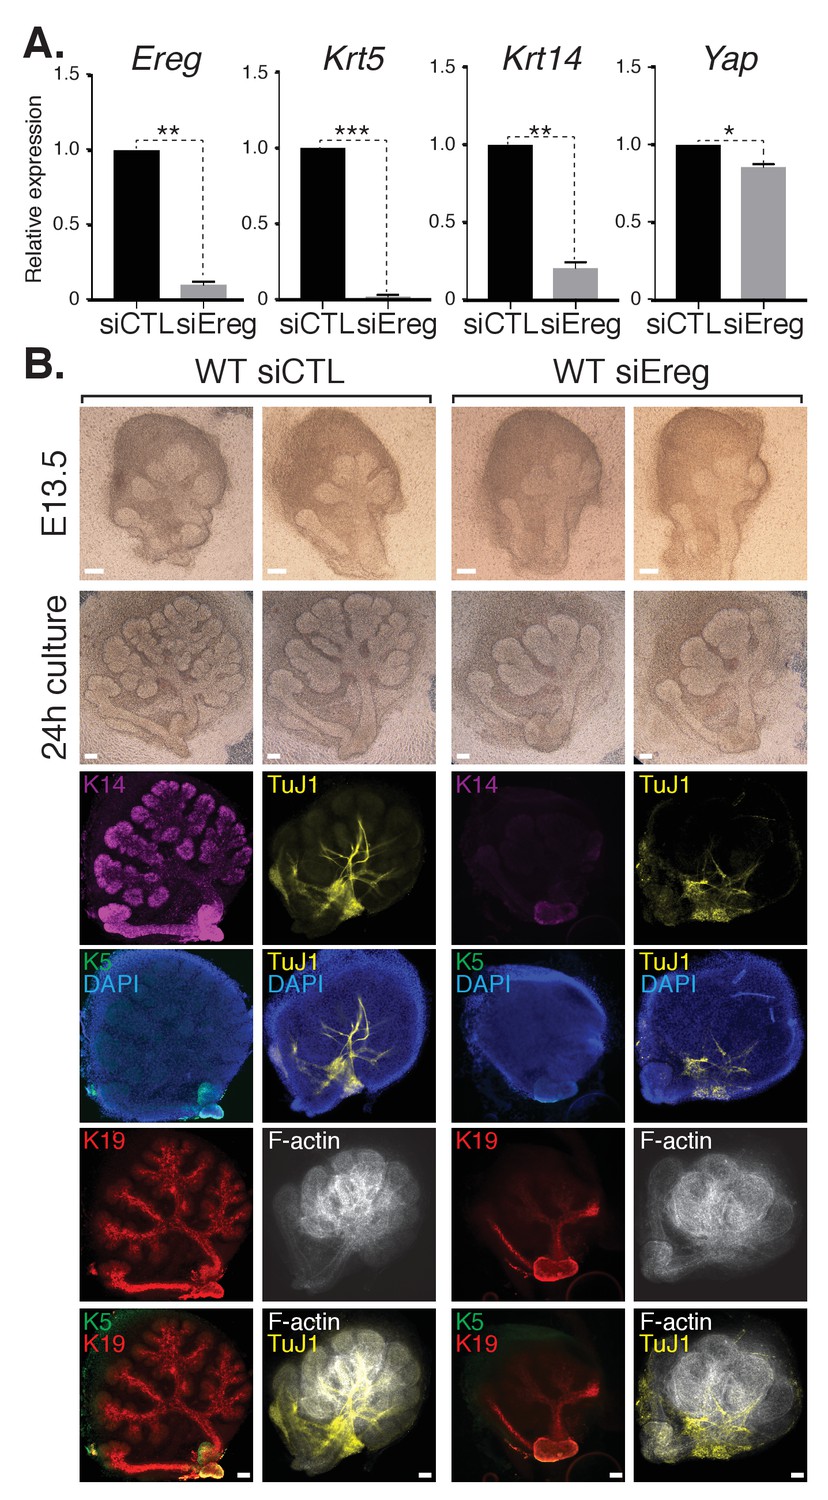
Epiregulin knockdown results in the loss of Krt5- and Krt14-positive ductal progenitors accompanied by a disruption of SMG branching.
(A) qPCR analysis of Ereg, Krt5, Krt14, and Yap expression in E13.5 WT SMGs treated with control siRNA or siRNA targeting Ereg. The average of three SMGs from different litters is shown +S.E.M. [one sample t-test: *p<0.01, **p<0.001, ***p<0.0001]. (B) E13.5 WT SMGs were dissected and cultured for 24 hr in the presence of control siRNA or Epiregulin siRNA and analyzed by phase-contrast and IF for Krt14 (K14, magenta), Krt5 (K5, green), Krt19 (K19, red), TuJ1 (yellow), and F-actin (white, Phalloidin). DAPI was used to mark the nuclei (blue). Scale = 100 μm. All images represent observations made from a minimum of three biological repeats.
Figure 8
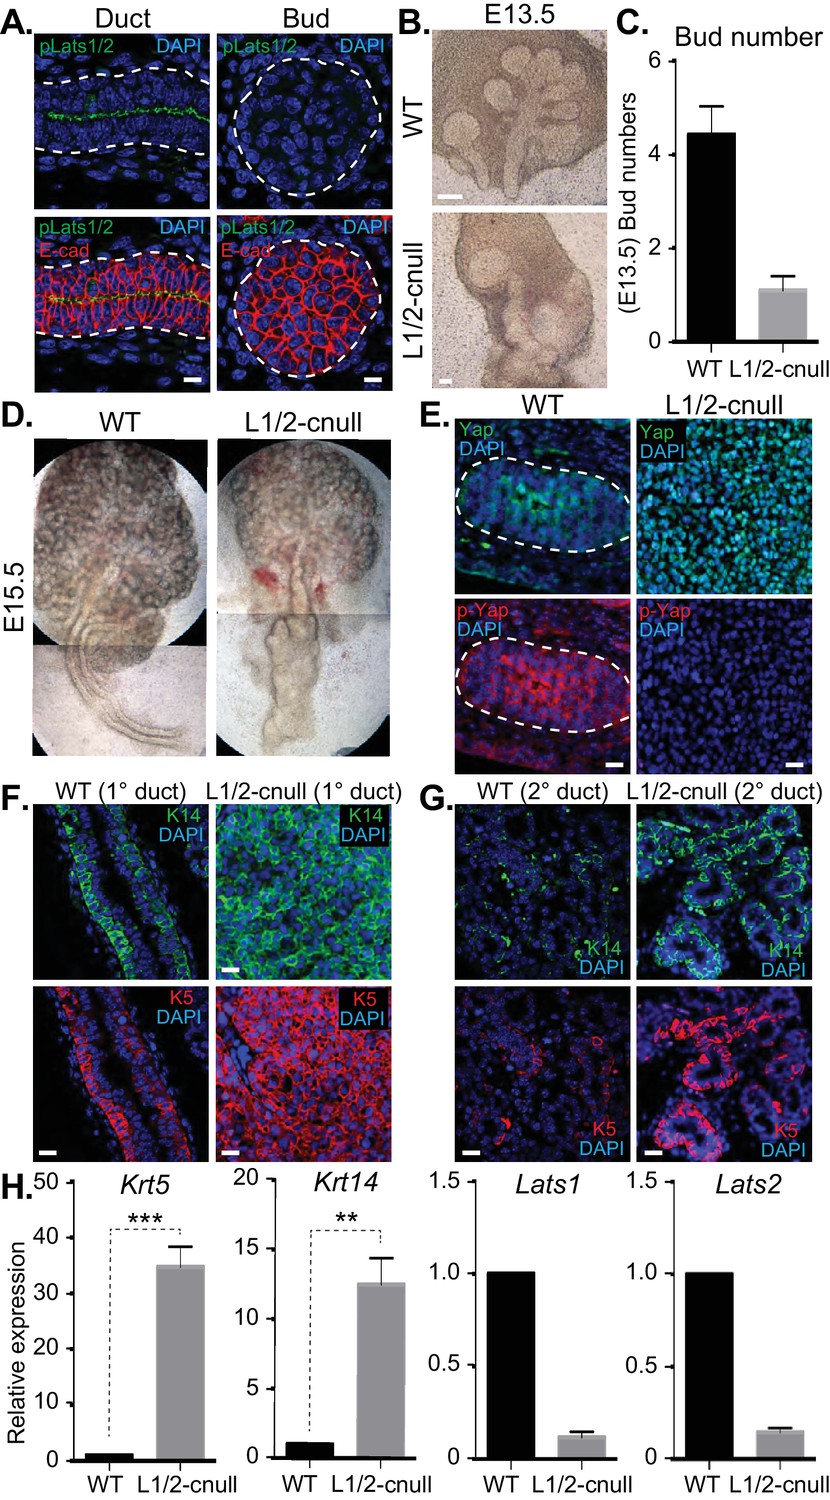
Deletion of Lats1/2 in developing SMG epithelium leads to aberrant nuclear Yap localization and severe branching morphogenesis and patterning defects.
(A) IF microscopy analysis of E15.5 SMGs for phospho-Lats1/2 (green) and E-cadherin (red), indicating active Lats1/2 in luminal cells of the ductal epithelium. Scale = 10 µm. (B) Phase-contrast images of E13.5 WT and Shh-Cre-Lats1/2 null (Lats1/2-cnull) SMGs. Scale = 100 μm (C) Quantitation of bud number from E13.5 WT and Lats1/2-cnull SMGs. n = 21. (D) Phase-contrast images of E15.5 WT and Lats1/2-cnull SMGs highlighting the severe ductal expansion phenotype. Note that each respective image is stitched together from two images. (E) Images from IF microscopy analysis of E15.5 WT and Lats1/2-cnull SMGs for Yap (green), phospho-S112 Yap (red), and DAPI (blue). Scale = 10 µm. (F) Images from IF microscopy analysis of E15.5 WT and Lats1/2-cnull primary/major (1°) ducts for Krt14 (K14, green) and Krt5 (K5, red). Scale = 10 µm. (G) Images from IF microscopy analysis of E15.5 WT and Lats1/2-cnull minor (2°) ducts for Krt14 (K14, green) and Krt5 (K5, red). Scale = 10 µm. (H) qPCR analysis of Lats1, Lats2, Krt5, and Krt14 expression in E15.5 WT vs. Lats1/2-cnull SMGs. The average of three experiments is shown +S.E.M. [one sample t-test: **p<0.001; ***p<0.0001]. All images represent observations made from a minimum of three biological repeats.
Figure 9
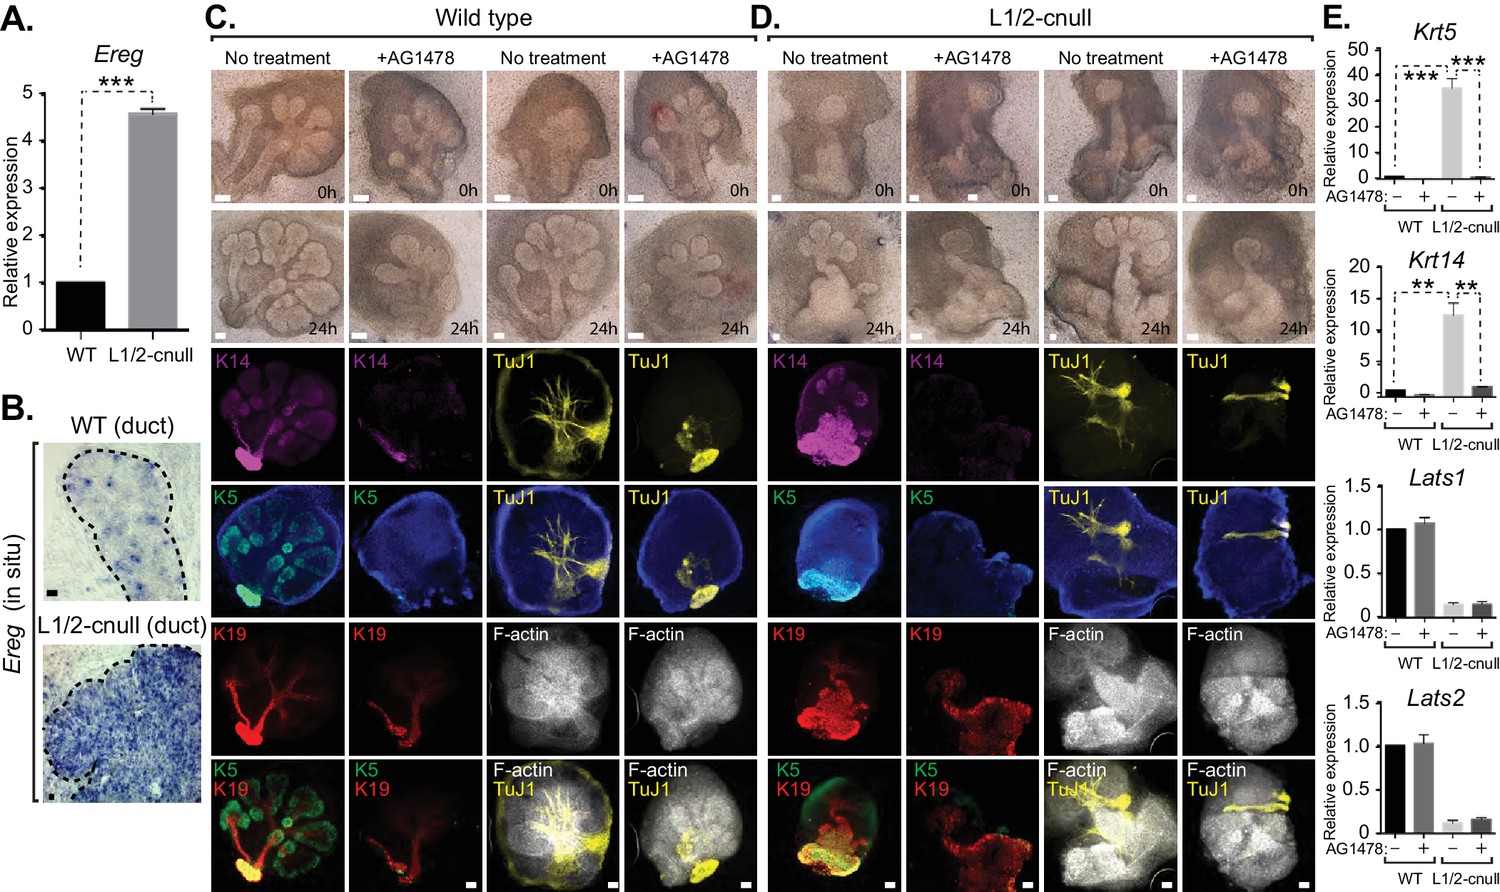
EGFR inhibition blunts the patterning defects observed in Lats1/2-cnull SMG epithelium.
(A) qPCR validation of Ereg expression levels in E15.5 WT vs. Lats1/2-cnull SMGs. The average of three experiments is shown +S.E.M. [one sample t-test: ***p<0.0001]. (B) In situ hybridization of Ereg mRNA in E13.5 WT and Lats1/2-cnull SMGs. (C,D) E13.5 WT and Lats1/2-cnull SMGs were dissected and cultured for 24 hr in the presence or absence of 10 μM EGFR inhibitor AG-1478 and analyzed by phase-contrast and IF for Krt14 (K14, magenta), Krt5 (K5, green), Krt19 (K19, red), TuJ1 (yellow), and F-actin (white, Phalloidin). DAPI was used to mark the nuclei (blue). Scale = 100 μm. (E) qPCR analysis of Lats1, Lats2, Krt14, and Krt5 expression in the conditions of (C) and (D). The average of three experiments is shown +S.E.M. [one sample t-test: **p<0.001; ***p<0.0001]. All images represent observations made from a minimum of three biological repeats.
Figure 10
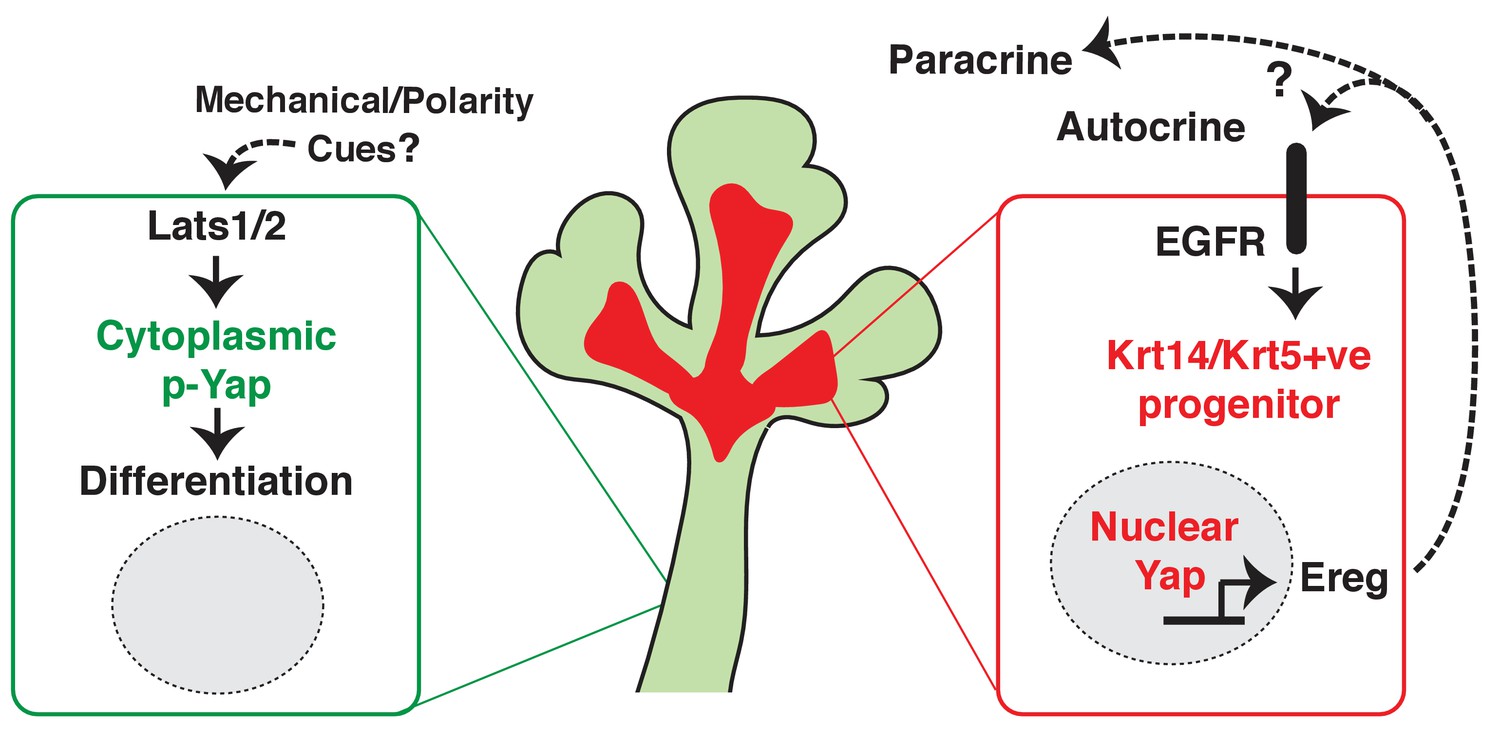
Illustration depicting the roles of Yap in submandibular gland epithelial development.
We propose nuclear Yap specifies the identity of ductal progenitors, in part by promoting the expression of Ereg and subsequent activation of EGFR signaling. Activated Lats1/2 in the maturing ductal structures promotes the phosphorylation of Yap, which directs the removal of nuclear Yap to support ductal epithelial differentiation.
Tables
Table 1
qPCR primer sequences.
| Target | Direction | Sequence | Product size |
|---|---|---|---|
| GAPDH | Forward | TGTTCCTACCCCCAATGTGT | 137 bp |
| GAPDH | Reverse | GGTCCTCAGTGTAGCCCAAG | 137 bp |
| Yap | Forward | AATGTGGACCTTGGCACACT | 106 bp |
| Yap | Reverse | ACTCCACGTCCAAGATTTCG | 106 bp |
| Lats1 | Forward | GCGATGTCTAGCCCATTCTC | 135 bp |
| Lats1 | Reverse | GGTTGTCCCACCAACATTTC | 135 bp |
| Lats2 | Forward | ACAGAGACGCAGCTGAAGGT | 101 bp |
| Lats2 | Reverse | CACAGCTTCGTGATGAGGTC | 101 bp |
| Krt5 | Forward | GGAGCAGATCAAGACCCTCA | 145 bp |
| Krt5 | Reverse | CGGATCCAGGTTCTGCTTTA | 145 bp |
| Krt14 | Forward | AGCGGCAAGAGTGAGATTTCT | 106 bp |
| Krt14 | Reverse | CCTCCAGGTTATTCTCCAGGG | 106 bp |
| Sox10 | Forward | GACCAGTACCCTCACCTCCA | 83 bp |
| Sox10 | Reverse | CGCTTGTCACTTTCGTTCAG | 83 bp |
| Ereg | Forward | TTCTCATCATAACCGCTGGA | 102 bp |
| Ereg | Reverse | CCCCTGAGGTCACTCTCTCA | 102 bp |
Table 2
Antibodies used.
| Antigen | Species | Company | Cat# | Dilution | Lot# |
|---|---|---|---|---|---|
| Yap | Mouse | Santa Cruz | 101199 | 1/100 | B2713 and A0512 |
| Yap | Rabbit | CST | D8H1X | 1/100 | 1 |
| Phospho-Yap | Rabbit | CST | 13008S | 1/100 | 1 and 2 |
| Phospho-LATS1/2 | Rabbit | Assay Bio Tech | A8125 | 1/100 | 118125 |
| Krt5 | Chicken | Biolegend | 905901 | 1/300 | D16CF00791 |
| Krt5 | Rabbit | Biolegend | 905501 | 1/300 | D15LF02531 |
| Krt14 | Mouse | abcam | ab7800 | 1/100 | GR185613-1 |
| Krt19 | Rat | DSHB | TROMA-III-c | 1/100 | 11/12/2015 |
| Sox10 | Goat | Santa Cruz | 17342 | 1/100 | F0315 |
| TuJ1 | Mouse | R and D Systems | BAM1195 | 1/500 | HVS0215121 |
| Phalloidin | n/a | Alexa Fluor | A22287 | 1/1000 | 866764 |
| Krt8 | Rat | DSHB | TROMA-1-c | 1/500 | 12/31/2014 |
| Ki-67 | Mouse | BD | 550609 | 1/100 | 67176 |
| Ki-67 | Rabbit | abcam | ab16667 | 1/100 | GR86024-1 |
| PCNA | Mouse | CST | 2586P | 1/100 | 5 |
| Cleaved Caspase 3 | Rabbit | CST | 9661S | 1/100 | 43 |
Download links
A two-part list of links to download the article, or parts of the article, in various formats.
Downloads (link to download the article as PDF)
Open citations (links to open the citations from this article in various online reference manager services)
Cite this article (links to download the citations from this article in formats compatible with various reference manager tools)
The Hippo pathway effector YAP is an essential regulator of ductal progenitor patterning in the mouse submandibular gland
eLife 6:e23499.
https://doi.org/10.7554/eLife.23499


