Cortex-dependent recovery of unassisted hindlimb locomotion after complete spinal cord injury in adult rats
- Drexel University, United States
- Hospital Universitario HM Puerta del Sur, Universidad CEU-San Pablo, Spain
- Hospital Nacional de Parapléjicos, Servicio de Salud de Castilla-La Mancha, Spain
- University of California, United States
Figures
Figure 1 with 2 supplements
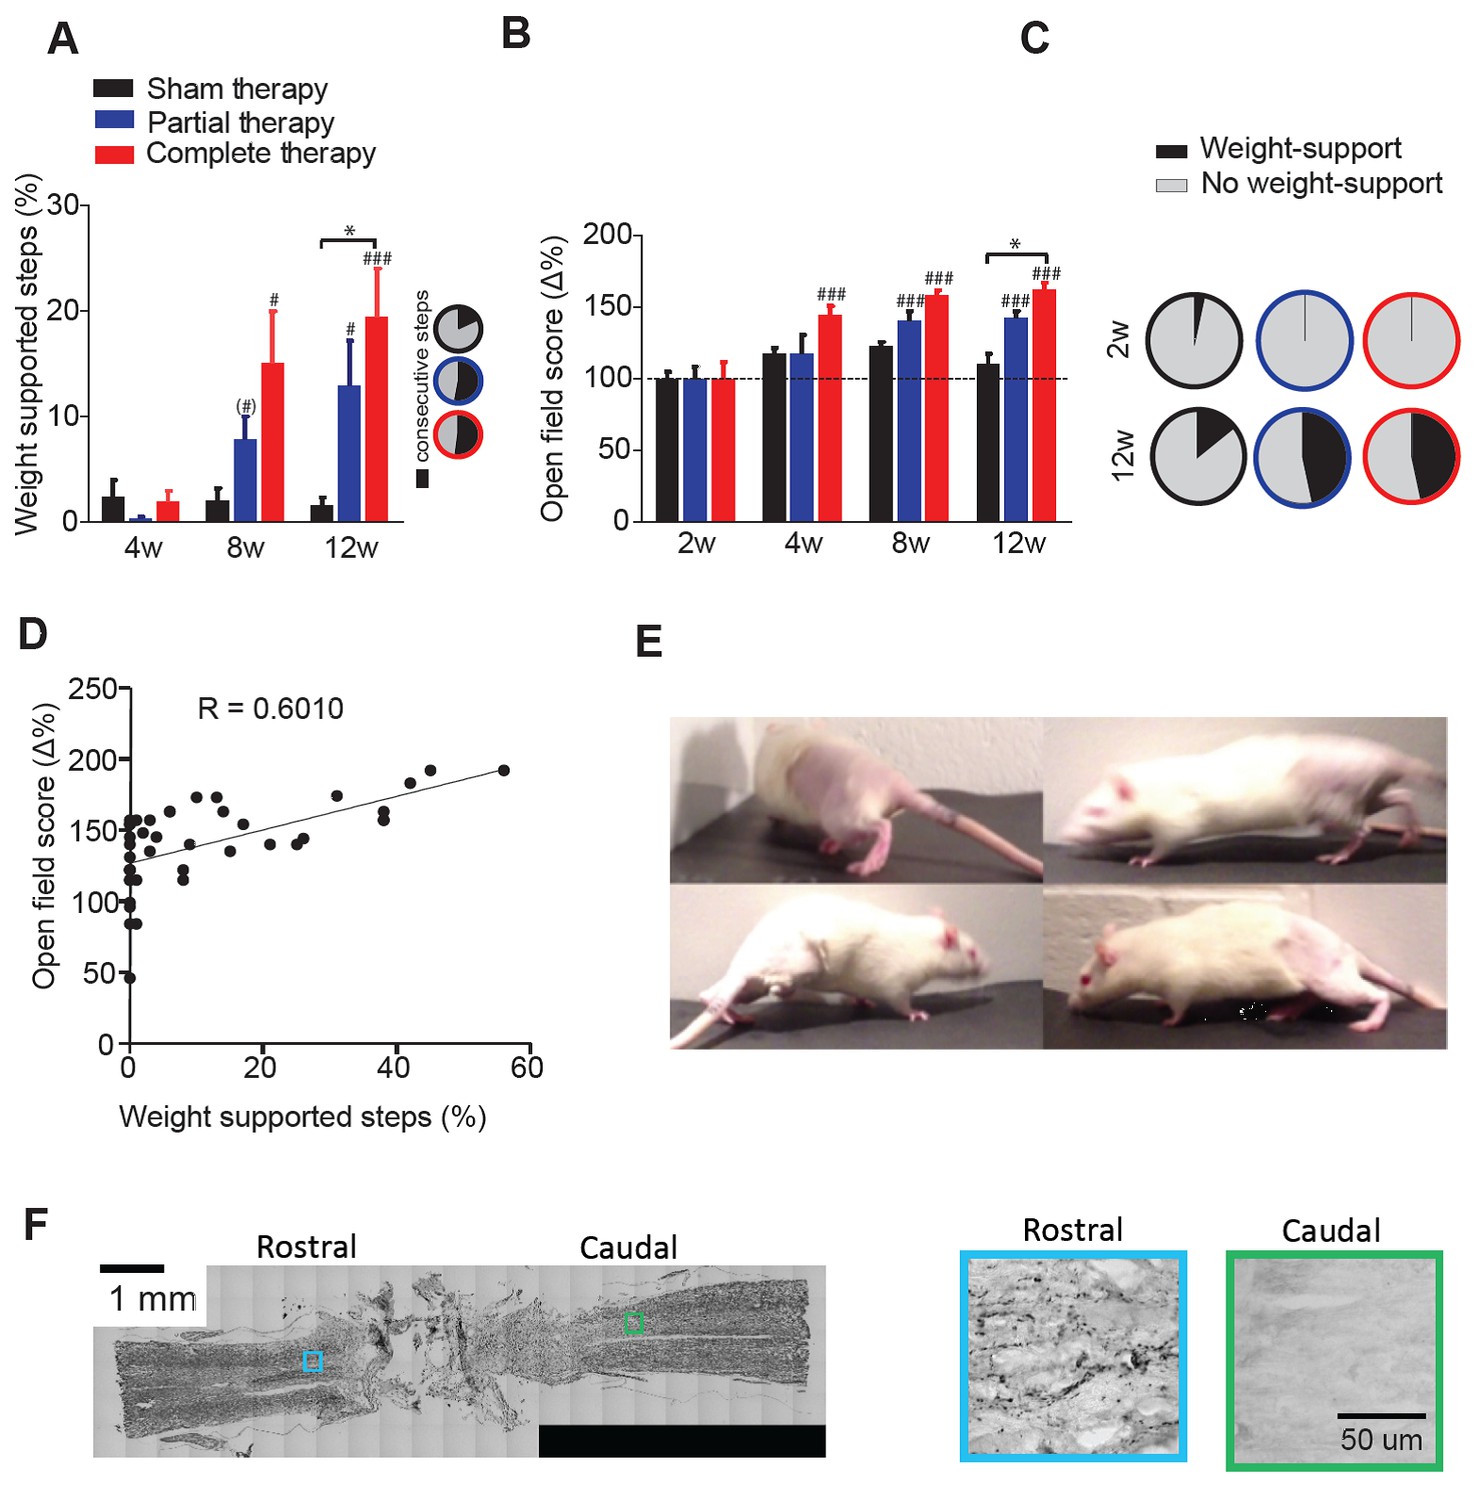
Locomotor recovery after a complete spinal cord injury.
(A) Percentage of weight supported step cycles (% WSS) during treadmill locomotion for complete therapy (red), partial therapy (blue) and sham therapy (black) groups at 4, 8 and 12 weeks post-injury. Pie charts indicating the fraction of these weight supported steps that were part of a consecutive bout of three or more step cycles for each group (right panel inset, black: percentage of consecutive steps, grey: nonconsecutive steps). (B) Open field score measured by the BBB scale, expressed as % change from baseline at 2 weeks post injury. (C) Pie charts showing the proportion of BBB scores that correspond to weight support in the hindlimbs during unassisted open field locomotion (≥9) at 2 weeks (top panel) and 12 weeks (bottom panel). (D) Correlation between the open field score and %WSS at 12 weeks after injury. (E) Example frames of a spinalized rat after 12 weeks of complete therapy taking plantar weight supported steps with its hindlimbs in the open field. (F) Histological verification of complete spinal transection using Nissl stain (left) of a horizontal section of the spinal cord. 5-HT stain (right) of a rostral and caudal location taken from a slice adjacent to the Nissl stained slice on the left. Boxes represent the approximate location of the higher magnification picture of 5-HT stain. # represents differences from week 2 or 4 and * represents differences within the same week. (*) p<0.1, *p<0.05, **p<0.01, ***p<0.001. Error bars indicate 95% confidence intervals.
Figure 1—figure supplement 1
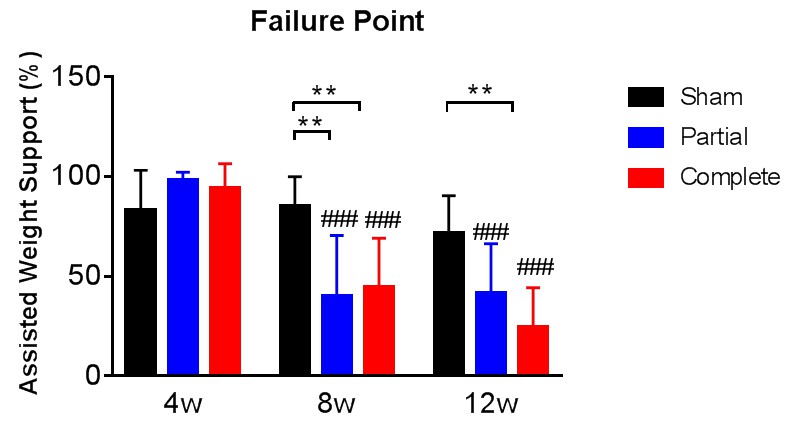
Assisted weight support provided during training.
At the start of each week of treadmill training the amount of the animal’s body weight that was supported by the device was adjusted to optimize stepping abilities. The animals failed to step below a certain level of body weight support and this was defined as their failure point for that week. The failure point was evaluated also in animals that received sham therapy or partial therapy. The graph tracks the failure point at 4, 8 and 12 weeks after the spinal cord transection for all three groups, expressed as % of the assisted weight support provided by the device when the animals could not bear any weight with their hindlimbs at 2 weeks after the spinal cord transection (y-axis). # represents differences from week four and * represents differences within the same week *p<0.05, **p<0.01, ***p<0.001, Tukey post-hoc tests after significant time x therapy interaction of 2-way mixed ANOVA (F(4,72)=4.2, p=0.0009). Note that we obtained failure point data for 12 sham-therapy, 12 partial-therapy and 15 complete-therapy animals. Error bars indicate 95% confidence intervals. The assisted weight support at failure point decreased with partial and complete therapy as a function of time after the spinal transection, providing direct evidence of increasing levels of weight support achieved by the animals.
Figure 1—figure supplement 2
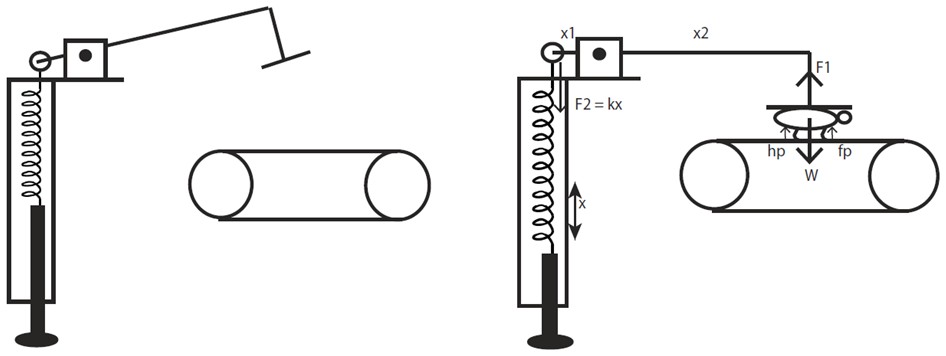
A schematic representation of the body weight support device that was used during treadmill training.
The device is a spring-mass system adapted for quadrupedal locomotion from Timoszyk et al. (2005), which introduced a similar device for bipedal locomotion. The forces acting on the device are briefly illustrated in the diagram for visualization. When the horizontal arm is parallel to the ground the moments acting around the pivot point are balanced. The device is calibrated a priori and periodically using weights to determine the amount of spring extension required for providing a fixed amount of vertical weight support corresponding to a percentage of the animal’s weight. Note that during locomotion when the forelimbs and hindlimbs are loaded and pushing on the treadmill there will be normal reaction forces acting on the animal (indicated as fp and hp on the figure) and the exact amount cannot be measured without additional sensors.
Figure 2 with 2 supplements
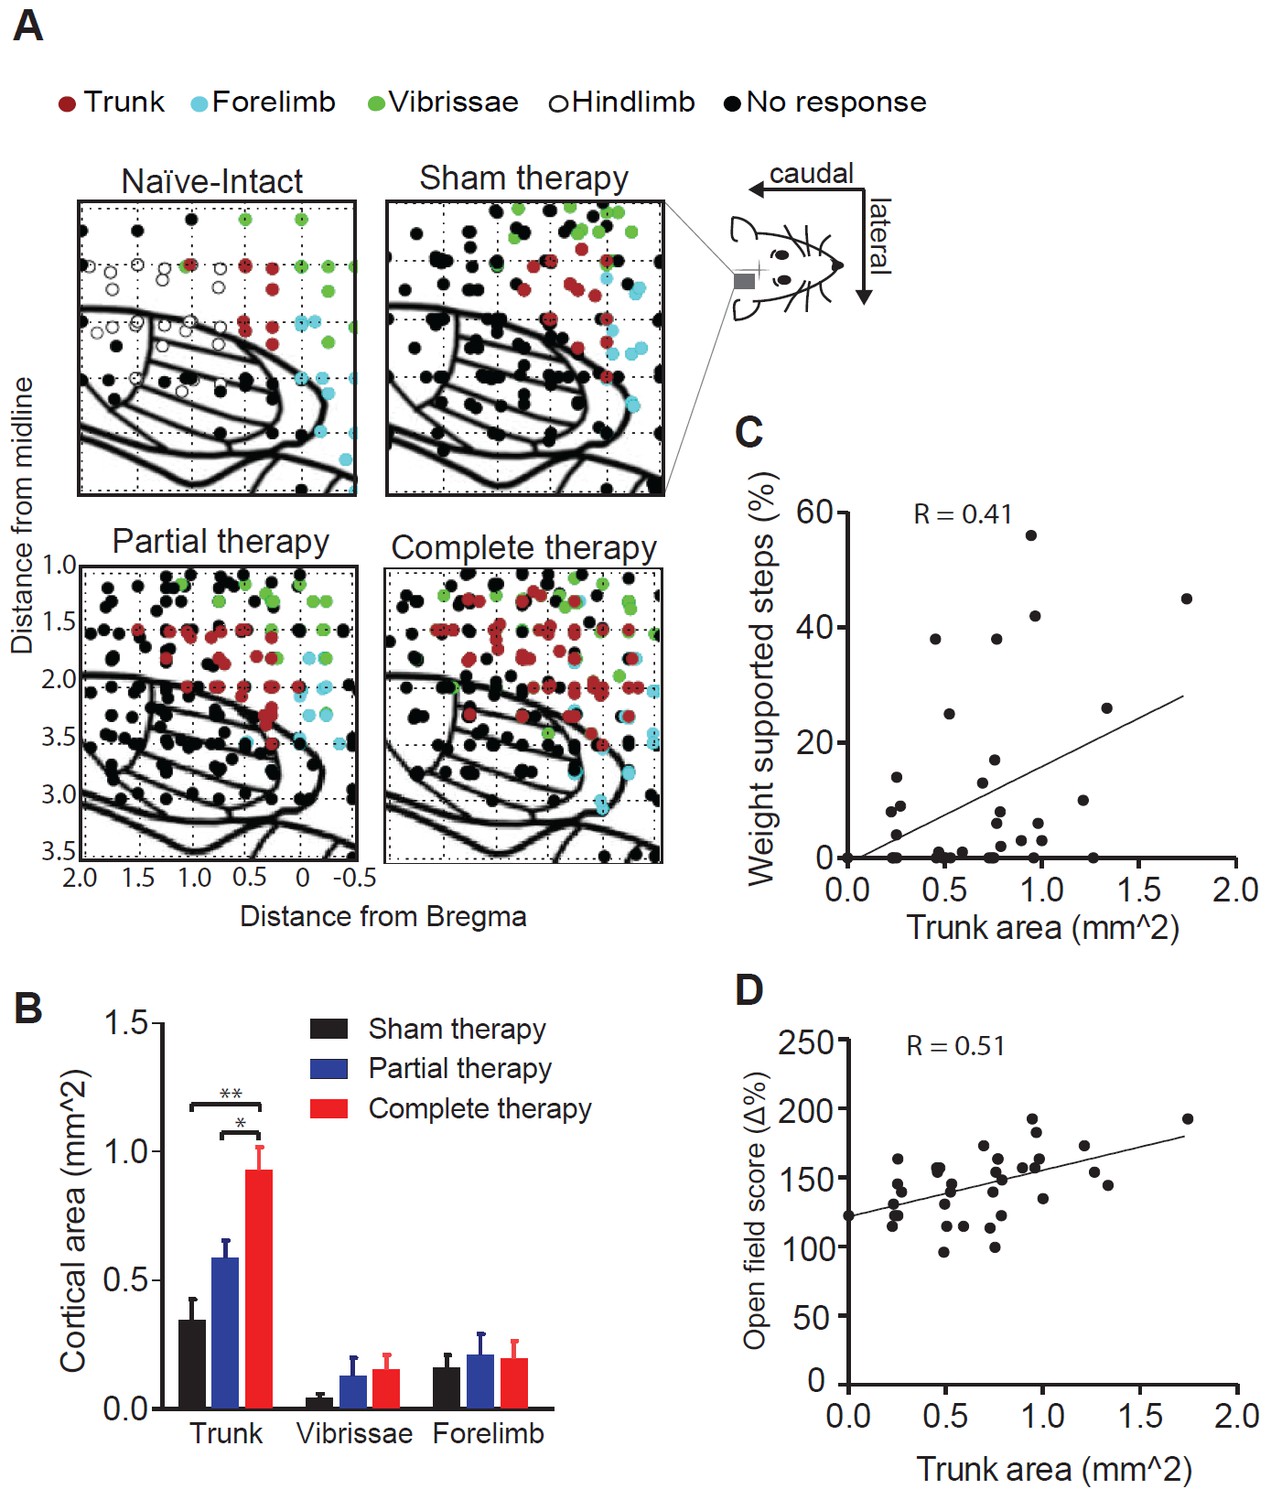
Reorganization of the motor cortex induced by combined therapeutic interventions.
(A) Raw intra-cortical micro-stimulation motor maps showing the penetrations on a cortical grid (co-ordinates AP: from 0.5 mm rostral to bregma to 2 mm posterior to bregma; ML: 1 to 3.5 mm lateral to midline) color coded by the type of movement evoked for naïve-intact, sham therapy, partial therapy and complete therapy groups. (B) Average cortical area (mm2) corresponding to a specific type of movement (trunk, forelimbs or vibrissae) for all therapy groups. Correlation between cortical area corresponding to trunk movements and locomotor recovery measured by (C) % WSS and also (D) open field score. *p<0.05, **p<0.01. Error bars indicate 95% confidence intervals.
Figure 2—figure supplement 1
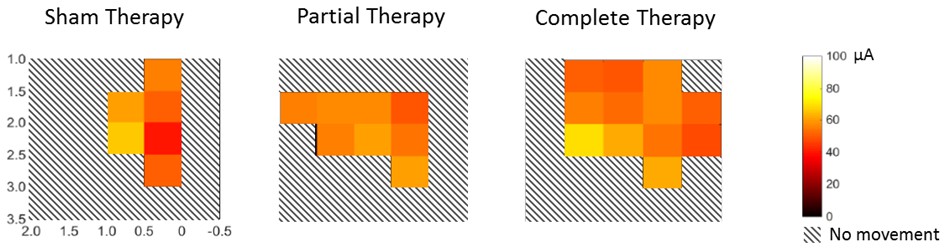
Threshold currents during intra-cortical micro-stimulation motor maps.
This figure shows the threshold currents corresponding to the trunk movements evoked during motor maps over the same cortical area shown in Figure 2A. The threshold currents were averaged for penetrations within an area of 0.25 mm2 and visualized using a heatmap over a scale of 0–100 µA. Hashed squares show areas where no penetrations yielded any movement. There were no differences between the threshold currents across the three groups (1-way ANOVA, F(2,85)=0.751, p=0.475). Note that penetrations, rather than animals, were considered as individual samples for this analysis to maximize power. The heat maps indicate an expansion of the trunk area, particularly for animals that received complete therapy, while using equivalent threshold currents across all groups.
Figure 2—figure supplement 2
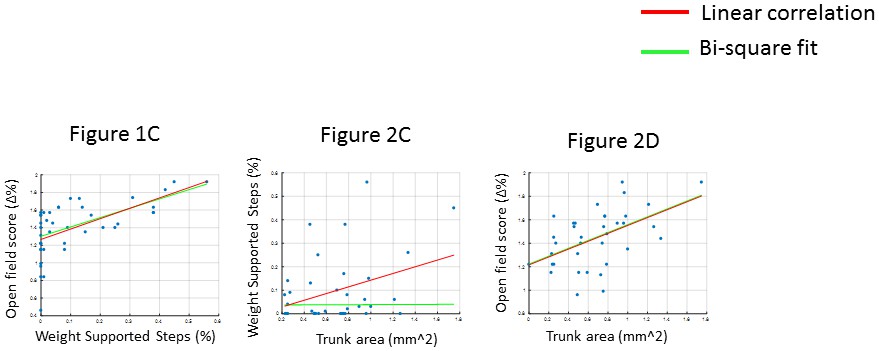
Correlation measures.
The correlations were performed both using simple linear regression measures (Pearson’s correlation, red line) and robust regression methods (Bi-square fit, green line). In the case of Figure 1C and Figure 2D, the two methods were equivalent. In the case of Figure 2C, the linear regression indicates a correlation between the measures. However the bi-square fit fails, mainly because it weights outliers with a lower value than values closer to the mean. The large variation in the data is because all the therapy groups are combined for this analysis (including animals that show no recovery as well as high perfomers). Since the high performers cannot be considered outliers for our data, we retained the linear regression values in the main figure.
Figure 3 with 1 supplement
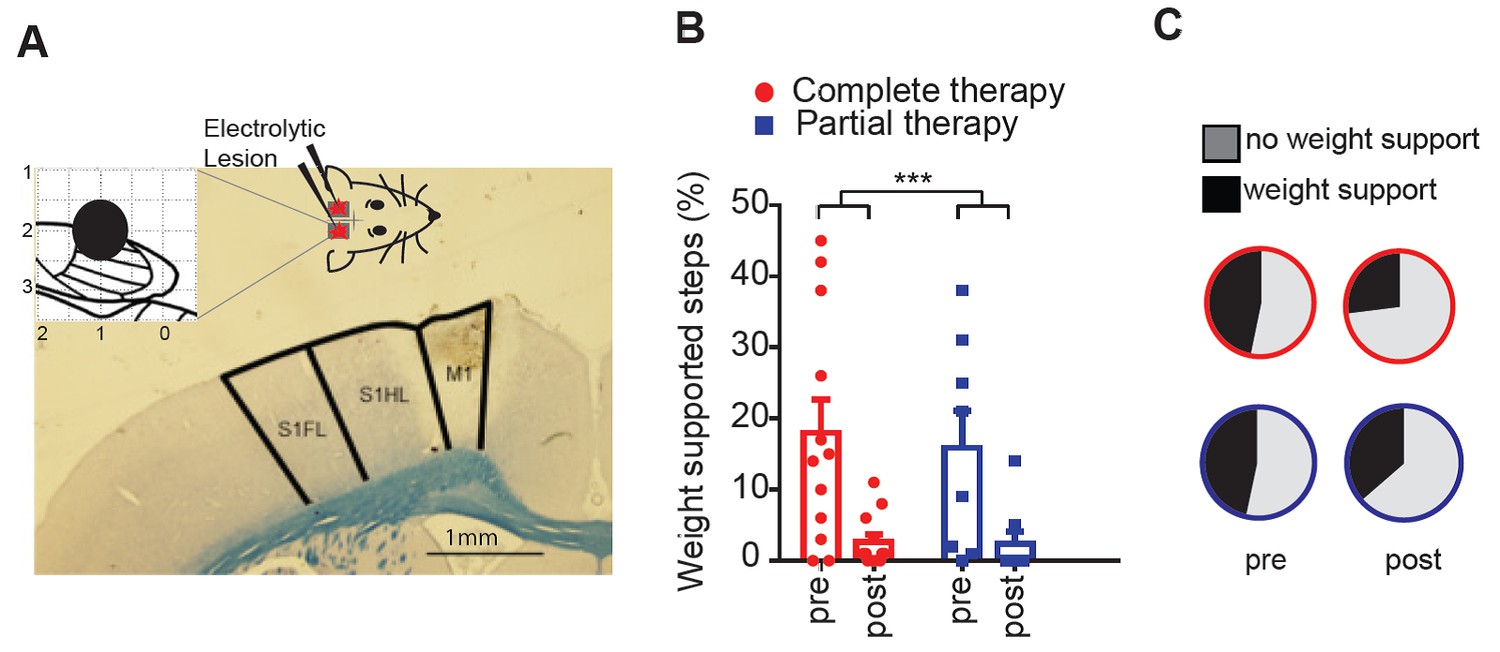
Lesioning the motor cortex reverses behavioral recovery.
(A) Photomicrograph of exemplar electrolytic lesion in the hindlimb motor cortex (inset: cortical map showing lesion location centered at 1.0 mm caudal to bregma and 2.0 mm lateral). (B) Locomotor recovery measured by %WSS during treadmill locomotion evaluated before and after (pre-, post-) lesioning the motor cortex. (C) Proportion of BBB scores that correspond to weight support in the hindlimbs during unassisted open field locomotion (≥9) before and after (pre-, post-) cortical lesions. ***p<0.001. Error bars indicate 95% confidence intervals.
Figure 3—figure supplement 1
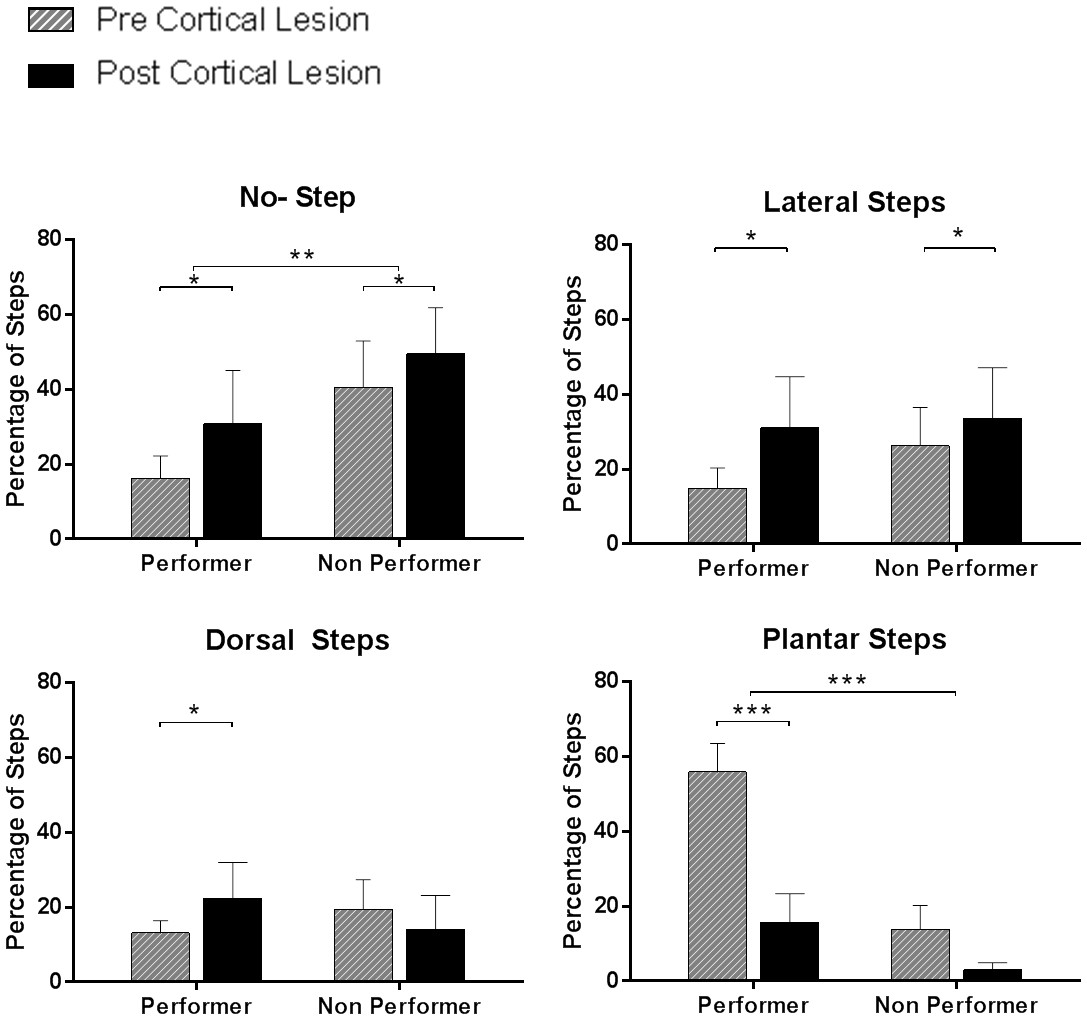
Quality of steps assessed from the videos based on individual paw placements.
We performed video analyses from the treadmill testing data in animals that subsequently received cortical lesion (complete therapy, n = 12; partial therapy, n = 10), during testing at week-12 (pre-cortical lesion) and at week-14 (post-cortical lesion). Each of the 100 step cycles used for the %WSS was categorized – separately for each hindpaw – as no step (i.e. dragging), dorsal step (when the dorsal surface of the paw makes contact with the treadmill during paw placement), lateral step (when the animal performs a lateral sweep like motion without plantar contact) or plantar step (when the plantar surface of the paw comes in contact with the treadmill entirely during paw placement). Animals were categorized in two groups based on an arbitrary recovery threshold of 10 %WSS at week-12: animals with good recovery (performer, %WSS > 10, average 28.4 ± 11.1%, n = 11) and animals with poor recovery (non-performer, %WSS ≤ 10, average 2.8 ± 3.8%, n = 11). Left and right hindpaw steps were separated as an independent factor. As expected, the percentage of no steps was lower in performers than in non-performers (3-way ANOVA, group: F(1,40)=10.1, p=0.0028) and increased after cortical lesion in both groups (lesion: F(1,40)=6.8, p=0.0129). The percentage of dorsal steps was similar in the two groups (group: F(1,40)=0.05, p=0.82), with a tendency to increase after cortical lesion in performers but not in non-performers (group x lesion: F(1,40)=5.3, p=0.0261). The percentage of lateral steps was again similar in the two groups (group: F(1,40)=1.2, p=0.28) and increased after cortical lesion in both groups (lesion: F(1,40)=6.8, p=0.0127). Finally, the percentage of plantar steps was markedly higher in performers (group: F(1,40)=95.7, p<0.0001) and significantly decreased after the lesion in performers (lesion x group: F(1,40)=19.9, p<0.0001; Tukey: p=0.0002) but not in non-performers (Tukey: p=0.11). These results clarify that the ability to make plantar contact with the treadmill during stepping is key to achieve good recovery and that the reorganized motor cortex plays a critical role in this recovery. *p<0.05, **p<0.01, ***p<0.001.
Figure 4
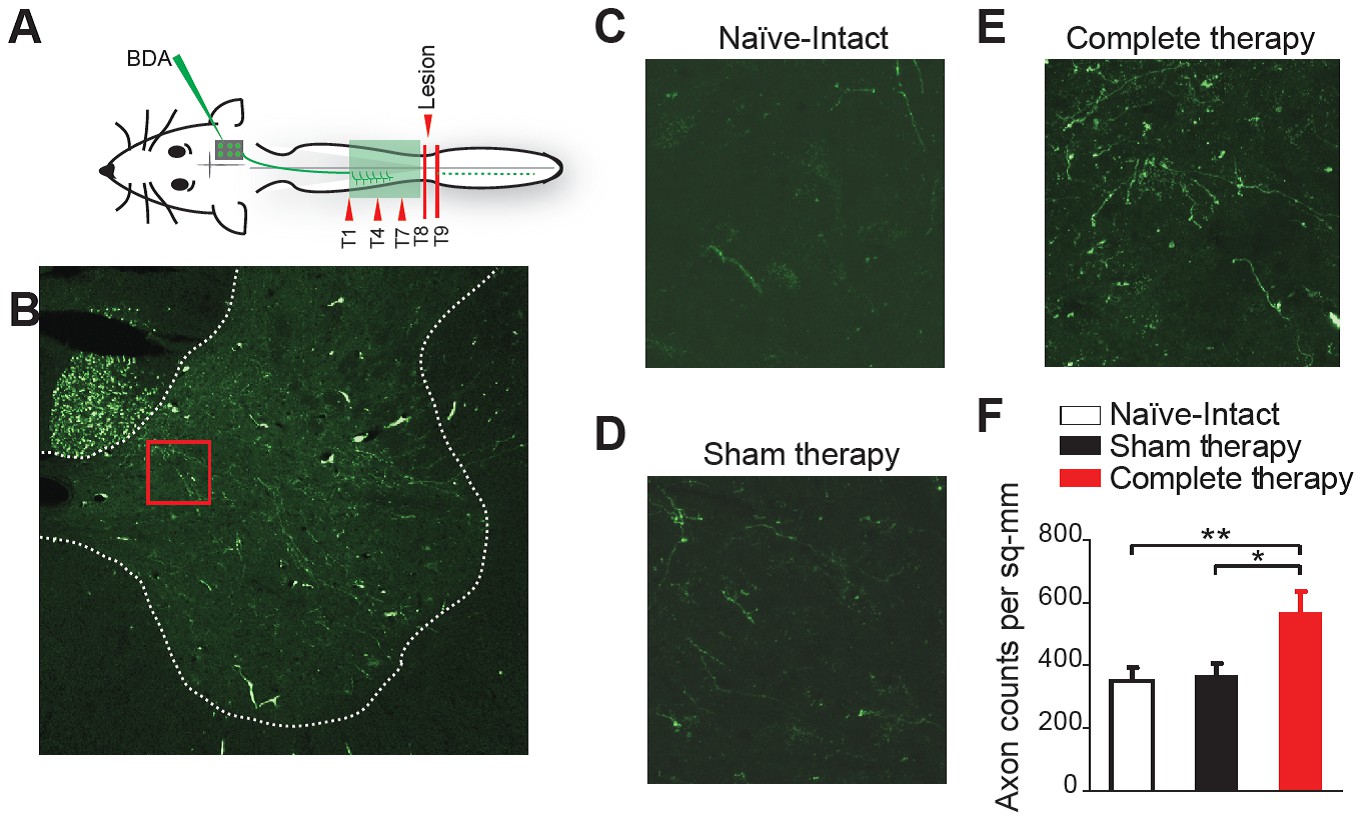
Corticospinal sprouting into the thoracic spinal cord.
(A) Diagram illustrating anterograde tracing experiments. (B) Histology of a sample coronal slice of the thoracic spinal hemi-cord taken from above the level of the spinal lesion and a magnified view of the sprouting into the grey matter in (C) Naïve-Intact (D) Sham therapy and (E) Complete therapy groups. (F) Bar graphs showing the average count of corticospinal axons sprouting per mm2 of gray matter of the spinal hemi-cord for the different groups. *p<0.05, **p<0.01. Error bars indicate 95% confidence intervals.
Figure 5 with 1 supplement
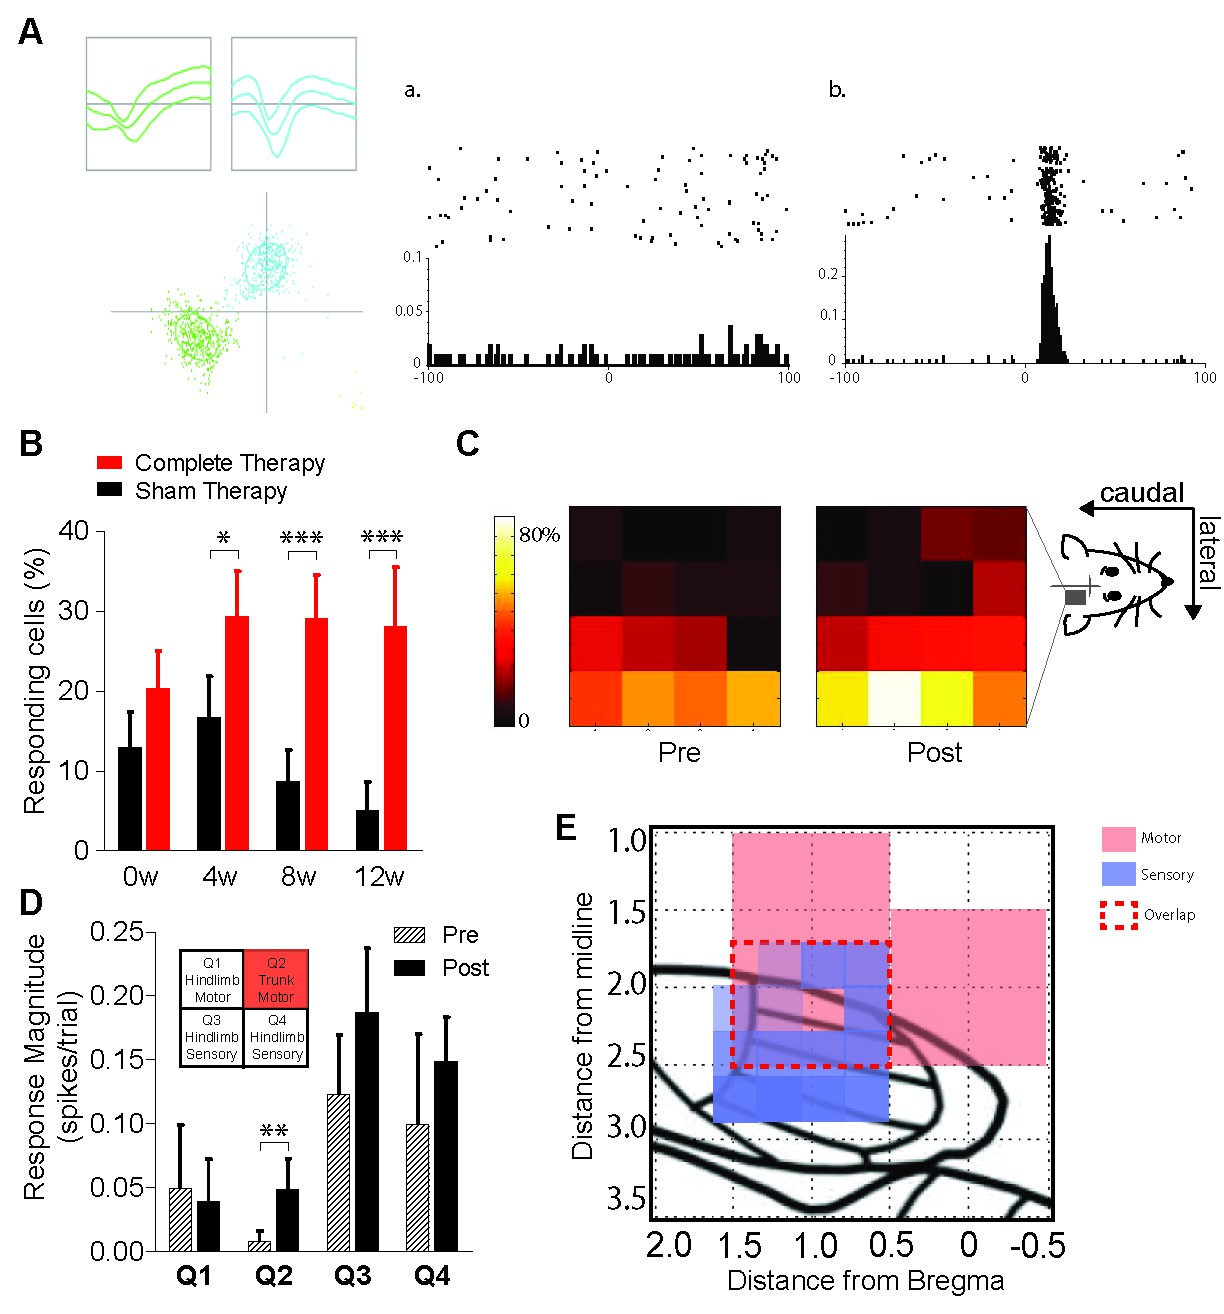
Reorganization of the hindlimb sensory cortex induced by combined therapeutic interventions.
(A) Example showing single unit discrimination using waveform-based cluster analysis (left panel) and exemplar peri-stimulus time rasters and histograms of (a) a neuron which is unresponsive to sensory stimulation and (b) a neuron showing a significant response to sensory stimulation measured in a window extending 100 ms before and after the stimulus. (B) Proportion of neurons recorded from sham therapy group (black) that had a significant response to forepaw sensory stimulation compared to that of complete therapy group (red) pre- transection (0w) and weeks 4 (4w), 8 (8w) and 12 (12w) post-transection. (C) Heat maps indicating distribution of forepaw sensory responses recorded on each of the wires of the 4 × 4 microwire electrode array implanted into the hindlimb sensorimotor cortex pre- (week 0) and post- (weeks 4, 8, 12) spinal transection. (D) Average magnitude of the neural responses to forepaw stimulation broken down into four quadrants based on the location of the electrode wire (top left inset: quadrant locations), pre- and post- spinal transection. (E) Depiction of the rat sensorimotor cortex after complete spinal transection followed by 12 weeks of combined therapies. X-axis is the rostrocaudal distance from bregma, y-axis is the mediolateral distance from bregma. Red represents expansion of motor cortex, purple represents expansion of forelimb somatosensory cortex into the deafferented hindlimb cortex. Red dashed lines represent the extent of sensorimotor overlap within the confines of our recorded regions. *p<0.05, **p<0.01, ***p<0.001. Error bars indicate 95% confidence intervals.
Figure 5—figure supplement 1

Characterization of neuronal responses to forepaw placement on the treadmill during locomotion.
The top panel shows three representative peri-stimulus time histograms (PSTHs) generated around forepaw placement on the treadmill during locomotion. Note that these responses indicate that the neurons can have very different types of responses during normal locomotion. The peak latency represents the time of the bin containing the peak of the response relative to foot placement (which occurs at time T = 0, red arrow). The bottom panel shows the spread of the peak latencies of all neurons recorded from the hindlimb sensorimotor cortex to forepaw placement during normal locomotion.
Download links
A two-part list of links to download the article, or parts of the article, in various formats.
Downloads (link to download the article as PDF)
Open citations (links to open the citations from this article in various online reference manager services)
Cite this article (links to download the citations from this article in formats compatible with various reference manager tools)
Cortex-dependent recovery of unassisted hindlimb locomotion after complete spinal cord injury in adult rats
eLife 6:e23532.
https://doi.org/10.7554/eLife.23532


