Identification of a small molecule inhibitor that stalls splicing at an early step of spliceosome activation
- Max Planck Institute for Biophysical Chemistry, Germany
- Max Planck Institute of Molecular Physiology, Germany
- University Medical Center, Germany
Figures
Figure 1 with 3 supplements
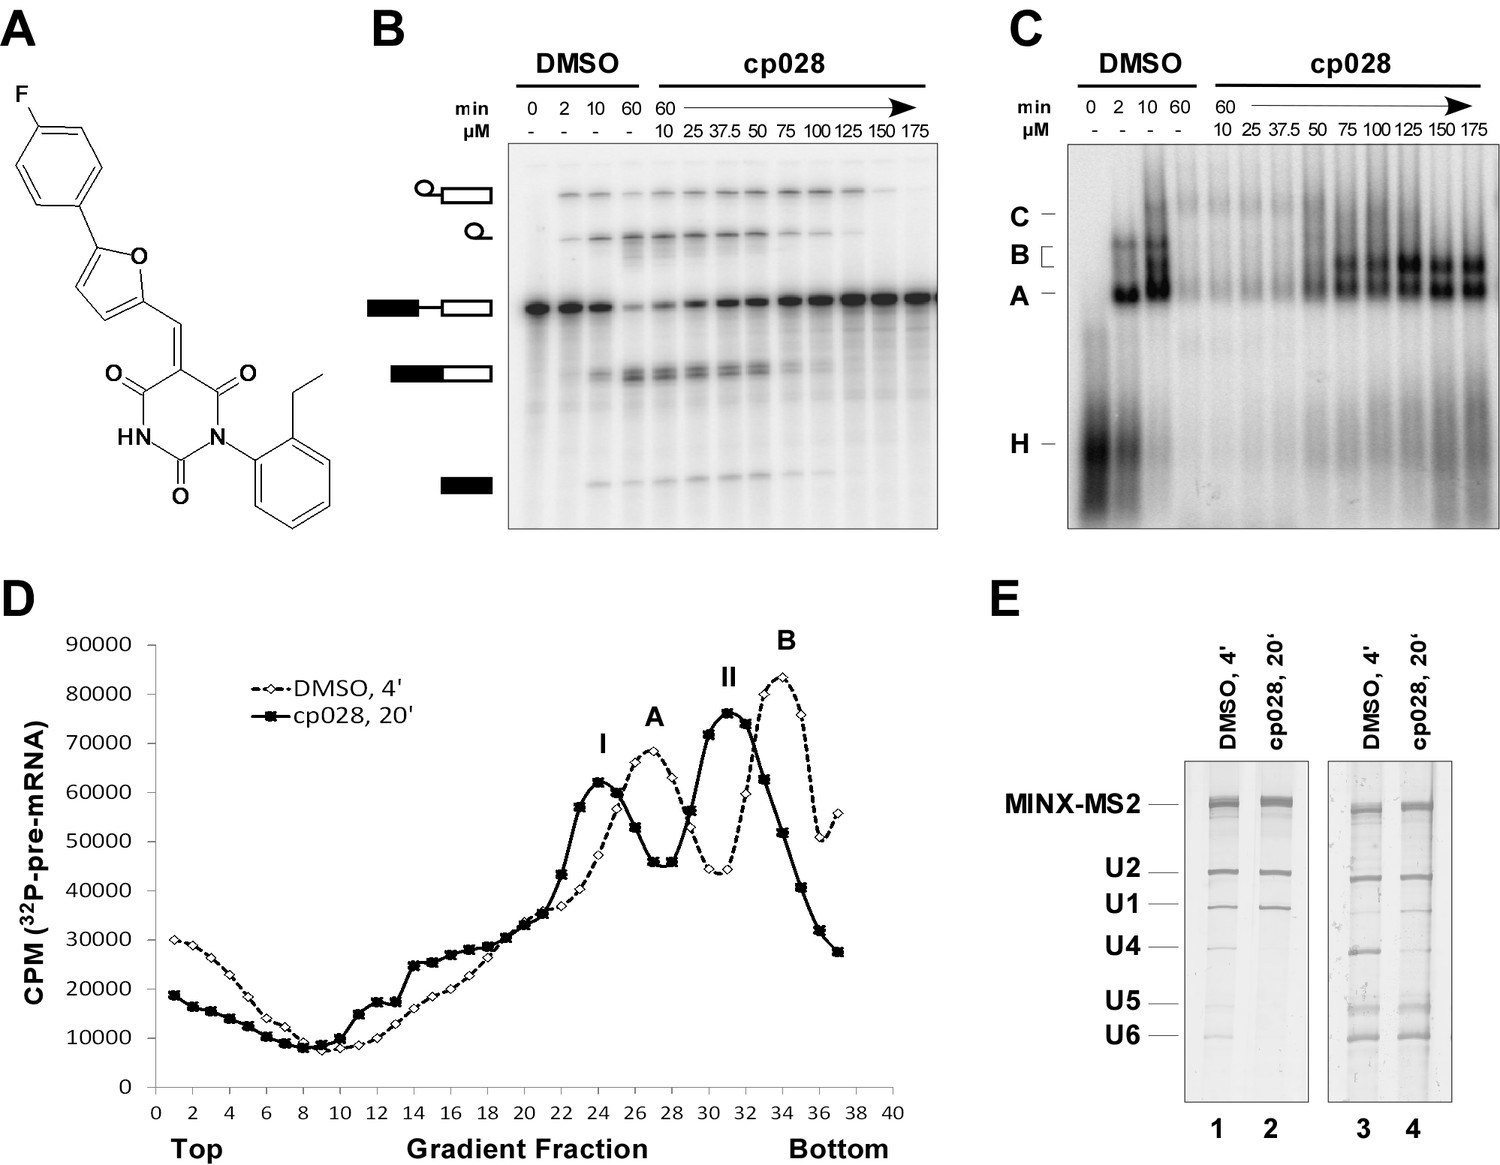
Characterization of spliceosomes that accummulate in the presence of the small molecule inhibitor cp028.
(A) Structure of compound 028 (cp028). (B, C) Splicing was performed with 32P-MINX pre-mRNA in the presence of 10–175 µM compound 028 in HeLa nuclear extract for 60 min. RNA was analysed by denaturing PAGE (B) and spliceosomal complex formation was analysed on an agarose gel (C). The positions of the pre-mRNA, and splicing intermediates and products, or of spliceosomal complexes C, B, A, H are indicated on the left. Bands were visualized by autoradiography. DMSO, control reaction with the solvent. (D) Glycerol gradient sedimentation profile of the spliceosomal complexes formed under splicing conditions for 20 min in the presence of cp028 or 4 min in the presence of solvent (DMSO). (E) RNA composition of splicing complexes formed in the presence of cp028 or DMSO that were affinity purified from peak A or I (lanes 1 and 2) and peak B or II (lanes 3 and 4) of the glycerol gradient. RNA was analysed by denaturing PAGE and detected by silver staining. RNA identities are indicated on the left.
Figure 1—figure supplement 1

Determination of IC50 and kinetics of splicing complex formation in the presence of compound 028.
(A) Quantification of splicing efficiency and determination of IC50 values. The splicing efficiency (% mRNA formed) at different concentrations was determined from three independent experiments, performed under the same conditions, using the IMAGE J program. The curve and IC50 value were determined by the nonlinear least-square fit method using the Mathematica 10.4 program. (B) In vitro splicing in HeLa nuclear extract with 32P-labelled MINX pre-mRNA was performed for 0 to 60 min in the presence of 150 μM compound 028. RNA was analysed by denaturing PAGE (upper panel) and splicing complex formation was analysed on an agarose gel (lower panel) and visualized with a phosphorimager. The positions of the pre-mRNA, and splicing intermediates and products, or of spliceosomal complexes C, B, A, H are indicated on the left. DMSO, control reaction with the solvent. (C) Splicing was performed with 32P-labelled IgM pre-mRNA in the presence of 10–175 µM compound 028 in HeLa nuclear extract for 60 min. Denaturing PAGE (left) and splicing complex formation analysed on an agarose gel (right). * RNA contaminant. (D) Splicing was performed in S. cerevisiae total cell extract with 32P-actin pre-mRNA in the presence of 0–250 µM cp028 for 20 min. RNA was analysed by denaturing PAGE and the positions of the pre-mRNA, and splicing intermediates and products are indicated on the left.
Figure 1—figure supplement 2
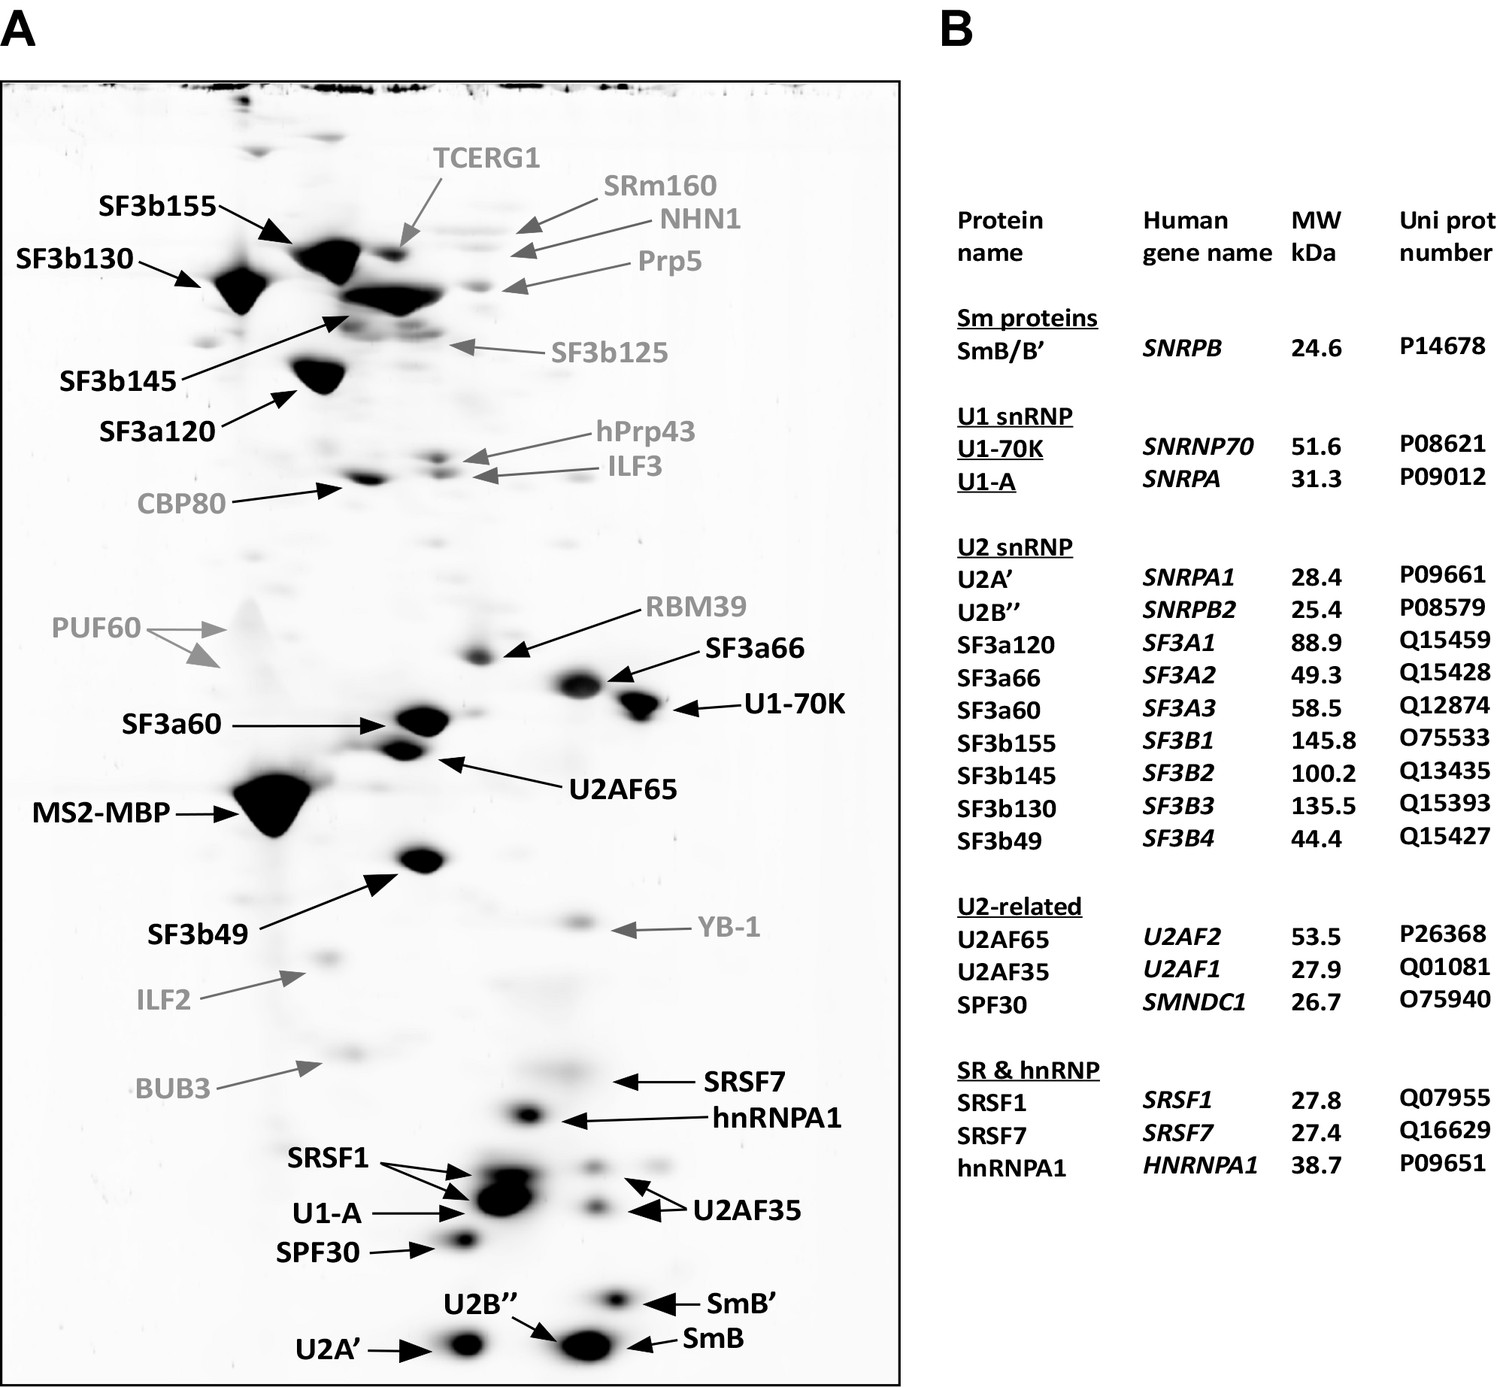
Identification of abundant proteins in affinity-purified A028 complexes.
(A) Proteins (larger than 25 kDa) from MS2 affinity-purified A028 complexes assembled on MINX-MS2 pre-mRNA were separated by 2D gel electrophoresis, stained with RuBPS, and the identities of single protein spots were determined by mass spectrometry. Abundant proteins were identified by visual inspection and are labelled black, and less abundant ones grey. Most SR proteins migrate as rather diffuse elongated spots during the 2D gel-electrophoresis and they are heavily phosphorylated, which in combination results in their poor staining intensity (Agafonov et al., 2011). Thus, the SR protein SRSF7 was also included in the group of abundant factors, despite less intensive staining. (B) Summary of abundant proteins detected in A028 complexes. Proteins are grouped according to their association with snRNPs.
Figure 1—figure supplement 3
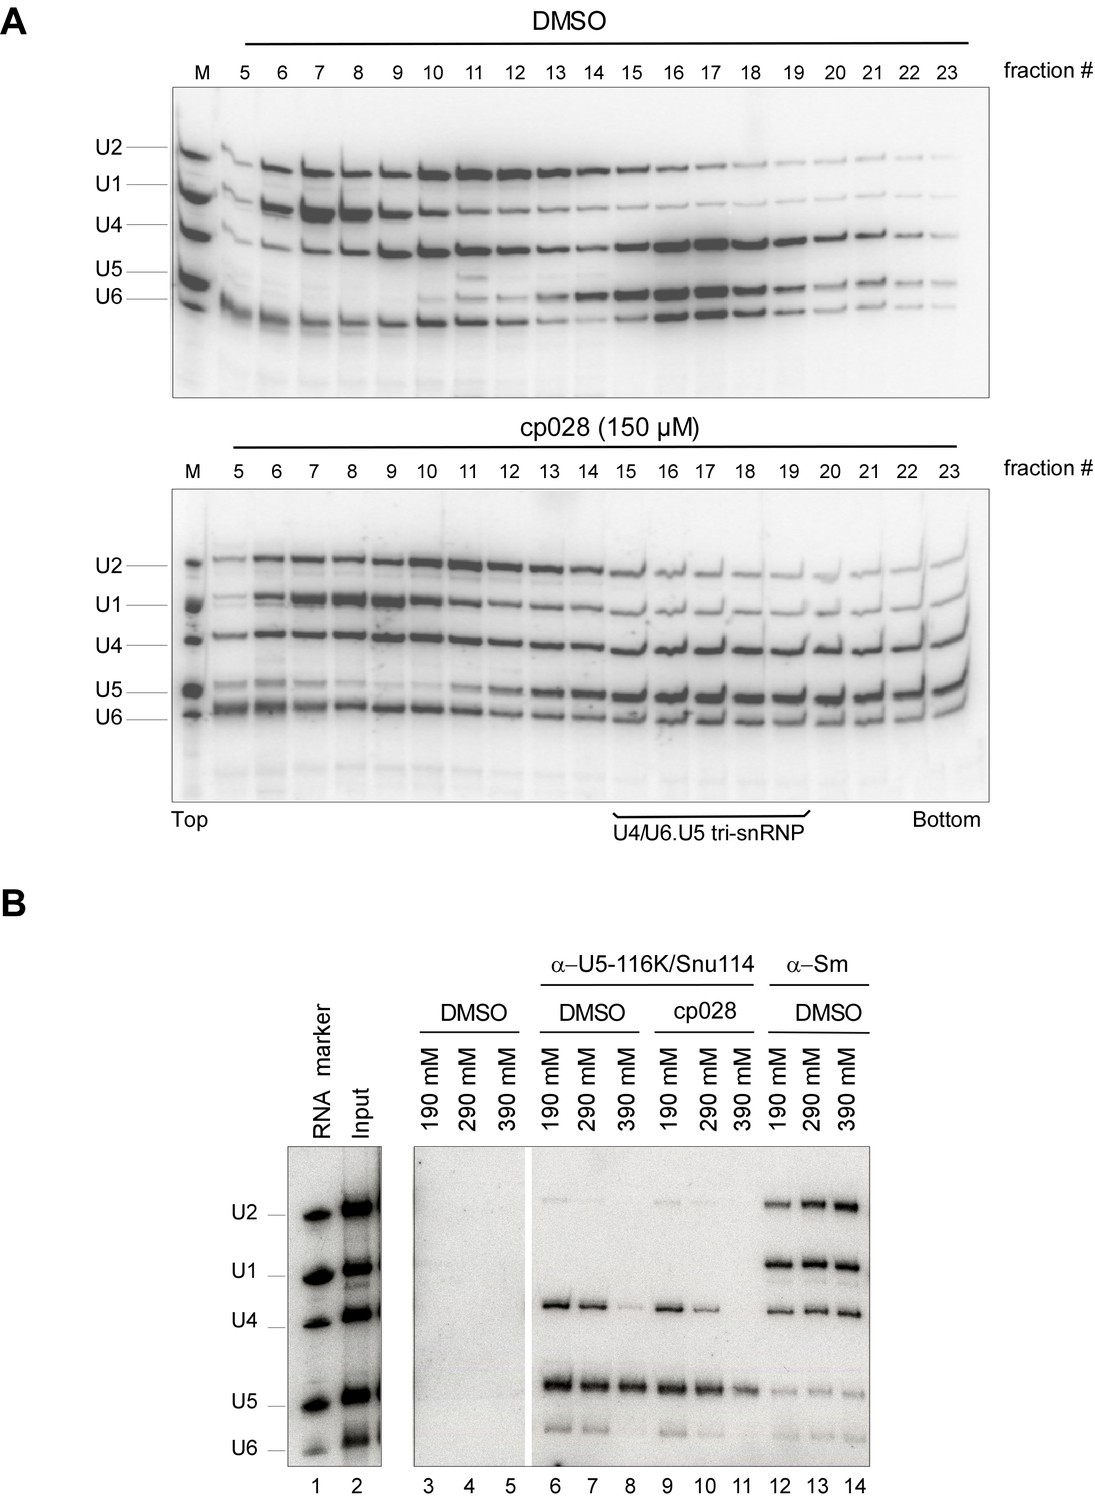
Most U4/U6.U5 tri-snRNPs remain intact in the presence of cp028.
HeLa nuclear extract plus DMSO (upper panel) or 150 µM compound 028 (lower panel) was incubated under splicing conditions (except no pre-mRNA was added) at 30° for 20 min. Extract was then (A) subjected to 10–30% glycerol gradient centrifugation in G150 buffer and RNAs were isolated from the indicated gradient fractions, or (B) analysed by immunoprecipitation with antibodies directed against the U5 snRNP protein 116K/Snu114 or Sm proteins as a control. The PAS/antibody bound material was washed with buffer containing 190, 290, and 390 mM salt, as indicated above each lane, and co-immunoprecipitated RNA was recovered. Lanes 3–5: PAS background binding control without antibody. In both panels, RNA was separated by denaturing PAGE, and analysed by Northern blotting with 32P-labelled probes complementary to the U2, U1, U4, U5 and U6 snRNAs. Hybridized DNA probes were detected by autoradiography. RNA identities are indicated at the left.
Figure 2
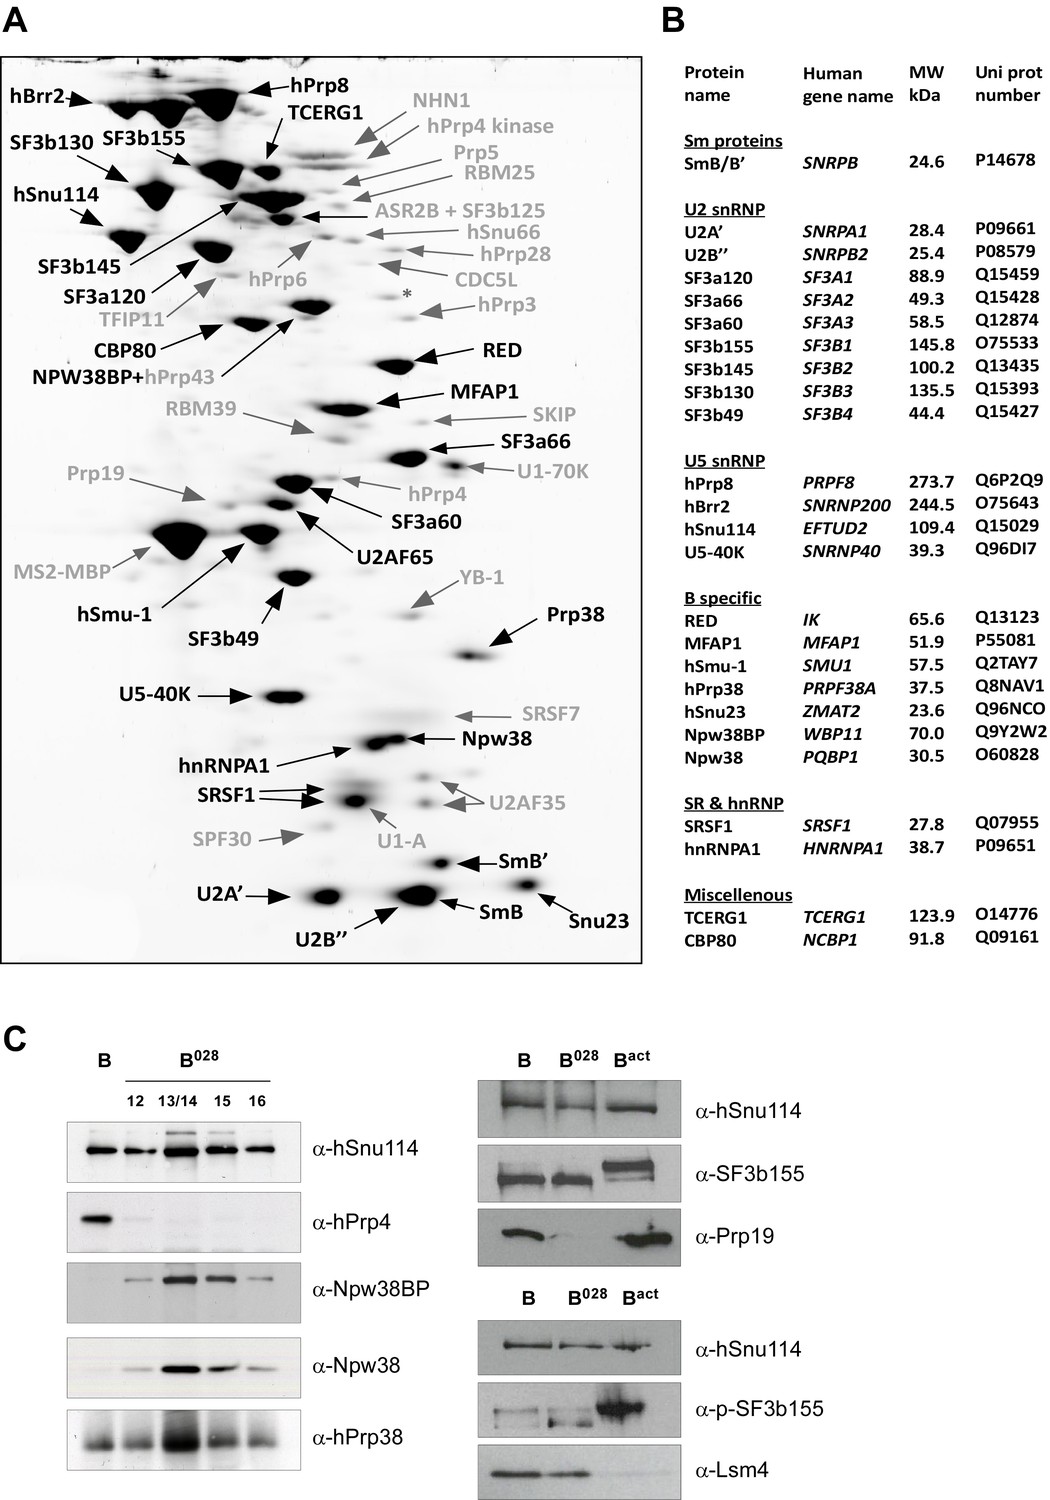
Identification of abundant proteins in affinity-purified B028 complexes.
(A) Proteins (larger than 25 kDa) from MS2 affinity-purified B028 complexes assembled on MINX-MS2 pre-mRNA were separated by 2D gel electrophoresis, stained with RuBPS, and the identities of single protein spots were determined by mass spectrometry. Abundant proteins were identified by visual inspection and are labelled black, and less abundant ones grey. (B) Summary of abundant proteins detected in B028 complexes. Proteins are grouped according to their association with snRNPs or stage of recruitment. (C) Proteins from affinity-purified B, B028 or Bact complexes (as indicated) were analysed by Western blotting using antibodies against the indicated proteins. Antibodies against hSnu114 were used to ensure equal loading. Left panel: Western blots with proteins from the B028 peak fractions 12–16 (as indicated above each lane) of a glycerol gradient on which affinity-purified B028 complexes were fractionated.
Figure 3 with 4 supplements
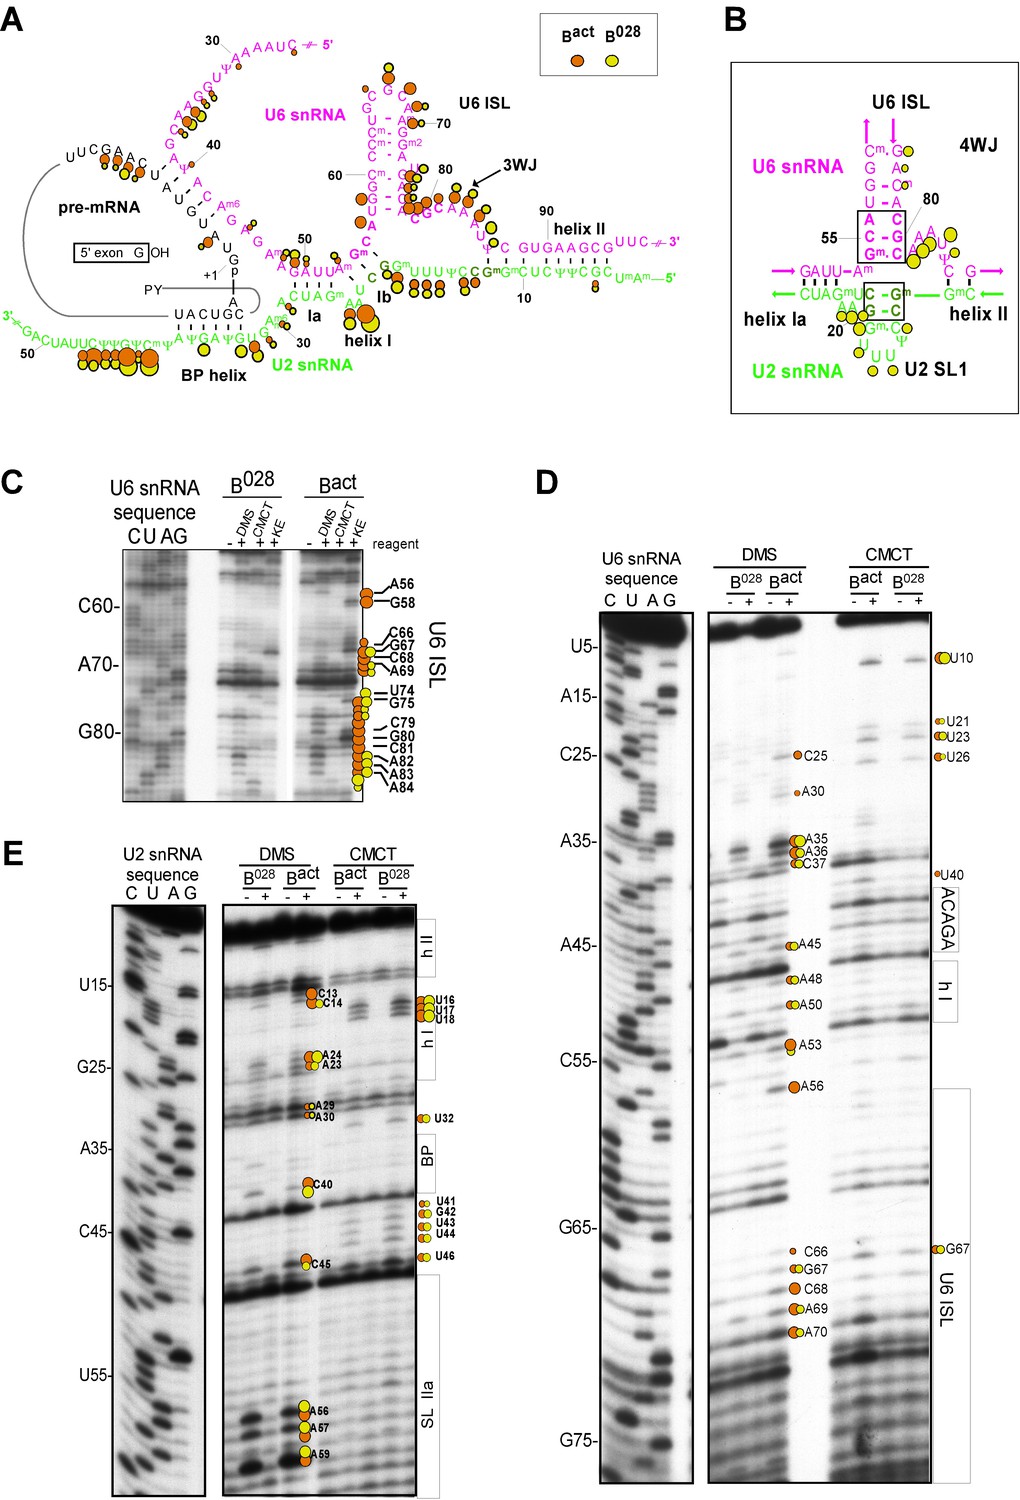
Characterization of the catalytic U2/U6 RNA network in the B028 complex.
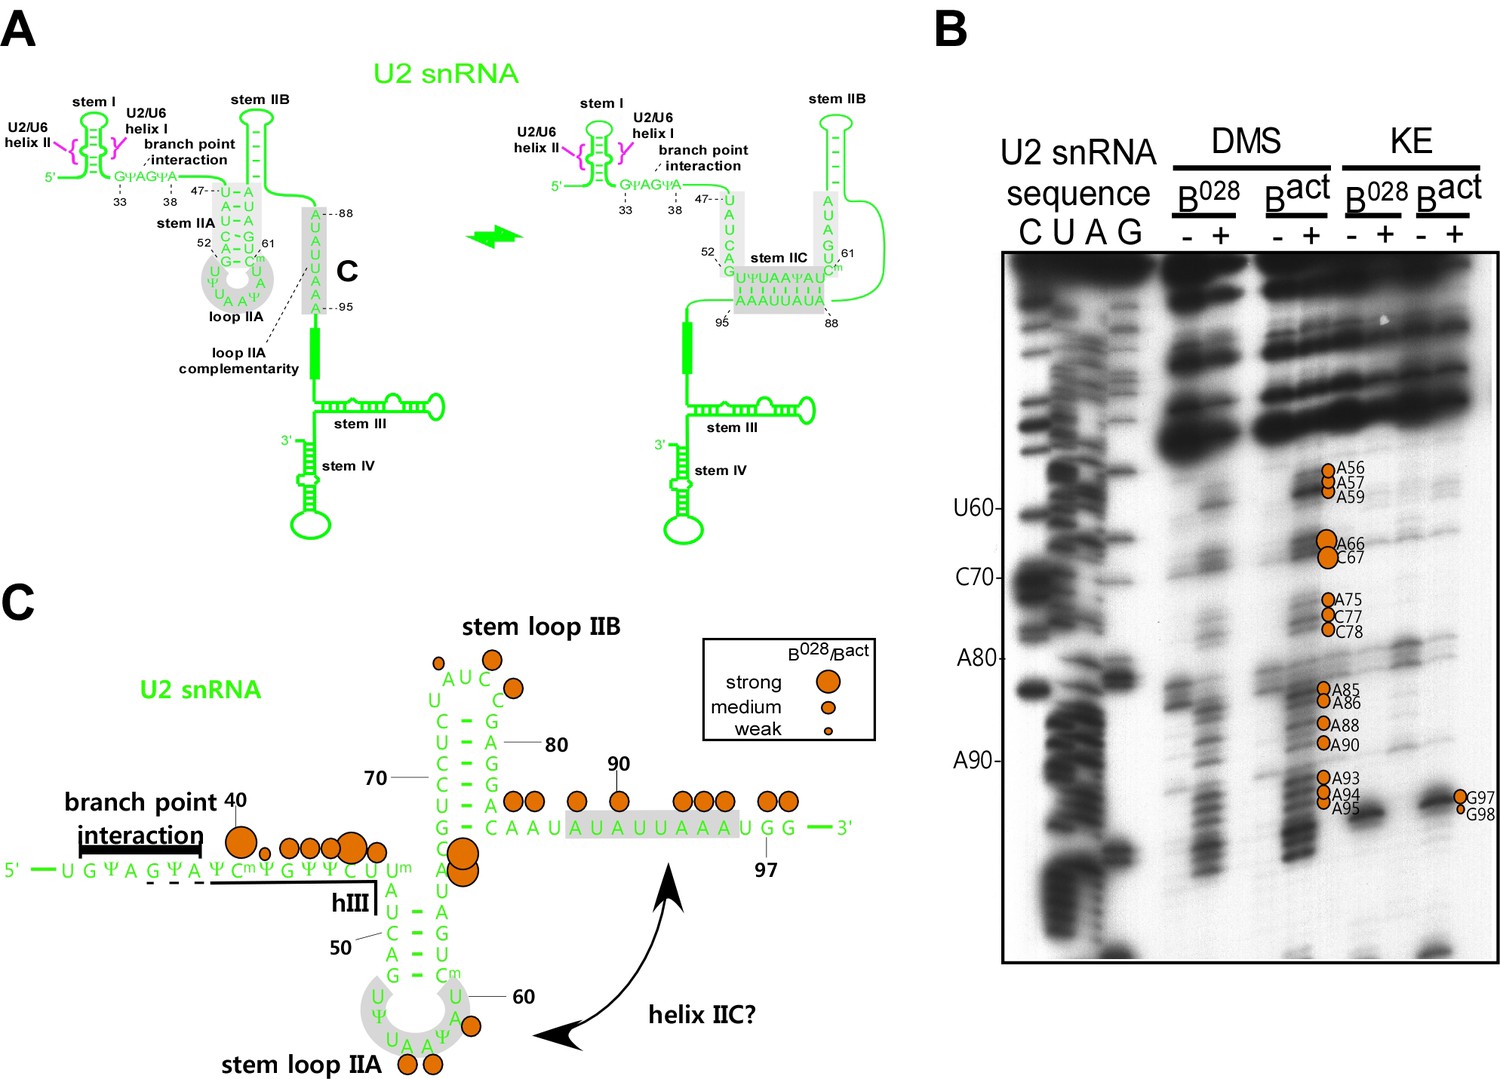
(A) Summary of the chemical modification patterns of U6 and U2 snRNA in B028 and Bact complexes. The U2/U6 interaction network is shown forming a 3-way junction (3WJ). The different size of the dots indicates different degrees of chemical modification. (B) 4-way junction model of U2/U6 snRNAs with summary of U2 and U6 chemical modification pattern in B028 complexes. (C, D) Primer extension analysis of U6 from CMCT, DMS and KE modified B028 and Bact complexes. Primer extension was performed with an oligonucleotide complementary to U6 nts 80–100 (C) or to the additional nucleotides that were added to the 3' end of the U6 snRNA (D). (E) Primer extension analysis of U2 from CMCT and DMS B028 and Bact complexes, performed with an oligonucleotide complementary to U2 nts 75–95.
Figure 3—figure supplement 1
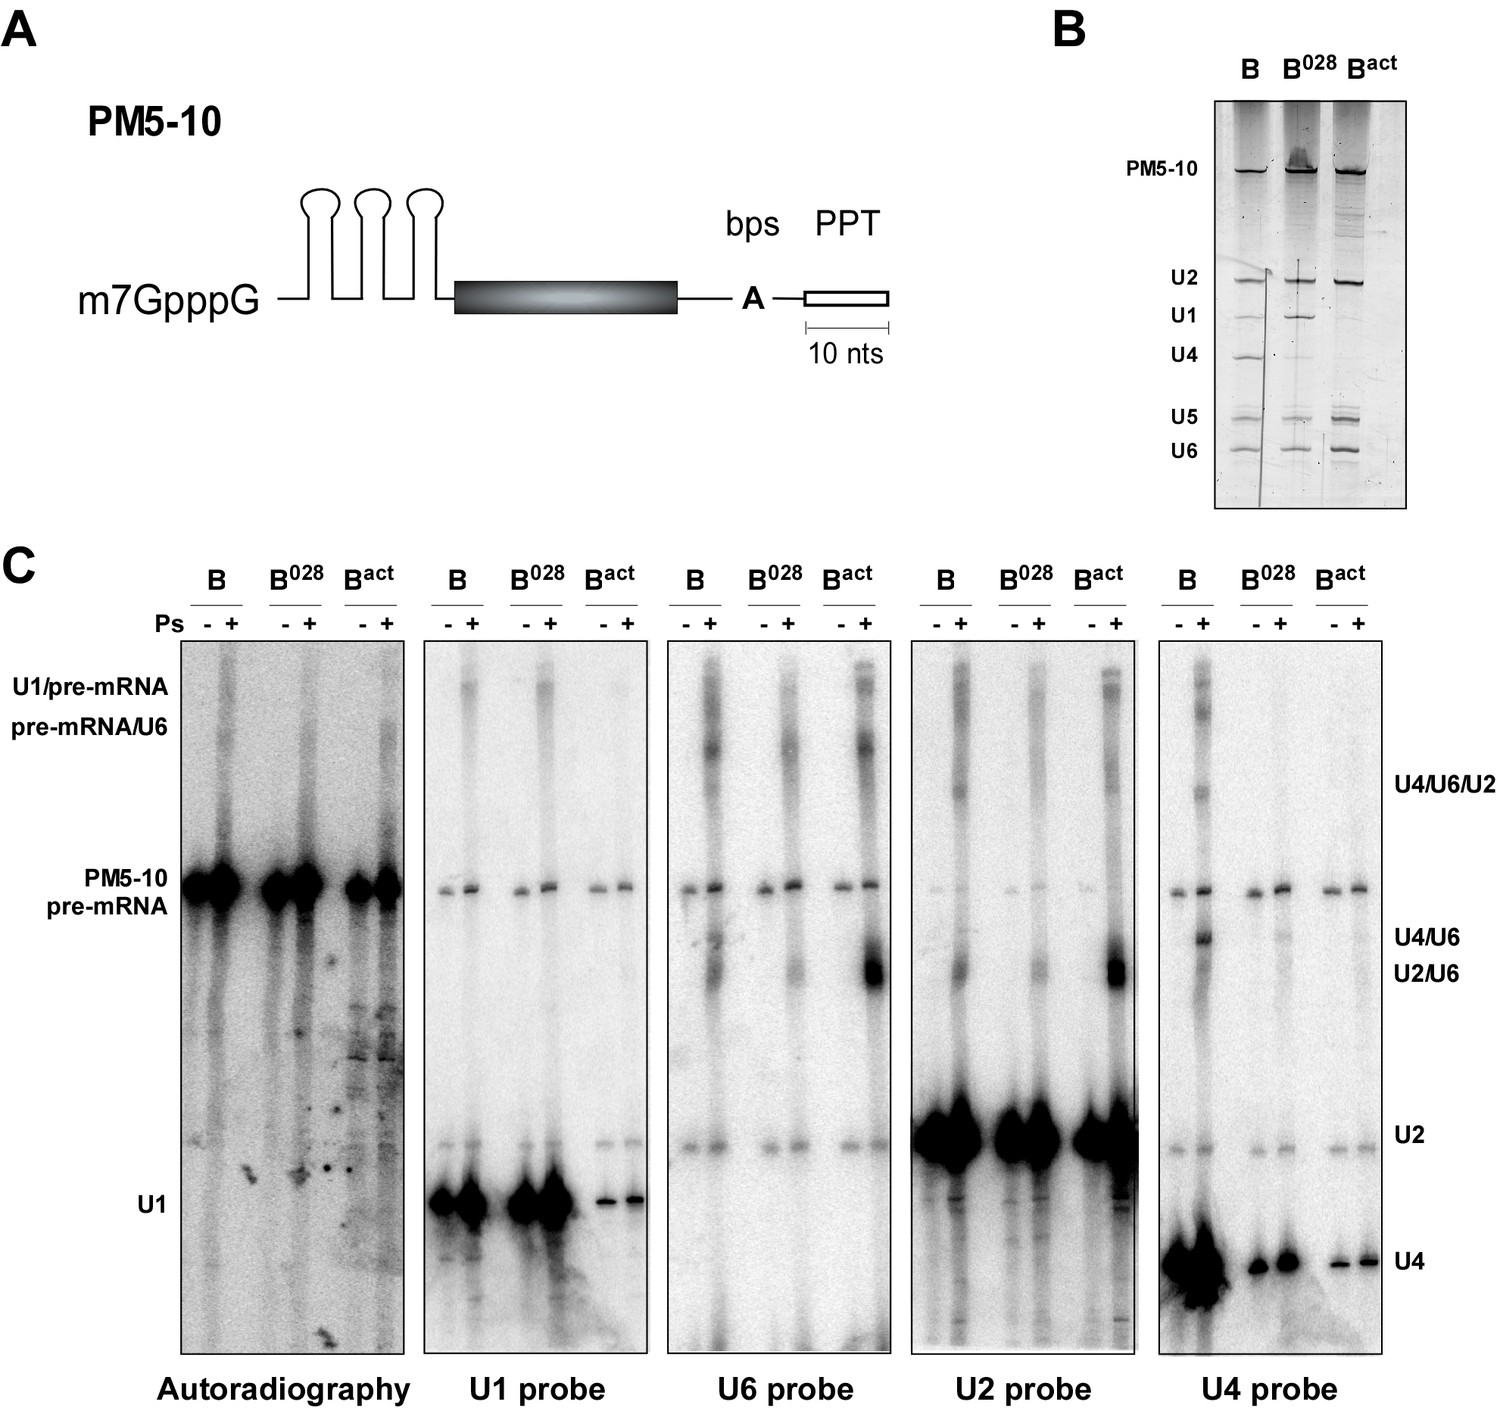
Identification of RNA-RNA interactions in the B028 complex via psoralen crosslinking.
(A) Schematic of the PM5-10 pre-mRNA. (B) RNA composition of MS2 affinity-purified spliceosomal complexes assembled on PM5-10 pre-mRNA. RNA was recovered from the indicated complexes, separated by denaturing PAGE and detected by silver staining. RNA identities are indicated on the left. (C) Affinity-purified B, B028 and Bact complexes were UV-irradiated +/− psoralen (Ps) as indicated. RNA-RNA crosslinks were identified by Northern blot analyses, incubating sequentially with 32P-labelled probes against U1, U2, U4, and U6 snRNAs. Several bands were observed solely in the presence of psoralen, and were detected by two or more probes, indicating crosslinking of two (or more) of these RNAs. The blot was stripped of each 32P-probe prior to incubation with a subsequent probe. 32P-labelled PM5-10 pre-mRNA, on which the B, B028 and Bact complexes were formed, is visible in all panels. The positions of crosslinked RNA species are indicated. The less efficient formation of the U2/U6 crosslink (U2/U6 helix II) in both B and B028 compared to Bact, suggests this region is shielded in B/B028 by proteins and thus less accessible to psoralen.
Figure 3—figure supplement 2
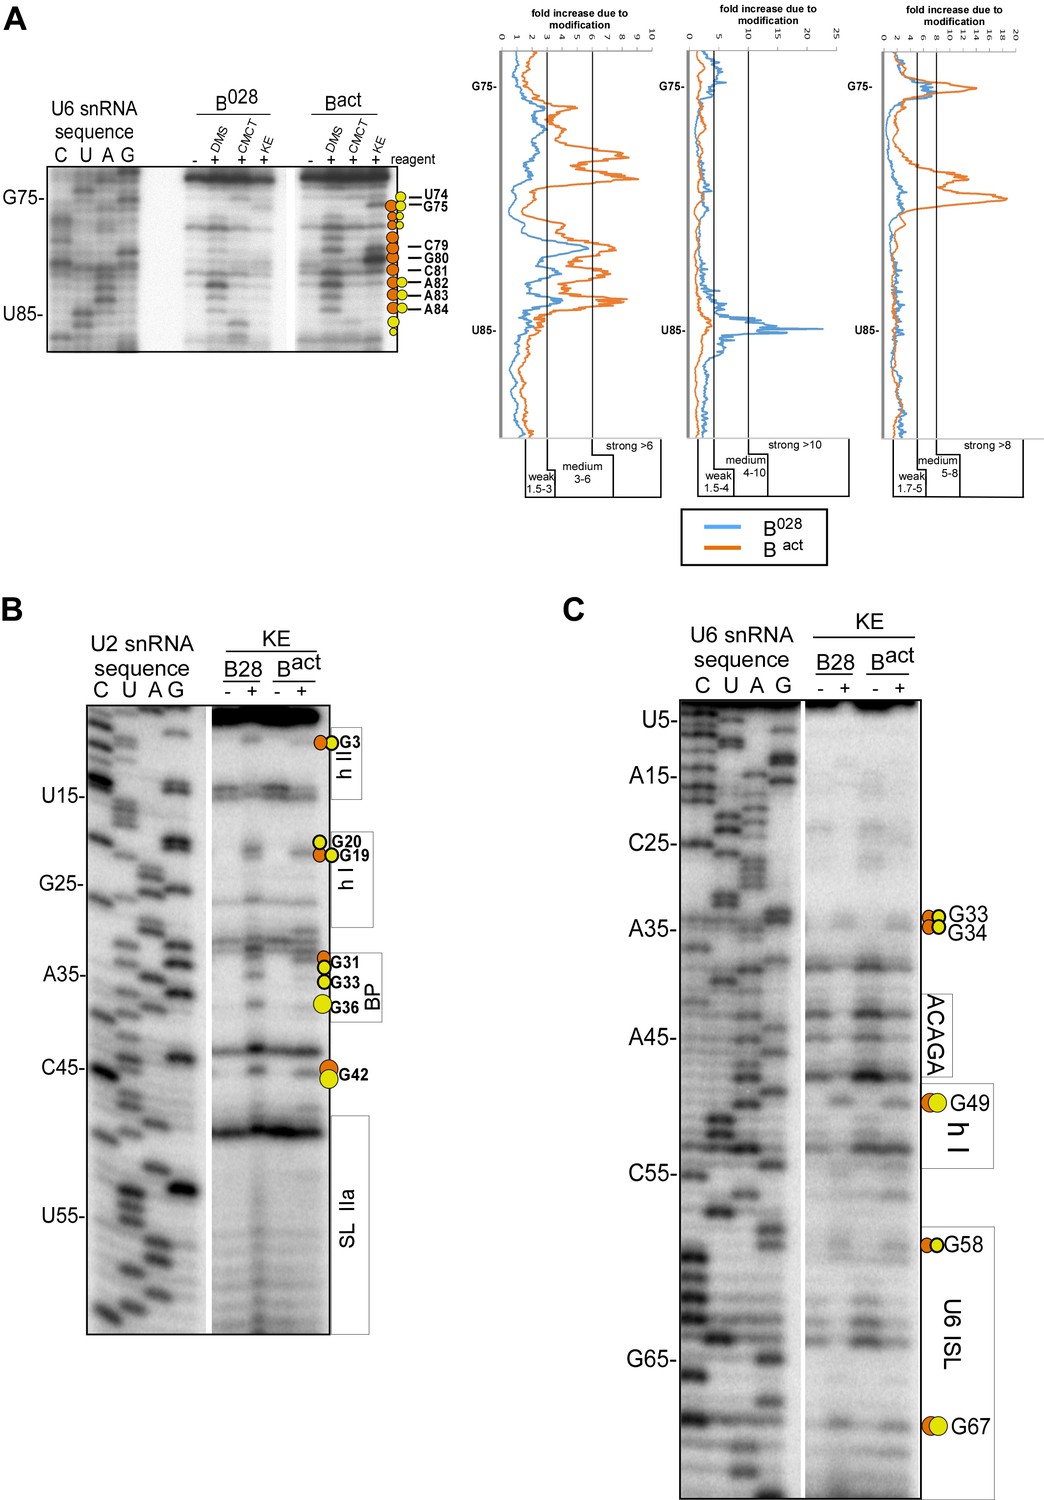
Structure probing of the U2 and U6 snRNAs in purified B028 complexes with kethoxal.
(A) Example of quantitation of reverse transcriptase stops after DMS, CMCT and KE probing. Primer extension using a primer complementary to the extended 3' end of U6 is shown. Bands were quantified using a Phosphorimager (Typhoon 8600) and the Quantity One program (BioRad). The gel background was first substracted. Then, to obtain the fold increase upon modification, values from the ‘plus modification’ lanes were divided by the corresponding values from the ‘minus modification’ lanes and the data were plotted. Signals were divided into three classes according to the fold increase observed. Ranges used to classify modifications with the different reagents are indicated (weak, medium, strong). Due to experimental variability, in some cases designation as weak, medium or strong was adjusted after visual inspection and comparison of different gels or primers. Primer extension analysis of (B) U2 and (C) U6 from KE modified B028 and Bact complexes, performed with an oligonucleotide complementary to U2 nts 75–95 or U6 nts 80–100.
Figure 3—figure supplement 3
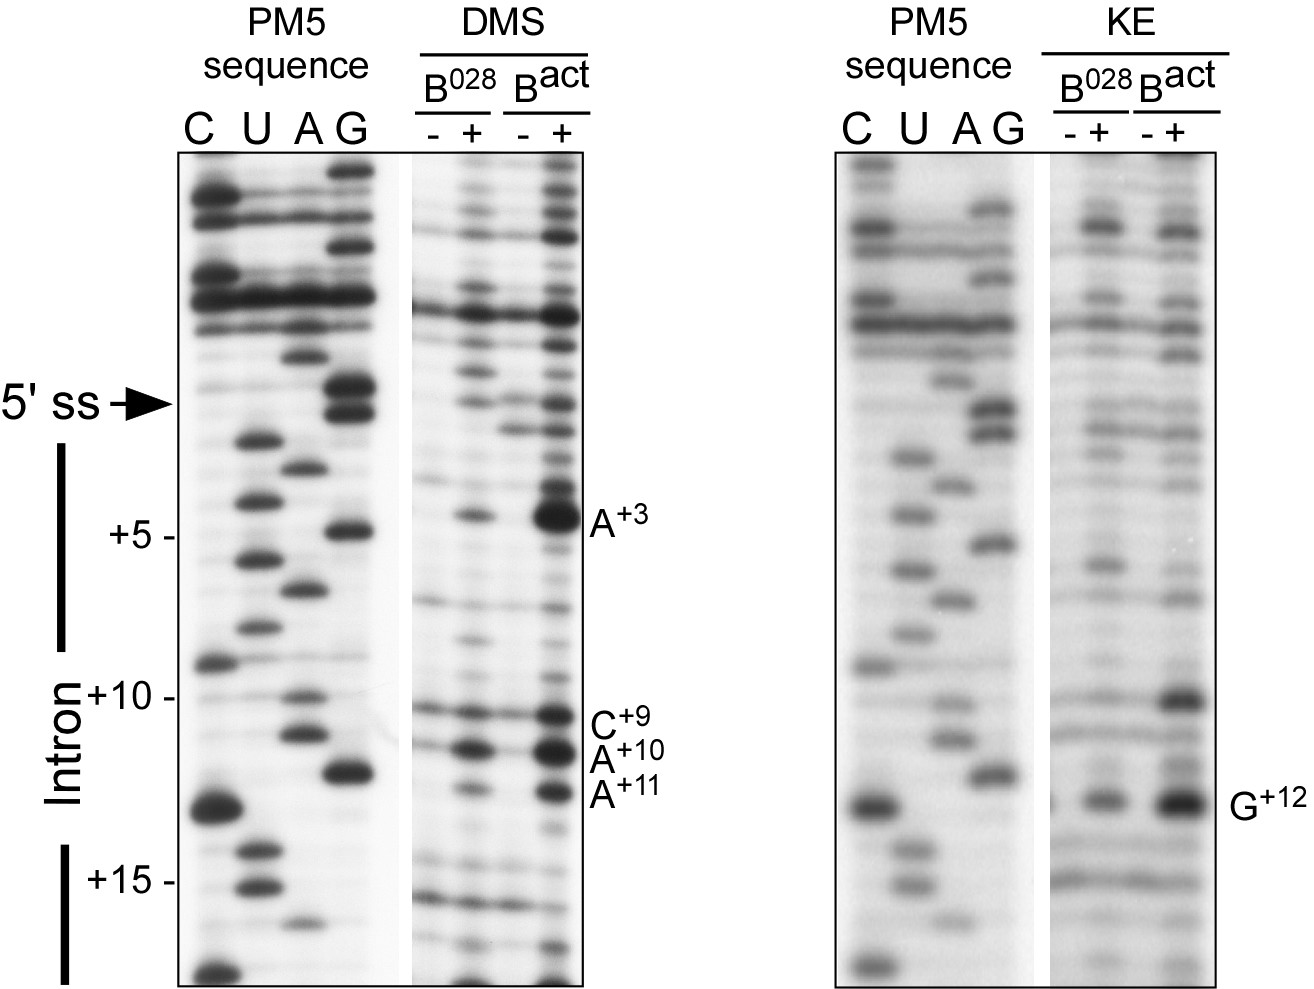
RNA structure probing of the pre-mRNA in B028 and Bact complexes.
Primer extension analysis of the pre-mRNA from DMS and KE treated B028 and Bact complexes. Primer extension was performed with an oligonucleotide complementary to PM5-10 pre-mRNA nts 281–262.
Figure 3—figure supplement 4
U2 snRNA intramolecular helix IIc is not formed in the B028 complex.
(A) Structure of U2 stem IIc and stem–loop IIa. Nucleotides involved in stem IIc and stem loop IIa are shaded grey. Nucleotides of U2 that base pair with the branch site of the pre-mRNA are shown. (B) Chemical modification of Bact and B028 complexes with the reagents indicated. (-) = background. Primer extension was performed with oligonucleotides complementary to U2 nts 75–95 and 146–163 and analyzed by denaturing PAGE. (C) Schematic of U2 snRNA modification pattern in B028 and Bact complexes. The different size of the dots indicates different degrees of chemical accessibility.
Figure 4
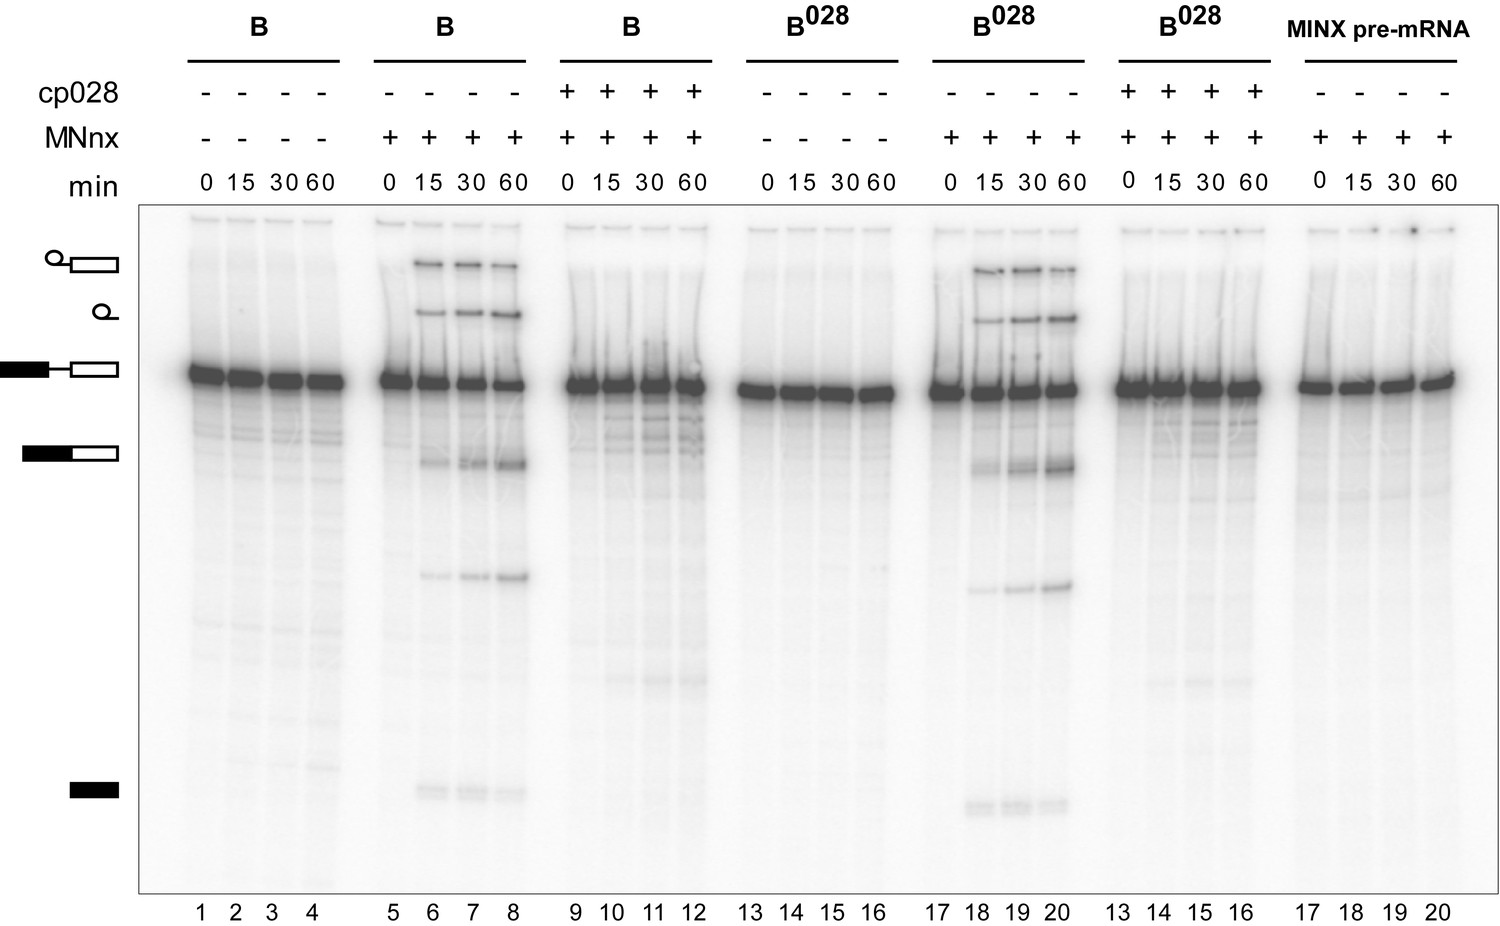
Purified B028 complexes can be chased into catalytically-active spliceosomes.
Affinity-purified B or B028 complexes (as indicated above) formed on MINX-MS2 pre-mRNA, were incubated at 30°C for the indicated times (0–60 min) under splicing conditions in the presence of buffer alone or micrococcal nuclease treated HeLa nuclear extract (MNnx) lacking or containing 150 μM cp028. RNA was analysed by denaturing PAGE and visualized with a Phosphorimager. The positions of the pre-mRNA, splicing intermediates and products are indicated on the left.
Figure 5

Morphology of the B028 complex under the electron microscope.
(A) Overview of raw images of affinity-purified B028 complexes obtained by negative stain electron microscopy. (B) Selected class averages (columns 1–4) of the B028 complex, compared to published EM structures of human B and Bact complexes. Schematic representations of the B complex and Bact complex are shown at the far left or right, respectively, with main structural features labeled. Scale bar corresponds to 50 nm. B complexes with a triangular shape similar to that shown typically represent more than 80% of the EM images whereas, approximately 60% of purified Bact complexes exhibit a mushroom-like shape.
Figure 6 with 2 supplements
Effects of alterations in the structure of cp028 on its splicing inhibition activity.
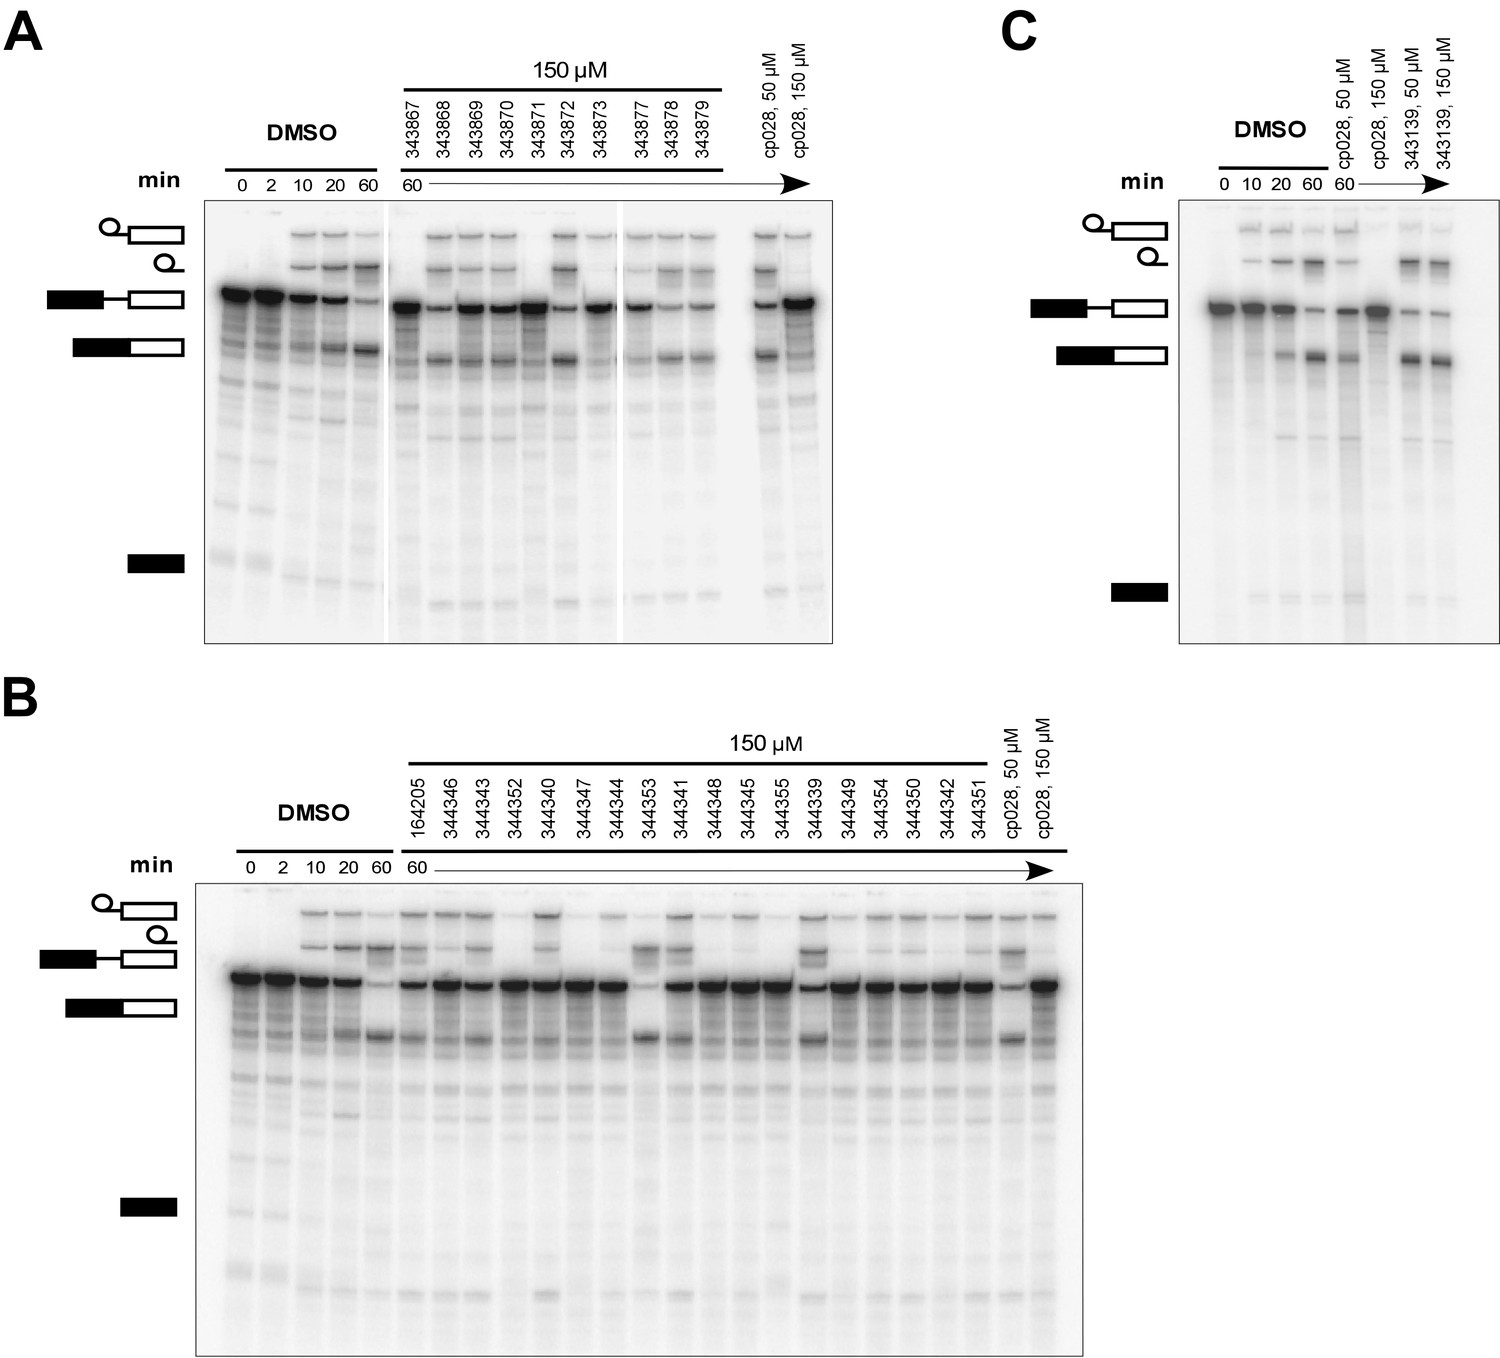
(A–C) In vitro splicing was performed with 32P-labelled MINX pre-mRNA and HeLa nuclear extract for 60 min after addition of cp028 and various analogues of cp028 at the indicated concentrations. The structures of the tested analogues are summarized in Figure 6—figure supplement 1. RNA was analysed by denaturing PAGE and the positions of the pre-mRNA, and splicing intermediates and products are indicated on the left.
-
Figure 6—source data 1
NMR spectra of cp028 analogues synthesized in house.
Cp028 analogues synthesised in house and several intermediate compounds were characterised by nuclear magnetic resonance spectroscopy. A 1H spectrum is shown for all molecules. 13C and 19F spectra are provided for some of the analogues. The ppm values (in blue), the multiplicity and the 1H integrals (in green) are shown (see also description of the synthesis of each compound in Materials and Methods).
- https://doi.org/10.7554/eLife.23533.015
Figure 6—figure supplement 1
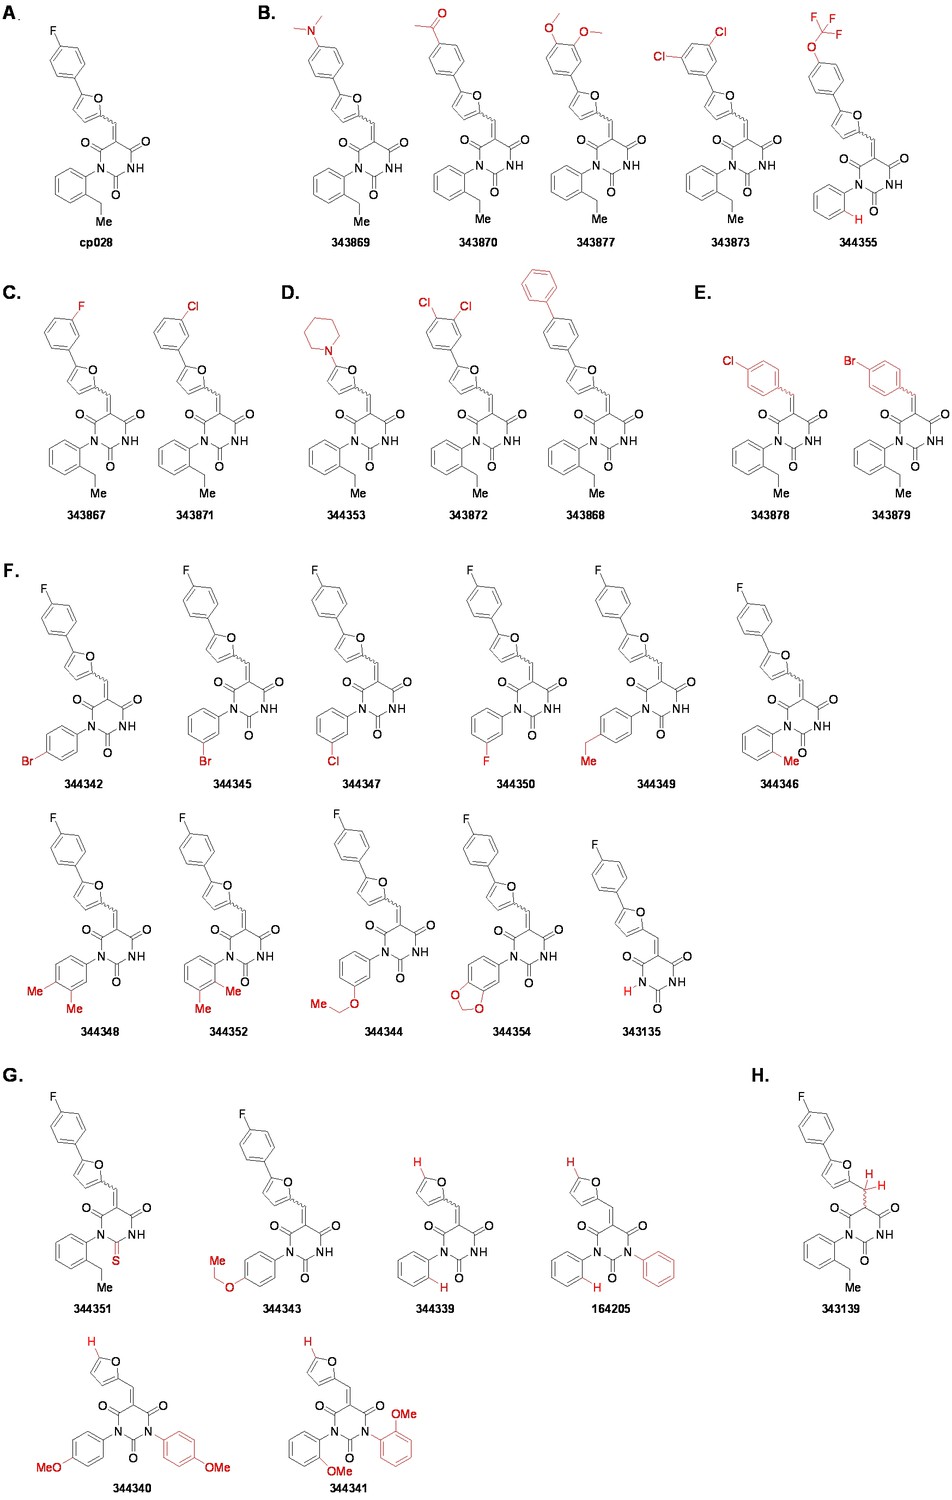
Structures of cp028 analogues and their effect on pre-mRNA splicing in vitro.
(A) Compound 028. Analogues of cp028 in which the p-fluorophenyl group was replaced that (B) have little or no effect on splicing inhibition activity, (C) enhance slightly inhibition activity or (D) abolish inhibition activity. (E) Analogues of cp028 in which the furan group was not introduced, leading to loss of splicing inhibition activity. (F) Analogues of cp028 where changes to the ethylphenyl group were made that have little or no effect on splicing inhibition activity. (G) Analogues of cp028 with substantially reduced or no splicing inhibition activity, except for 344351, which was nearly as active as cp028. (H) Analogue of cp028 in which the double bond was reduced, leading to complete loss of inhibition activity.
Figure 6—figure supplement 2
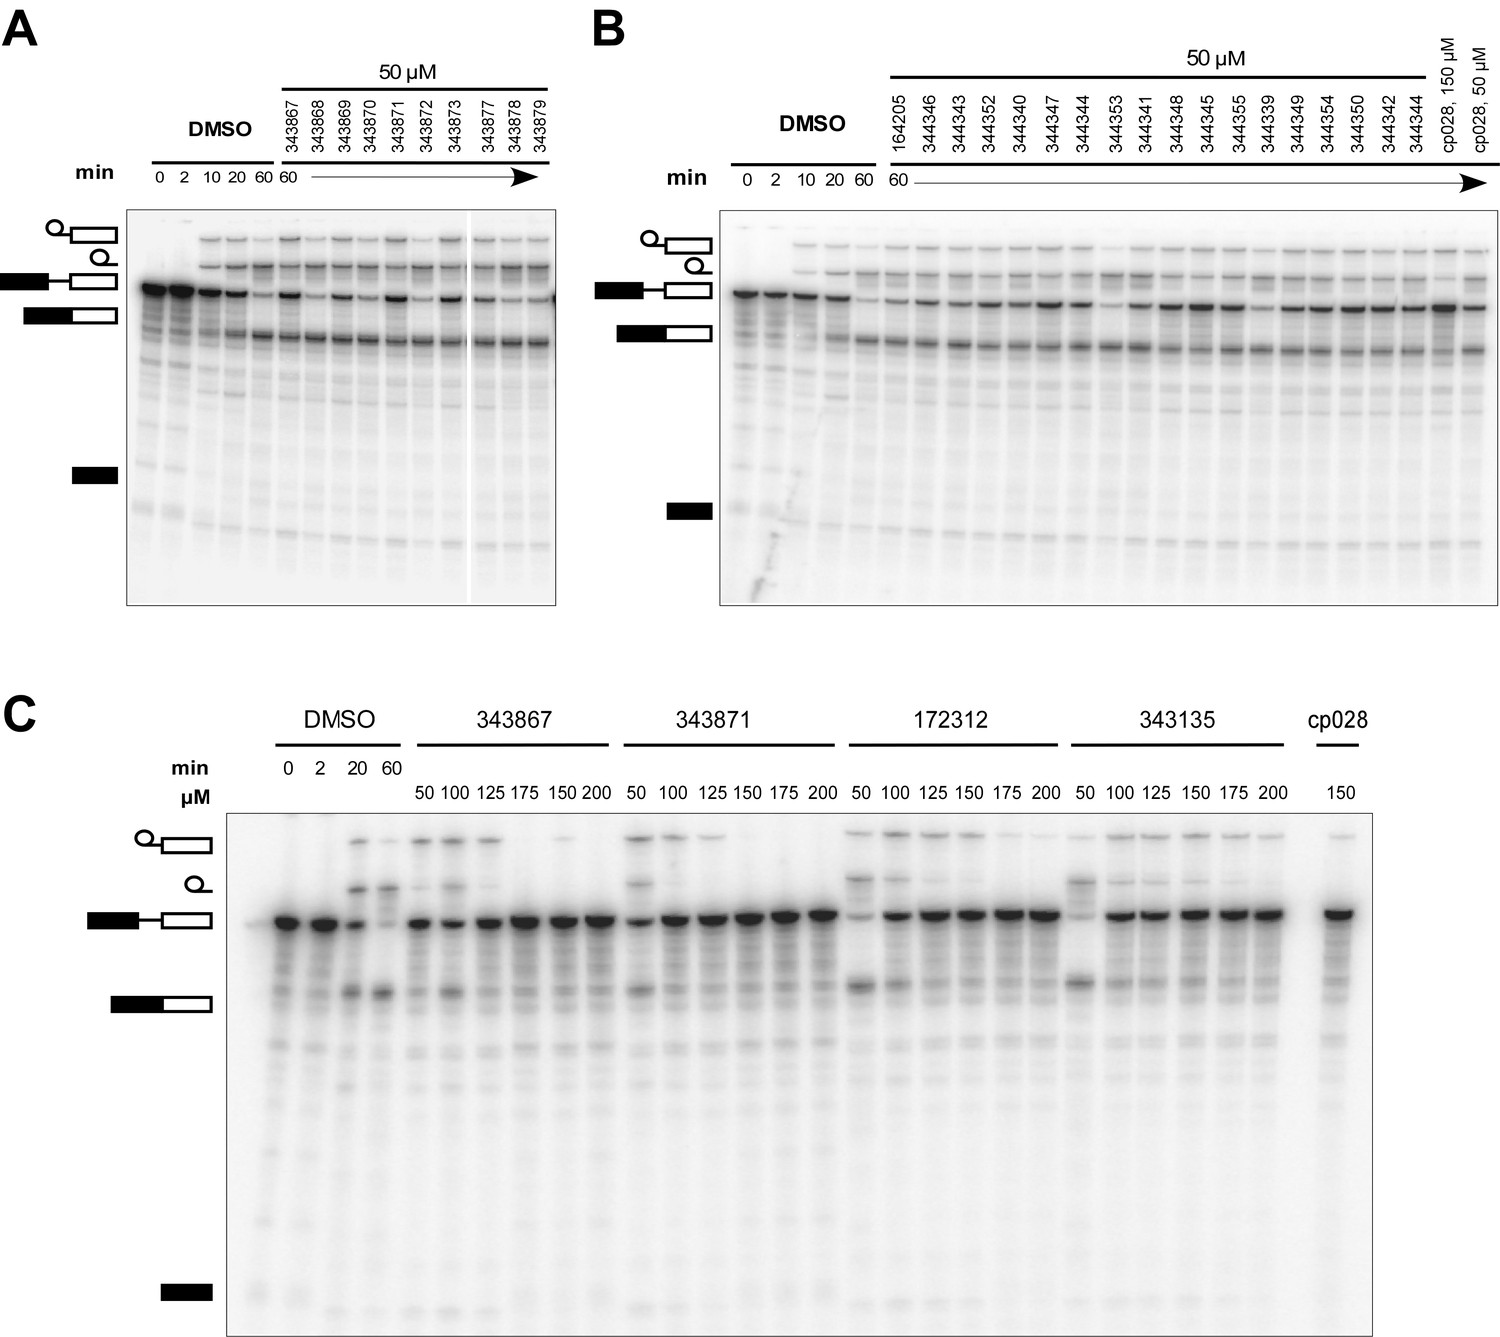
Effect of cp028 analogues on in vitro splicing.
(A, B) In vitro splicing was performed with 32P-labelled MINX pre-mRNA and HeLa nuclear extract for 60 min after addition of cp028 and 50 μM of various analogues of cp028 as indicated above each lane. (C) Splicing was performed for 60 min in the presence of various concentrations (50 to 200 μM) of the indicated cp028 analogues. The structures of the tested analogues are summarized in Figure 6—figure supplement 1. In all panels, RNA was analysed by denaturing PAGE and the positions of the pre-mRNA, and splicing intermediates and products are indicated on the left.
Scheme 1
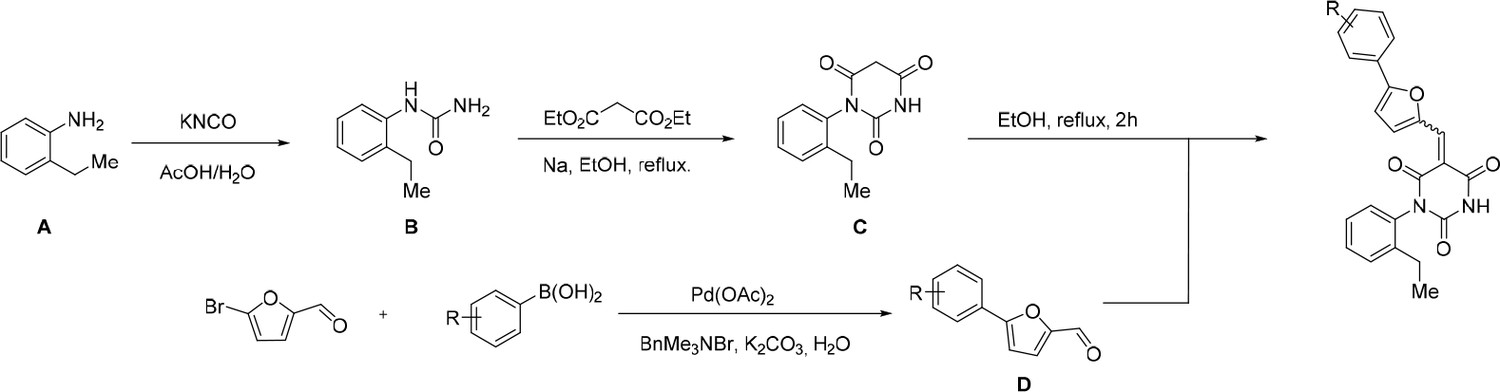
General Synthesis of cp028 (R = 4fluoro) and analogues.
https://doi.org/10.7554/eLife.23533.018
Chemical structure 1
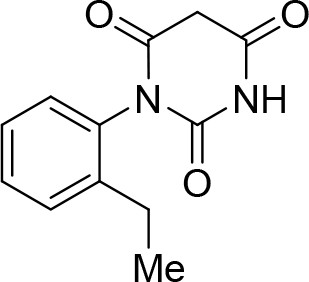
1-(2-Ethylphenyl)pyrimidine-2,4,6 (1H,3H,5H)-trione (C).
https://doi.org/10.7554/eLife.23533.019
Chemical structure 2
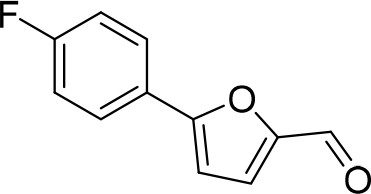
5-(4-Fluorophenyl)furan-2-carbaldehyde (D1).
https://doi.org/10.7554/eLife.23533.020
Scheme 2
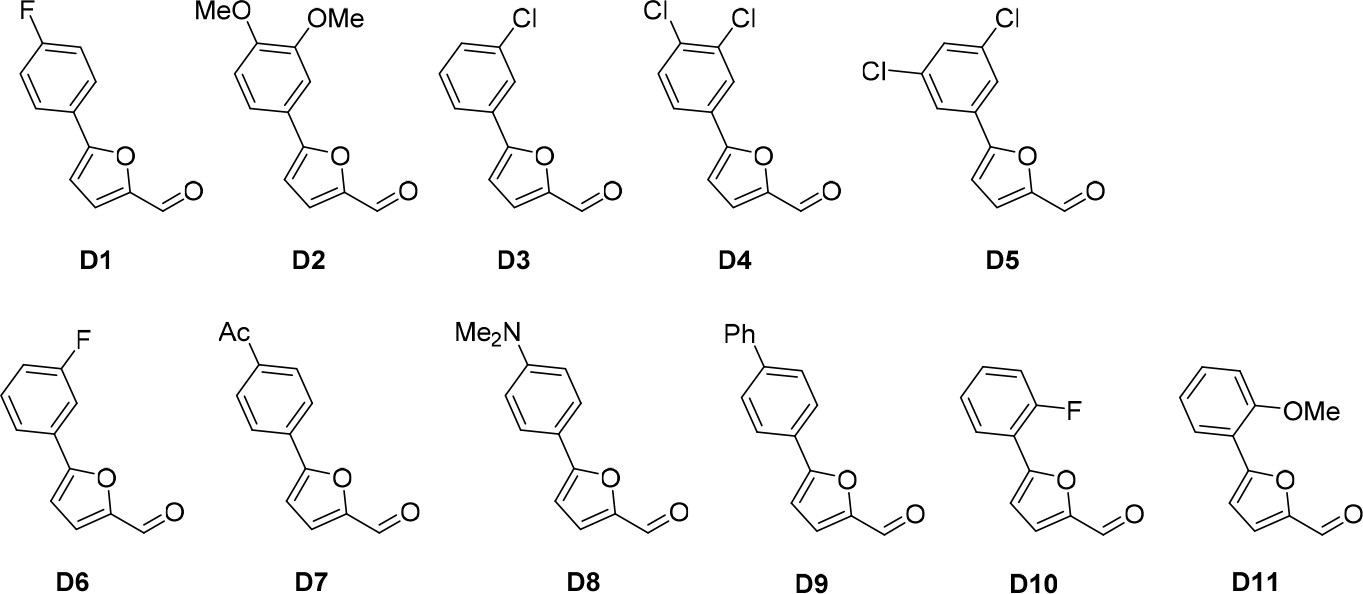
Aldehydes used for the synthesis of the cp028 analogues.
https://doi.org/10.7554/eLife.23533.021
Chemical structure 3

(E/Z)−1-(2-Ethylphenyl)−5-((5-(4-fluorophenyl)furan-2-yl)methylene)pyrimidine-2,4,6 (1H,3H,5H)-trione (1:1 mixture of E/Z isomers) (cp028).
https://doi.org/10.7554/eLife.23533.022
Chemical structure 4

(+/-)1-(2-Ethylphenyl)−5-((5-(4-fluorophenyl)furan-2-yl)methyl)pyrimidine-2,4,6 (1H,3H,5H)-trione (racemic mixture) (343139).
https://doi.org/10.7554/eLife.23533.023
Chemical structure 5
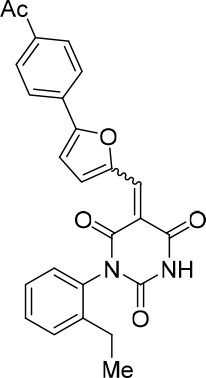
(E/Z)−5-((5-(4-Acetylphenyl)furan-2-yl)methylene)−1-(2-ethylphenyl)pyrimidine-2,4,6 (1H,3H,5H)-trione (1:1 mixture of E/Z isomers) (343870).
https://doi.org/10.7554/eLife.23533.024
Chemical structure 6
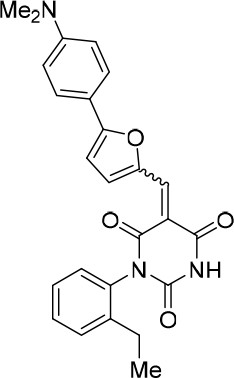
(E/Z)−5-((5-(4-(Dimethylamino)phenyl)furan-2-yl)methylene)−1-(2-ethylphenyl) pyrimidine-2,4,6 (1H,3H,5H)-trione (1.5:1 mixture of E/Z isomers) (343869).
https://doi.org/10.7554/eLife.23533.025
Chemical structure 7
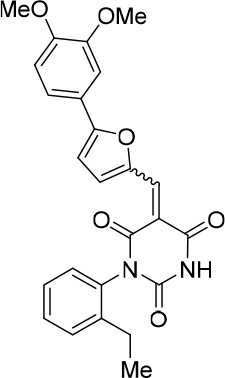
(E/Z)−5-((5-(3,4-dimethoxyphenyl)furan-2-yl)methylene)−1-(2-ethylphenyl)pyrimidine-2,4,6 (1H,3H,5H)-trione (1:1 mixture of E/Z isomers) (343877).
https://doi.org/10.7554/eLife.23533.026
Chemical structure 8

(E/Z)−5-((5-(3,5-Dichlorophenyl)furan-2-yl)methylene)−1-(2-ethylphenyl) pyrimidine-2,4,6 (1H,3H,5H)-trione (1:1 mixture of E/Z isomers) (343873).
https://doi.org/10.7554/eLife.23533.027
Chemical structure 9
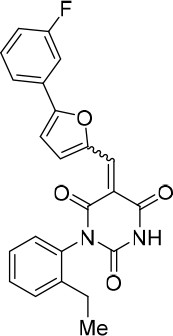
(E/Z)−1-(2-Ethylphenyl)−5-((5-(3-fluorophenyl)furan-2-yl)methylene)pyrimidine-2,4,6 (1H,3H,5H)-trione (1.2:1 mixture of E/Z isomers) (343867).
https://doi.org/10.7554/eLife.23533.028
Chemical structure 10
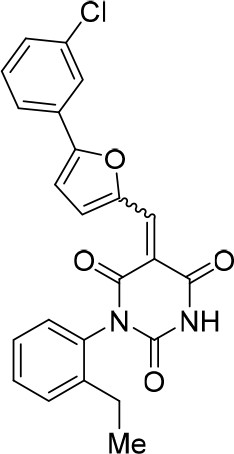
(E/Z)−5-((5-(3-Chlorophenyl)furan-2-yl)methylene)−1-(2-ethylphenyl)pyrimidine-2,4,6 (1H,3H,5H)-trione (1:1 mixture of E/Z isomers) (343871).
https://doi.org/10.7554/eLife.23533.029
Chemical structure 11

(E/Z)−5-(4-Chlorobenzylidene)−1-(2-ethylphenyl)pyrimidine-2,4,6 (1H,3H,5H)-trione (1:1 mixture of E/Z isomers) (1:1 mixture of E/Z isomers) (343878).
https://doi.org/10.7554/eLife.23533.030
Chemical structure 12
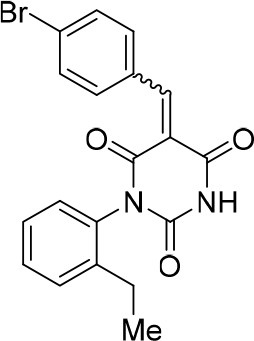
(E/Z)−5-(4-Bromobenzylidene)−1-(2-ethylphenyl)pyrimidine-2,4,6 (1H,3H,5H)-trione (1.7:1 mixture of isomers E/Z) (343879).
https://doi.org/10.7554/eLife.23533.031
Chemical structure 13

(E/Z)−5-((5-(3,4-Dichlorophenyl)furan-2-yl)methylene)−1-(2-ethylphenyl) pyrimidine-2,4,6 (1H,3H,5H)-trione (1.4:1 mixture of isomers E/Z) (343872).
https://doi.org/10.7554/eLife.23533.032
Chemical structure 14

(E/Z)−5-((5-([1,1'-Biphenyl]−4-yl)furan-2-yl)methylene)−1-(2-ethylphenyl)pyrimidine-2,4,6 (1H,3H,5H)-trione (1:1 mixture of isomers E/Z) (343868).
https://doi.org/10.7554/eLife.23533.033
Chemical structure 15
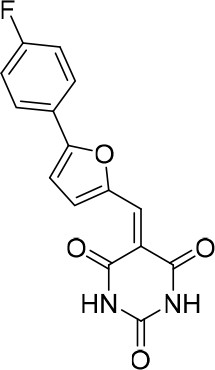
5-((5-(4-fluorophenyl)furan-2-yl)methylene)pyrimidine-2,4,6 (1H,3H,5H)-trione.
https://doi.org/10.7554/eLife.23533.034Additional files
-
Supplementary file 1
Protein composition of A028 and B028 complexes as determined by mass spectrometry.
Proteins identified by LC-MS/MS in human spliceosomal B and Bact complexes, as well as complexes stalled in the presence of compound 028 (B028). Total spectral counts of sequenced peptides are shown. Peptides and proteins were identified by searching fragment spectra against the NCBI database (taxonomy human) using Mascot as search engine and were annotated with Scaffold software. Proteins are grouped according to function or association. Common contaminants, such as ribosomal proteins, are not shown.
- https://doi.org/10.7554/eLife.23533.035
Download links
A two-part list of links to download the article, or parts of the article, in various formats.
Downloads (link to download the article as PDF)
Open citations (links to open the citations from this article in various online reference manager services)
Cite this article (links to download the citations from this article in formats compatible with various reference manager tools)
Identification of a small molecule inhibitor that stalls splicing at an early step of spliceosome activation
eLife 6:e23533.
https://doi.org/10.7554/eLife.23533


