Introduction of a male-harming mitochondrial haplotype via ‘Trojan Females’ achieves population suppression in fruit flies
- Monash University, Australia
- University of Otago, New Zealand
- Landcare Research, New Zealand
Figures
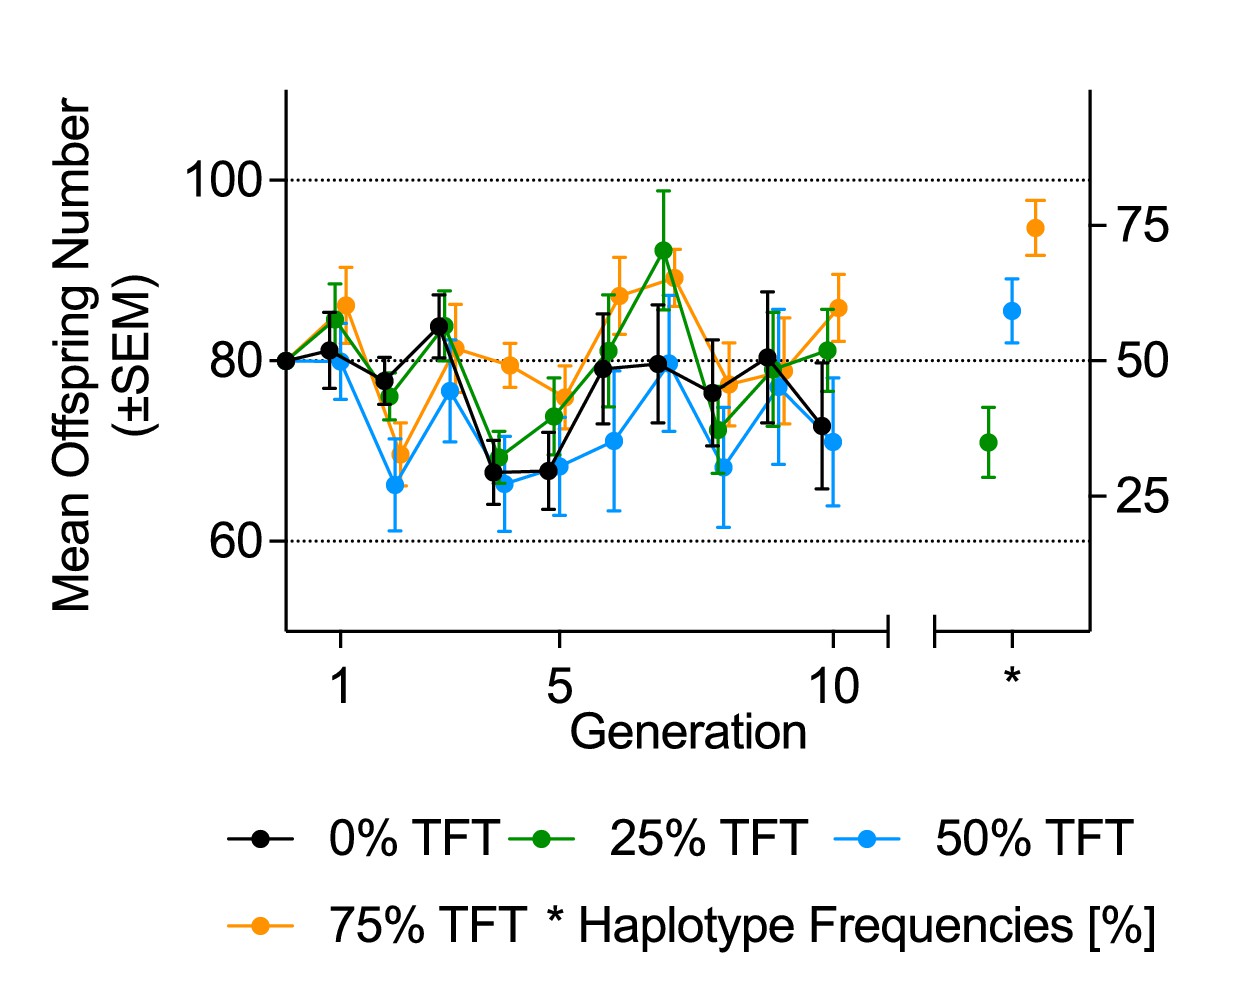
Figure 1

Mean offspring number and haplotype frequencies under density-controlled population conditions (Experiment 1).
(A) Mean offspring number (±SEM), and B) mean haplotype frequencies (±SEM) of experimental populations in Experiment 1 over 10 generations, under density-controlled conditions. Founding populations (F0) were established with varying proportions (0%, 25%, 50%, 75%) of the TFT haplotype. Each generation was propagated with 80 eggs. Genotyping was conducted at generations 1, 5, and 10.
-
Figure 1—source data 1
Raw data for offspring number and TFT frequency for Experiment 1.
Offspring numbers per population for each of 10 generations and TFT frequencies for each population at generations 1, 5 and 10.
- https://doi.org/10.7554/eLife.23551.007
Figure 2
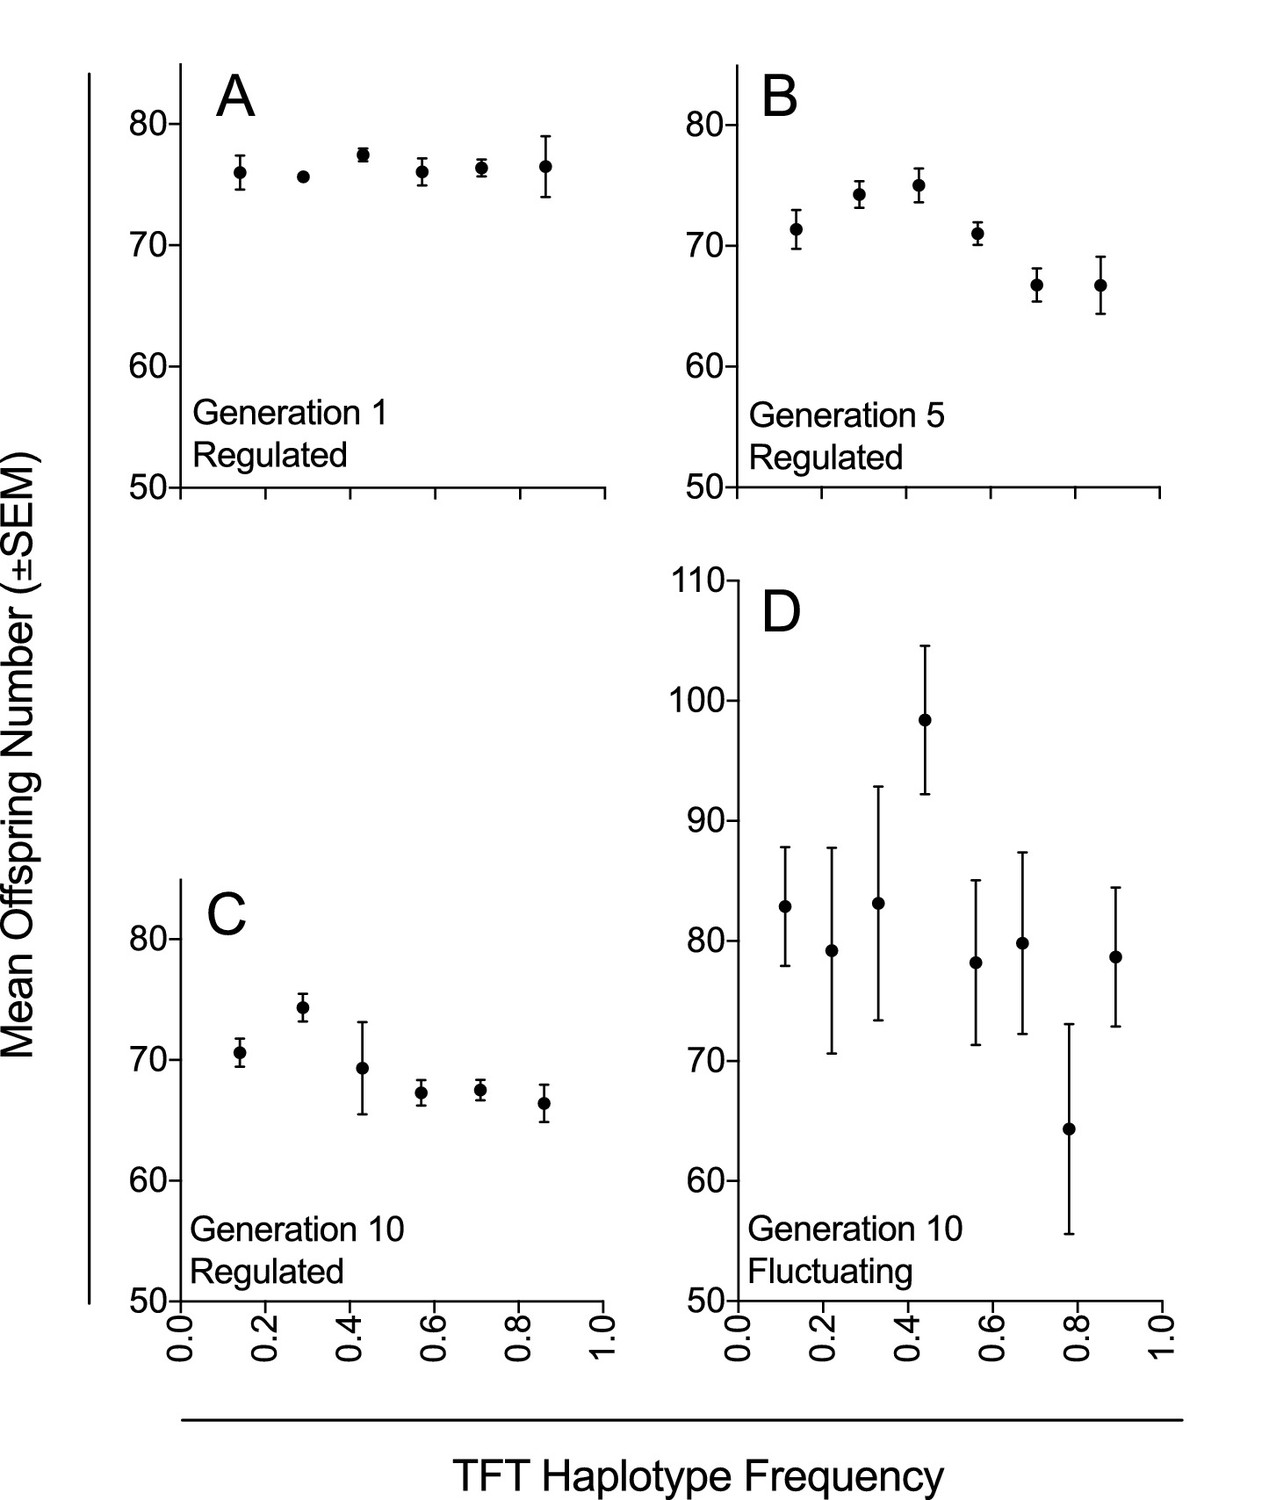
Mean offspring number in relation to TFT haplotype frequency under density-controlled (Experiment 1) and fluctuating population conditions (Experiment 2).
Mean offspring number (±SEM) across experimental populations (A–C) with regulated population size at generations 1, 5, and 10 in Experiment 1; and (D) with fluctuating population size at generation 10 in Experiment 2. Haplotype frequencies were determined by genotyping seven females for each experimental population at each of three generations (1, 5, and 10; n = 1323) in Experiment 1; and by genotyping nine females for each experimental population at generation 10 (n = 567) in Experiment 2.
-
Figure 2—source data 1
Raw data for offspring number and TFT frequency for Experiments 1 and 2.
Offspring numbers per population for each of 10 generations in Experiment 1 and 2. TFT frequencies for each population at generations 1, 5 and 10 for Experiment 1 and at generation 10 for Experiment 2.
- https://doi.org/10.7554/eLife.23551.010
Figure 3
Mean offspring number and haplotype frequencies under fluctuating population conditions (Experiment 2).
Mean offspring number (±SEM, on vertical axis on left-hand side), and mean haplotype frequencies (±SEM, right-hand side) at generation 10, of experimental populations. Founding populations (F0) were established with varying proportions (0%, 25%, 50%, 75%) of fruit fly pairs harboring the mt:Cyt-b TFT mutation. Each generation, each experimental population was propagated with all offspring of the previous generation.
-
Figure 3—source data 1
Raw data for offspring number and TFT frequency for Experiment 2.
Offspring numbers per population for each of 10 generations and TFT frequency for each population at generation 10.
- https://doi.org/10.7554/eLife.23551.012
Figure 4
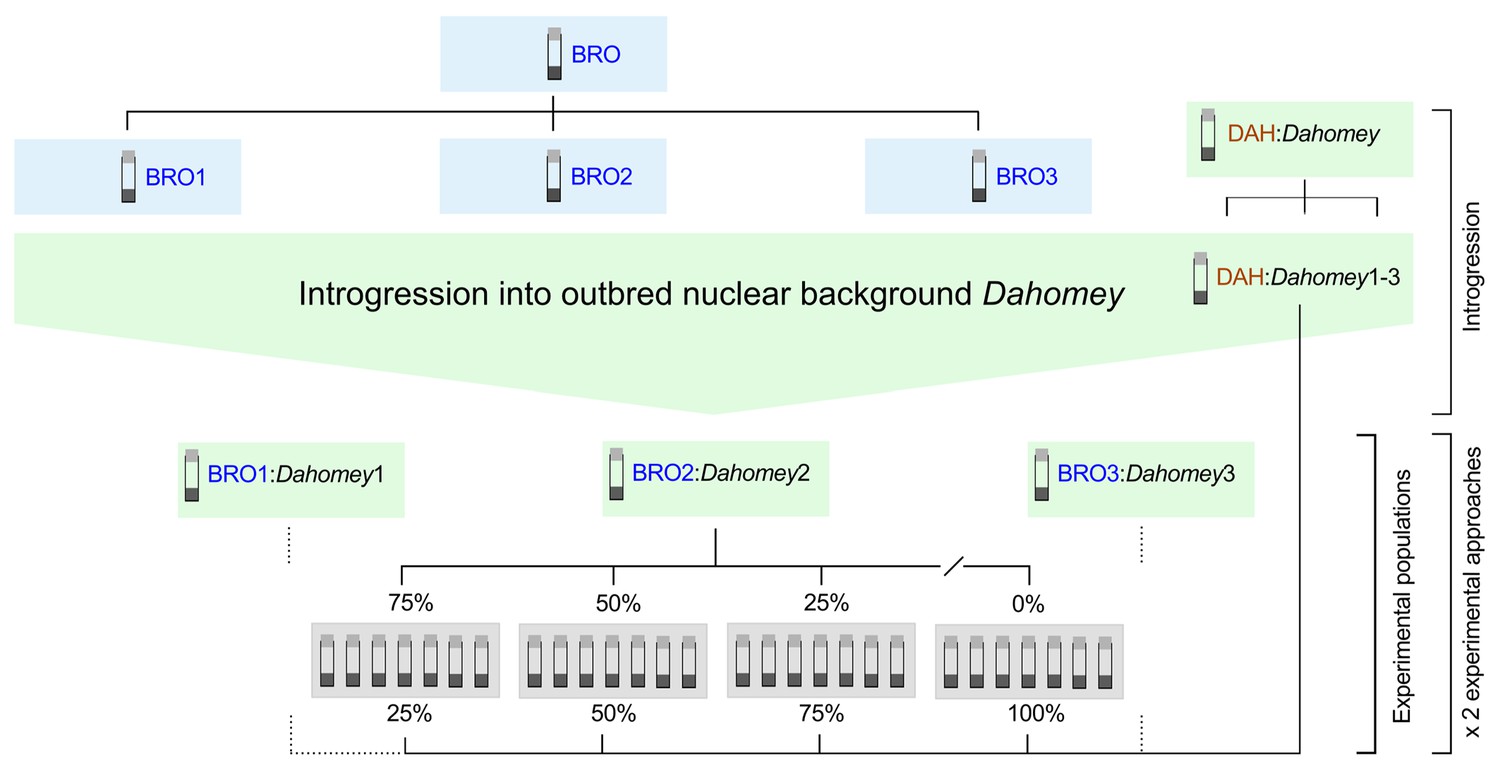
Experimental breeding scheme.
The TFT-bearing BRO haplotype and the putatively healthy DAH haplotype were introgressed into the outbred nuclear background Dahomey in three independent replicates (i.e. BRO:Dahomey1-3; DAH:Dahomey1-3). Experimental populations were established by supplementing DAH:Dahomey test populations (DAH:Dahomey1-3) with varying contributions of fly pairs bearing the TFT haplotype (0%, 25%, 50%, 75%) sourced from the corresponding BRO:Dahomey replicate population (i.e. DAH:Dahomey1/BRO:Dahomey1; DAH:Dahomey2/BRO:Dahomey2; DAH:Dahomey3/BRO:Dahomey3). For each of the three biological replicates and for each treatment class (0%, 25%, 50%, 75%), we established seven technical replicate populations. These experimental populations were further duplicated, one cohort providing populations for the regulated population size approach (Experiment 1), and one cohort for the fluctuating population size approach (Experiment 2).
Tables
Table 1
Mean offspring numbers, TFT haplotype frequencies, and genotyping outcomes for the two experiments (regulated conditions and fluctuating conditions).
| TFT treatment (starting frequency) | 0% TFT | 25% TFT | 50% TFT | 75% TFT | ||
|---|---|---|---|---|---|---|
| Populations [n] | 21 | 21 | 21 | 21 | ||
| Experiment | Regulated | F1 Frequency | 0.00 | 0.26 ± 0.03 | 0.44 ± 0.03 | 0.63 ± 0.03 |
| F5 Frequency | 0.00 | 0.15 ± 0.03 | 0.63 ± 0.03 | 0.71 ± 0.02 | ||
| F10 Frequency | 0.00 | 0.17 ± 0.03 | 0.67 ± 0.03 | 0.80 ± 0.03 | ||
| Loss | - | 4 | 0 | 0 | ||
| Fixation | - | 0 | 0 | 3 | ||
| Heteroplasmy | - | 0 | 0 | 0 | ||
| Mean offspring number (F10) | 74.15 ± 1.00 | 72.05 ± 0.89 | 67.43 ± 0.99 | 66.38 ± 0.70 | ||
| Population extinction | 1 | 0 | 0 | 0 | ||
| Fluctuating | F10frequency | 0.00 | 0.35 ± 0.06 | 0.59 ± 0.06 | 0.75 ± 0.05 | |
| Loss | - | 4 | 1 | 0 | ||
| Fixation | - | 1 | 4 | 4 | ||
| Heteroplasmy | - | 0 | 2 | 0 | ||
| Mean offspring number (F10) | 80.47 ± 5.12 | 81.19 ± 4.59 | 78.56 ± 5.63 | 85.86 ± 3.73 | ||
| Population extinction | 2 | 0 | 2 | 0 | ||
-
Table 1—source data 1
Raw data for offspring number and TFT frequency for Experiments 1 and 2.
Offspring number per population for each of 10 generations in Experiment 1 and 2. TFT frequency for each population at generations 1, 5 and 10 for Experiment 1 and at generation 10 for Experiment 2.
- https://doi.org/10.7554/eLife.23551.004
Table 2
(A) Linear mixed model showing effects of TFT treatment and generation number on mean offspring number, and (B) generalized linear mixed model of effects of TFT treatment and generation on TFT haplotype frequency of populations with regulated population size (Experiment 1). There was no evidence of overdispersion in the model of TFT haplotype frequency (dispersion parameter = 0.766), and addition of an observation-level random effect to the final model did not change this parameter (dispersion parameter = 0.767), nor the parameter estimates of the model.
| (A) Offspring number | (B) TFT frequency | |||||
|---|---|---|---|---|---|---|
| Fixed effects | χ2 | Df | p | χ2 | Df | p |
| TFT treatment | 2.23 | 3 | 0.53 | 38.14 | 2 | <0.001 |
| Generation | 14.73 | 9 | 0.10 | 6.21 | 2 | 0.045 |
| TFT treatment × generation | 51.09 | 27 | 0.003 | 23.52 | 4 | <0.001 |
| Random effects | SD* | SD* | ||||
| Biological replicate | 0.81 | - | - | 0 | - | - |
| Experimental population | 1.11 | - | - | 0 | - | - |
| Residual | 5.48 | - | - | - | - | - |
| * Standard deviation | ||||||
Table 3
Linear mixed model of association of TFT haplotype frequency on mean offspring number in populations with regulated population size (Experiment 1).
| Fixed effects | χ2 | Df | P |
|---|---|---|---|
| TFT frequency | 21.37 | 7 | 0.003 |
| Random effects | SD* | ||
| Biological replicate | 0.31 | - | - |
| Experimental population | 0 | - | - |
| Generation | 2.77 | - | - |
| Residual | 6.40 | - | - |
| * Standard deviation | |||
Table 4
(A) Linear mixed model showing effects of TFT treatment and generation on mean offspring number; and (B) generalized linear mixed model of effects of TFT treatment on TFT haplotype frequency of populations with fluctuating population size (Experiment 2). When reanalyzing mean offspring number (A), having excluded the 15 zero values in the dataset resulting from three vial extinctions (two from the TFT 0% treatment, and one from the TFT 50% treatment), the effect of TFT treatment on offspring number remained statistically non-significant (χ2=3.2, p=0.36). The binomial model of TFT frequency (b) indicated overdispersion (overdispersion parameter = 1.85), and thus an observation-level random effect was added (experimental population) to the model (overdispersion parameter of final model = 1.07).
| (A) Offspring number | (B) TFT frequency | |||||
|---|---|---|---|---|---|---|
| Fixed effects | χ2 | Df | P | 2 | Df | P |
| TFT treatment | 4.98 | 3 | 0.17 | 20.33 | 2 | <0.001 |
| Generation | 46.72 | 9 | <0.001 | - | - | - |
| Random effects | SD* | |||||
| Biological replicate | 3.1 | - | - | 0 | - | - |
| Experimental population | 11.2 | - | - | 1.32 | - | - |
| Residual | 20.85 | - | - | - | - | - |
| * Standard deviation | ||||||
Table 5
Linear model of association of TFT haplotype frequency on mean offspring number in populations with fluctuating population size (Experiment 2).
| Fixed effects | χ2 | Df | P |
|---|---|---|---|
| TFT Frequency | 4.95 | 9 | 0.839 |
| Random effects | SD* | ||
| Biological replicate | 0 | - | - |
| Residual | 24.93 | - | - |
| * Standard deviation | |||
Download links
A two-part list of links to download the article, or parts of the article, in various formats.
Downloads (link to download the article as PDF)
Open citations (links to open the citations from this article in various online reference manager services)
Cite this article (links to download the citations from this article in formats compatible with various reference manager tools)
Introduction of a male-harming mitochondrial haplotype via ‘Trojan Females’ achieves population suppression in fruit flies
eLife 6:e23551.
https://doi.org/10.7554/eLife.23551


