Stromule extension along microtubules coordinated with actin-mediated anchoring guides perinuclear chloroplast movement during innate immunity
- University of Delaware, United States
- University of California, Davis, United States
Figures
Figure 1 with 1 supplement
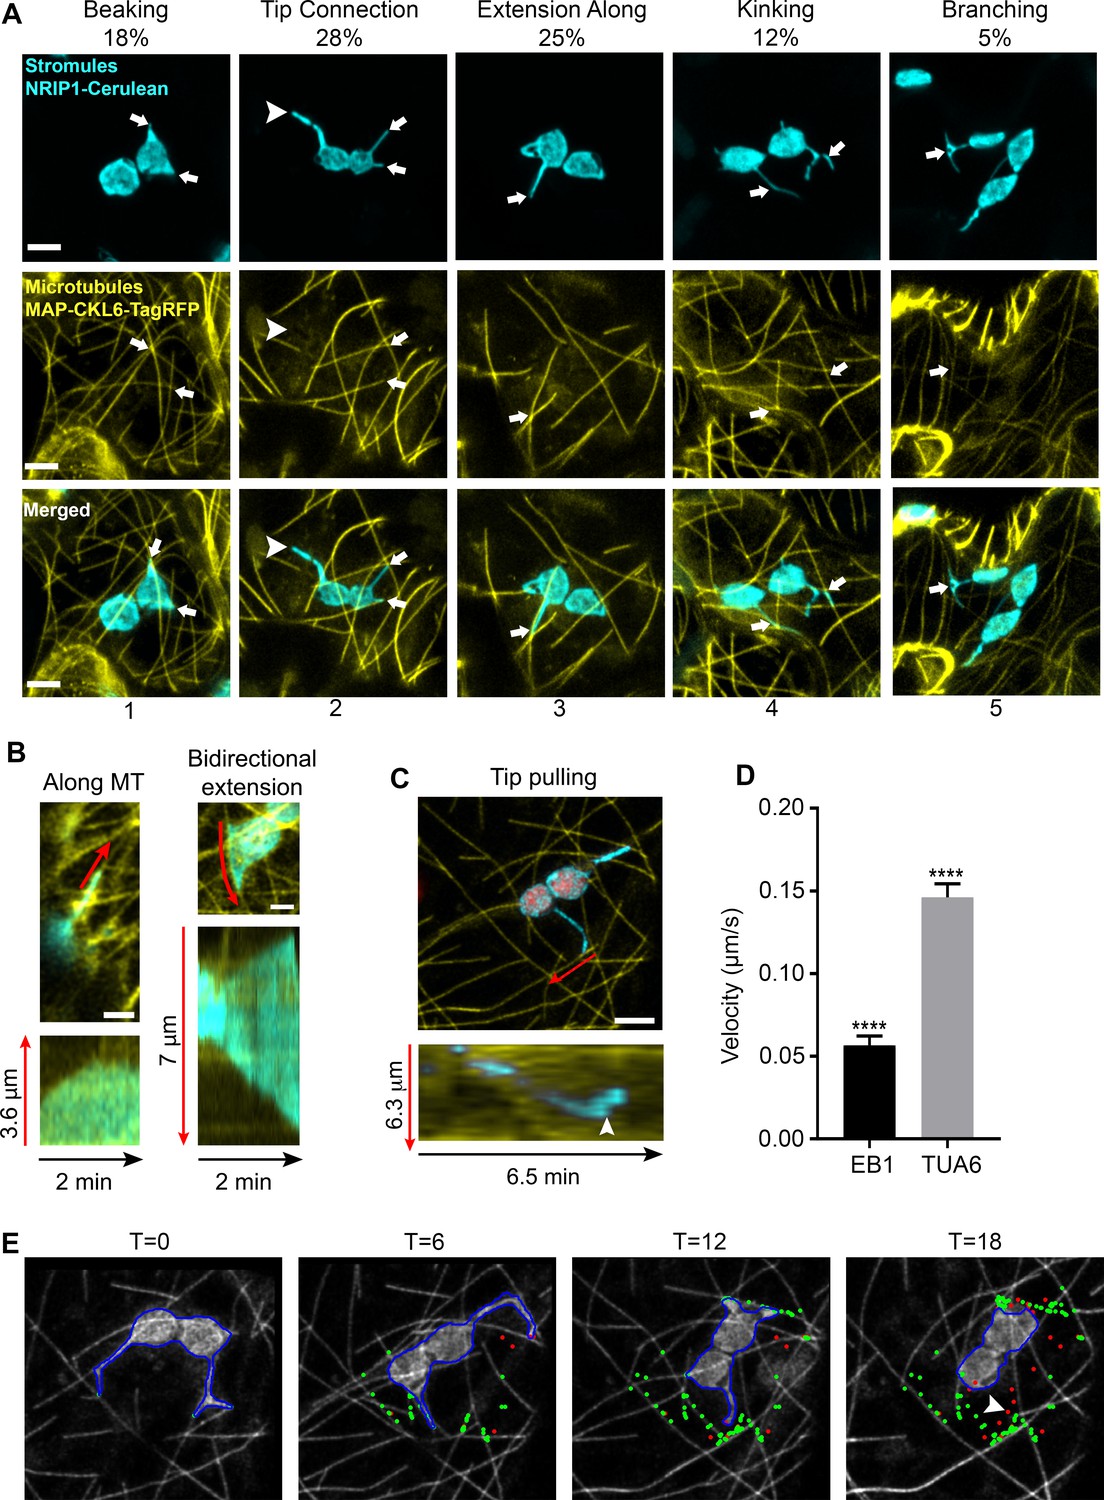
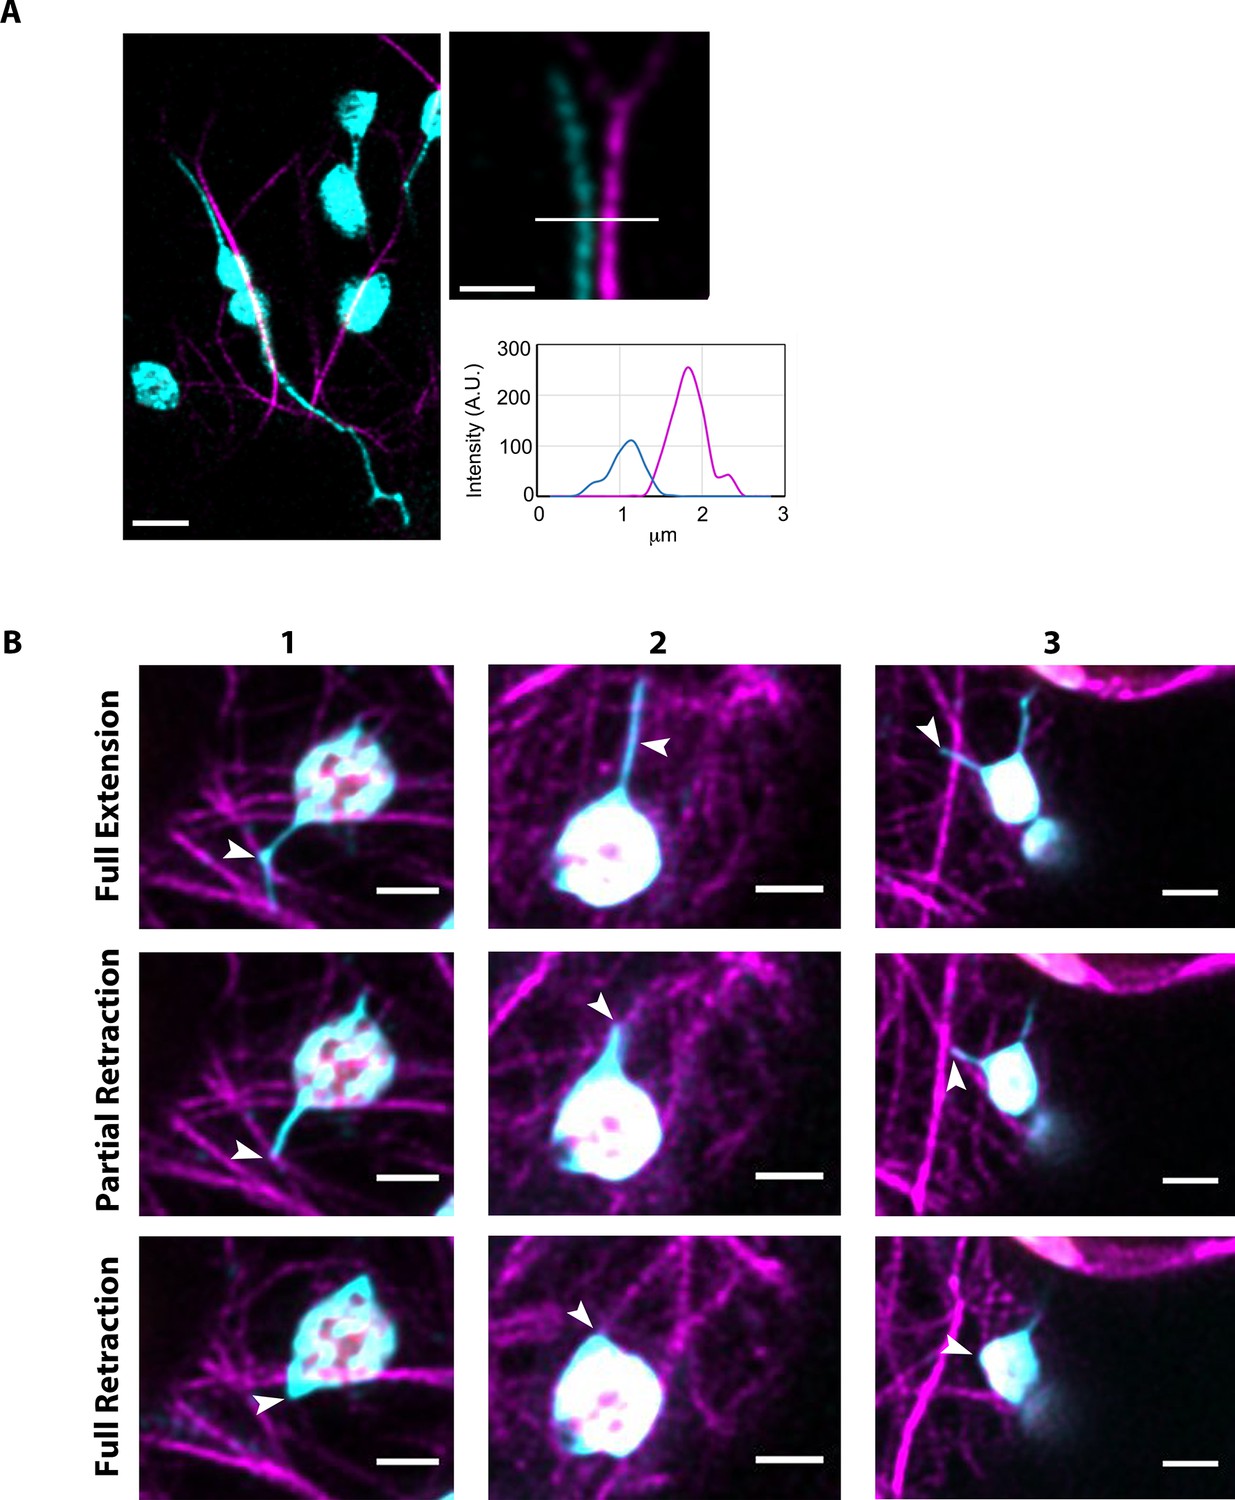
Chloroplast stromules extend along microtubules.
(A) MTs were marked by transiently expressing TagRFP-MAP-CKL6 (yellow) in N. benthamiana transgenic plants expressing NRIP1-Cerulean that marks stromules (cyan). Confocal micrographs of stromule-to-MT interactions in lower epidermal pavement cells are shown. Arrows indicate stromule beaking (1), tip contact (2), extension along (3), kinking (4) and branching (5) associations with MTs. Approximately 11% of stromules were not attached to MTs (2, arrowhead). Images are maximum intensity projection of confocal z-stacks. Scale bars equal 2 µm. Total of 103 stromules were observed in 11 biological replicates to generate this data. (B) Stromules were marked by expressing NRIP1(cTP)-TagRFP in transgenic GFP-TUA6 N. benthamiana plants. Time-lapse images were acquired and kymographs over 2 min were generated. Stromules were observed extending along MTs (left) and in both directions along MTs (right). Kymographs (bottom) were generated adjacent to the red lines in top images. (C) MTs were marked by expressing EB1-Citrine (yellow) in N. benthamiana transgenic lines expressing NRIP1-Cerulean that marks stromules (cyan). Stromules were observed extending with only the tip being pulled along MTs. Kymographs (bottom) were generated adjacent to the red lines in top image and show that a stromule tip translated along a MT at a constant rate and then rapidly changed direction (arrowhead). (D) The average velocity of stromules along MTs was calculated from manually tracked stromule tips moving along MTs marked with EB1-Citrine or GFP-TUA6. Data represented as the mean standard error of the mean (SEM), ****p<0.0001 by a Student’s t-test with Welch’s correction. (E) A stromule tip was tracked using a combination of fuzzy c-means and active contour algorithm, with shape analysis to calculate the length of the stromule, the tip velocity and the association with microtubules (Lu et al., 2017). Tip associations (green dots) with MTs (gray scale) were mapped over a time series. Tips not associating with MTs are depicted as red dots. Moving stromule tips were associated with MTs except when stromules were retracting (arrowhead).
-
Figure 1—source data 1
Statistical analysis of the stromule velocity along MT.
A raw data for the average stromule velocity along MT presented in Figure 1D.
- https://doi.org/10.7554/eLife.23625.005
Figure 1—figure supplement 1
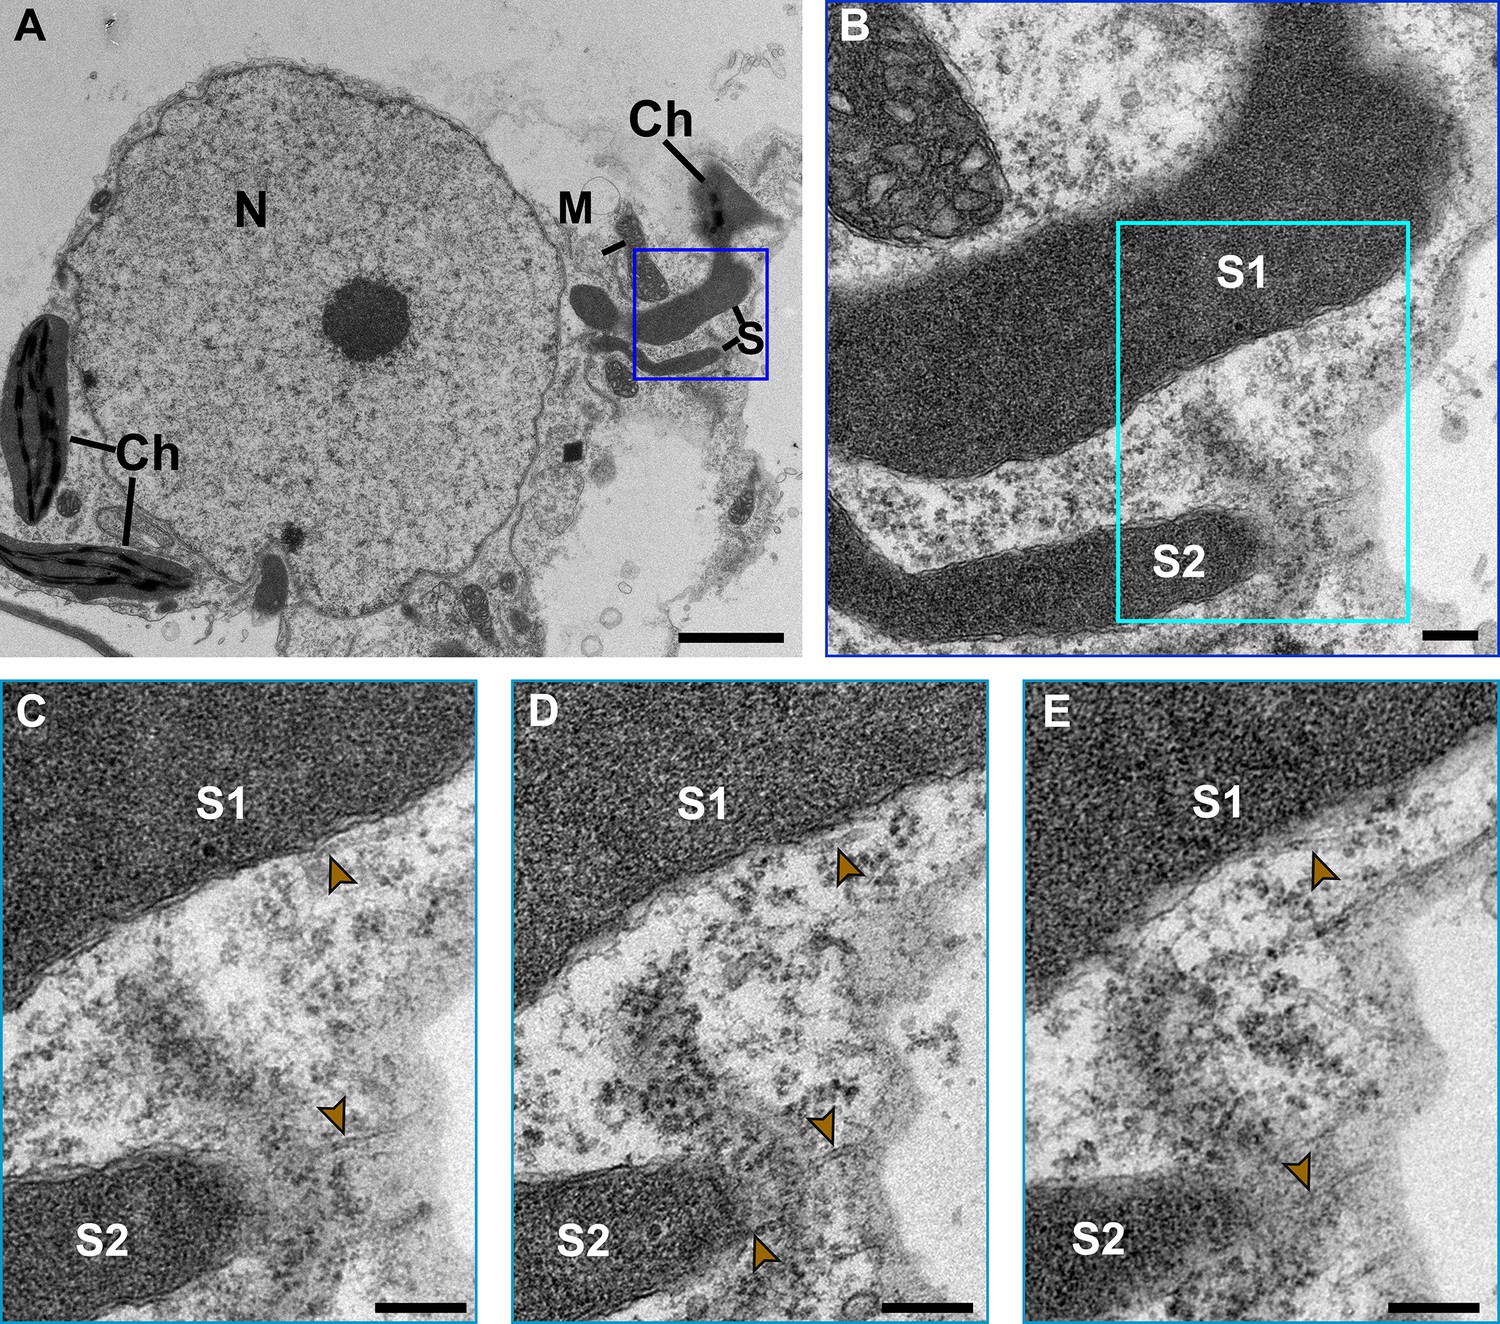
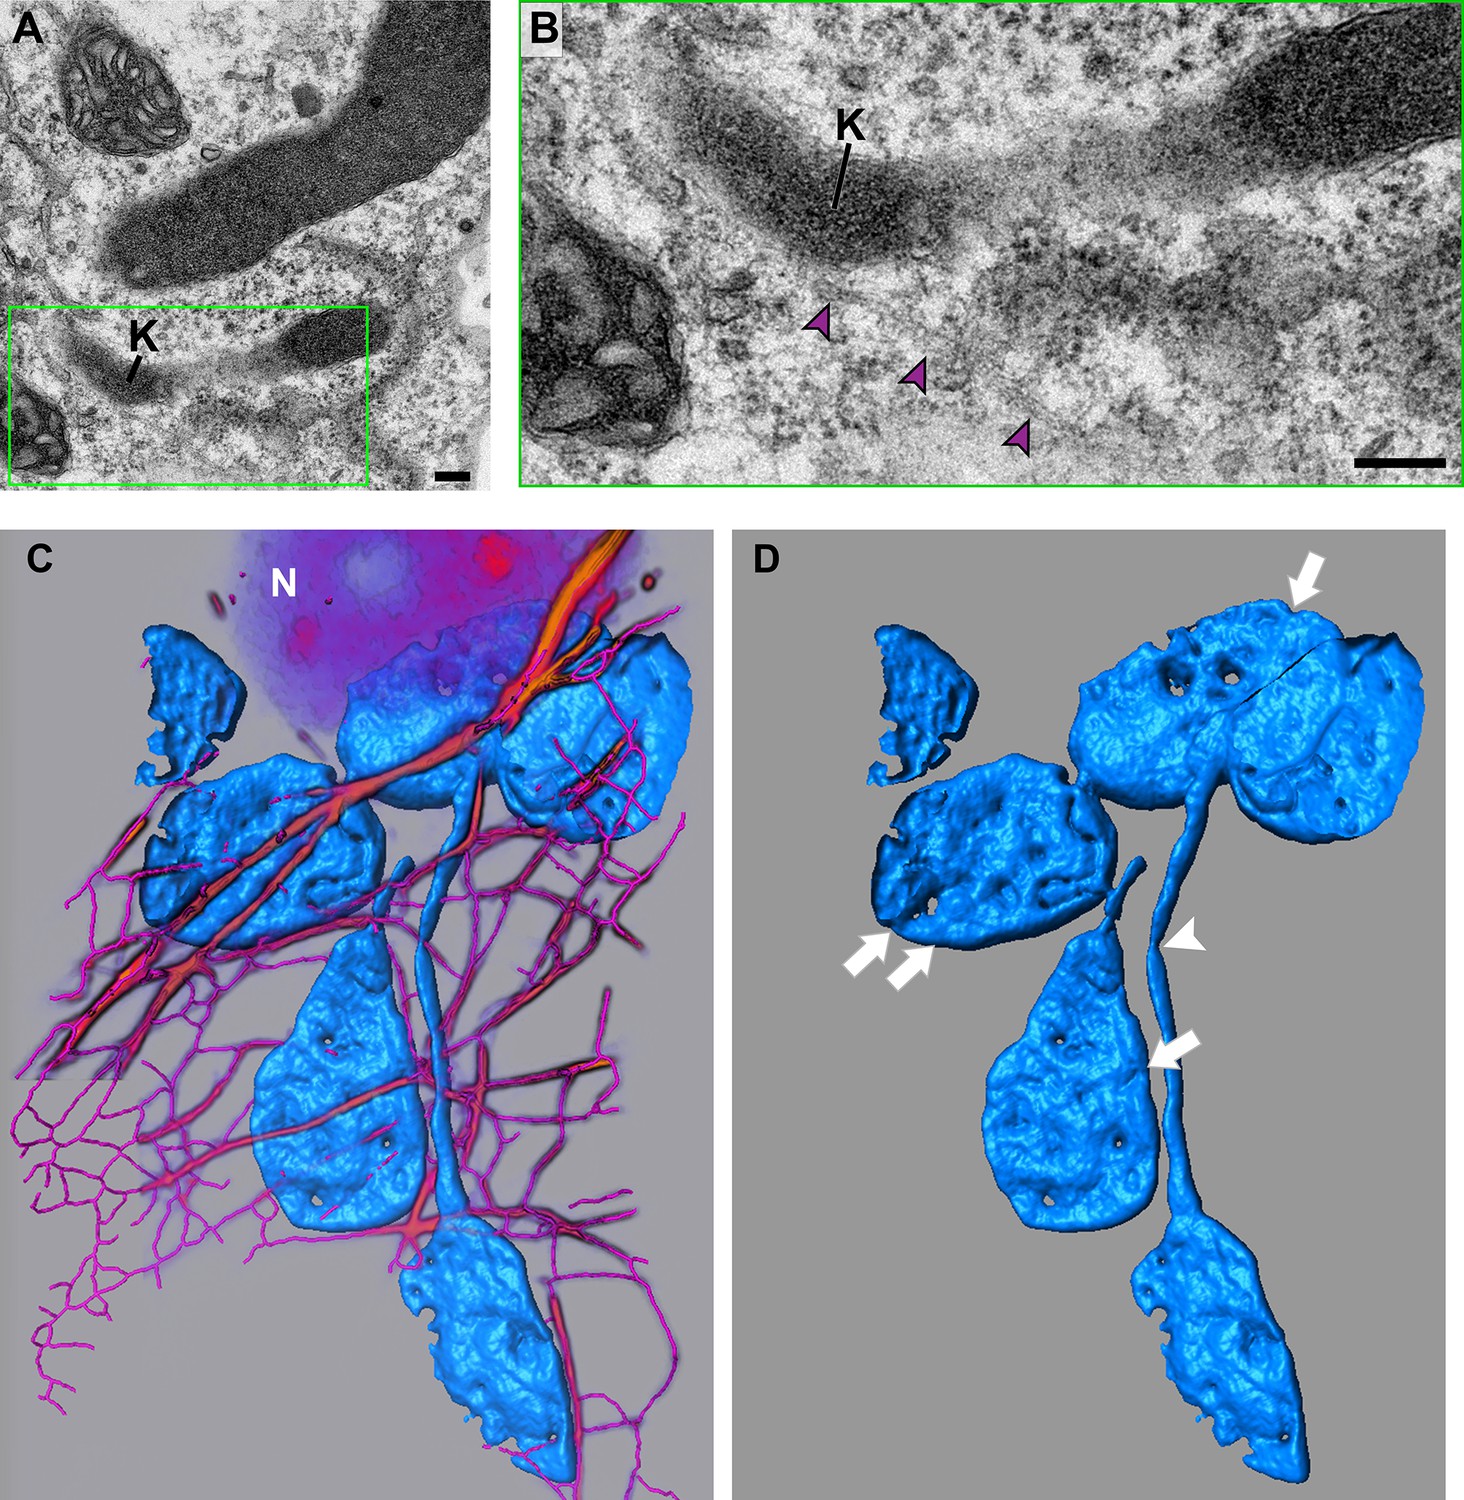
Transmission electron microscopy of stromule-to-microtubule interactions.
(A) Stromules were induced by transiently expressing the p50 effector for 42 hr in plants containing the N immune receptor. Serial sections were obtained and an overview montage image showing the position of stromules (S) in relation to the body of the chloroplast (Ch), mitochondrion (M), and nucleus (N). Scale bar equals 2 µm. (B) A magnified view of blue boxed area in A showing two stromules (S1, S2). (C) A further magnified area of the cyan boxed area in B shows close proximity of microtubules (gold arrow heads) along the side of a stromule (S1) and along the tip of a stromule (S2). (D, E) Two serial sections are shown to show the continuation of the close proximity of stromules to microtubules.
Figure 2
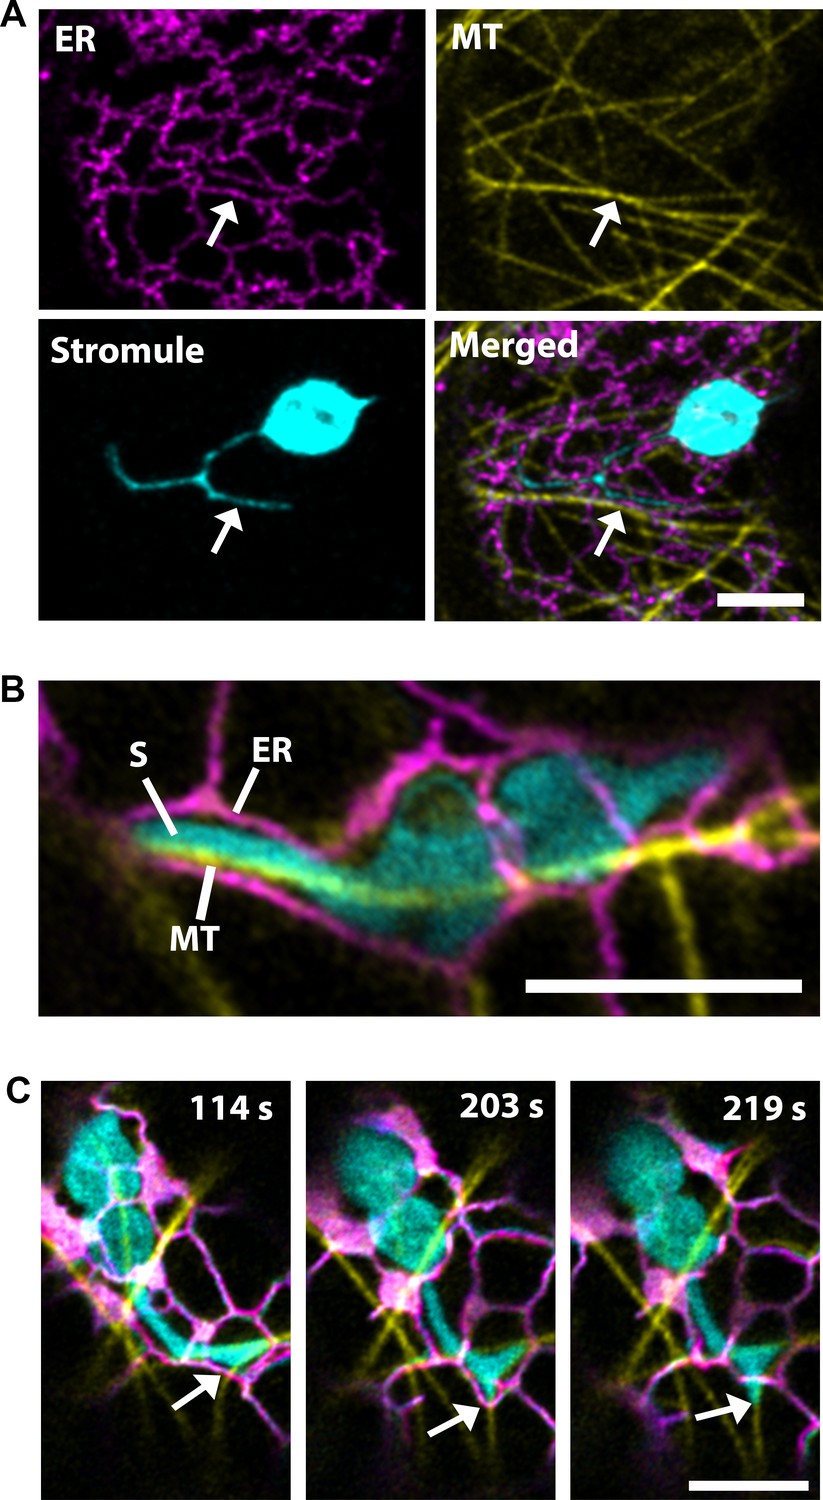
Microtubules direct stromule movement along the ER.
(A) The endoplasmic reticulum (ER) were marked by transiently expressing SP-Citrine-HDEL (magenta) and MTs were marked by TagRFP-MAP-CKL6 (yellow) in N. benthamiana transgenic lines expressing NRIP1-Cerulean that marks stromules (cyan). Confocal microscopy time-lapse images of lower epidermis of leaves indicating changes in stromule extension along MTs and push through the ER network (bottom right, merged). Arrows indicate stromule extension within an ER channel (ER) along MT. (B) High resolution airyscan confocal micrograph showing the interaction of the stromule (S) with the MT within the ER channel. (C) High-resolution time-lapse images showing the extension of stromules (cyan) along the MTs (yellow) within and away from the ER channel (magenta). Arrows indicate active stromule extension, while the ER follows the course of the extending stromule (203 s) followed by the ER remodeling (219 s) independent of the stromule extension. Scale bars equal 5 µm.
Figure 3
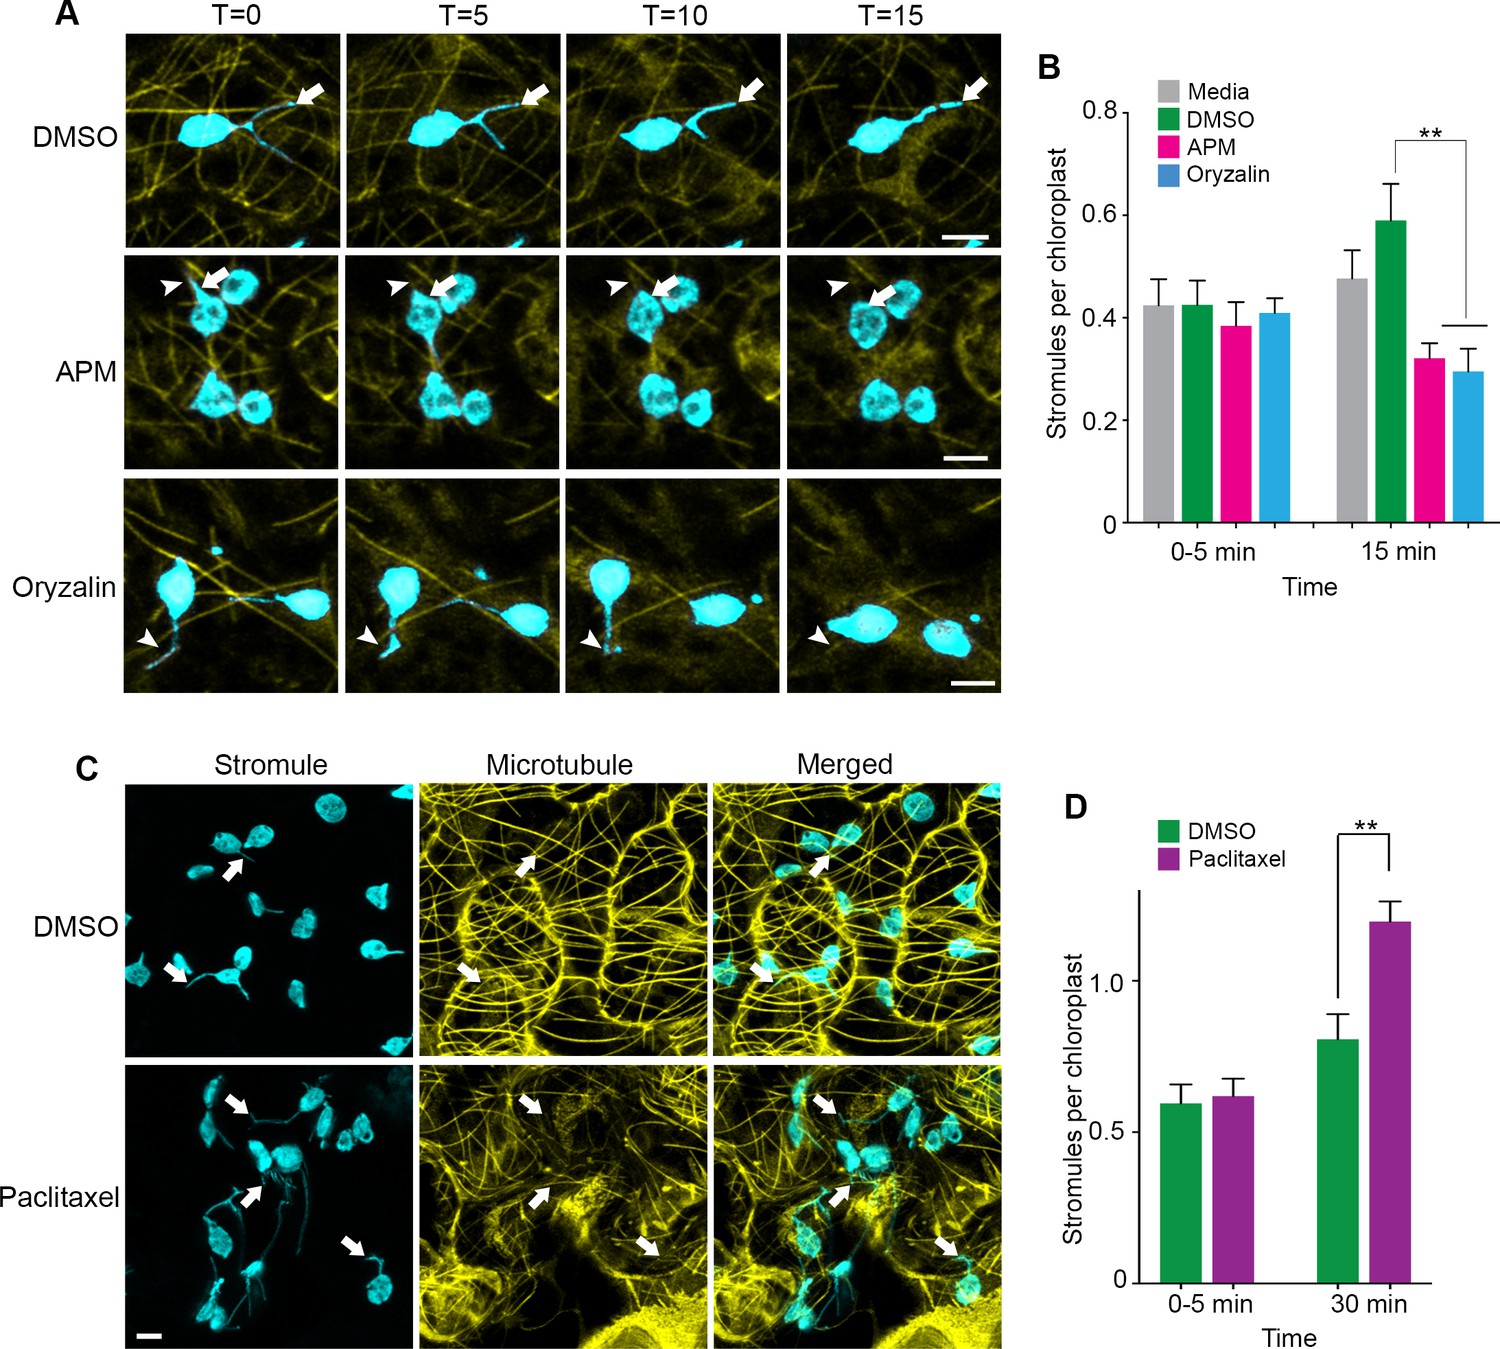
Microtubule disruption lead to stromule retraction and microtubule stabilization increased stromules.
(A) Dynamics of MT depolymerization and stromule retraction in the lower epidermis of NRIP1-Cerulean transgenic N. benthamiana plant leaves after infiltration of mock control (0.2% DMSO) or MT depolymerizing agents, APM (20 µM) or Oryzalin (300 µM). Images are maximum intensity projections represented at time points with a 5-min interval after infiltration. Arrows in mock (top row) indicate extended and branching stromules. MT depolymerization due to APM and Oryzalin causes simultaneous stromule retraction within 15 min (arrowhead; middle and bottom panels). A beaking was initiated but failed to progress to stromule (asterisk; middle and bottom panels). Scale bar equals 2 µm. (B) Stromules were increased by DMSO vehicle control treatment from 0 to 15 min compared to no significant increase from the infiltration media control. Compared to the DMSO vehicle control, stromules significantly decreased after treatment with APM (20 µM) and Oryzalin (300 µM) at 15 min and no other comparisons were significant. The experiment was repeated four times with three to five replicates per experiment. Error bars represent mean ± standard error of the mean (SEM) **p<0.05. (C) Treatment with microtubule stabilizing agent Paclitaxel (0.8 nM) produced multiple stromules from single chloroplast after 30 min (arrows, bottom left panel). The extended stromules overlapped with the MTs (arrows, merged panel). Images are maximum intensity projections. Scale bar equals 5 µm. (D) Paclitaxel treatment increased stromules per chloroplasts after 30-min treatment compared to mock treated leaves. The experiments were repeated four times with two replicates per experiment. Error bars indicate mean ± standard error of the mean (SEM) **p<0.05 by a Student’s t-test with Welch’s correction.
-
Figure 3—source data 1
Statistics of the stromule frequency under MT disrupting drug treatments.
Raw datapoints of stromule frequency after APM, Oryzalin, or Paclitaxel, presented in Figure 3B and D. Statistical analyses and the original graph generated by Prism7 were also included.
- https://doi.org/10.7554/eLife.23625.012
Figure 4 with 1 supplement
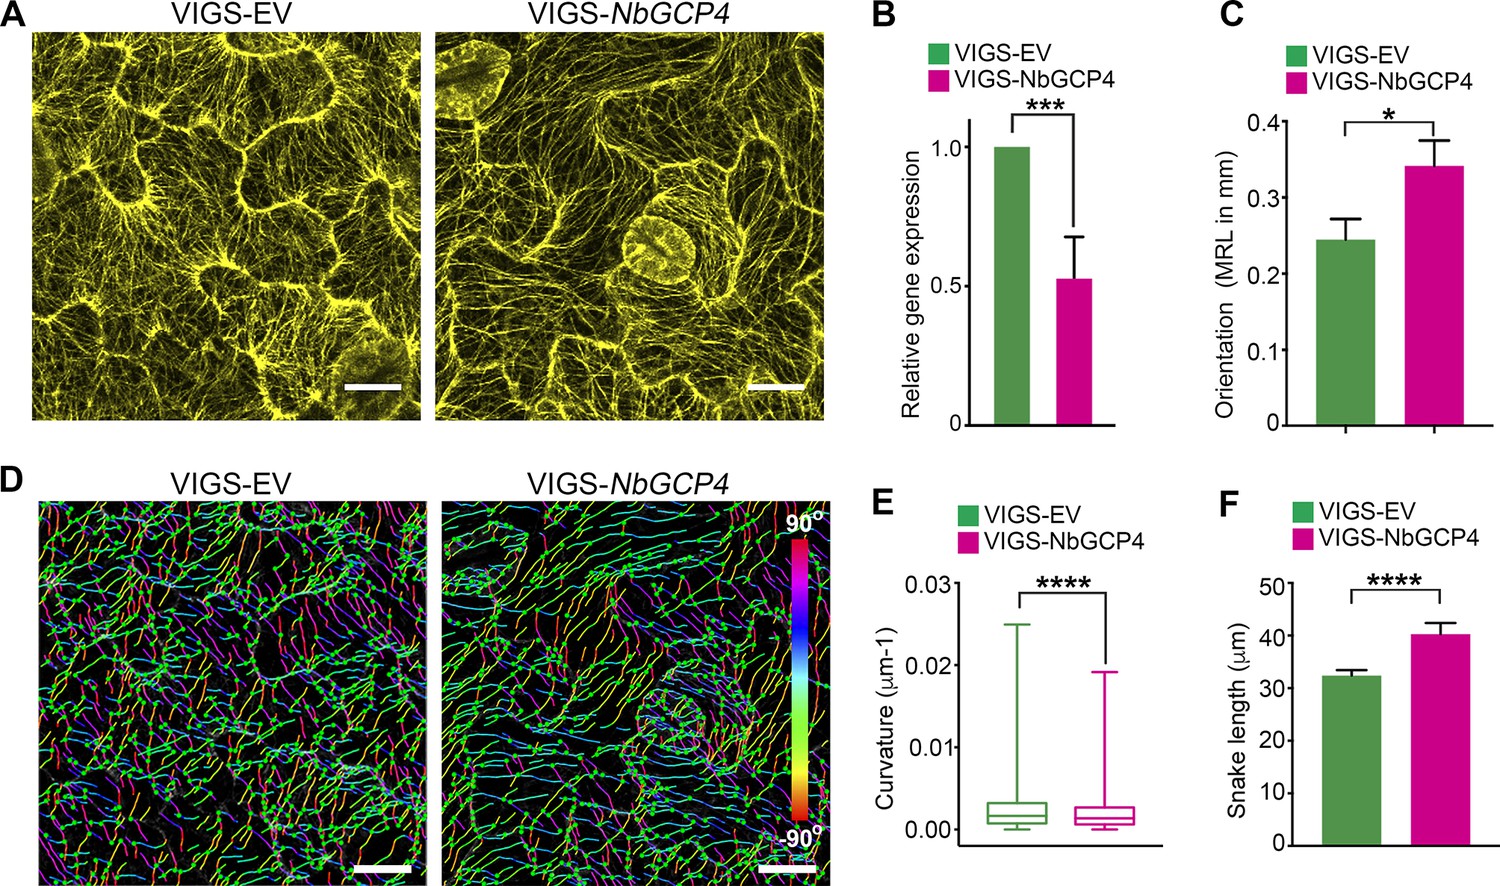
Alterations of MT is correlated with NbGCP4 silencing.
(A) In GFP-TUA6 transgenic N. benthamiana leaves that mark MTs (yellow), NbGCP4 silencing resulted in hyper-parallel and occasional bundling of MT (VIGS-NbGCP4, right) compared to the VIGS vector control (VIGS-EV, left). Images are maximum intensity projections of confocal z-stacks. Scale bar represents 40 µm. (B) qRT-PCR analysis of transcript levels of NbGCP4 in VIGS-EV control and VIGS-NbGCP4 plants showed a significant decrease in NbGCP4 transcript level 4 days after silencing by VIGS-NbGCP4 compared to the VIGS-EV control. Data represented as the mean +standard error of the mean (SEM), n = 12, ***p<0.001 (Student's t-test). (C) Azimuthal angles were analyzed by converting angles to mean resultant length (MRL) by converting the MT angles into individual vectors, adding the vectors together, and calculating the mean. MRL values are between 0 and 1, with 0 indicating that MT angles are random and one indicating all MT angles are the same and completely aligned. Data represented as the mean + standard error of the mean (SEM), *p<0.01 (student’s t-test). (D) SOAX analysis was conducted on the images in (A). MT filaments are color-coded based on the azimuthal angle so that parallel MTs are the same color. (E) Curvature analysis that measures the rate of change of tangent vectors shows MTs in VIGS-NbGCP4 have less curvature. Box covers from first to third quartiles while a bar in the middle of the box indicates median. Whiskers show from minimum to maximum. ****p<0.0001 by Mann-Whitney test. (F) Analysis of the snake length computed by SOAX analysis showed an increase in MTs length in VIGS-NbGCP4. Data represented as median and 95% confidence interval. ****p<0.0001 by Mann-Whitney test.
-
Figure 4—source data 1
Statistics of the quantitative RT-PCR to validate GCP4 gene silencing.
Statistical analyses and the graph of the quantitative RT-PCR for the NbGCP4 gene silencing presented in Figure 4B were generated by Prism7.
- https://doi.org/10.7554/eLife.23625.016
-
Figure 4—source data 2
Statistics of the Azimuthal angles of the MT in VIGS-NbGCP4 plants.
Statistical analyses and the graph of the Azimuthal angles of the MT in the NbGCP4 silenced plants presented in Figure 4C were generated by Prism7.
- https://doi.org/10.7554/eLife.23625.017
-
Figure 4—source data 3
Statistics of the curvature of MTs in VIGS-NbGCP4 plants.
Statistical analyses and the graph of the curvature of the MT in the NbGCP4 silenced plants presented in Figure 4E were generated by Prism7.
- https://doi.org/10.7554/eLife.23625.018
-
Figure 4—source data 4
Statistics of the SOAX analysis of MTs in VIGS-NbGCP4 plants.
Statistical analyses and the graph of the SOAX analysis of the MT in the NbGCP4 silenced plants presented in Figure 4F were generated by Prism7.
- https://doi.org/10.7554/eLife.23625.019
Figure 4—figure supplement 1
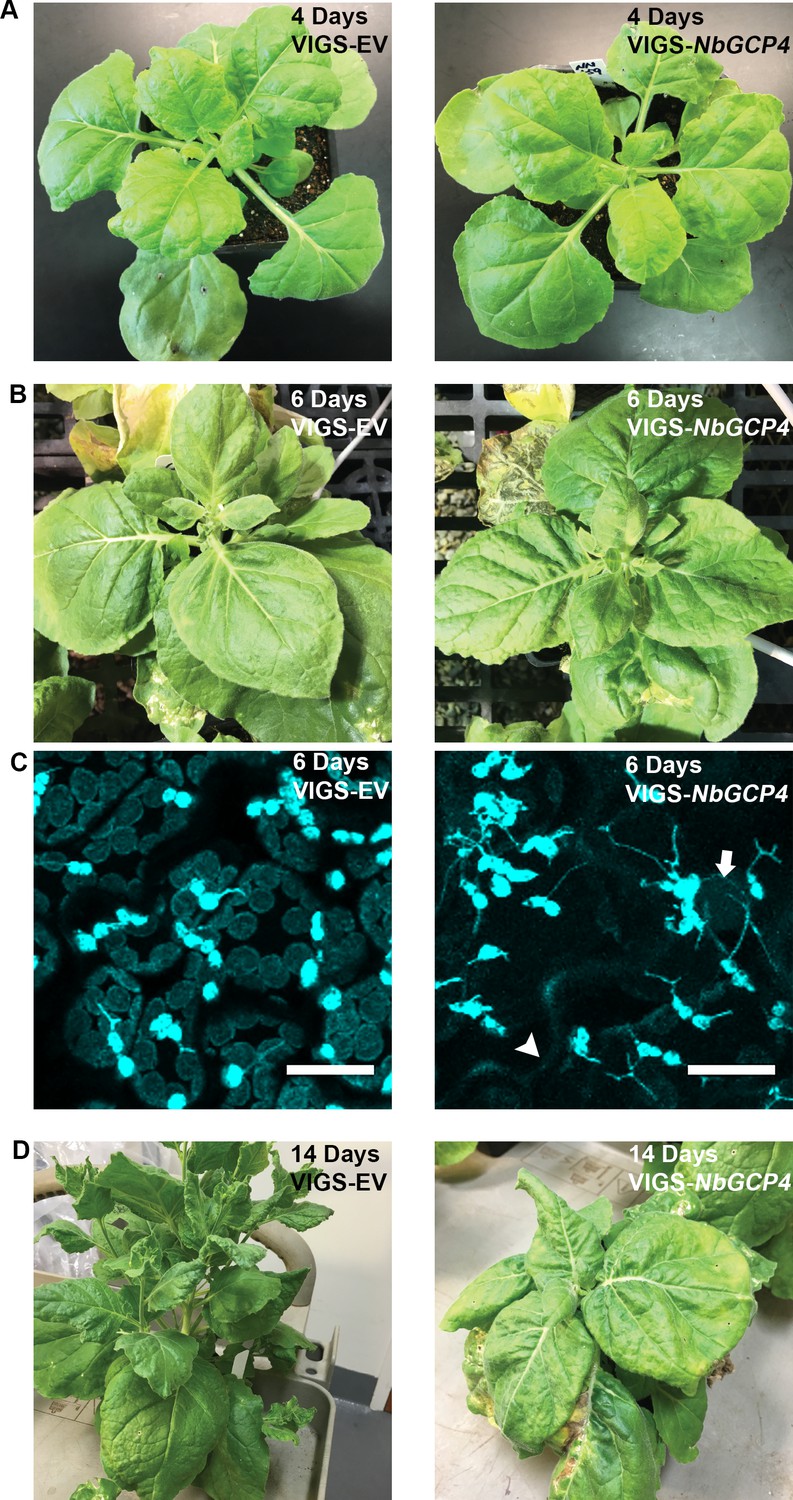
Plant morphology at different days post-silencing of NbGCP4 in NRIP1-Cerulean expressing N. benthamiana plants.
(A) Plants after 4 days of virus induced gene silencing of NbGCP4 (VIGS-NbGCP4) showed no detectable growth or morphological phenotype compared to VIGS vector (VIGS-EV) control plants. (B) Plants after 6 days of VIGS-NbGCP4 showed a growth defect and crinkled leaves compared to the VIGS-EV control plants. (C) Stromule induction and branched stromule phenotype in VIGS-NbGCP4 cells was more pronounced after 6 days of silencing compared to VIGS-EV control. However, NRIP1-Cerulean leaked out of chloroplasts and accumulated in the cytosol (arrowhead) and nucleus (arrow). (D) Plants after 14 days of NbGCP4 silencing showed growth arrest and variegated leaves. Each silencing experiment included four plants for VIGS-NbGCP4 and VIGS-EV. Experiment was repeated three times.
Figure 5 with 1 supplement
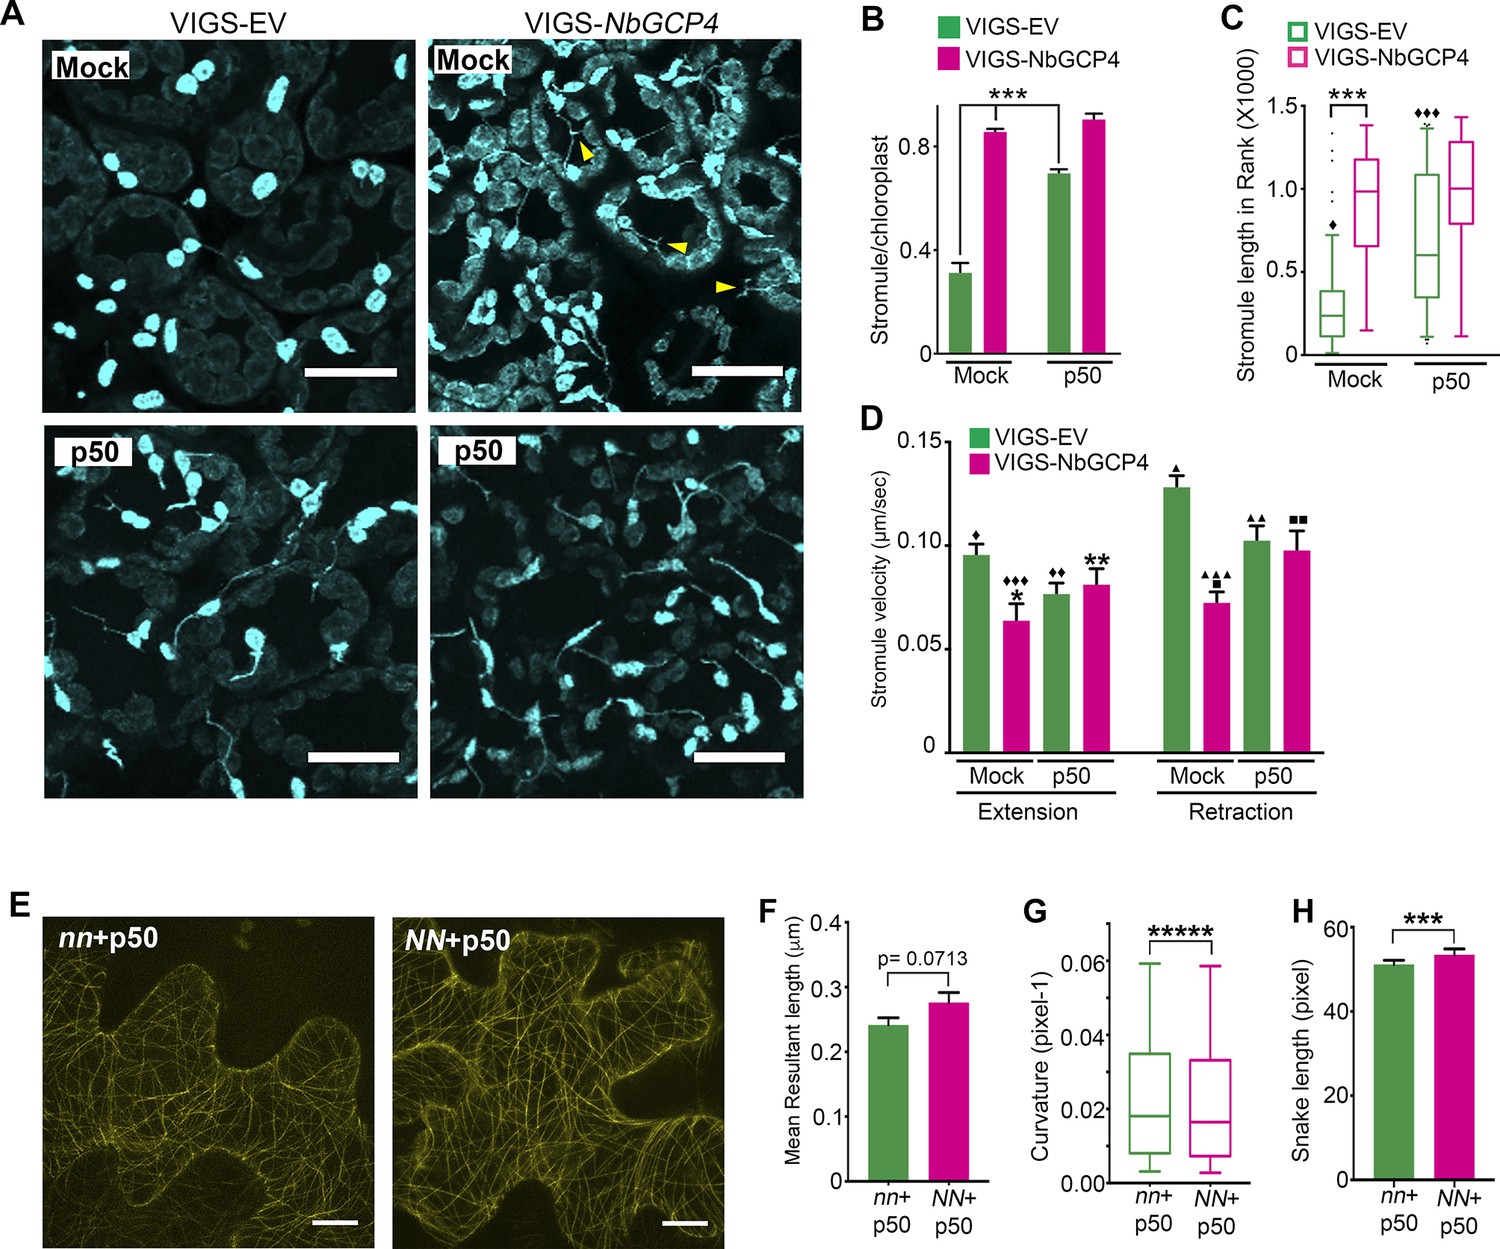
Microtubule stabilization induces stromules constitutively.
(A) Stromules were induced 24 hr after TMV-p50 effector infiltration as described in Caplan et al. (2015) (bottom left) compared to a mock control (top left). Stromules were induced both in mock (top right) and p50 infiltrated (bottom right) NbGCP4-silenced plants indicating that NbGCP4 silencing induces stromules constitutively. Stromules were often long and branched in mock-treated NbGCP4-silenced plants (top right, yellow arrowheads) compared to the VIGS-EV control (top left). Scale bar represents 40 µm. (B) Quantitative representation of stromules from A. Stromules were significantly induced in mock-treated NbGCP4-silenced plants compared to the mock-treated VIGS-EV control (compare left green bar and magenta bar). Stromules increased significantly in VIGS-EV control plants treated with p50 effector compared to the mock (compare green bars). No significant difference in stromule number was observed in NbGCP4-silenced mock-treated plants compared to the p50-treated plants (compare magenta bars). Four images per leaf were generated for quantification from total of 12 leaves for each condition. Data represented as the mean +standard error of the mean (SEM), ***p<0.001 (Student's t-test with Welch's correction). (C) Stromule length was significantly increased in mock-treated VIGS-NbGCP4 plants compared to the VIGS-EV control (left open bars). p50-effector-induced immune response increased stromule length in VIGS vector control plants compared to the mock-treated VIGS-EV control plants (compare green open bars). No significant change was observed between p50-treated and mock-treated VIGS-NbGCP4 plants (compare red open bars). Box and whisker plot was drawn with rank transformation. Box cover from first to third quartiles while a bar in the middle of box indicates median. Whiskers show from 5% to 95% of ranking. ***p<0.001, ⧫ comparison with VIGS-EV control, p<0.001 by Mann-Whitney test. Dots in the graph indicate outliers. (D) The velocity of stromule extension and retraction in VIGS-EV control and VIGS-NbGCP4 with or without TMV-p50-induced immune response. Data represented as the mean + standard error of the mean (SEM). Symbols at the top of bars indicate significant differences according to Dunnett’s multiple comparison test. Single symbol (*,⧫, ■), control set for each comparison; two-symbols (**,⧫⧫, ■■), p<0.05 and three-symbols (***,⧫⧫⧫, ■■■), p<0.001. Scale bars equal 40 µm. (E) TMV-p50-induced immune response resulted in hyper-parallel MTs (NN + p50, right) compared to the control (nn +p50, left) in transgenic N. benthamiana leaves that mark MTs (yellow). Images are maximum intensity projections of confocal z-stacks. Scale bar represents 20 µm. (F) Azimuthal angle differences of MT filaments were measured by the length of the arc. Data represented as the mean +standard error of the mean (SEM), p=0.0713 (Student’s t test with Welch’s correction). (G) Curvature analysis that measures the rate of change of tangent vectors shows MTs in NN + p50 have less curvature. Box covers from first to third quartiles while a bar in the middle of box indicates median. Whiskers show from minimum to maximum. *****p<0.00001 (Mann-Whitney test). (H) Analysis of the snake length computed by SOAX analysis showed an increase in MTs length in NN + p50. Data represented as median and 95% confidence interval. ***p<0.001 by Mann-Whitney test.
-
Figure 5—source data 1
Statistics of the stromule dynamics in VIGS-NbGCP4 plants.
Statistical analyses and the graph of the stromule frequency, length, and velocity in the NbGCP4 silenced plants presented in Figure 5B-D by Prism7 are included.
- https://doi.org/10.7554/eLife.23625.023
-
Figure 5—source data 2
Statistics of the MT alteration by TMV-p50 induced immune responses.
Statistical analyses and the graph of the MT distribution presented in Figure 5F-H were generated by Prism7.
- https://doi.org/10.7554/eLife.23625.024
Figure 5—figure supplement 1

Quantitative analysis of stromule length and movements.
(A) Stromule length was manually measured in ImageJ. Consistent with the independent measurement presented in Figure 5C, silencing of NbGCP4 (VIGS-NbGCP4) resulted in a higher percentage of stromules that were 3 μm or longer (pink) compared to VIGS empty vector (EV) control silenced plants. Total of 302, 162, 137, and 109 stromules were measured for VIGS-EV, VIGS-NbGCP4, VIGS-EV with TMV-p50, and VIGS-NbGCP4 with TMV p50, respectively. Fisher’s exact test was performed for comparison. *p<0.05 and ***p<0.0001. (B) Three types of stromule movement were manually tracked. More stable extension of stromule tips (green dot) was observed a smooth, constant motion with a linear trajectory (green line) (top row). Rapidly extending and retracting stromule tips (yellow dot) were sudden and produced an erratic trajectory (yellow line) (middle row). Stromule tips (magenta dot) moving sideways had no extension and moved tangential (magenta line) to the body of the chloroplast (bottom row). (C) Stromule movement types depicted in B were counted and the frequency of constant, smoothly extending stromules (green) was higher in NbGCP4-silenced samples. Total of 337, 186, 134, and 127 movements of stromules were recorded for VIGS-EV, VIGS-NbGCP4, VIGS-EV with TMV-p50, and VIGS-NbGCP4 with TMV p50, respectively. Chi-square test was performed to compare. *p<0.05, **p<0.001.
-
Figure 5—figure supplement 1—source data 1
Statistics of quantitative analysis of stromule length and movement in VIGS-NbGCP4 plants.
The statistics of quantitative analysis of stromule length and movement in VIGS-NbGCP4 plants by Prism7 is included the raw data points, statistical analyses, as well as the original graphs of Figure 5—figure supplement 1A and B.
- https://doi.org/10.7554/eLife.23625.022
Figure 6 with 3 supplements
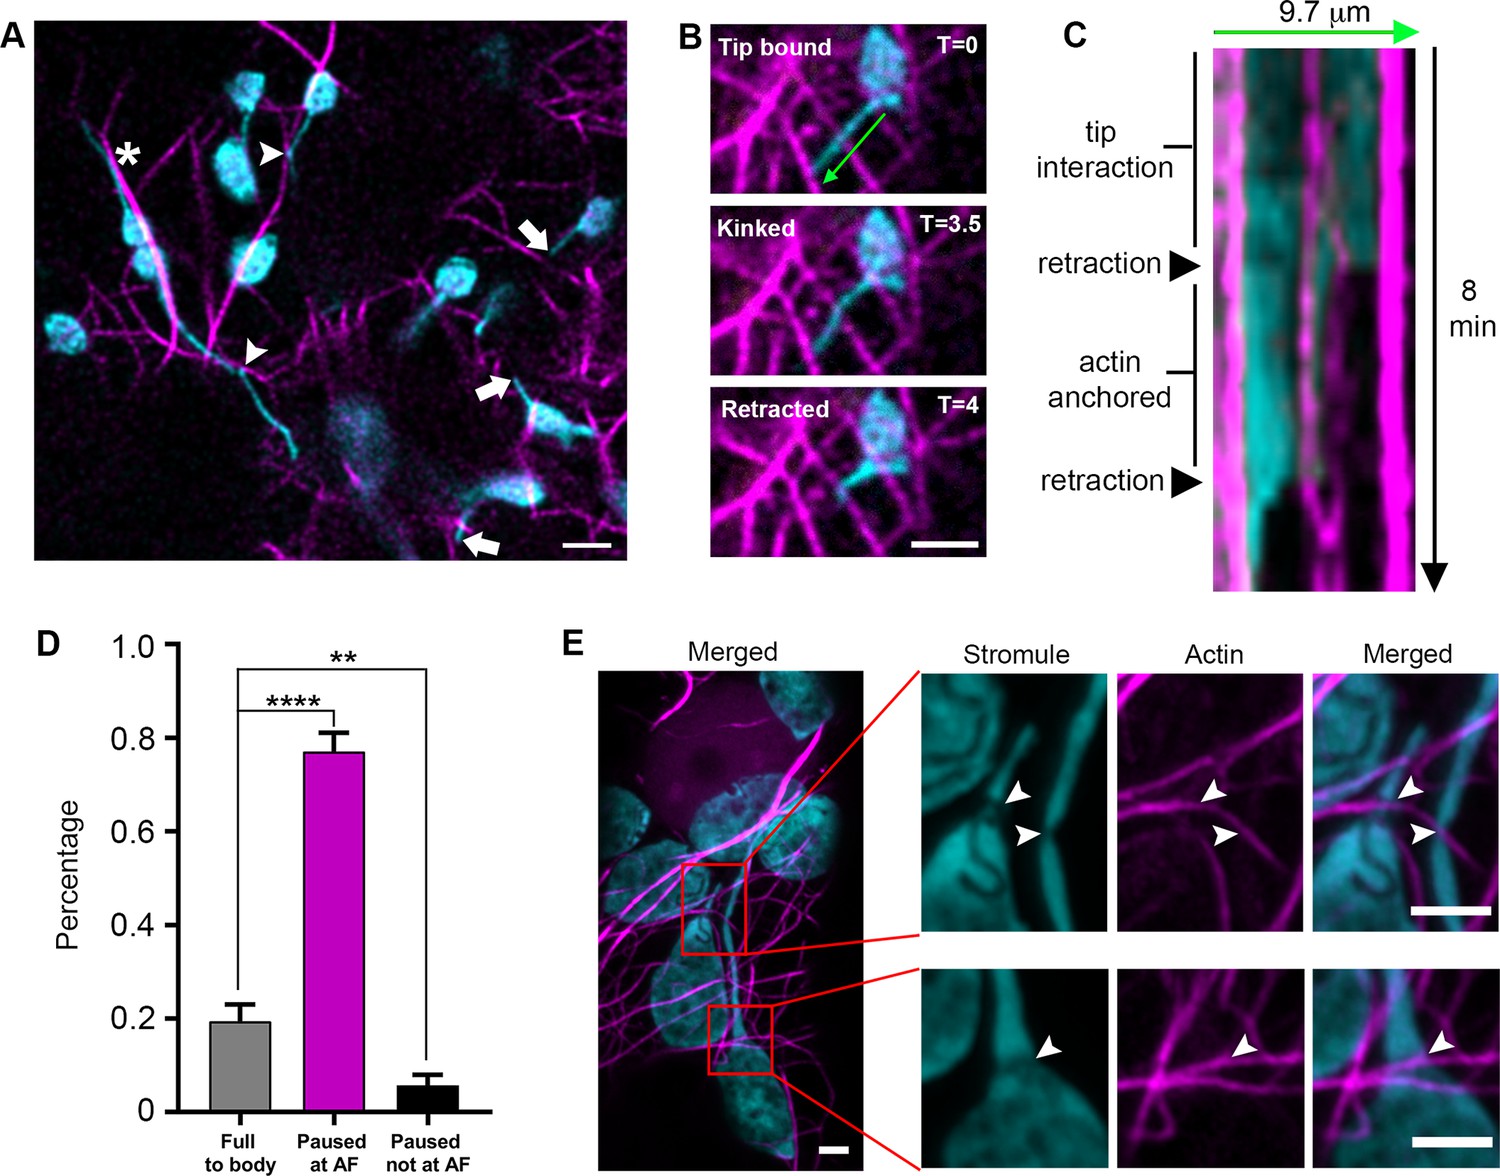
Stromule are anchored to the actin microfilament network.
(A) AFs were marked by expressing Lifeact-TagRFP (magenta) in N. benthamiana transgenic lines expressing NRIP1-Cerulean that marks stromules (cyan). Stromules were seen interacting with AFs at kink points (arrow heads). Tips were commonly seen not associated with AFs (Arrows). Stromules were occasionally seen oriented along AFs but not overlapping with AFs (*). Scale bar equals 5 µm. (B) An extended stromule with a tip in close proximity to an AF, became kinked at a point overlapping with an AF near the midpoint of the stromule, and retracted back to the kink point interacting with the AF. (C) A kymograph was created along the stromule adjacent to the 9.7 µm green line in panel B over 8 min. The stromule tip that was in close proximity to an AF and then rapidly retracts to an actin anchor. It remained attached to the actin anchor point for an additional 4 min before retraction to the body of the chloroplast. (D) The percent of stromules pausing at AFs during retraction events was quantified. No pausing resulted in a full retraction back to the body of the chloroplast (grey bar). Stromule retractions that did not retract completely and paused for multiple time frames showed a correlation of the paused stromule tip with an AF (magenta bar) or no correlation with an AF (black bar). Data was collected from 22 biological replicates spanning eight different experimental replicates. Eighty-two retraction events were quantified from 30 different cells. Data represented as the mean +standard error of the mean (SEM), **p<0.001, ****p<0.00001 (Student’s t test with Welch’s correction). (E) AFs were marked by expressing Citrine-mTalin (magenta) in N. benthamiana transgenic lines expressing NRIP1-Cerulean that marks stromules (cyan). High-resolution airyscan confocal micrographs revealed thinning points of stromule or chloroplast interactions with AFs (arrowheads). Scale bar equals 2 µm.
-
Figure 6—source data 1
Statistics of the quantification of stromules pausing at the AFs.
The raw data points to calculate the percentage of stromules pausing at the AFs during retraction events, presented in Figure 6D.
- https://doi.org/10.7554/eLife.23625.030
Figure 6—figure supplement 1
Chloroplast stromules statically interact with actin microfilaments.
(A) AFs were marked by expressing Lifeact-TagRFP (magenta) in N. benthamiana transgenic lines expressing NRIP1-Cerulean that marks stromules (cyan). Stromules were seen in close proximity to AFs (left). Magnified image (top right) and profile lines of fluorescence intensity (bottom right) show stromules do not overlap with AFs. Images are deconvolved confocal micrographs. Scale bars equal 2 µm. (B) Three additional representative examples showing an extended stromules (top row) that partially retracted to an AF (middle row) before fully retracting (bottom row). Example 1 shows a clear kink in the stromule similar to the example in Figure 6. Examples 2 and 3 show stromules that are slightly curved that partially retract near to the location of curvature. Scale bar equals 5 µm.
Figure 6—figure supplement 2
Characterization of actin microfilaments associated with stromules and the body of chloroplasts.
(A) Stromules were induced by transiently expressing the TMV-p50 effector for 42 hr in plants containing the N NLR immune receptor. A transmission electron micrograph overview montage showing the position of stromules (S) in relation to the body of the chloroplast (Ch), mitochondrion (M), and nucleus (N) can be found in Figure 1—figure supplement 1. Serial sections were acquired, and in one section a stromule with a kink (K) was seen associated with an AF bundle. (B) A magnified view of the boxed area (green) in A shows the close proximity of the AF bundle (arrowheads) with a stromule kink (K). Scale bar equals 2 µm. (C) The z-stack of confocal microscopy data represented Figure 6D was rendered in the Amira software package. The AF network was skeletonized (magenta) and thick bundles were volume rendered (orange). NRIP1-Cerulean (Cyan) in the chloroplast stroma was surface rendered. (D) The surface rendering of the NRIP1-Cerulean show grooves (arrows) along the body of the chloroplasts that correspond to the location of AFs. Thinning of the stromules was also evident (arrowhead).
Figure 6—figure supplement 3
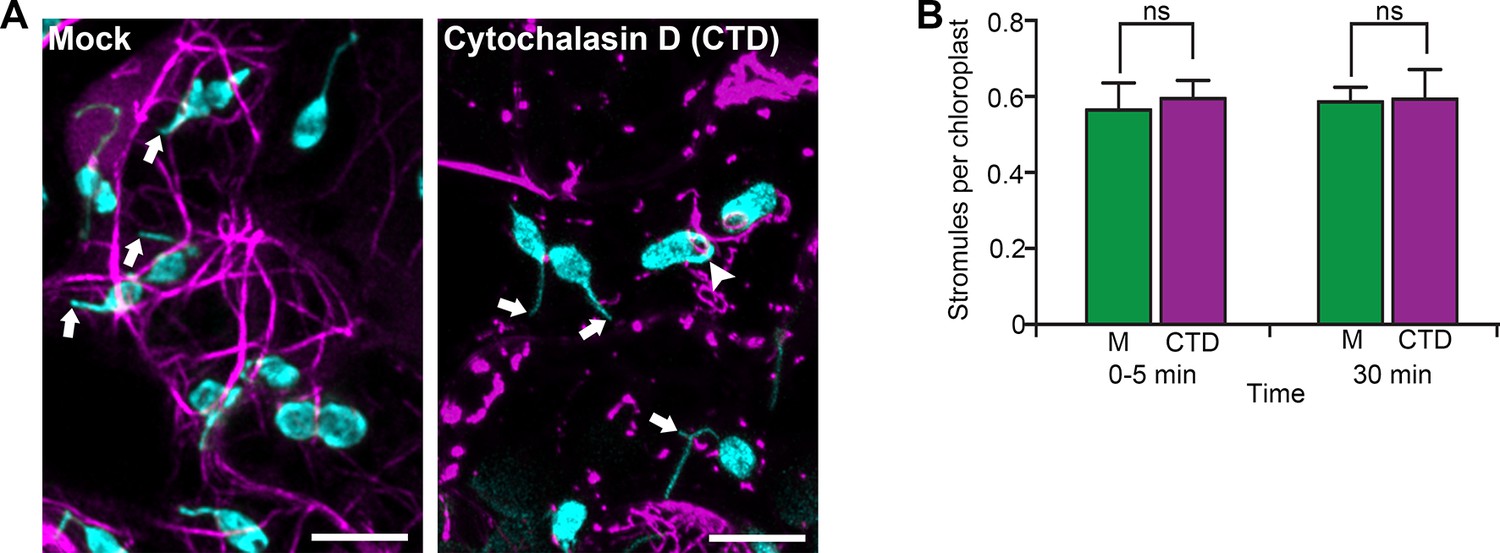
Disruption of actin filaments does not affect stromule number.
(A) AFs were marked by transiently expressing Citrine-mTalin (magenta) in N. benthamiana transgenic lines expressing NRIP1-Cerulean that marks stromules (cyan). Leaves were infiltrated with either Cytochalasin D (CTD; 200 µM) or a mock control. Arrows indicate free ends of the stromules in Mock and CTD treatments. Arrowhead indicates stromule in a loop attached to the plastid body after the treatment with CTD. Images are maximum intensity projections of deconvolved confocal z-stacks. Scale bars equal 10 µm. (B) CTD or mock (M) solution was infiltrated in leaves and imaged immediately (0–5 min) or after 30 min of treatment. There was no significant difference in stromule numbers following CTD treatment compared to mock control. The experiments were repeated more than three times. A total of 176, 208, 188, and 175 stromules from 320, 344, 310, and 297 chloroplasts were recorded for mock at 0–5 min, CTD 0–5 min, mock 30 min, and CTD 30 min after treatment respectively. Data was collected from 15 maximum intensity z-stack projections from five biological replicates for each condition. Error bars indicate mean ±standard error of the mean (SEM). ns, not significant at p=0.7943 and p=0.9894, respectively (Student’s t-test).
-
Figure 6—figure supplement 3—source data 1
Statistics of the stromule frequency after CTD treatment.
Statistical analyses and the stromule frequency after CTD treatment to disrupt actin cytoskeleton presented in Figure 6—figure supplement 3B were generated by Prism7.
- https://doi.org/10.7554/eLife.23625.029
Figure 7 with 1 supplement

Disruption of cytoskeleton change stromule dynamics.
(A) Time lapsed images of stromules 1 hr post-treatment with 1 µM of MT inhibitor oryzalin (ORY) or with 1 µM of actin inhibitor cytochalasin D (CTD) on the leaf of the NRIP1-Cerulean transgenic N. benthamiana. At these concentrations, ORY disrupt MT organization slightly while no visible effect on actin cytoskeleton. On the other hand, CTD showed significant disruption of the actin filament while no significant effect on MT organization (see Figure 7—figure supplement 1). The experiments were repeated three times with six replicates per treatment. Scale bar equals 20 µm. (B)-(D) Quantification of stromule dynamics in A. (B) Stromules length did not change significantly upon inhibitor treatments. (C) ORY treatment increased stromule extension velocity (magenta bars compared to green bars), while CTD treatment reduced the velocity of both stromule extension and retraction (blue bars compare to green bars). Data represented as the mean +standard error of the mean (SEM), ****p<0.0001 (Dunn’s multiple comparison test). (D) The frequency of constant, smoothly extending stromules was increased (left panel) and the frequency of sudden extending stromules decreased (right panel) with CTD treatment. ORY treatment showed no significant difference. Data represented as the mean +standard error of the mean (SEM), *p<0.05, (Mann-Whitney test).
-
Figure 7—source data 1
Statistics of the stromule dynamics.
All of the statistical analyses and the original graphs of the stromule dynamics presented in Figure 7B-D generated by Prism7 are shown.
- https://doi.org/10.7554/eLife.23625.035
Figure 7—figure supplement 1
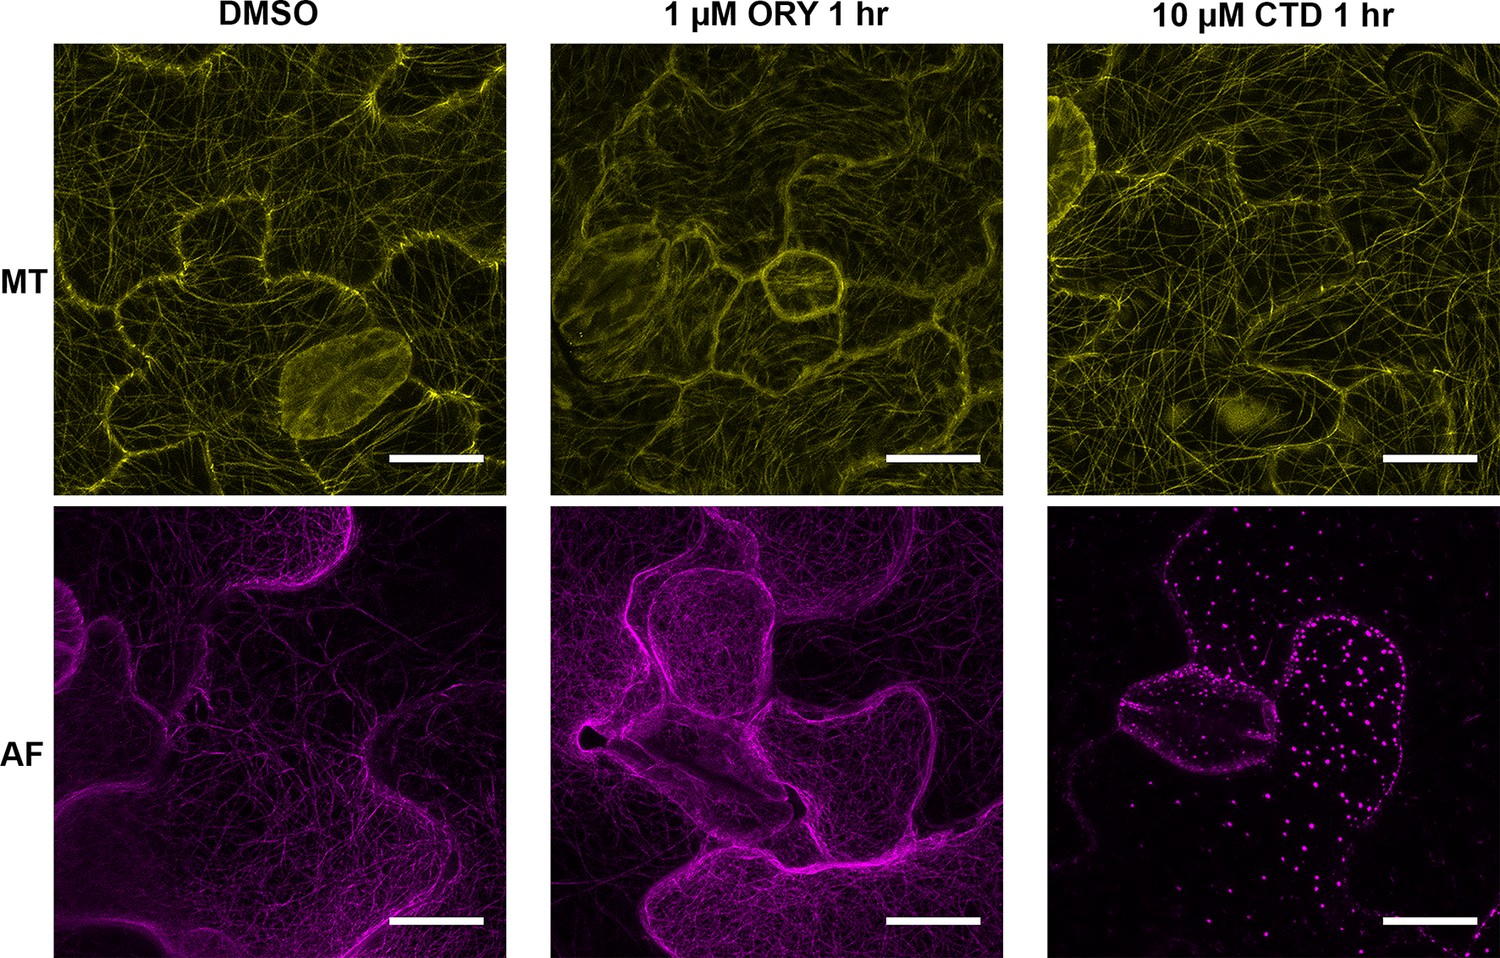
Effects of inhibitor treatments on the disruption of cytoskeleton.
N. benthamiana GFP-TUA6 transgenic plants were used to mark microtubule (MT, yellow) and N. benthamiana FABD2-GFP transgenic plants were used for actin filament (AF, magenta). Treatment with 1 µM Oryzalin (ORY) for one hour generated diffusion of GFP fluorescence and short MT fragments (top middle panel) compared to 0.1% DMSO control (top left panel). At this concentration of ORY, there was no major effect on AF compared to DMSO treatment (bottom left and middle panels). Treatment with 10 µM cytochalasin D (CTD) for 1 hr completely abolished actin cytoskeleton (bottom right panel) compared to DMSO control (bottom left panel). At this concentration of CTD, MT organization is relatively same as control (top right and left panels). All scale bars are 20 µm.
Figure 8 with 2 supplements

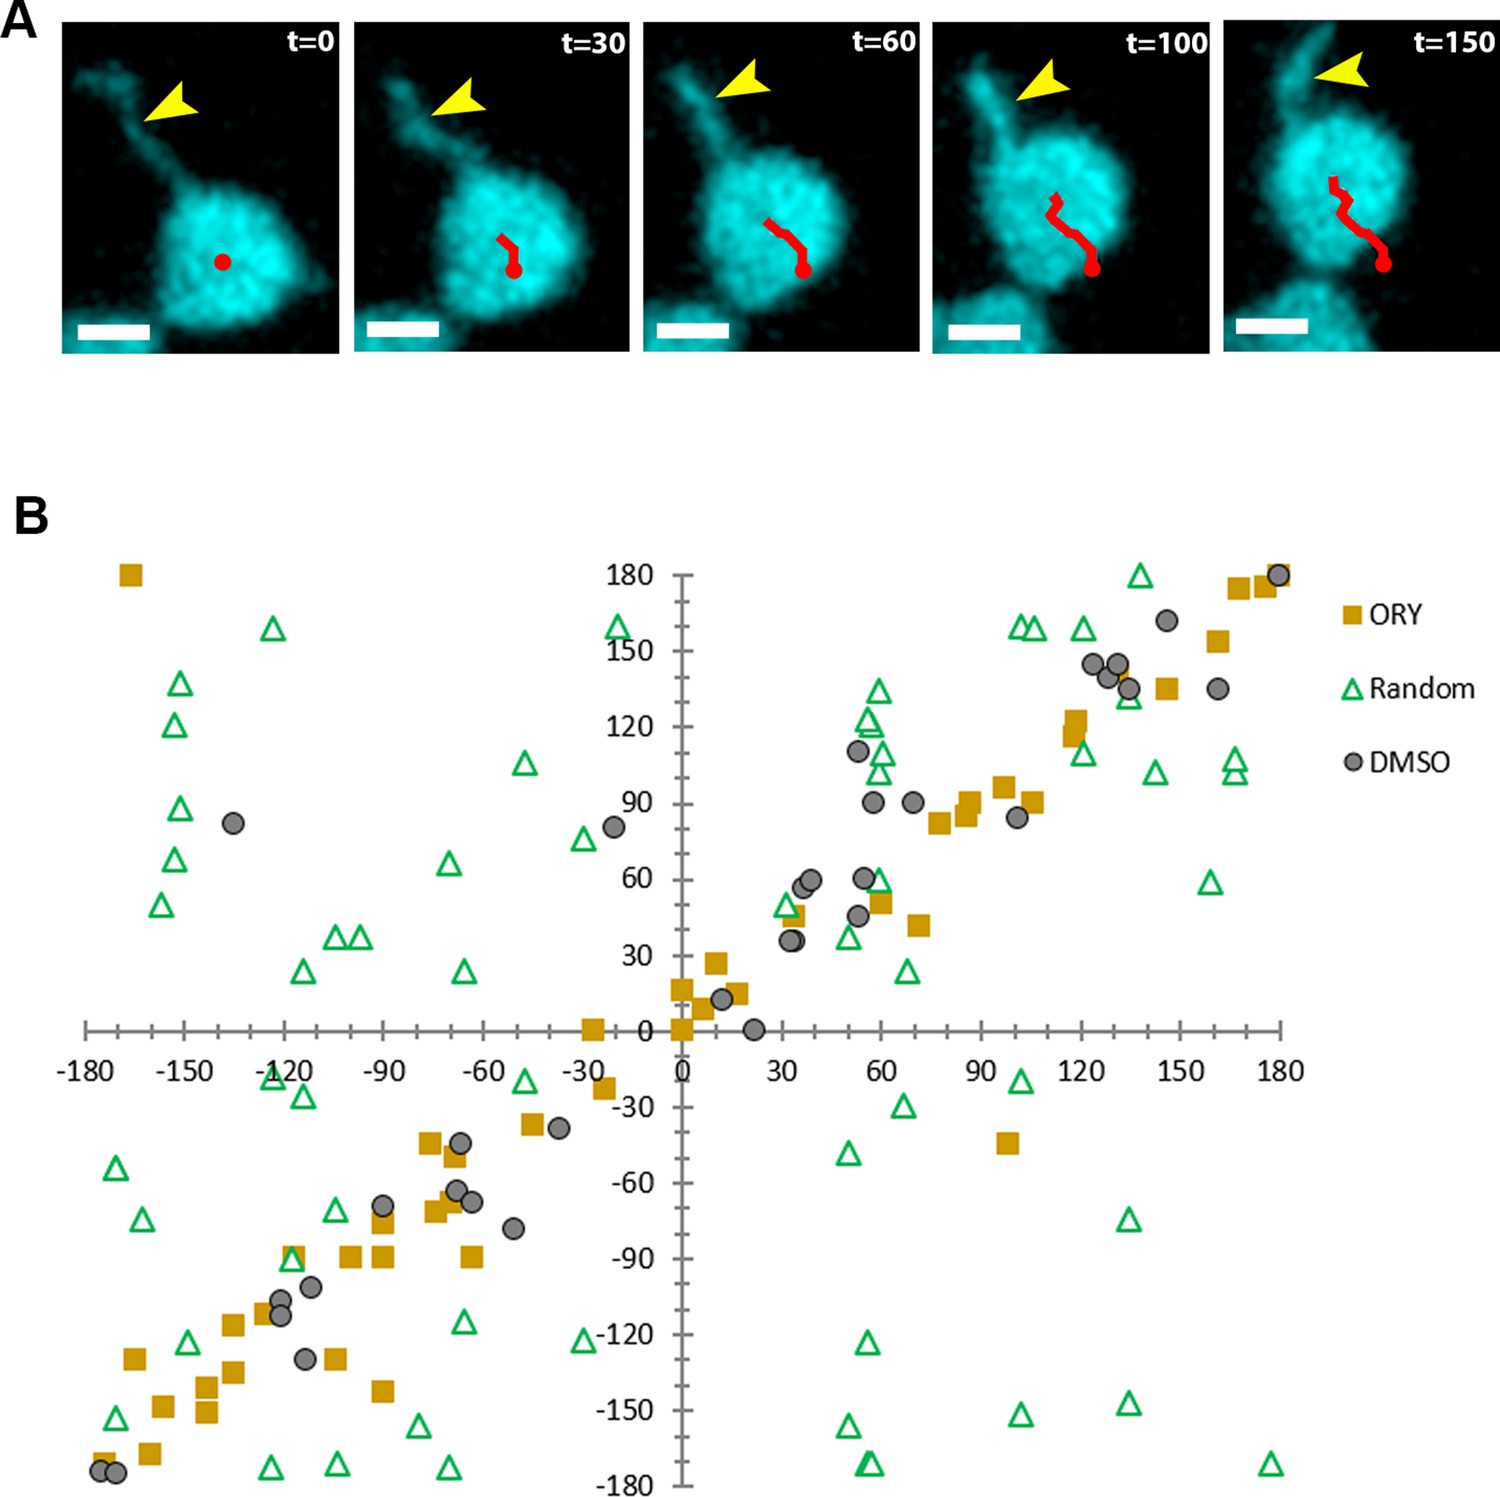
Stromule directed chloroplast movement.
(A) Stromules and chloroplast movement events were imaged in NRIP1-Cerulean N. benthamiana transgenic plants. A chloroplast was tracked (red line) in time lapsed images. The direction of movement was correlated with the direction of the stromule. A connected chloroplast (asterisk) moved with the stromule directed chloroplast. Time is measured in seconds and scale bars equal 2 µm. (B) AFs and stromules were marked by transiently expressing Lifeact-TagRFP (magenta) and NRIP1(cTP)-TagBFP (cyan) in N. benthamiana transgenic plants expressing GFP-TUA6 that marks MTs (yellow). The top row shows the merged images and the bottom row is an illustration highlighting the MT and actin dynamic events. At 0 min, the stromule tip is bound to a MT and a branch point is bound to an AF. At 1 min, the stromule extended along the MT. At 3 min, the stromule retracted to an actin anchor point. At 8 min, the stromule re-extended along a MT. At 9 min, the stromule retracted and correlated with chloroplast movement. Scale bar equals 5 µm. (C) The direction of the stromule connected to the chloroplast body and the direction of chloroplast movement were measured in FIJI ImageJ. The difference in angle was calculated and plotted. Both Mock and Oryzalin (ORY), showed a high frequency of values close to 0. Randomly generated values were used as a control. (D) The percent of chloroplast movement that were stromule directed movements were quantified. Cytochalasin D (CTD) treatment resulted in a complete halt of movement. Oryzalin (ORY) treatment caused a decrease in stromule directed movement compared to the DMSO vehicle control. Data represented as the ±SEM, ****p<0.0001, **p<0.01 (one-way ANOVA). (E) Stromules retract more frequently (ORY; pink bar) and extend less frequently (ORY; magenta bar) with oryzalin treatment. Data represented as the mean +standard deviation (SD), *****p<0.00001 by Mann-Whitney test.
-
Figure 8—source data 1
Statistical analyses of the stromule-directed movements.
Statistical analyses and the graph to support the stromule-directed movements presented in Figure 8D and E were generated by Prism7.
- https://doi.org/10.7554/eLife.23625.040
Figure 8—figure supplement 1
Stromule-directed movement.
(A) Stromules and chloroplast movement events were imaged in NRIP1-Cerulean N. benthamiana transgenic plants. (B) The orientation angle of the stromule connected to the chloroplast body (X-axis) and the movement of the chloroplast body (Y-axis) were plotted for the DMSO vehicle control, Oryzalin (ORY) treatment, and randomly generated control.
-
Figure 8—figure supplement 1—source data 1
Data of the stromule-directed movement.
The raw data points of the orientation angle of the stromule and the movement of the chloroplast body presented in Figure 8—figure supplement 1B.
- https://doi.org/10.7554/eLife.23625.038
Figure 8—figure supplement 2
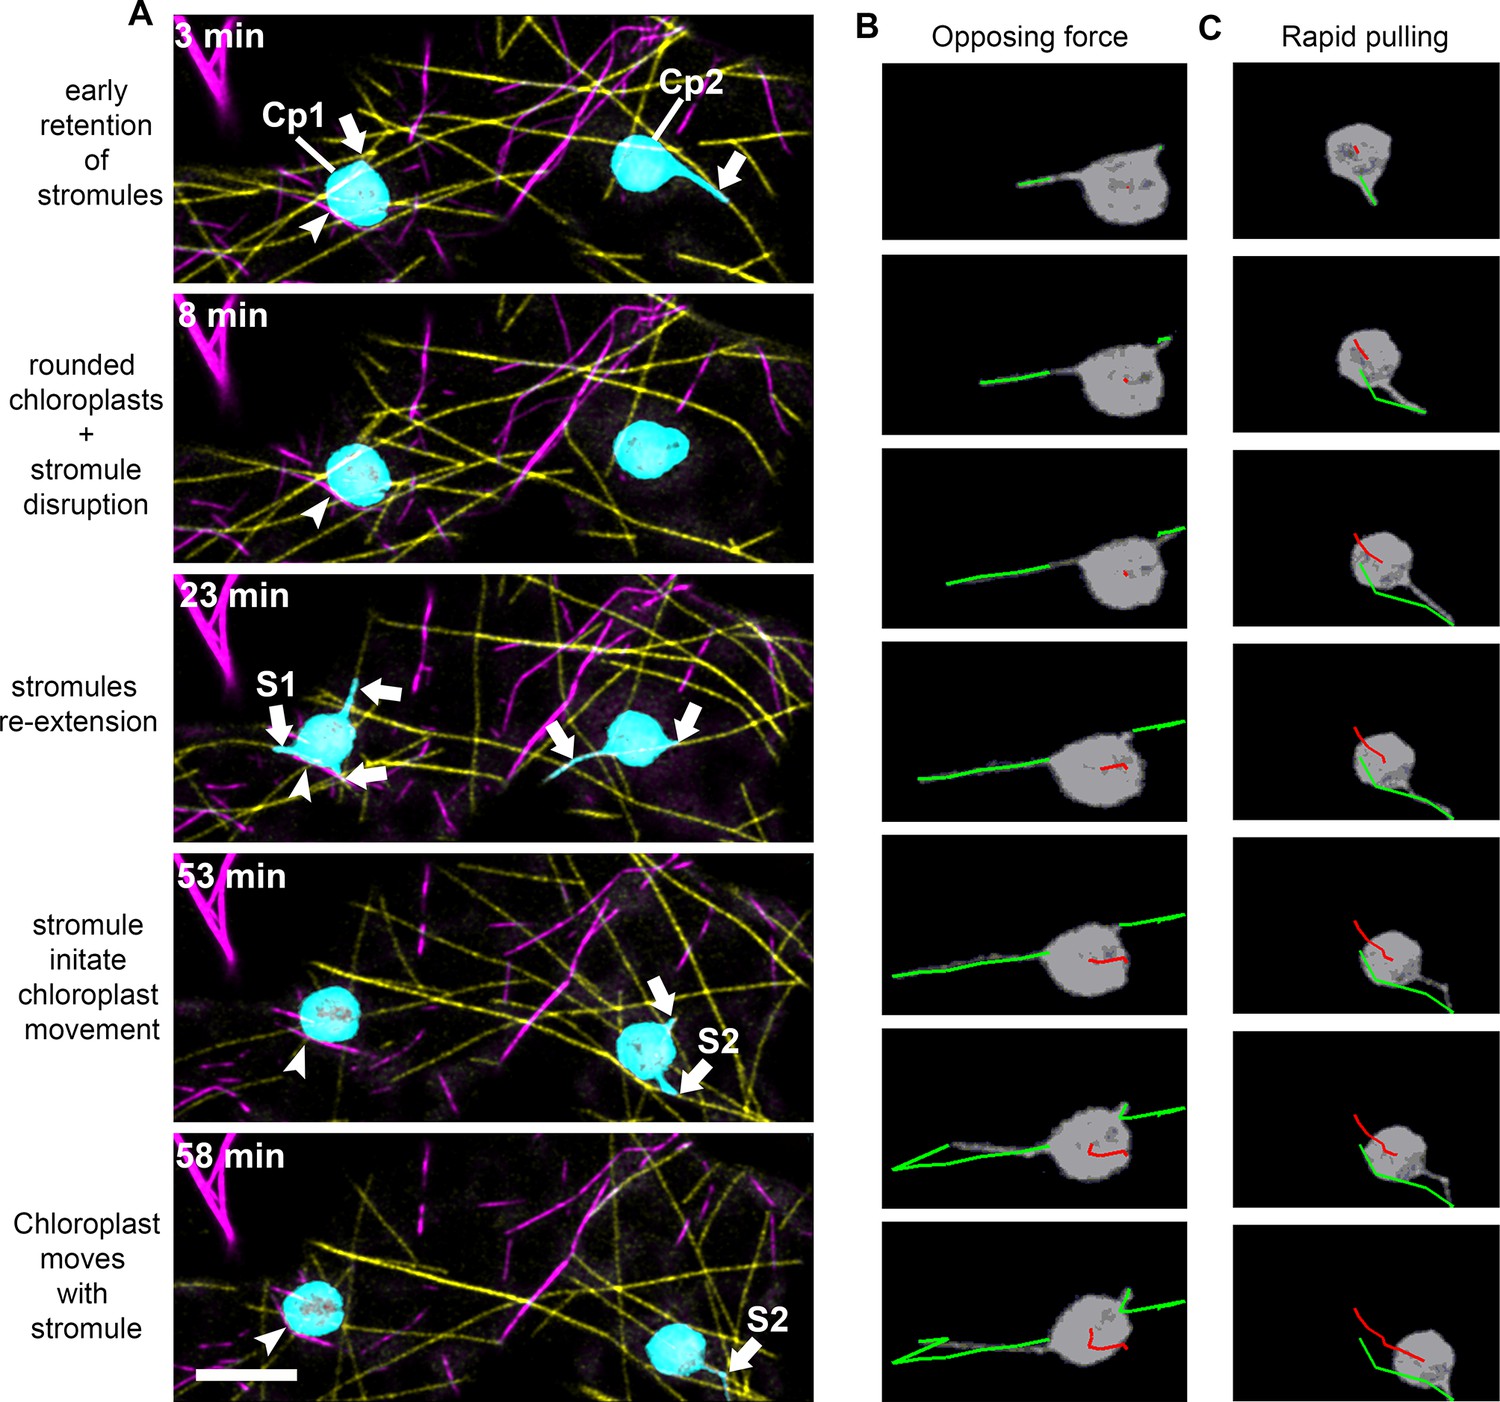
Stromule-directed chloroplast movement during partial actin disruption.
(A) AFs and MTs were marked by transiently expressing Citrine-mTalin (magenta) and TagRFP-MAP-CKL6 (yellow) in N. benthamiana transgenic plants expressing NRIP1-Cerulean that marks stromules (cyan). Time-lapse images of lower epidermal pavement cells of leaves indicated changes in stromule and chloroplast movement after treatment with Cytochalasin D (200 µM). Stromules were retained early (3 min) after treatment with Cytochalasin D and then briefly disrupted (8 min) with rounding of chloroplasts. Stromules re-extended (23 min) and then initiated movement of the chloroplast body (53 min). The chloroplast body moved in the direction of stromule trajectory (58 min). Arrowheads point to the chloroplast body anchored to a fragment of actin. Arrows point to stromules. Scale bar equal 10 µm. (B) Stromules and chloroplasts were tracked using the algorithm described in (Lu et al., 2017). The chloroplasts on the left in panel A had two stromules (green) resulting in opposing forces and minimal movement of the chloroplast body (red). (C) A single stromule (green) from the chloroplast on the right in panel A resulted in a rapid pulling of the chloroplast body (red). The image series in B and C span a 3-min interval of Video 7.
Figure 9 with 1 supplement
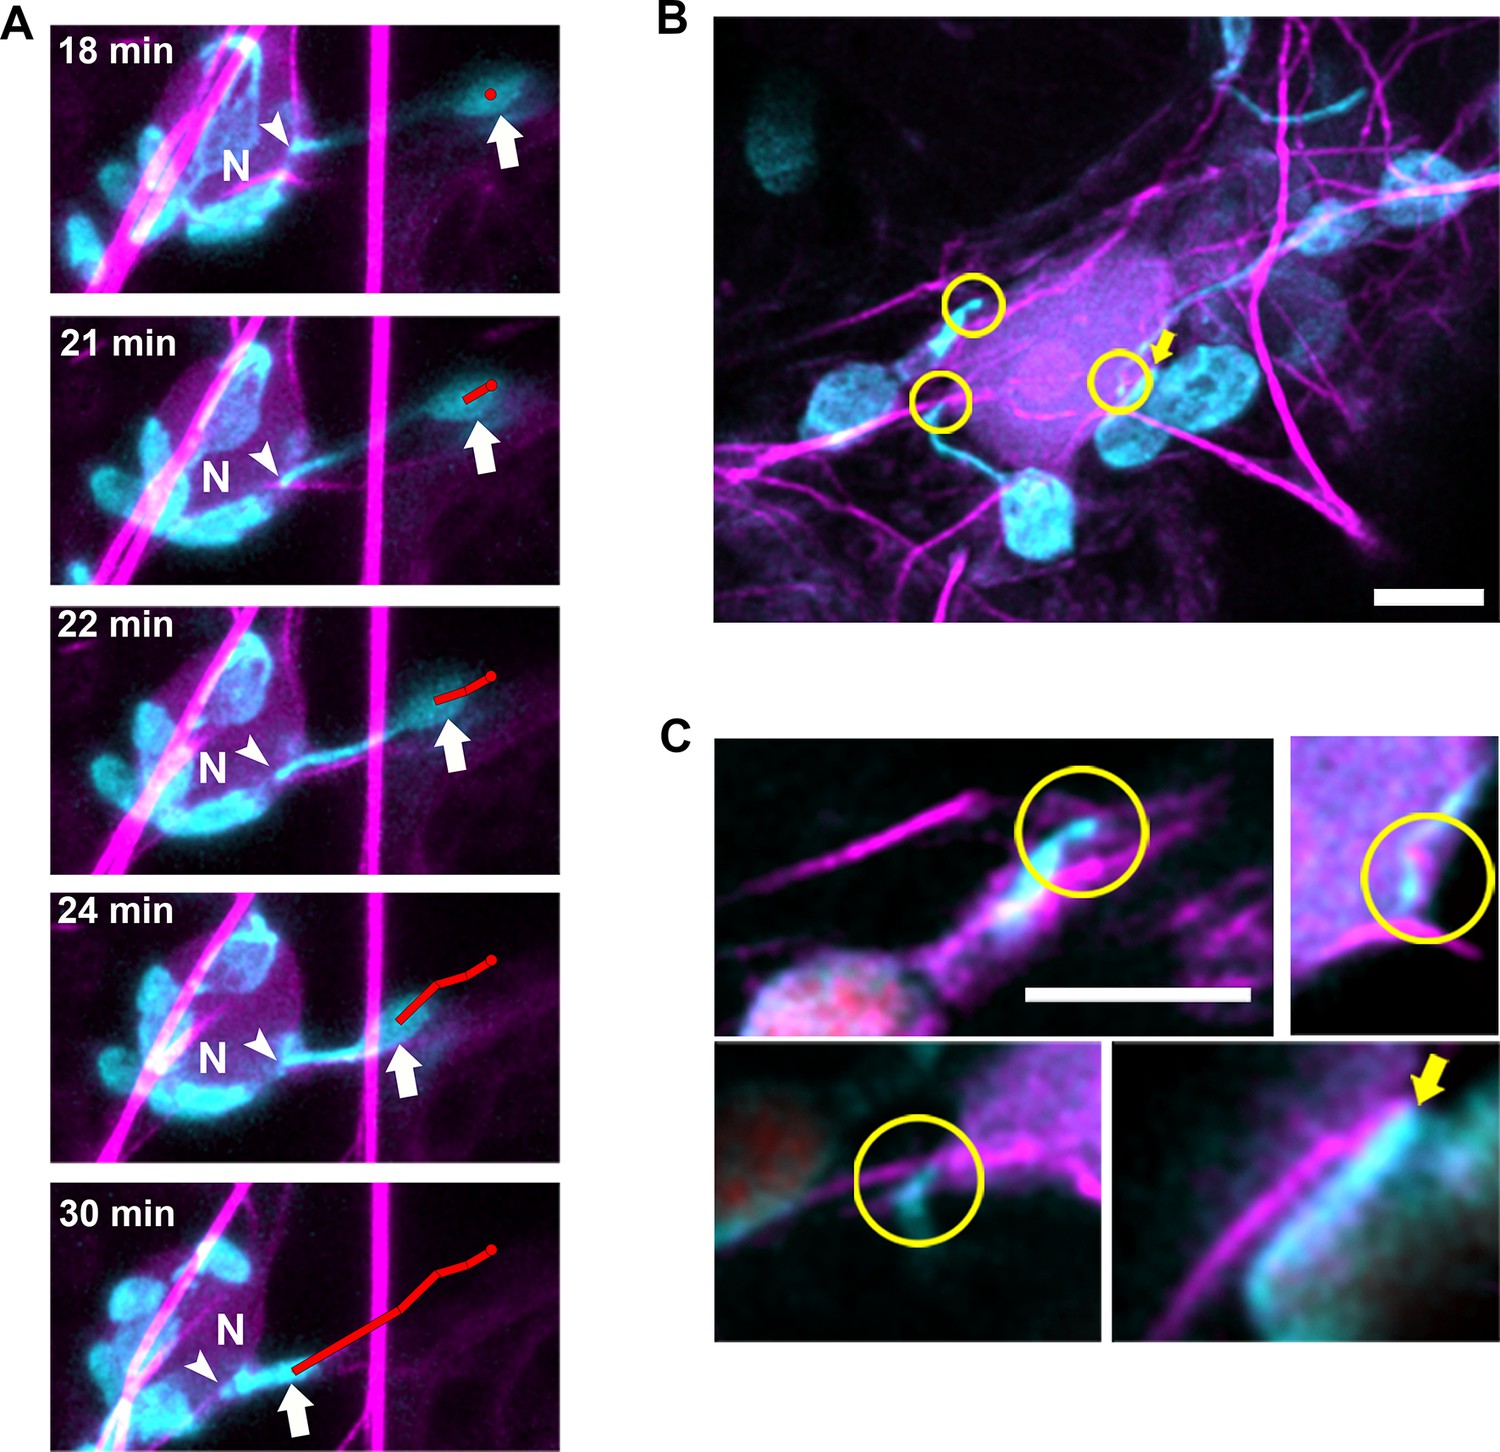
Chloroplasts and stromules positioning during perinuclear chloroplast clustering during immune response.
(A) TMV-p50 effector and Lifeact-TagRFP (magenta; AFs) were expressed in transgenic NRIP1-Cerulean N. benthamiana plants that marks stromules (cyan). Time lapse images of stromule retraction toward the nucleus (N) after chloroplast positioning around the nucleus. A stromule tip (arrow head) remained stably associated with an AF associated with a nucleus and the body of the chloroplast was anchored away from the nucleus for 18 min. Stromule retraction from 18 to 30 min brought the chloroplast body (arrow) in close association to the nucleus. The body of the chloroplast was tracked (red line). Arrows indicate retracting stromule. Scale bar equals 5 µm. (B) TMV-p50 effector and Lifeact-TagRFP (magenta; AFs) were expressed in transgenic NRIP1-Cerulean N. benthamiana plants and then fixed as described previously (Caplan et al., 2015). Three interaction points of stromules with actin surrounding nuclei were detected (circles). The body of a chloroplast was also associated with perinuclear AFs (arrow). Image is a deconvolved maximum intensity projection of a confocal microscopy z-stack. (C) Enlargements of individual xy slices of the z-stack show connections of stromule tips (left) and a stromule kink point (top right) with AFs.
Figure 9—figure supplement 1
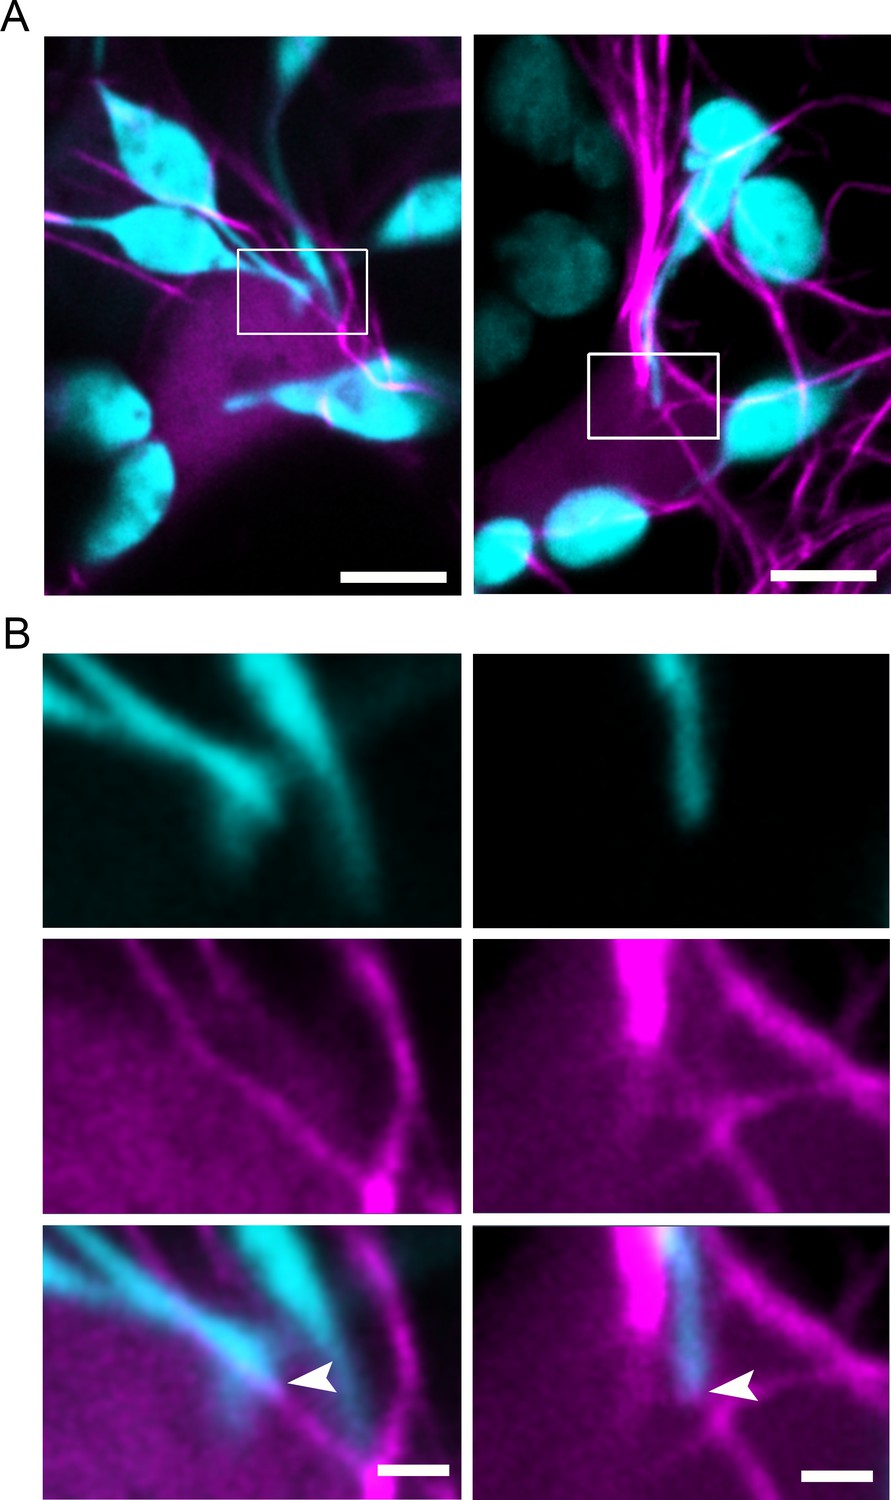
Stromule association with perinuclear actin microfilaments.
(A) TMV-p50 effector and Citrine-mTalin (magenta; AFs) were expressed in transgenic NRIP1- Cerulean N. benthamiana plants that marks stromules (Cyan). Stromules interacted with AFs associated with nuclei. Scale bar equals 5 µm. (B) Enlargements boxed in A showing stromule tips associated with perinuclear AF. The stromule channel (Cerulean, top row) and actin channel (magenta, middle row) are shown separately and merged (bottom row). Scale bar equals 2 µm.
Figure 10 with 1 supplement
Perinuclear chloroplast clustering during immune response.
(A) Time course images of perinuclear chloroplasts during TMV-p50 effector induced immune responses compared to mock control. Chloroplasts and stromules marked by NRIP1-Cerulean were pseudocolored cyan while nuclei and cytoplasm were pseudocolored red. N, nucleus. Scale bar equals 20 µm. (B) Quantification of perinuclear chloroplasts during TMV-p50 effector induced immune response compared to mock control shown in A. Ratio of nuclei associated with more than four chloroplasts in TMV-p50 infiltrated cells (magenta bars) are compared to those in control cells (green bars). More than 92 nuclei were observed for each condition from 48 images. Experiments were repeated three times with four plants each. Data represented as the mean +standard deviation (SD), **p<0.001, *p<0.01 (Student’s t test with Welch’s correction). (C) Actin cytoskeleton disruption by treatment with cytochalasin D (CTD) lead to dissociation of chloroplasts near the nucleus while microtubule disruption by treatment with oryzalin (ORY) does not affect the chloroplast positioning. Perinuclear clustering of chloroplasts was induced by TMV-p50 effector. Images were acquired 36 hr after induction. Cytoskeleton Inhibitors were treated 35 hr after induction. Chloroplasts and stromules presented by NRIP1-Cerulean were pseudocolored cyan, while nuclei were pseudocolored red. N, nucleus. Scale bar equals 20 µm. (D) Quantification of cells associated with more than four chloroplasts in C. More than 60 nuclei were observed for each condition from 12 images. Experiments were repeated three times with two plants each (total 6 plants). Data represented as the mean +standard deviation (SD), **p<0.001 (Student’s t test with Welch’s correction). D, DMSO; O, oryzalin; C, cytochalasin D.
-
Figure 10—source data 1
Statistics of the perinuclear clustering of the chloroplasts in TMV-p50 induced plant immune response and effect of cytoskeleton disrupting drugs.
Statistical analyses and the graph of the perinuclear clustering of the chloroplasts in TMV-p50 induced plant immune response and presented in Figure 10B and D were generated by Prism7.
- https://doi.org/10.7554/eLife.23625.051
Figure 10—figure supplement 1
Perinuclear clustering of chloroplasts in TMV-p50 effector induced immune response.
(A) Frequency map of nuclei associated with different number of chloroplasts in three time points after induction of immunity by TMV-p50 effector. Nucleus number with more than four chloroplasts were increased from 24 hr to 36 hr after induction (red, orange, and yellow in bars). (B) Frequency of nucleus clustered with more than four chloroplasts were decreased upon actin filament inhibitor, cytochalasin D (C), while microtubule inhibitor, Oryzalin (O) showed no difference from control (0.1% DMSO; D).
-
Figure 10—figure supplement 1—source data 1
Data of the chloroplast clustering to nucleus in TMV-p50 induced immune response.
Nuclei were categorized by the number of chloroplast clustered to the nucleus graphed in Figure 10—figure supplement 1A and B.
- https://doi.org/10.7554/eLife.23625.050
Videos
Video 1
Stromules extend along microtubules.
Stromules were marked by expressing NRIP1(cTP)-TagRFP (Cyan) in GFP-TUA6 (yellow) transgenic N. benthamiana plants. Time-lapse confocal microscopy was used to acquire images every 0.92 s that are displayed at 30 frames/s. The first half of the video (148 frames) shows a single stromule extending along microtubules and the second half (164 frames) of a stromule moving bidirectionally along microtubules. This video was used to generate the kymographs in Figure 1B.
Video 2
Tracking of stromule tip interactions along MTs.
The first half of the video shows maximum intensity projections of time-lapse confocal microscopy of 120 images taken every 8.1 s and displayed at 8 frames/second. MTs were marked by expressing EB1-Citrine (yellow) in transgenic N. benthamiana plants expressing NRIP1-Cerulean that marks stromules (cyan). Chlorophyll autofluorescence is pseudo-colored in red. Stromules were observed extending with only the tip being pulled along MTs. The second half of the video shows the tracking of stromule tips using the method described in Figure 1—figure supplement 1. The contours of stromules were defined in blue. The tip associations (green dots) with microtubules (grayscale) and non-associating tips (red dots) were mapped over a time series. The video was used to generate Figure 1C–E.
Video 3
Stromule move in channels of ER along MTs.
Video show stromules (cyan) first moving along MTs (yellow) to show dynamic association, then merged with the ER (magenta), and with stromules and ER only to show movement through ER channels. The video was used to generate Figure 2A.
Video 4
Stromules remodeling ER.
Stromules (cyan) move along MTs (yellow) remodeling the ER (magenta). Video was created from three consecutive time series and was used to generate Figure 2B–C.
Video 5
Stromule dynamics are disrupted by APM or Oryzalin MT inhibitor treatment.
Disruption of MT (yellow) by APM (20 µM) resulted in a loss of stromule extensions (middle) compared to the mock treatment control (left). Disruption of MT (yellow) by Oryzalin (300 µM) resulted in a loss of stromule extension compared to the mock treatment control (left). Maximum intensity projections of time-lapse z-stacks were taken every 40 s for Mock and Oryzalin and every 29 s for APM. Videos are 143 fames displayed at 15 frames/s. The video was used to generate Figure 3A.
Video 6
Stromules do not extend along AFs.
Stromules (cyan) interacted with AFs (magenta) at points along the stromule, but stromules did not directly extend along AFs. Sixty images were captured by time-lapse confocal microscopy every 18 s and displayed at 8 frames/s. The video was used to generate Figure 6A.
Video 7
Stromule retraction to actin anchor points.
Two stromules (cyan) retracted to multiple actin anchor points (arrows) along AFs (magenta). Thirty-seven images were captured by time-lapse confocal microscopy every 18 s and displayed at 12 frames/s. The video was used to generate Figure 6B–C.
Video 8
Stromule-directed movement.
Chloroplast bodies and stromules were visualized in a NRIP1-CFP transgenic N. benthamiana plants, in combination with chlorophyll autofluorescence. Time-lapse confocal microscopy was used to acquire images every 10 s for 600 s, displayed at 8 framess. In upper right corner, an instance of stromule-directed movement can be observed, which was used to generate Figure 8A. The chloroplast located in the bottom-center of the video, shows another instance of stromule-directed movement.
Video 9
Dynamic control of stromules by extension along MTs and anchoring to AFs.
AFs and stromules were marked by transiently expressing Lifeact-TagRFP (magenta) and NRIP1(cTP)-TagBFP (cyan) in N. benthamiana transgenic lines expressing GFP-TUA6 that marks MTs (yellow). Sixteen maximum intensity projections of time-lapse z-stacks taken were taken every 24.5 s and displayed at 4 frames/s. The video was used to generate Figure 8B.
Video 10
Chloroplasts and stromule dynamics following ORY and CTD treatments.
Chloroplast bodies and stromules were visualized in a NRIP1-CFP transgenic N. benthamiana plants, in combination with chlorophyll autofluorescence. Time-lapse confocal microscopy was used to acquire images every 10 s for 350 s, displayed at 16 frames/s. Displays chloroplast and stromule activity within plants subjected to either DMSO vehicle control (left), 1 µm of ORY (center), or 1 µm of CTD (right) drug treatments.
Video 11
Stromule directed movement in Cytochalasin-D-treated cell.
Stromules (cyan) from two chloroplasts are disrupted after Cytochalasin D treatment that fragmented AFs (magenta). Stromules re-extended along MTs (yellow) resulting in the movement of chloroplasts. 105 maximum intensity projections of time-lapse z-stacks were taken every 39 s and displayed at eight frames per second. The video was used to generate Figure 8—figure supplement 2.
Video 12
Stromule retraction resulted in the movement of a chloroplast to a nucleus.
A stromule (cyan) attached to an AF (magenta) pulls the chloroplast body to the nucleus by retracting. 100 maximum intensity projections of time-lapse z-stacks were taken every 38 s and displayed at 8 frames/s. The video was used to generate Figure 9A.
Tables
Key resources table
| Designation | Source or reference | Identifiers | Additional information |
|---|---|---|---|
| NRIP1 | PMID: 18267075; 26120031 | ||
| GCP4 | This paper | ||
| p50 | PMID: 18267075; 26120031 | ||
| GV2260 | PMID: 4022773 | ||
| GV3101 | https://doi.org/10.1007/BF00331014 | ||
| NRIP1-Cerulean transgenic plant | PMID: 18267075; 26120031 | ||
| GFP-TUA6 transgenic plant | PMID:12084822 | ||
| FABD2-GFP transgenic plant | PMID:12084822 | ||
| NRIP-Cerulean; N double transgenic plant | PMID: 18267075; 26120031 | ||
| TRV1 | PMID: 14501071 | ||
| TRV2-EV | PMID: 14501071 | ||
| Nicotiana benthamiana | Taxonomy ID: 4100 | ||
| mTalin-Citrine | This paper | ask construct named ‘SPKD2681’ | |
| Lifeact-TagRFP | This paper | ask construct named ‘SPKD2209’ | |
| TagRFP-MAP-CKL6 | This paper | ask construct named ‘SPKD2386’ | |
| NRIP1(cTP)-TagBFP | This paper | ask construct named ‘SPKD3168’ | |
| TRV-NbGCP4 | This paper | ask construct named ‘SPKD3111’ | |
| Citrine-p50-U1 | This paper | ask construct named ‘SPKD1939’ | |
| Citrine | This paper | ask construct named ‘SPKD914’ | |
| p50-2xHA | PMID: 18267075; 26120031 | ||
| NLS-mCherry | PMID: 28619883 | ||
| Cytochalasin D | Sigma-Aldrich, St. Louis, MO | C8273 | |
| Aminoprophos-methyl (APM) | Sigma-Aldrich, St. Louis, MO | 03992 | |
| Oryzalin | Sigma-Aldrich, St. Louis, MO | 36182 | |
| Paclitaxel-BODIPY | Thermofisher Scientific, Waltham, MA | P7501 | |
| DMSO | Sigma-Aldrich, St. Louis, MO | D8418 | |
| PRISM7 | GraphPad, La Jolla, CA | ||
| Stromule detection and tracking algorithm | http://sigport.org/1807 |
Additional files
-
Transparent reporting form
- https://doi.org/10.7554/eLife.23625.052
Download links
A two-part list of links to download the article, or parts of the article, in various formats.
Downloads (link to download the article as PDF)
Open citations (links to open the citations from this article in various online reference manager services)
Cite this article (links to download the citations from this article in formats compatible with various reference manager tools)
Stromule extension along microtubules coordinated with actin-mediated anchoring guides perinuclear chloroplast movement during innate immunity
eLife 7:e23625.
https://doi.org/10.7554/eLife.23625


