Transcription factor Emx2 controls stereociliary bundle orientation of sensory hair cells
- University of Maryland, United States
- National Institute on Deafness and Other Communication Disorders, National Institutes of Health, United States
Figures
Figure 1 with 1 supplement
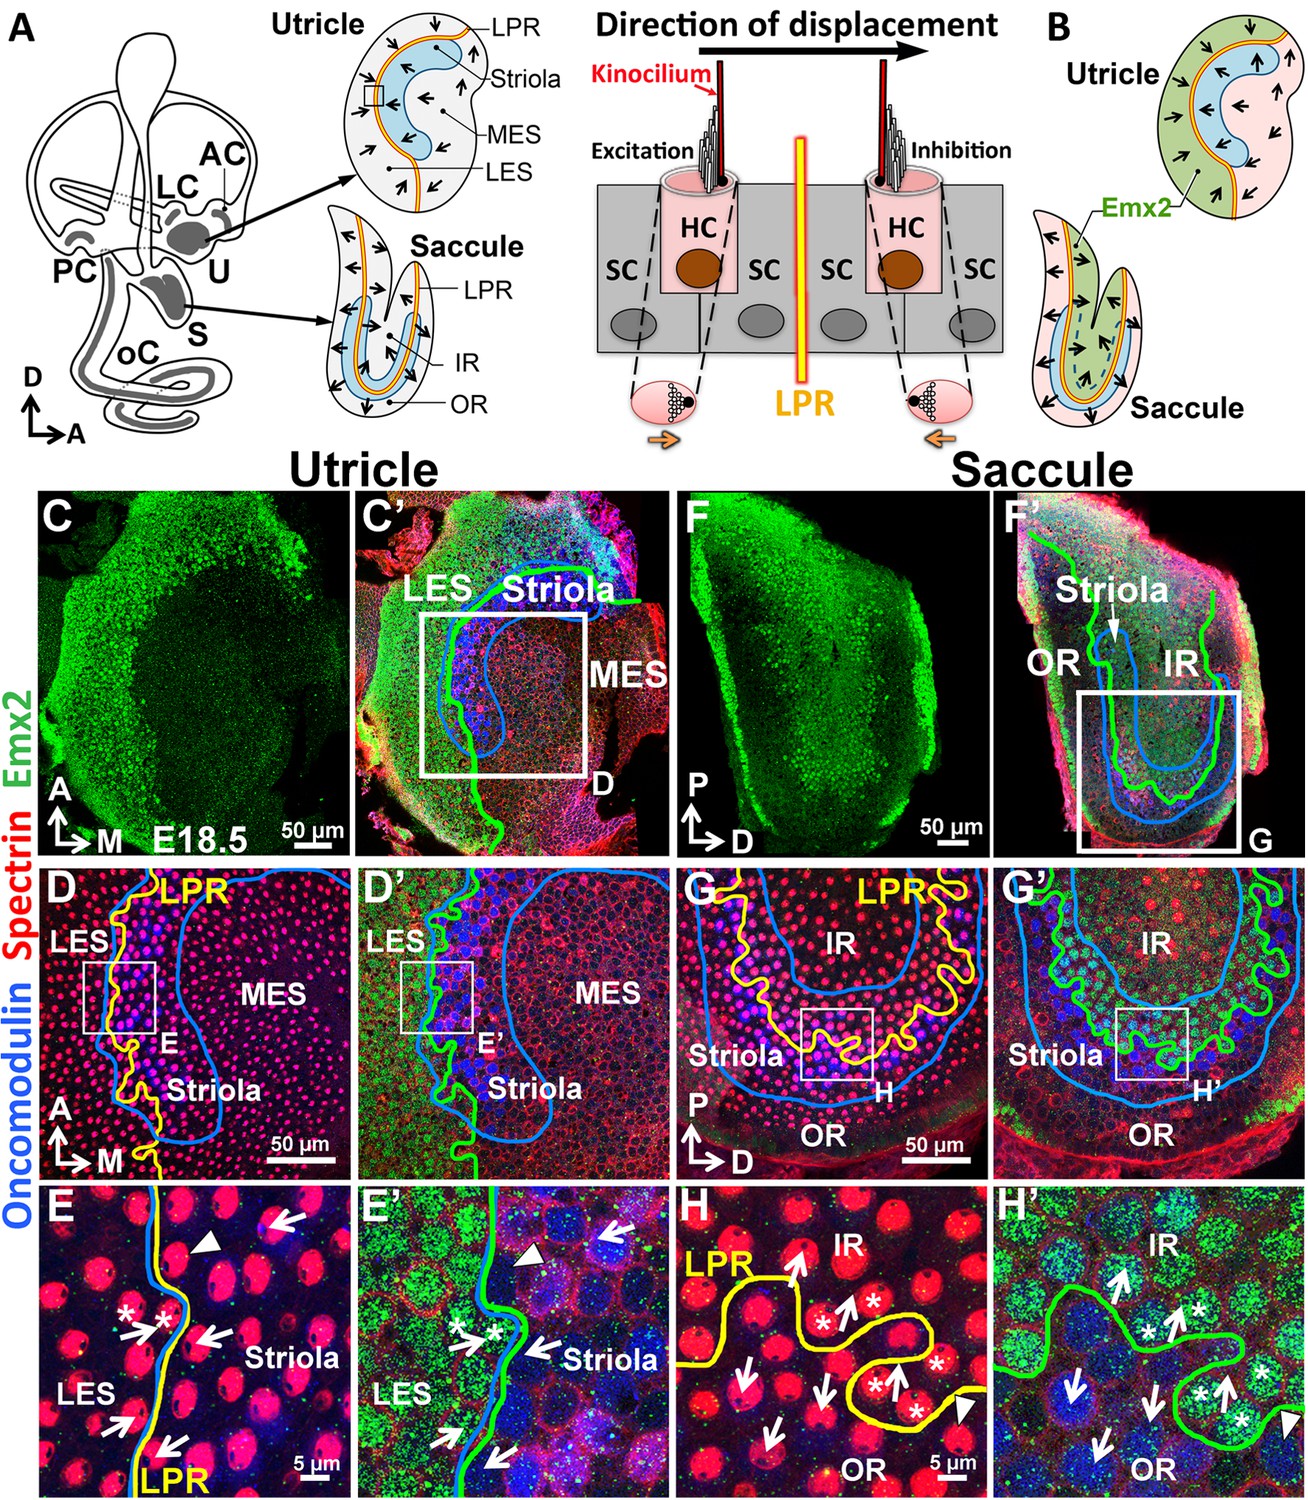
Regional expression of Emx2 in the maculae.
(A) Medial view of a mouse left inner ear with its six sensory organs (grey). Enlarged are the utricle and saccule showing their subdivisions, hair bundle polarity (arrows), LPR (yellow line), and striola (blue). The square denotes the sensory epithelium across the LPR on the right. Displacement of the hair bundle towards or away from the kinocilium results in depolarization and hyperpolarization of HC, respectively. (B) Schematic of the Emx2 expression domain (green) in the utricle and saccule. (C–H’) Utricle (C–E’) and saccule (F–H’) are stained for anti-Emx2 (green), anti-spectrin (red) and anti-oncomodulin (blue) antibodies (n = 6). Hair bundle polarity is determined by the location of the kinocilium, which is devoid of anti-spectrin staining (red). (D,E,G,H) and (D’,E’,G’,H’) are confocal images of the same HCs taken at the apical surface and nuclei level, respectively. (C,C’,D’,E’) Anti-Emx2 (green) staining is located in the lateral extrastriola (LES), which is lateral to the oncomodulin-positive striola (blue) of the utricle. Hair bundles in LES point toward those in the striola and medial extrastriola (MES) of utricle (E). (F,F’,G’,H’) Anti-Emx2 staining is restricted to the inner region (IR) of saccule and the LPR bisects the striola. Hair bundles in the IR point away from those in the outer region (OR) of saccule (H). The border of the Emx2-positive domain (green line, D’,E’,G’,H’) coincides with LPR (yellow line, D,E,G,H) in both maculae. Refer to Figure 2 for a description of asterisks and arrowheads. A, anterior; AC, LC, and PC, anterior, lateral and posterior crista; D, dorsal; M, medial; oC, organ of Corti; P, posterior; S, saccule; U, utricle.
Figure 1—figure supplement 1
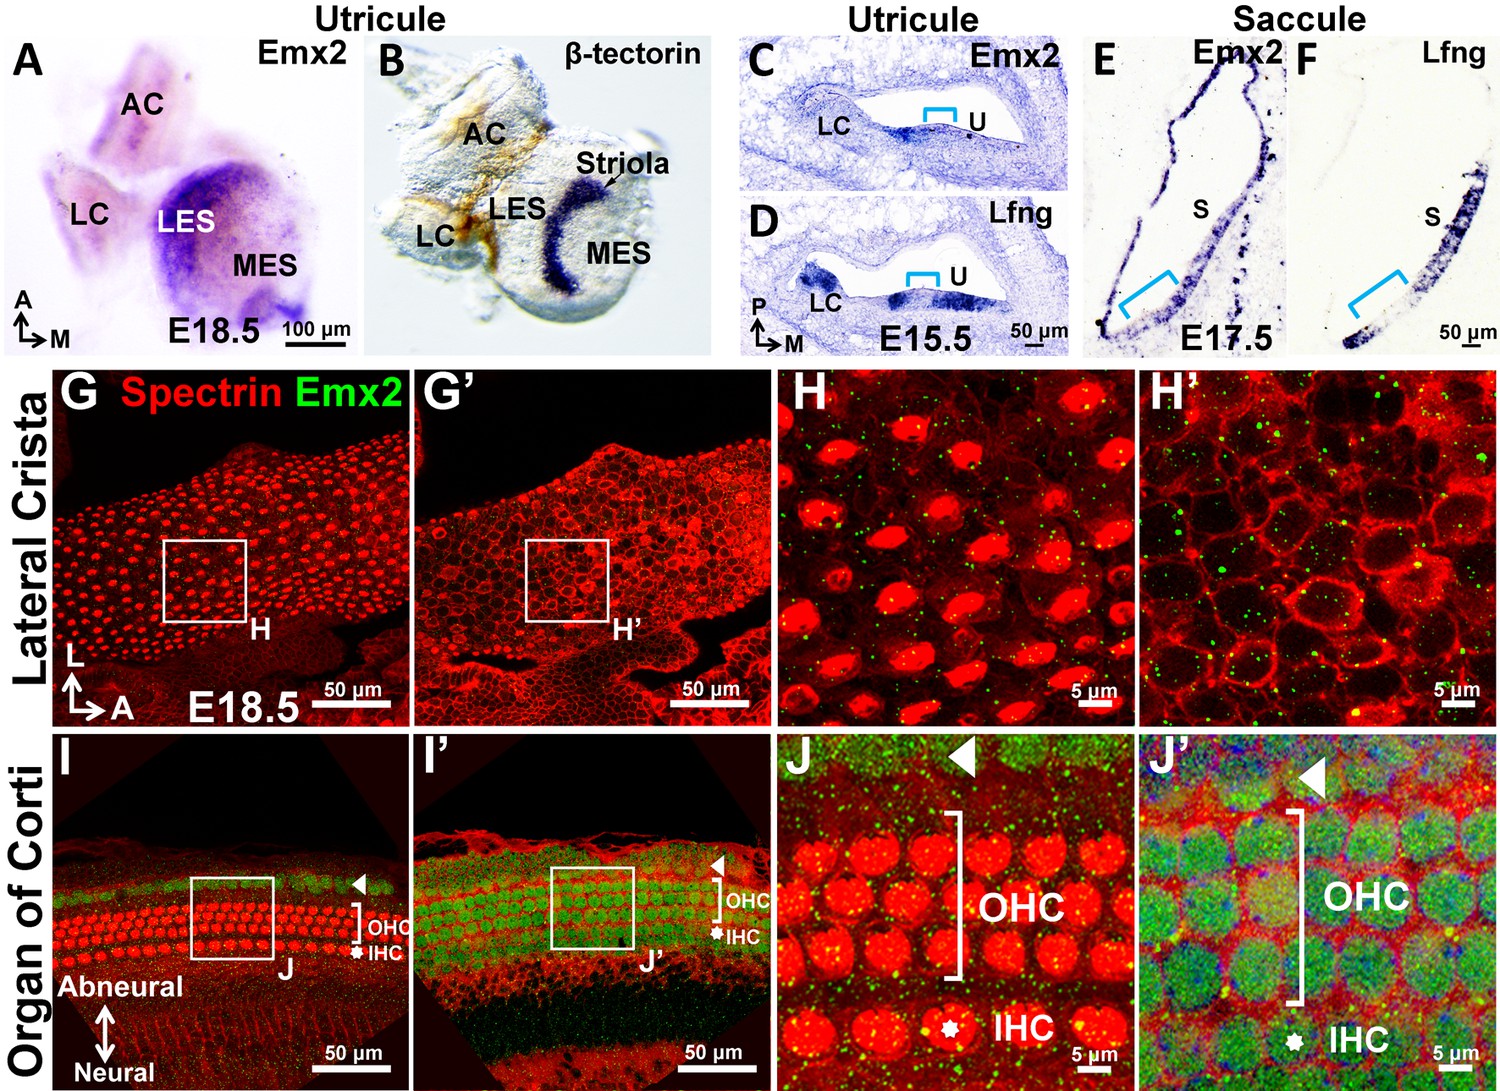
Expression of Emx2 in sensory organs of the mouse inner ear.
(A–B) Whole mount in situ hybridization of the utricle showing Emx2 hybridization domain (A; n = 3) lateral to that of the β-tectorin-positive striola (B; n = 3). Neither genes are expressed in the anterior and lateral cristae (AC and LC). (C–F) Section in situ hybridization of the utricle (C-D; n = 3) and saccule (E-F; n = 3) showing Emx2 expression (C,E) within the Lfng-positive sensory epithelium (D,F). Emx2 is not expressed in the striola (Lfng-negative, bracket) and lateral crista. (G–J’) Emx2 immunoreactivity is not detected in the lateral crista (G-H’; n = 6) or other cristae. In contrast, anti-Emx2 immunoreactivities are broadly detected in the cochlea (I–J’) including inner and outer HCs (n = 6; IHC, asterisk; OHC, bracket), as well as the Hensen’s and Claudius’ cell region (arrowhead, I–J’).
Figure 2 with 2 supplements
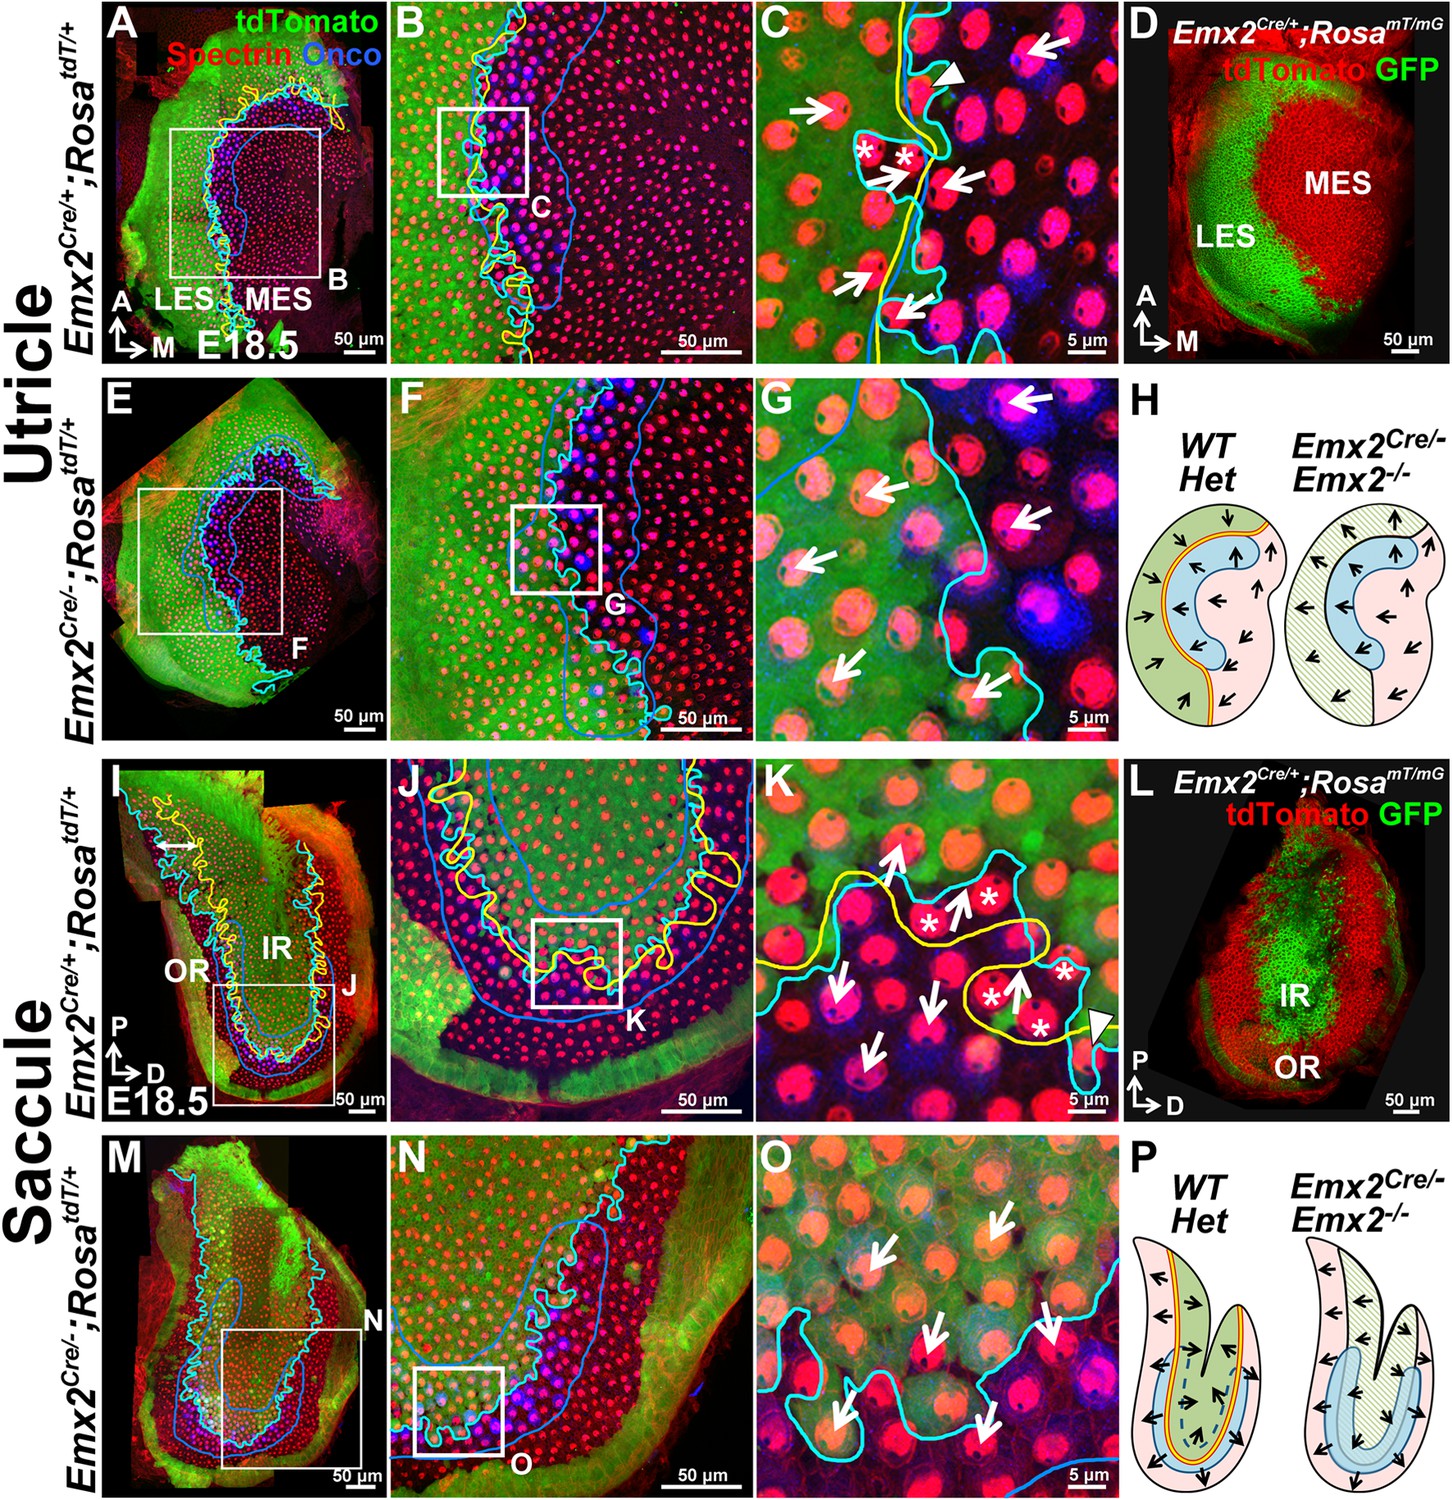
The Emx2 lineage domain is present in Emx2 functional null maculae.
(A–C) and (I–K) are the same specimens as (C–E’) and (F–H’) in Figure 1. (A–C) In Emx2cre/+;RosatdT/+ utricles, the border of the Emx2 lineage domain (cyan line) coincides largely with LPR (yellow line), located at the lateral edge of the oncomodulin-positive striola (blue outlined; n=5). (C) HCs point toward each other (arrows) across the LPR. Asterisks label HCs that are negative for cre reporter signals but positive for Emx2 immunostaining (Figure 1E’; n=18), whereas arrowhead labels a HC that is cre-reporter positive but negative for Emx2 immunostaining (Figure 1E’; n=21). (D) A similar Emx2 lineage domain (GFP) is observed using a different Cre reporter, RosamT/mG. (E–G) The Emx2 lineage domain (green) remained in Emx2Cre/-;RosatdT/+ utricles, but hair bundle polarity in this region is reversed (G; n=5) compared to controls (C; n=5). (I–K) In Emx2Cre/+;RosatdT/+ control saccules, the border of the Emx2 lineage domain (cyan line) mostly coincides with the LPR except in the ventral-posterior region (I, double-headed arrow). (K) Across the LPR, HCs are pointing away from each other (arrows). Asterisks label HCs that are negative for cre reporter signals but positive for Emx2 immunostaining (Figure 1H’; n=60), whereas arrowhead labels a HC that is cre-reporter positive but negative for Emx2 immunostaining (Figure 1H’; n=105). (L) A similar lineage domain (GFP) is observed using the Cre reporter RosamT/mG. (M–O) In Emx2Cre/-;RosatdT/+ mutant saccules, the border of the Emx2 lineage domain (cyan line) remained located in the middle of the striolar region (blue outline), but the hair bundles within the lineage domain are reversed (O; n=5), relative to controls (green region in K). (H) and (P) Schematics of respective utricles and saccules showing relationships among the Emx2 expression domain (green), hair bundle polarity pattern, LPR (yellow line) and striola (blue outlined) in controls and Emx2 mutants.
-
Figure 2—source data 1
Sensory area quantifications for Emx2 mutant maculae.
- https://doi.org/10.7554/eLife.23661.005
-
Figure 2—source data 2
Total hair cell number in utricles of loss- and gain-of-function Emx2 mutants.
- https://doi.org/10.7554/eLife.23661.006
Figure 2—figure supplement 1

Emx2 immunostaining in the Emx2Cre/+ maculae correlates with the reversed hair bundle polarity.
In the utricle (A–F”) and saccule (G–L”), the lineage (A,D,G,J, blue) and expression (A’,D’,G’,J’, green) domains of Emx2 are both restricted to the LES and IR, respectively. (C,F,I,L) show Emx2 lineage (blue) and anti-spectrin staining (red). (C’,F’,I’,L’) and (C”,F”,I”,L”) are same regions as (C,F,I,L) showing lineage staining (blue) and anti-Emx2 staining (green) at the nucleus level of HCs, respectively. The LPR (C”,F”,I”,L”, yellow line) correlates with the border of Emx2 immunostaining (green line) better than the border of Emx2-lineage domain (C’,F’,I’,L’, cyan line). Asterisks label the Emx2-lineage negative HCs with reversed bundle polarity that are positive for Emx2 staining, whereas arrowheads label Emx2-lineage HCs with default bundle polarity that are negative for Emx2 immunoreactivity.
Figure 2—figure supplement 2
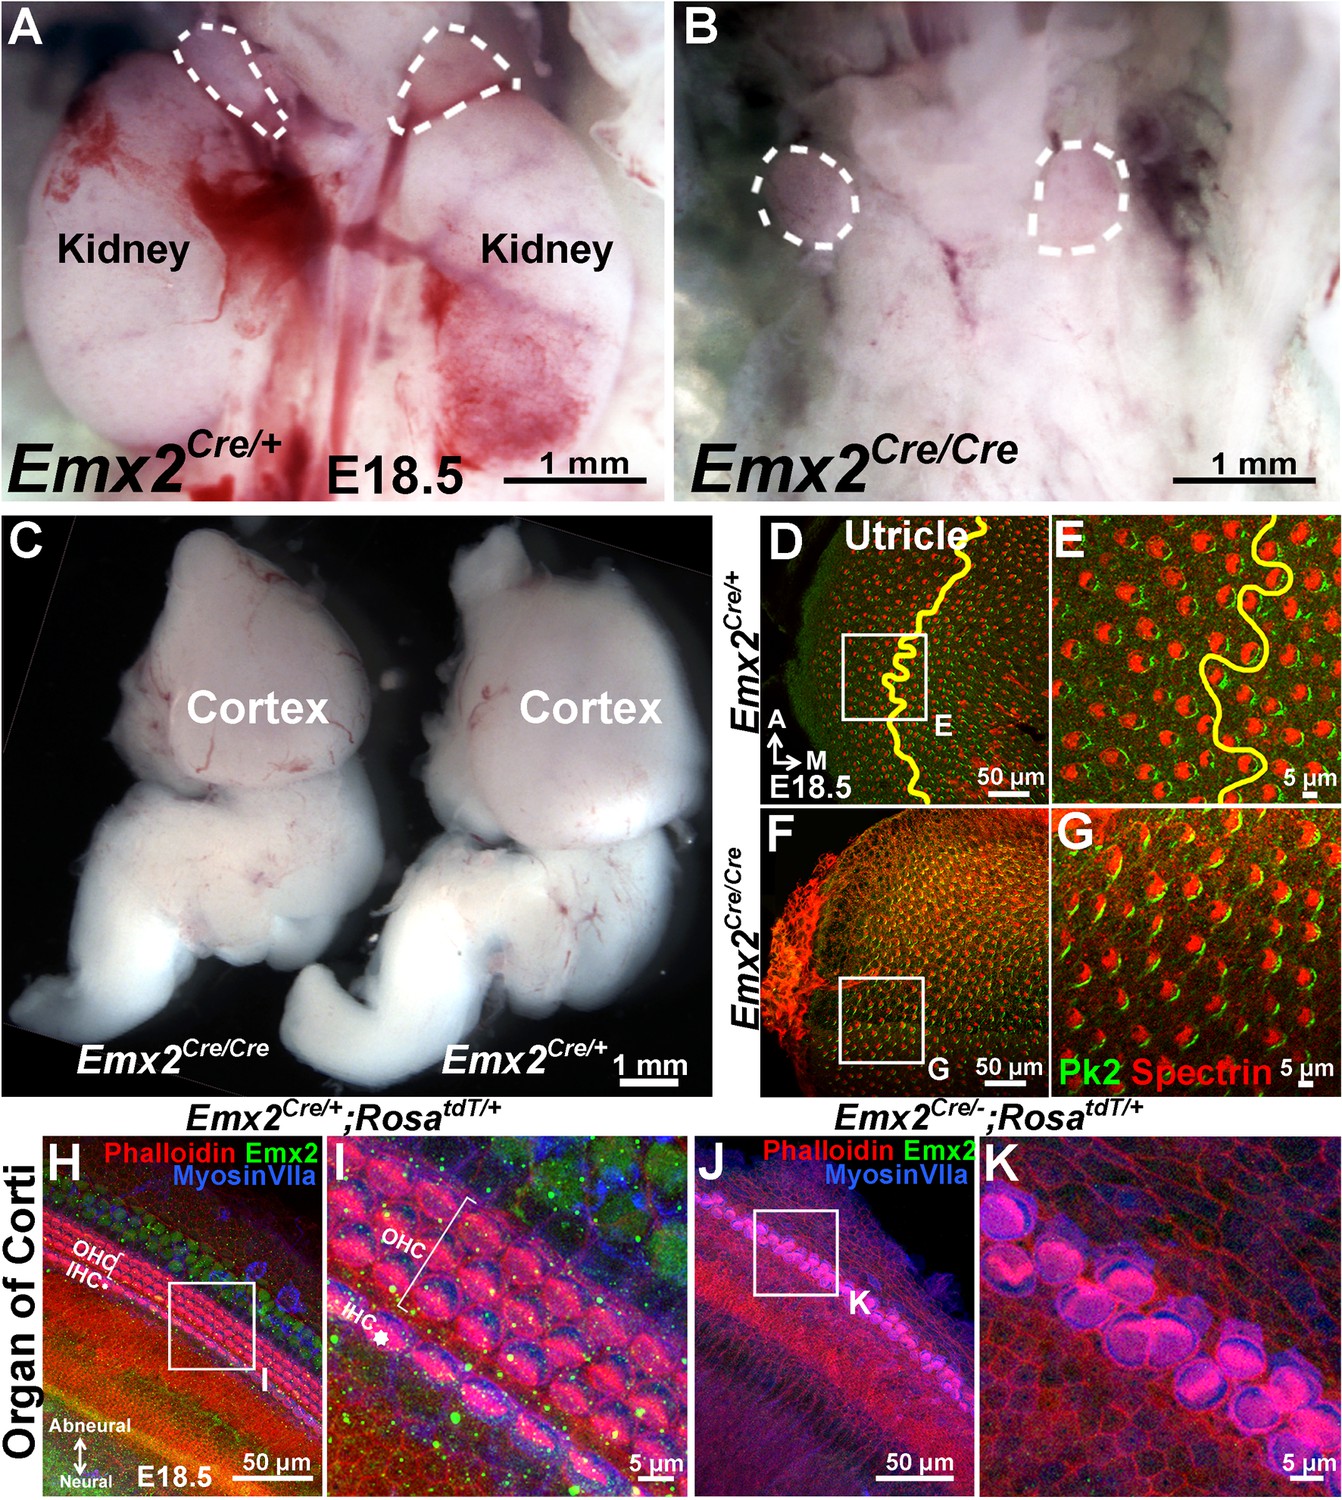
Mutant phenotypes of Emx2Cre/Cre and Emx2Cre/- embryos are similar to Emx2 -/- mutants.
(A–B) The kidneys below the adrenal glands (dotted lines) are absent in Emx2Cre/Cre (B) compared to Emx2Cre/+ embryos (A). (C) The size of the cortex is smaller in Emx2Cre/Cre than Emx2Cre/+ embryos. Both kidney and cortical phenotypes have been described in Emx2 -/- mutants (n=5; Pellegrini et al., 1996; Miyamoto et al., 1997). (D–G) In contrast to controls (D-E; n=3), the LPR (yellow line) is absent in Emx2Cre/Cre utricles (F–G; n=3) and hair bundle polarity defects are similar to those reported in Emx2-/- ears (Holley et al., 2010). The distribution of Prickle-like 2 (Pk2) immunostaining in Emx2Cre/Cre utricles is associated with the medial border of HCs (G), similar to control (E) and Emx2-/- utricles (Figure 6D–E). (H–K) Compared to controls (H–I; n=5), outer HCs are absent and two rows of poorly organized inner HCs with aberrant hair bundle polarity are evident in Emx2Cre/-;RosatdT/+ cochlea (J-K; n=5), similar to the phenotypes reported in Emx2 knockout mutants (Holley et al., 2010).
Figure 3
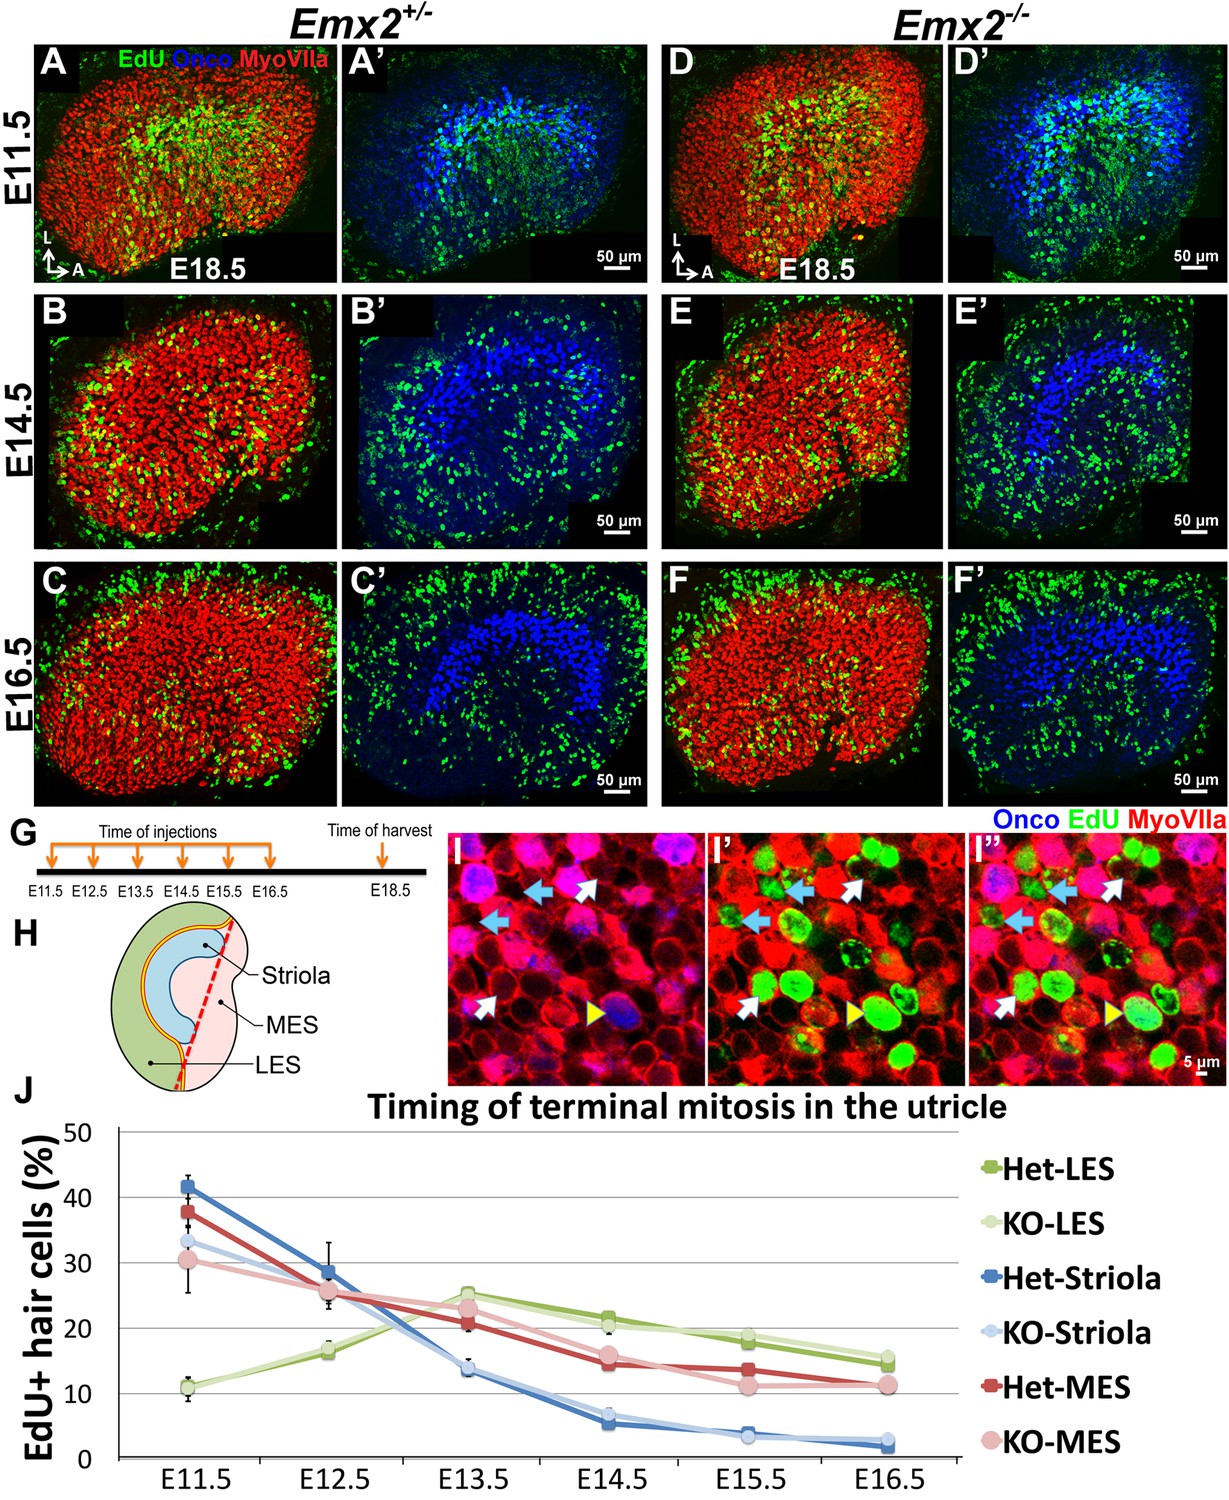
Regional differences in timing of cell cycle exit are maintained in the Emx2-/- utricle.
(A–C’) E18.5 Emx2+/- utricles injected with EdU at E11.5 (A-A’; n = 3), E14.5 (B-B’; n = 3), or E16.5 (C-C’; n = 3) and harvested at E18.5 (G) were processed for anti-Myosin VIIa (HC marker), anti-oncomodulin (striolar marker), and incorporated EdU. Abundant labeling is observed in the striola when the utricle is exposed to EdU at E11.5 (A) and not at E14.5 (B) and E16.5 (C), whereas labeling in the MES is observed in all three ages but weakest at E16.5 (C). In contrast, EdU labeling is not apparent in the LES at E11.5 (A) but only at E14.5 and E16.5 (B,C). (D–F’) In Emx2-/- utricles, the regional differences of EdU labeling are similar to the controls. (H) A subdivision of the utricle into the oncomodulin-positive, striola (blue), LES (green) and MES (pink) domains. The red dotted line joining the two ends of the striola was used as an arbitrary division between the two ends of LES and MES. (I–I”) Triple labeling of the utricle with anti-Myosin VIIa (red), anti-oncomodulin (blue) and EdU (green). HCs that are triple-labeled (yellow arrowhead), EdU-positive HCs (white arrow) and EdU-positive non-HCs (blue arrow) are marked. (J) No significant differences in percentages of EdU-labeled HCs are observed between various regions of the Emx2+/- and Emx2-/- utricles (Figure 3—source data 1). Blue, green and pink lines represent the percentages of EdU-positive HCs in the striola, LES, and MES, respectively. Both Emx2 heterozygous and knockout utricles show the peak of EdU-positive HCs detected at E11.5 for the striola and MES, and at E13.5 for the LES.
-
Figure 3—source data 1
Timing of terminal mitosis in utricular HCs of Emx2 mutants.
- https://doi.org/10.7554/eLife.23661.010
Figure 4

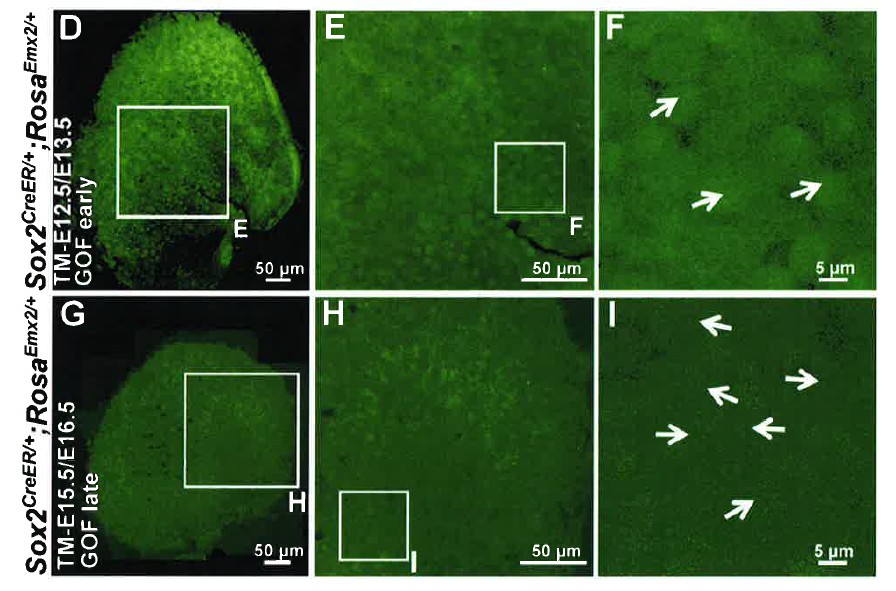
Ectopic Emx2 reverses hair bundle polarity in the utricle.
Compared to the medial side of the LPR in controls (A–C), hair bundle polarity (arrows) in the medial region of Sox2CreER/+;RosaEmx2/+ (D-F, tamoxifen given at E12.5 and E13.5, gain-of-function (GOF) in the sensory epithelium (SE), GOF-SE early; n = 3) and Gfi1Cre/+;RosaEmx2/+ utricles (J-L, GOF-HC (hair cell); n = 7) are reversed. (G–I) Sox2CreER/+;RosaEmx2/+ utricles (tamoxifen give at E15.5 and E16.5, GOF-SE late) show a mixed phenotype of normal and reversed bundle polarities (white arrows, n = 3). Among the GOF specimen (D,G,J), anti-oncomodulin staining (blue) is only sparsely detectable in the GOF-HC utricles (J) compared to controls (A). (M–N) Quantification of HC density (M; Figure 4—source data 1) and surface area (N; Figure 4—source data 2) in Regions 1 and 3 of utricles from various genotypes (controls, n = 6; GOF-SE, n = 3; GOF-HC, n = 4). Only utricles of GOF-SE early show a significant decrease in HC density and an increase in the apical surface area of HCs compared to controls. Error bars represent SEM. *p<0.05; **p<0.01; ***p<0.001. (O) Schematic diagrams illustrating hair bundle polarity pattern and defined regions in control and Emx2 gain-of-function utricles. (P–Q) Box-plots of hair bundle polarity in regions L (LES) and M (MES) of utricles (Figure 4—source data 3). Region L of controls includes the LPR and thus show HCs with both medial and lateral polarities but only medial-pointing hair bundles are present in all Emx2 GOF utricles except GOF-SE late (control, n = 6; mutant, n = 3). Box represents quartiles 1 to 3. The line within the box is the median and the bar represents maximum and minimum number. **p<0.01, ***p<0.001, compared to controls.
-
Figure 4—source data 1
Quantification of HC density in Emx2 gain-of-function mutants.
- https://doi.org/10.7554/eLife.23661.012
-
Figure 4—source data 2
Quantification of apical surface area of HCs in Emx2 gain-of-function mutants.
- https://doi.org/10.7554/eLife.23661.013
-
Figure 4—source data 3
Quantification of hair bundle orientation in Emx2 gain-of-function mutants.
- https://doi.org/10.7554/eLife.23661.014
Figure 5
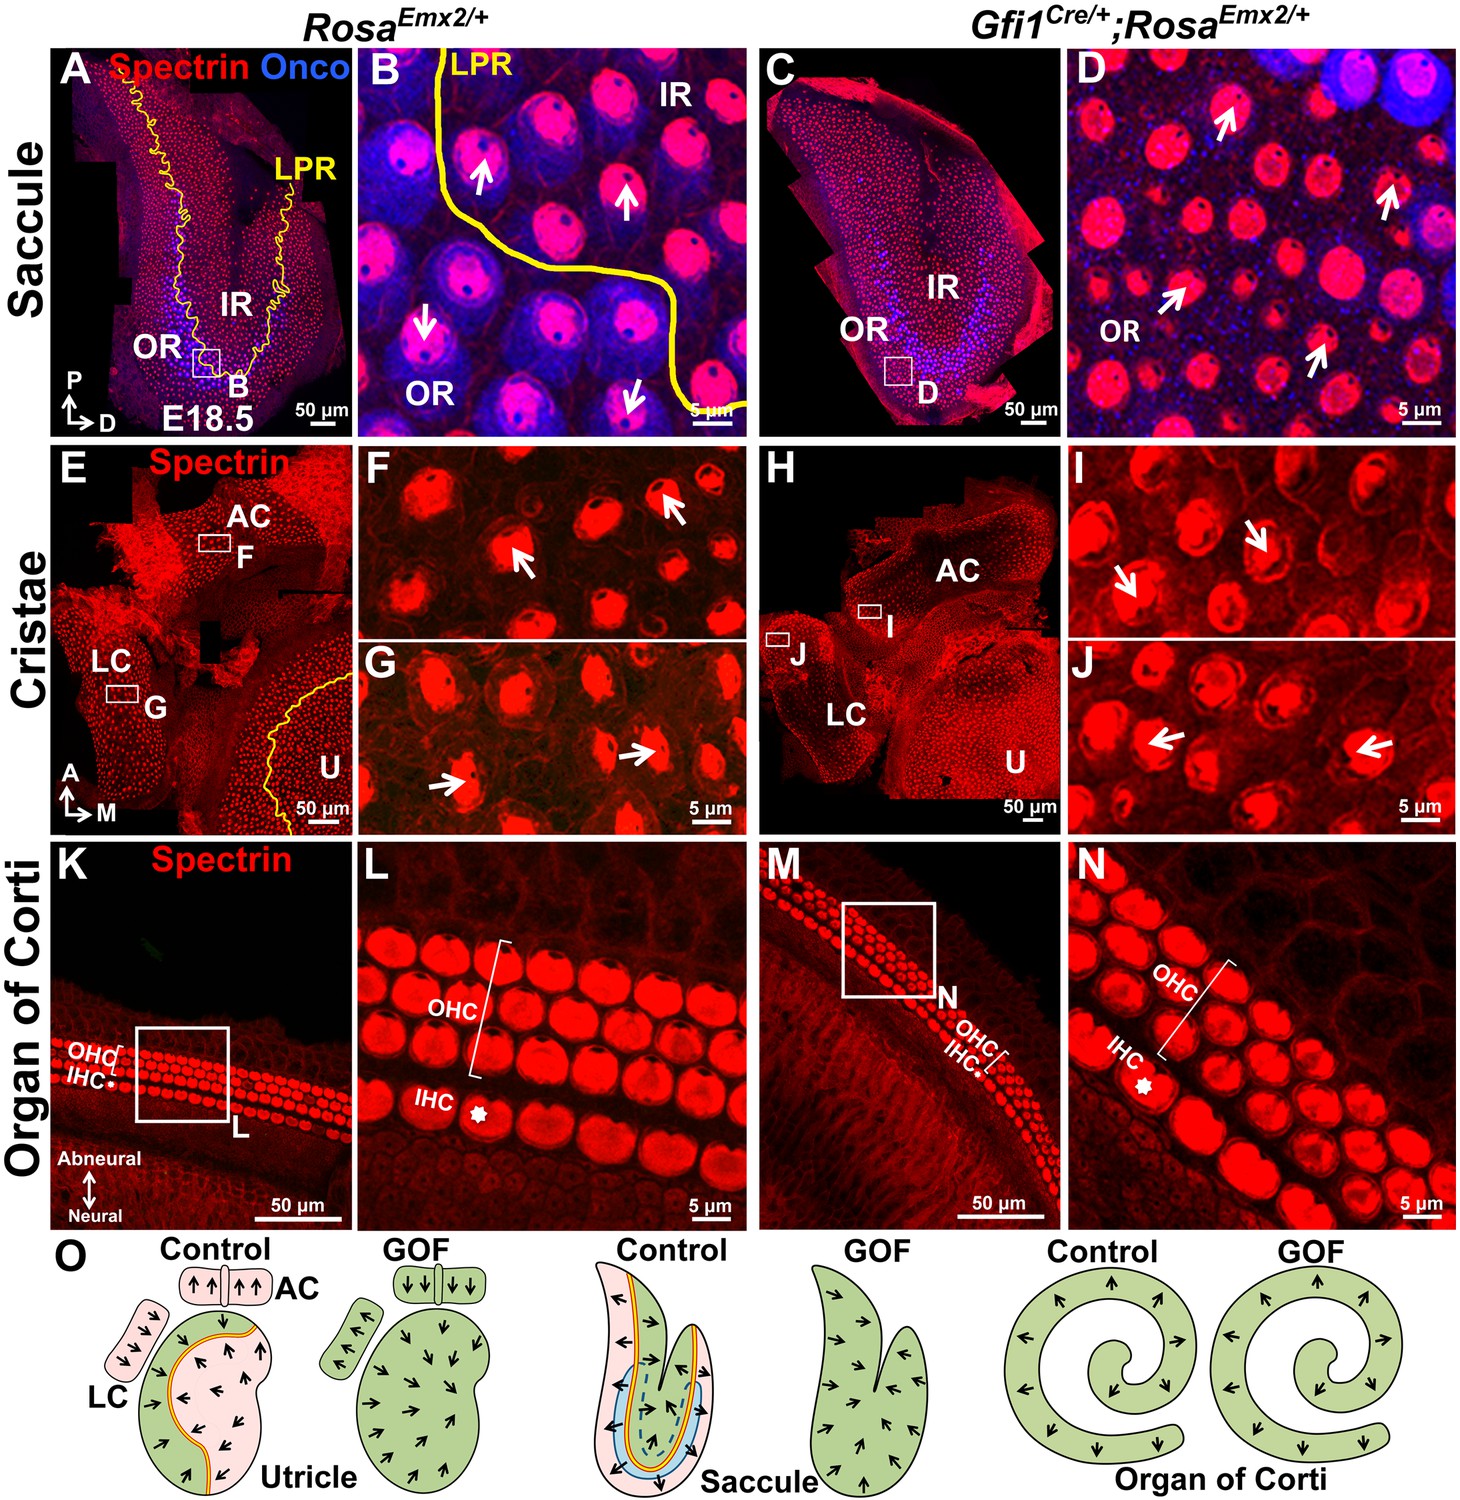
Ectopic Emx2 reverses hair bundle polarity in the saccule and cristae but not organ of Corti.
(A–D) Saccule, (E–J) anterior and lateral cristae (AC and LC), as well as (K–N) organ of Corti of RosaEmx2/+ (A–B, E–G, K–L) and Gfi1Cre/+;RosaEmx2/+ (C–D, H–J, M–N) inner ears at E18.5 (n = 7). In the Gfi1Cre/+;RosaEmx2/+ saccule, bundle polarity in the OR (outer region) is reversed by approximately 180° (C–D) compared to controls (A–B). (E–J) In control cristae, hair bundles point toward the anterior direction in the AC (F) and medial direction in the LC (G), whereas these polarities are reversed in AC (I) and LC (J) of Gfi1Cre/+;RosaEmx2/+ ears, pointing toward posterior and lateral directions, respectively (H–J). (K–N) No difference in hair bundle polarity is apparent between control (K–L) and Gfi1Cre/+;RosaEmx2/+ (M–N) organ of Corti. IHC, inner HCs (asterisk); OHC, outer HCs (bracket). (O) Schematic diagrams illustrating hair bundle polarity pattern in control and Emx2 GOF sensory organs of the inner ear.
Figure 6 with 2 supplements
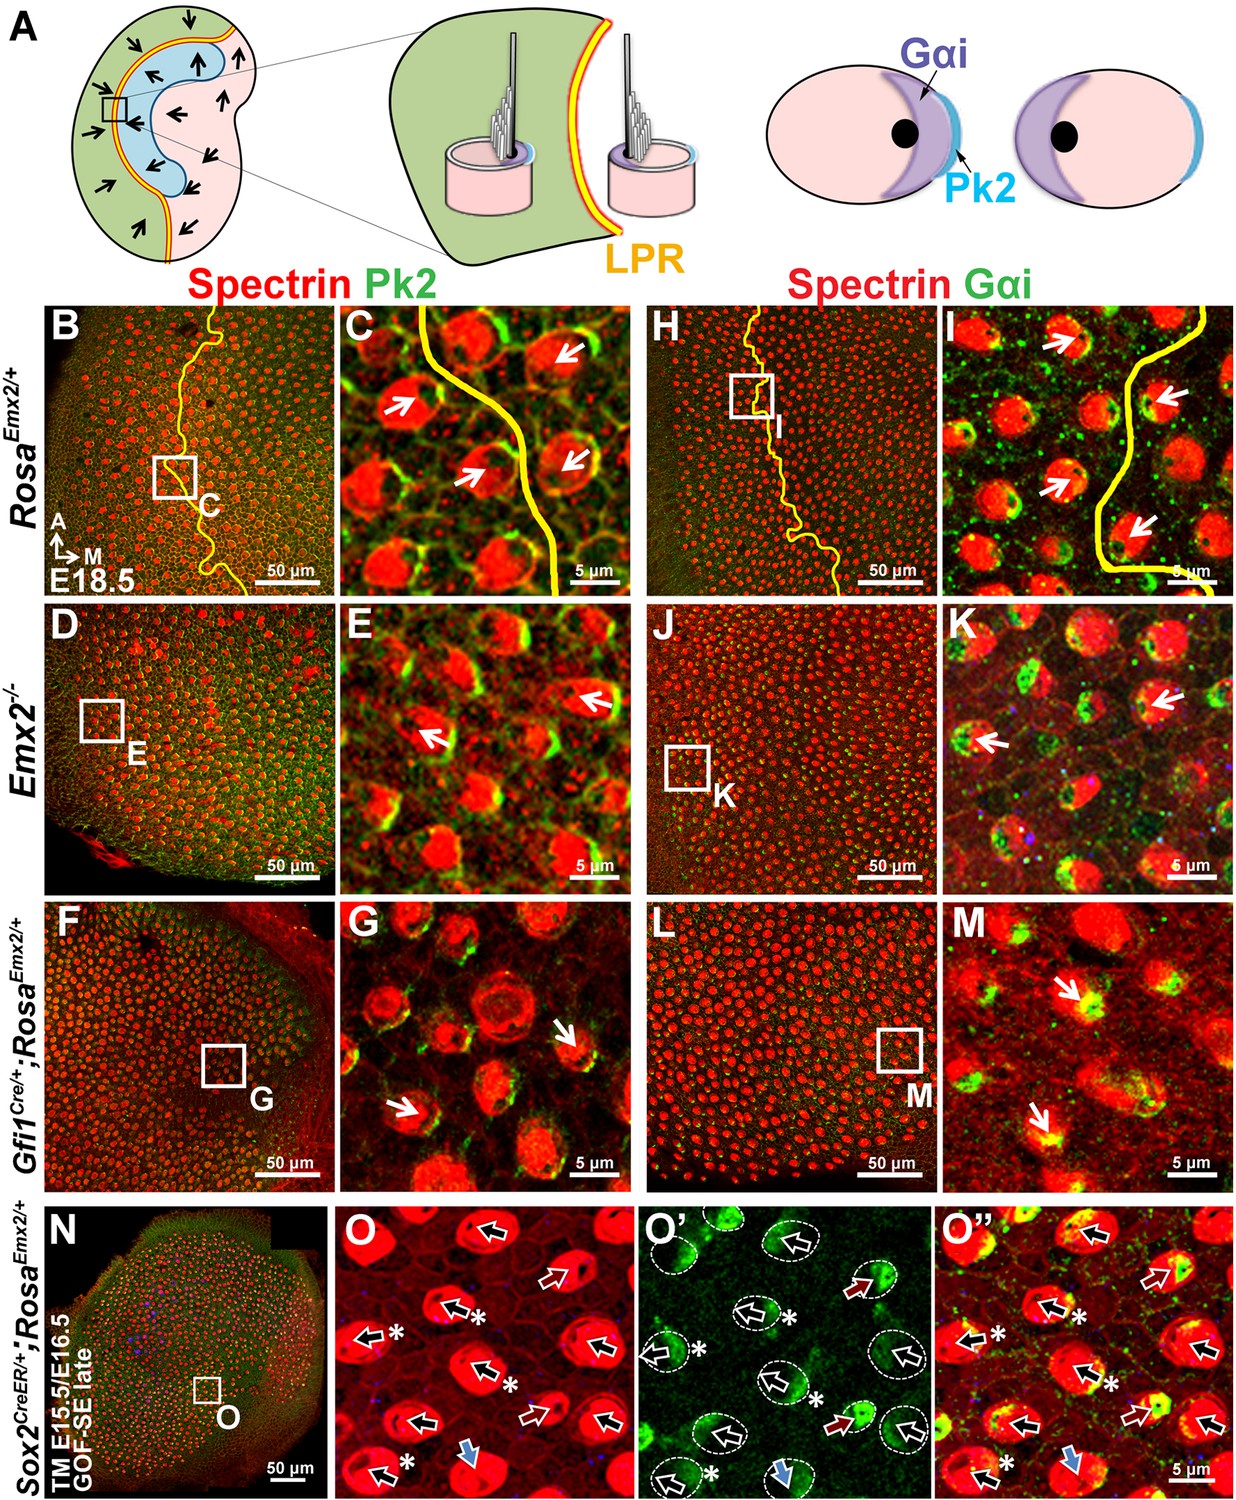
Hair bundle polarity reversal is associated with reversed Gαi but not Pk2 localization in Emx2 mutants.
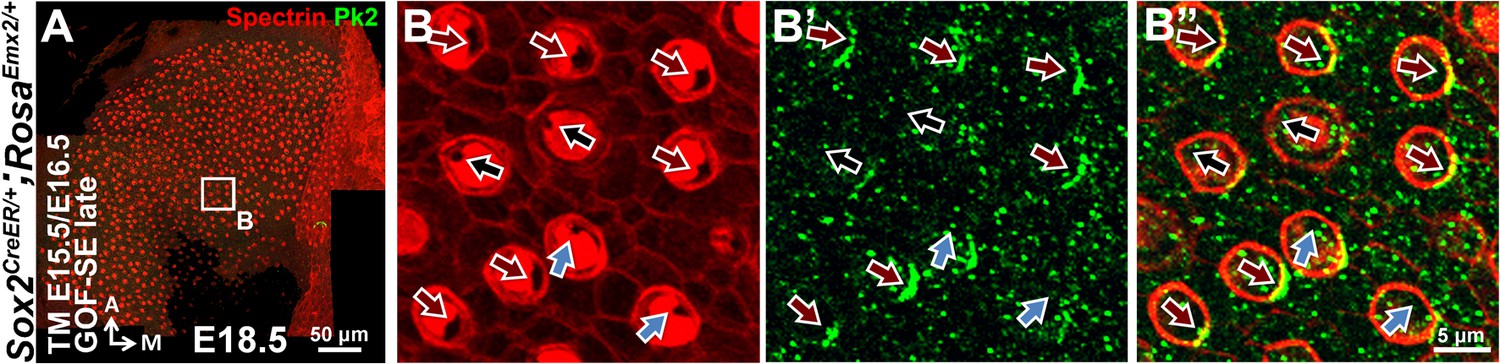
(A) Schematic diagram illustrates the distribution of Pk2 and Gαi in HCs across the LPR of a control utricle. (B–C) In control utricles, Pk2 staining (green) is concentrated on the medial side of HC-supporting cell border across the LPR (n = 15). (D–G) In the lateral region of Emx2-/- (D-E; n = 5) and medial region of Gfi1Cre/+;RosaEmx2/+ utricles (F-G; n = 4), in which the hair bundle polarity is reversed compared to the respective left and right side of the LPR in controls (C), Pk2 staining remained on the medial side (green). (H–M) In control utricles (H–I), Gαi immunostaining (green) is associated with the kinocilium. This relationship is consistent among all HCs of the utricle and the staining pattern of Gαi is reversed across the LPR (yellow line) (I; n = 8). A similar spatial relationship between Gαi and the kinocilium position is observed in Emx2 -/- (J-K; n = 4) and Gfi1Cre/+;RosaEmx2/+ (L-M; n = 5) utricles as controls. (N–O”) Sox2CreER/+;RosaEmx2/+ utricles ( GOF-SE late) show mixed phenotypes including normal (black arrows), misoriented (blue arrows), and reversed (red arrows) kinocilia (n = 3). Some HCs with normal polarity show the abnormal Gαi distribution (asterisks).
Figure 6—figure supplement 1
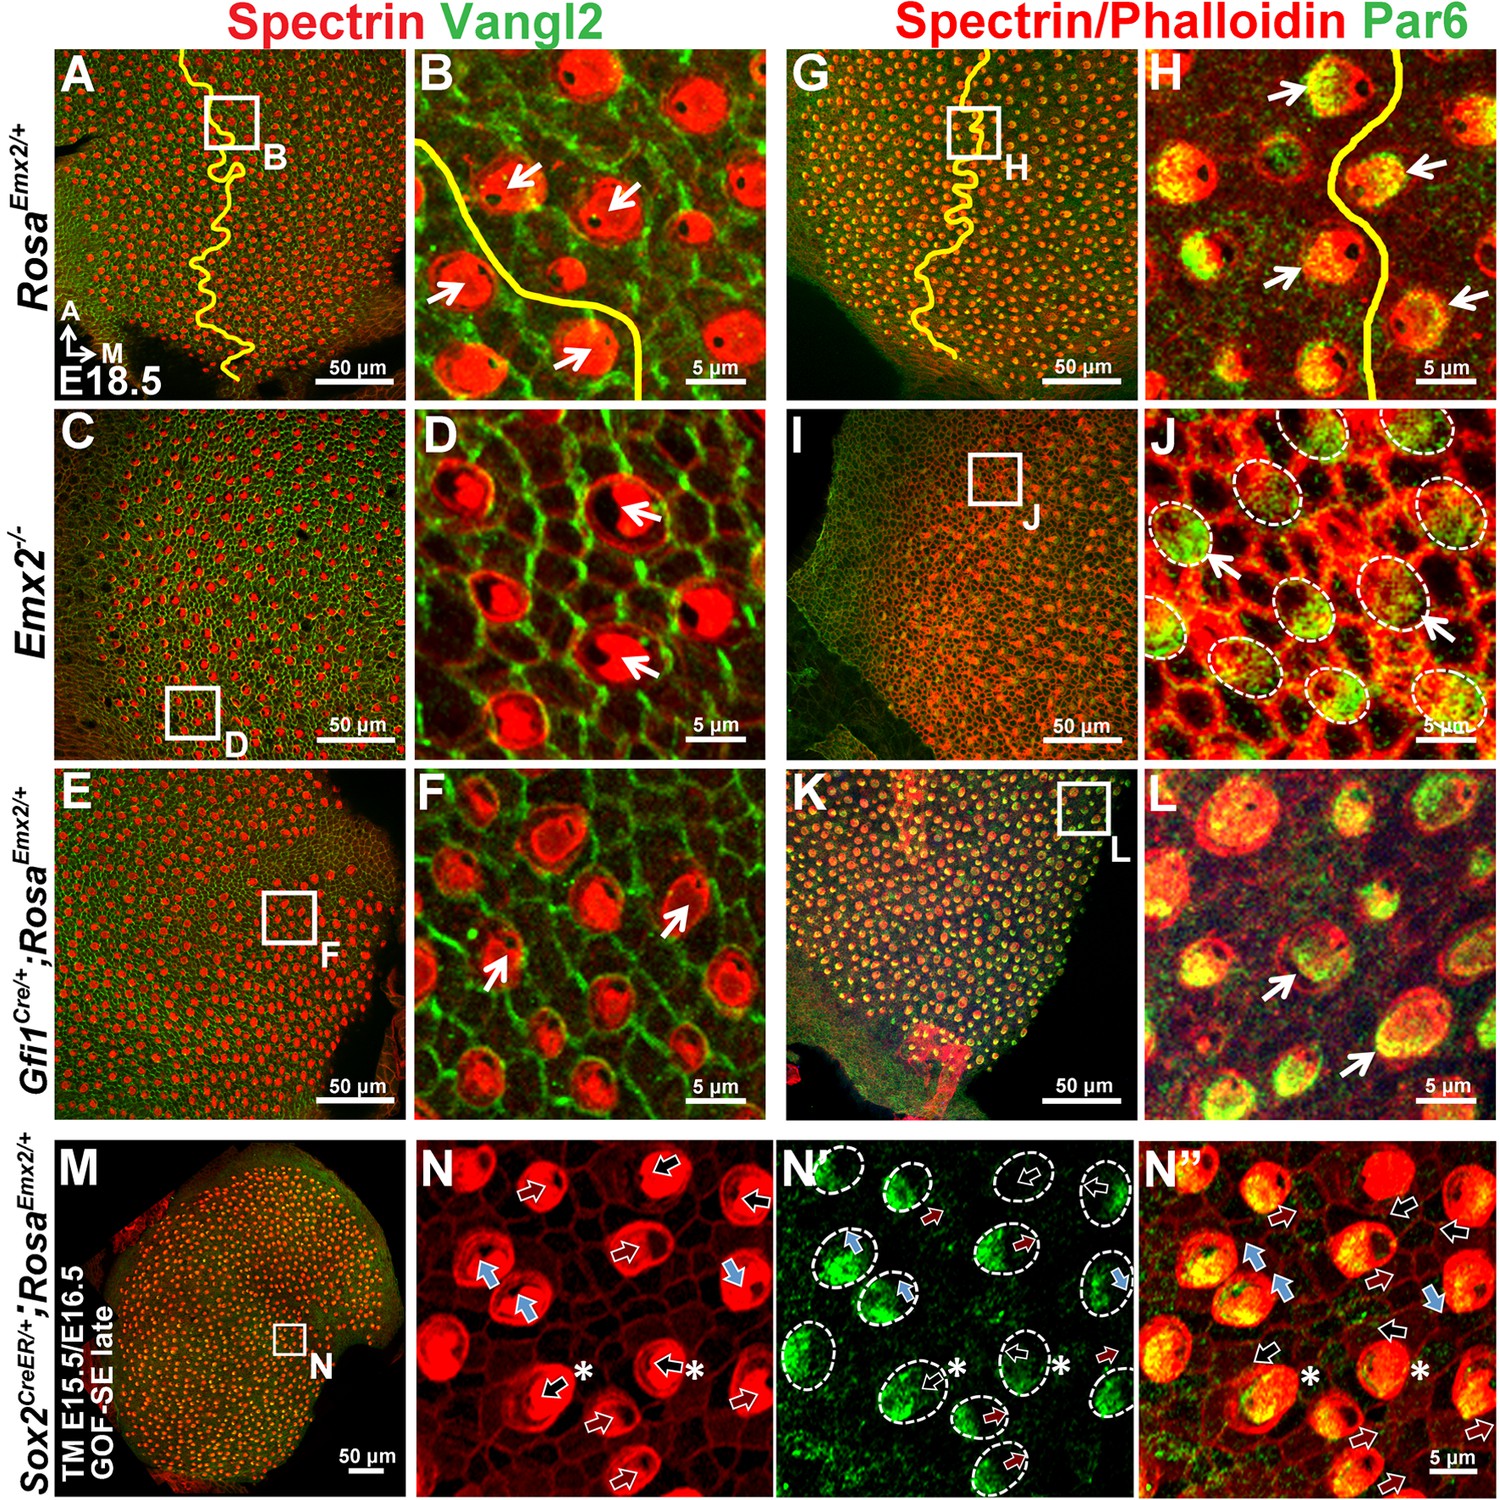
Distribution of Vangl2 and Par6 immunoreactivites in apical HCs is not changed in Emx2 mutant utricles.
(A–B) In controls (n = 3), Vangl2 immunostaining (green) are restricted, stronger between adjacent supporting cells and weaker between HC and supporting cell junction. The staining pattern of Vangl2 is not changed across the LPR (Jones et al., 2014). (C–F) In the lateral region of Emx2-/- utricle (C-D; n = 3) and medial region of Gfi1Cre/+;RosaEmx2/+ utricle (E-F; n = 3), in which the hair bundle polarity is reversed compared to controls (B), there is no obvious change in the distribution of Vangl2 immunostaining. (G–L) In control utricles (G-H; n = 3), Par6 (green) is localized in the apical surface of HCs opposite to the kinocilium (H). This relationship between kinocilium and Par6 is consistent in all HCs and the staining pattern of Par6 is reversed across the LPR (yellow line). Similar relationship between Par6 immunostaining and kinocilium position (lack of phalloidin staining) is observed in Emx2 -/- (I-J; n = 3) and Gfi1Cre/+;RosaEmx2/+ (K-L; n = 3) utricles as controls. (M–N”) Activating Emx2 at a later age by administering tamoxifen at E15.5 and E16.5 causes mixed phenotypes in Sox2CreER/+;RosaEmx2/+ utricles (GOF-SE late; n = 3): normal (black arrows), reversed (red arrows) or misoriented (blue arrows) kinocilia. In some HCs with normal hair bundle polarity, anti-Par6 distribution is no longer complementary to the kinocilium position (asterisks).
Figure 6—figure supplement 2
Distribution of Pk2 immunoreactivites in apical HCs is maintained in Emx2 GOF-SE late mutant utricles.
In the GOF-SE late utricle (A–B"), hair bundles can be normal (black arrows), reversed (red arrows), or misoriented (blue arrows). However, the immunoreactivities of Pk2 is maintained on the medial side of HC-supporting cell boundary regardless of the hair bundle polarity.
Figure 7
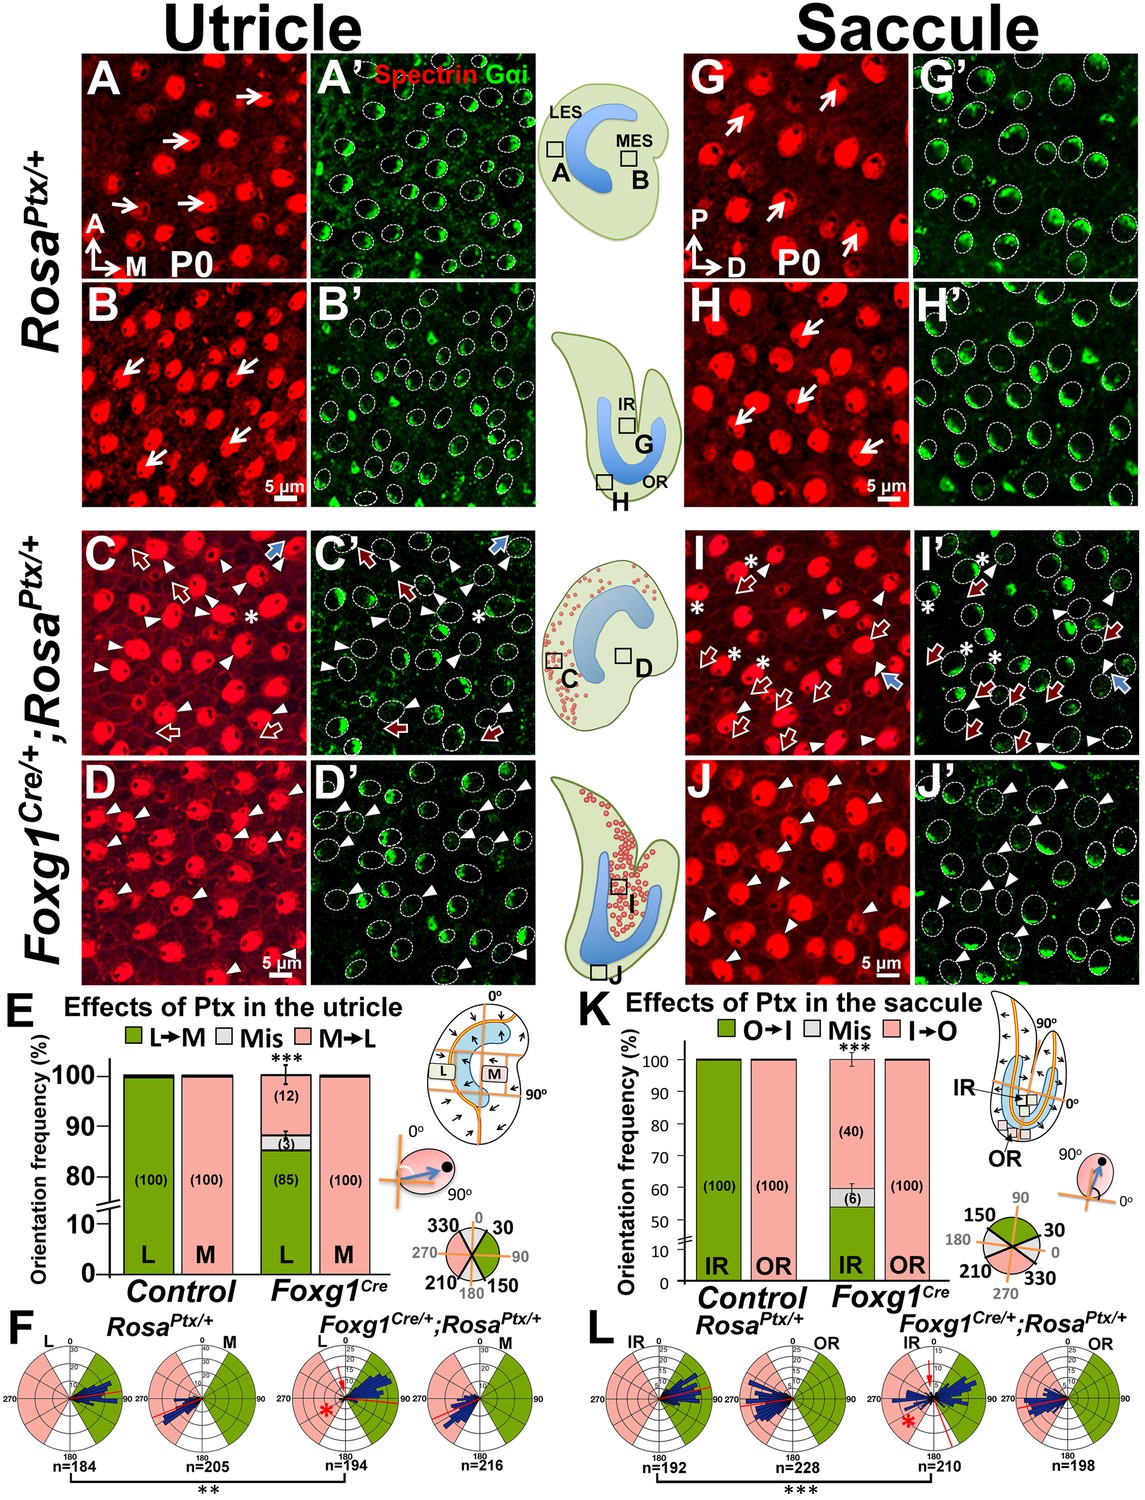
Inhibition of Gαi reverses hair bundle orientation in the Emx2-positive domain of maculae.
(A–B’) In control utricles, hair bundles are pointing toward medial and lateral in the respective LES and MES (arrows), and Gαi staining (A’,B’) is associated with the kinocilium (A,B; n = 3). (C–D’) In Foxg1Cre/+;RosaPtx/+ utricles, hair bundles in the LES (C) are sometimes reversed (red arrows) or misoriented (blue arrows) but not in the MES (D; n = 3). The accumulation of Gαi in HCs is reduced across the utricle (C’,D’, arrowheads). Occasionally, uncoupling between the kinocilium and Gαi is found in HCs of the LES (C-C’, asterisks). (E,F) Quantification of the hair bundle orientation in regions L and M of control and Foxg1Cre/+; RosaPtx/+ utricles are plotted in a bar graph (E; Figure 7—source data 1) and circular histogram (F). HCs with the kinocilium positioned within 30°-150° are green (pointing medial), between 210°-330° are pink (pointing lateral), and intermediates (misoriented) are denoted by grey. In region L of mutants, 15% HCs showed abnormal hair bundle orientations. (G–J’) Compared to controls (G-H’; n = 3), reduced Gαi is observed across Foxg1Cre/+;RosaPtx/+ saccules (I-J’; n = 3) but misoriented (blue arrows) or reversed (red arrows) kinocilia are only found in the IR (I–I’) but not the OR (J–J’). (K–L) Quantification of hair bundle orientation pointing toward inner or outer margin are defined as 30°–150° (green) or 210°–330° (pink), respectively (Figure 7—source data 1). In the IR of mutants, 46% of hair bundles showed reversed or misoriented polarity. Red asterisks, arrows, and lines represent hair bundle reversal, misorientation, and average degree of HC orientation, respectively. Schematic diagrams indicate the locations of where the corresponding panels were taken as well as positions of all HCs with reversed hair bundles are found in the sample (red dots). **p<0.01, ***p<0.001.
-
Figure 7—source data 1
Quantification of hair bundle orientation in Ptx mutants.
- https://doi.org/10.7554/eLife.23661.020
Figure 8
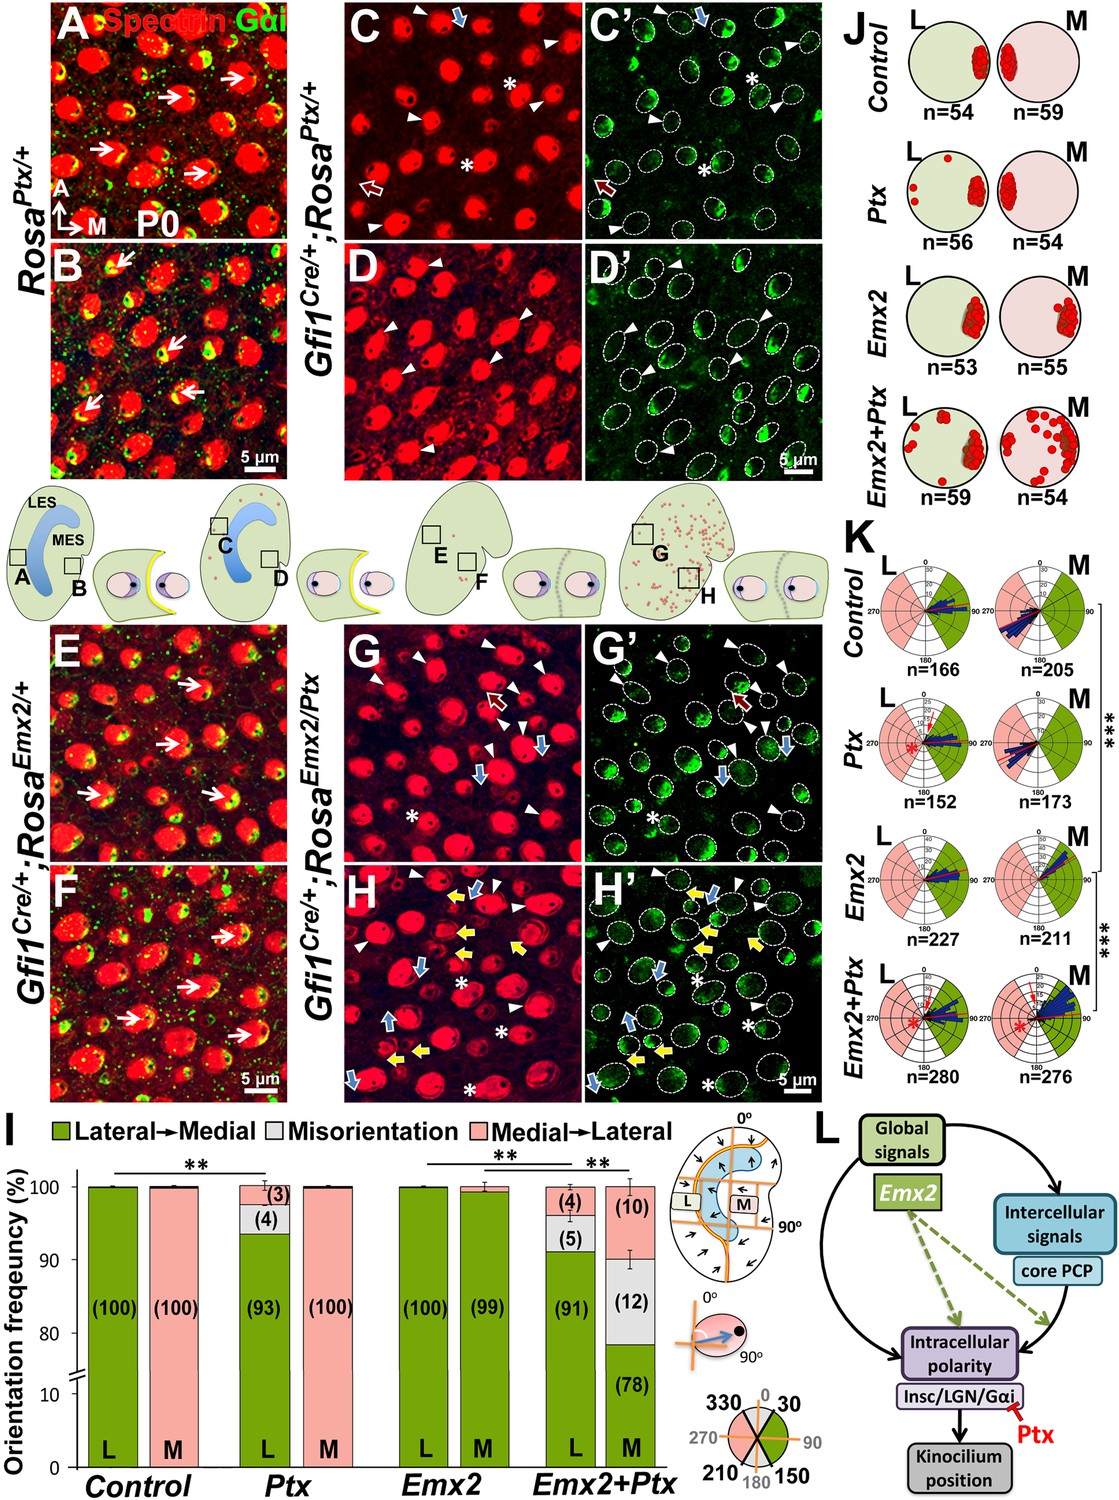
Emx2-mediated hair bundle polarity reversal requires heterotrimeric G-proteins.
(A–H’) Compared to RosaPtx/+ controls (A–B), some hair bundles show reversed polarity in the LES (C–C’) but not the MES (D–D’) of Gfi1Cre/+;RosaPtx/+ utricles. Ectopic Ptx and Emx2 in Gfi1Cre/+;RosaEmx2/Ptx utricles rescued -bundle polarity reversal in the MES (H–H’) but has no additional effect in the LES (G–G’). Red, blue and yellow arrows represent reversed, misoriented and rescued hair bundle polarity, respectively. Arrowheads and asterisks represent anti-Gαi staining that is reduced/diffuse or no longer associated with the kinocilium, respectively. Schematic diagrams indicate the locations where panels A-H were taken as well as the positions where reversed hair bundles were found (red dots). (I) Quantification of the hair bundle orientation (Figure 8—source data 1). Ptx causes abnormal hair bundle polarity in region L of controls (7%) and ectopic Emx2 (9%). Reversed hair bundle polarity induced by Emx2 in region M is partially rescued by ectopic Ptx (22%, **p<0.01; n = 3 for each group). (J) Plots of kinocilium location (red dots) in HCs within regions L and M of one specimen. (K) Circular histograms summarizing HC orientation distributions in regions L and M for each genotype indicated (n = 3). ***p<0.001. (L) Model of Emx2 effectors in kinocilium positioning by directly regulating the Insc/LGN/Gαi complex (purple) or indirectly regulating the interaction between intercellular (light blue) and intracellular polarity pathways.
-
Figure 8—source data 1
Quantification of hair bundle orientation in utricles of Ptx single and Ptx and Emx2 compound mutants.
- https://doi.org/10.7554/eLife.23661.022
Figure 9
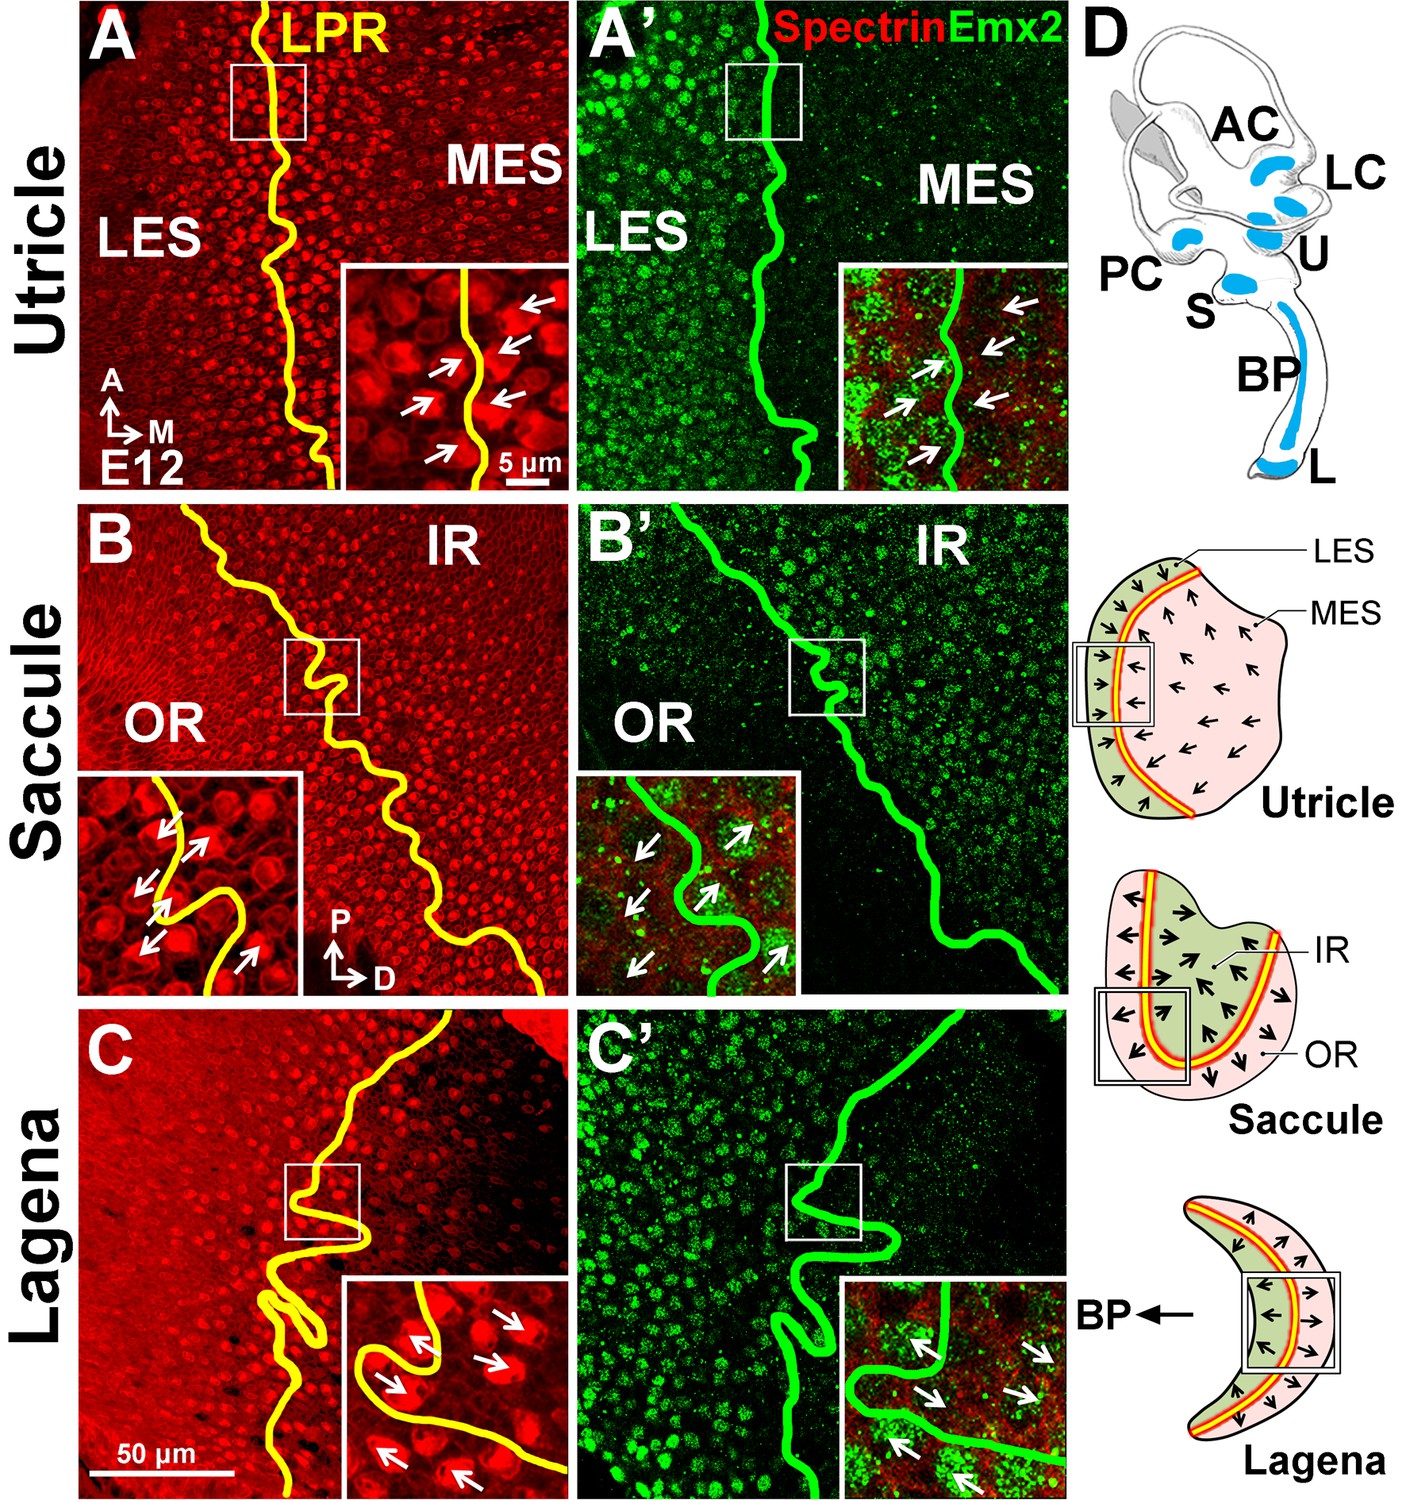
Conserved expression of Emx2 in the three chicken maculae.
(A–C’) Anti-Emx2 immunostaining of the chicken utricle (A,A’), saccule (B,B’) and lagena (C,C’) at E12. (A–C) Anti-spectrin staining (red) shows opposite hair bundle orientation across the LPR (yellow line). In the same regions shown in (A), (B), and (C) but at the level of the cell body, the border (green line) of the Emx2-positive region (green) is restricted to only one side of the LPR: lateral region of the utricle (A’), inner region of the saccule (B’), and proximal region of the lagena, which is closer to the cochlea/basilar papilla (BP) (C’), respectively (n = 3). (D) Schematic diagrams of the chicken inner ear and its three macular organs.
Figure 10 with 1 supplement
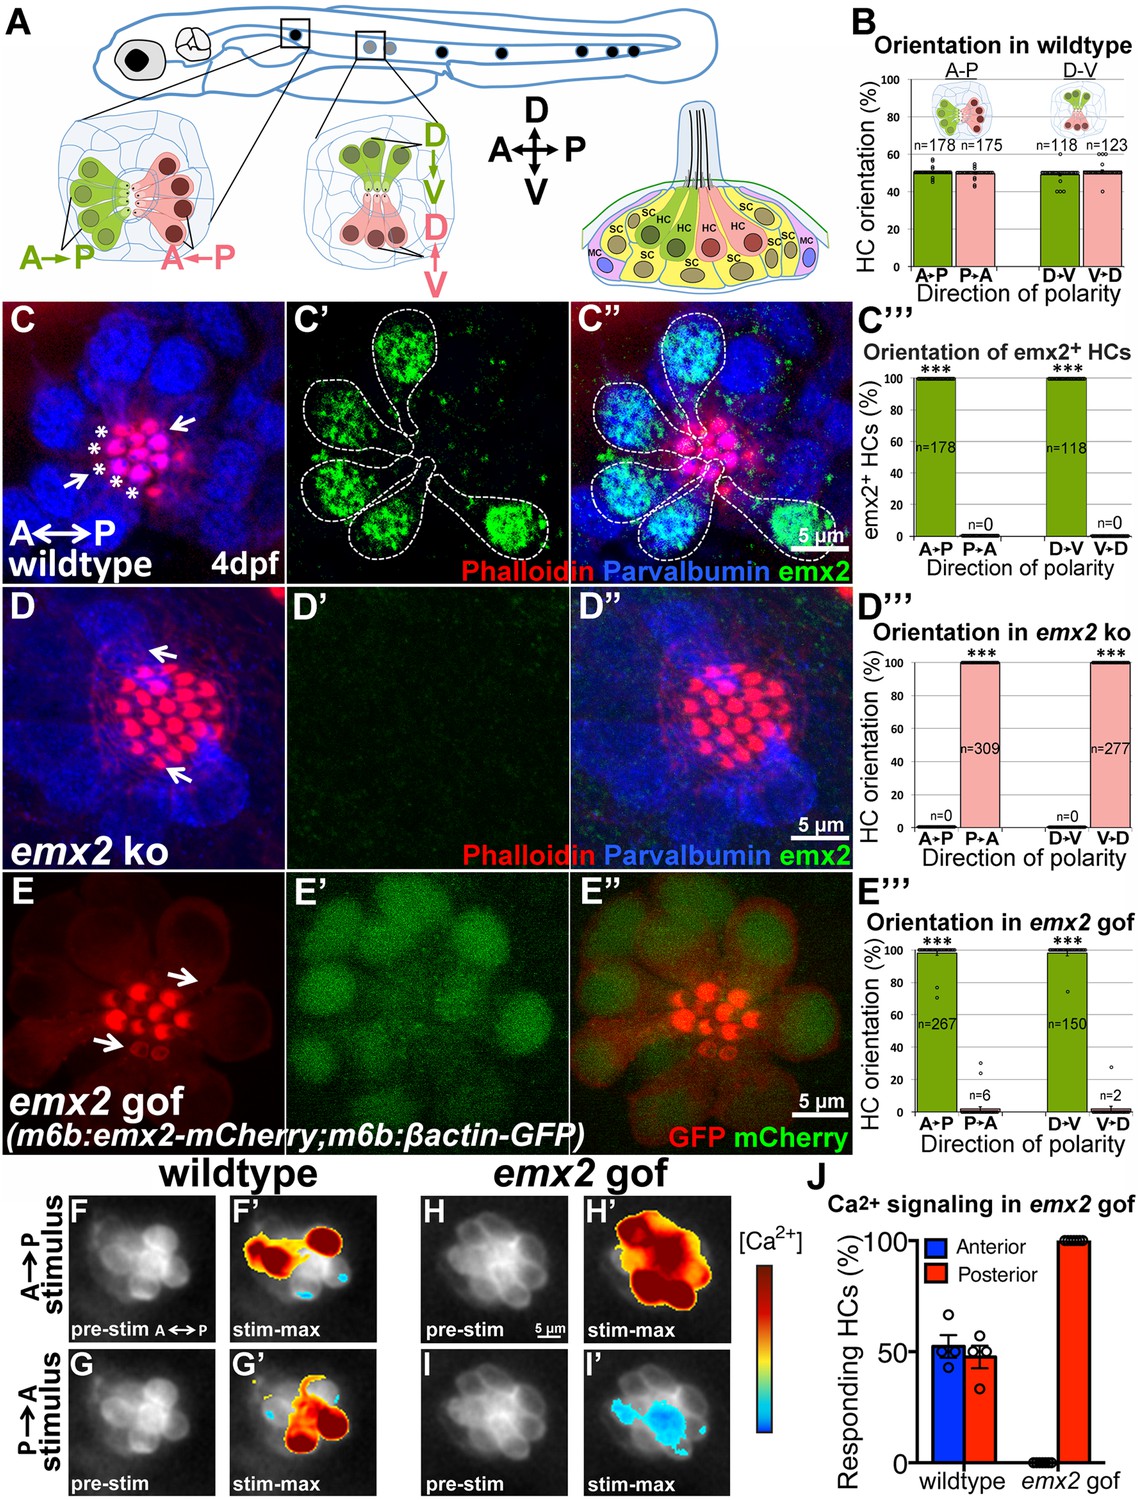
emx2 regulates hair bundle polarity in neuromasts.
(A) Surface view of an A-P and D-V oriented neuromast and a sagittal view of the cellular architecture of a neuromast in the lateral line of zebrafish. (B) HCs with opposite orientation are in a 1:1 ratio. (C–C”) An example and (C”’) quantification showing only HCs (parvalbumin-positive, blue) with hair bundles (phalloidin, red) oriented toward the posterior (C, asterisks) or ventral direction are positive for anti-Emx2 staining (green) in A-P and D-V neuromasts, respectively (55 neuromasts from 26 larvae, ***p<0.001; Figure 10—source data 1). (D–D”) An example and (D”’) quantification of HCs in emx2 knockouts showing all HCs are emx2-negative (D’) and pointing towards the same direction (36 neuromasts, 18 larvae, ***p<0.001; Figure 10—source data 1). (E–E”’) All hair bundles (visualized using m6b:βactin-GFP, red) are Emx2-positive (E’,E’’, green) and pointing toward the posterior in the A-P oriented neuromasts of gof mutants. (E’”) Quantification of hair bundle polarity in 43 A-P and D-V neuromasts from 23 larvae (Figure 10—source data 1). ***p<0.001. (F–J) In response to an anterior-to-posterior stimulus (F’) or posterior-to-anterior stimulus (G’) a similar percentage of wildtype HCs show mechanically-evoked increase in calcium levels (J; Figure 10—source data 2). Emx2 gof HCs only respond to an anterior-to-posterior stimulus (H’) and are inhibited by a posterior-to-anterior stimulus (I’). The heatmap indicates the change in calcium levels during the first half of the 2s-step stimulus (2 larvae and 4 neuromasts in control, 2 larvae and 7 neuromasts in emx2 gof). Error bar represents SEM.
-
Figure 10—source data 1
Quantification of hair bundle orientation in neuromasts of emx2 loss- and gain-of-function mutants.
- https://doi.org/10.7554/eLife.23661.025
-
Figure 10—source data 2
Quantification of calcium-activated HCs with oriented stimuli in emx2 gain-of-function neuromasts.
- https://doi.org/10.7554/eLife.23661.026
Figure 10—figure supplement 1

Polarity phenotypes in the utricle and lateral crista of emx2 loss- and gain-of function zebrafish mutants.
(A) Two targeted sites of deletion (red site 1 and green site 2) in exon1 of emx2 using CRISPR/Cas9 technology. Guide targets (blue), PAM sequences (red), and examples of deletions found are shown. (B–D) Utricle and (E–J) lateral crista of controls (B,E,F), emx2 knockout (C,G,H), and emx2 gain-of-function, m6b:emx2-mCherry, zebrafish (D,I,J). (B–D) The LPR is by the lateral edge of the utricle in zebrafish (B; n = 10), which is absent in emx2 knockout utricles (C; n = 13) as well as in gof (m6b:emx2-mCherry) utricles (D; n = 9). Based on phalloidin staining (red), HCs at the edge of emx2 knockout utricles point toward the lateral (inset in C), whereas HCs in the medial region of gof utricles now point toward the medial (inset in D), opposite from controls (inset in B). (E–J) Arrows indicate the direction of hair bundle polarity based on βactin-GFP label (red). Hair bundles in the lateral crista of control are pointing toward the anterior direction (E,F; n = 6) and this polarity is not affected in the emx2 knockout fish (G,H; n = 3) but reversed in the gof cristae (I,J; n = 3).
Author response image 1
Download links
A two-part list of links to download the article, or parts of the article, in various formats.
Downloads (link to download the article as PDF)
Open citations (links to open the citations from this article in various online reference manager services)
Cite this article (links to download the citations from this article in formats compatible with various reference manager tools)
Transcription factor Emx2 controls stereociliary bundle orientation of sensory hair cells
eLife 6:e23661.
https://doi.org/10.7554/eLife.23661


