DNA methylation and gene expression changes derived from assisted reproductive technologies can be decreased by reproductive fluids
- Universidad de Murcia-Campus Mare Nostrum, Spain
- Instituto Murciano de Investigación Biosanitaria, Spain
- The Babraham Institute, United Kingdom
- University of Cambridge, United Kingdom
Figures
Figure 1

Schematic representation of three different sperm processing protocols used for in vitro fertilization.
Swim-up-BSA: NaturARTs PIG medium + BSA; Swim-up-Fluid: NaturARTs PIG medium + POF-LF*. Density gradient centrifugation: centrifugation through a discontinuous Percoll: gradient (45% and 90% v/v). *POF-LF: porcine oviductal fluid collected at the late follicular phase of the estrous cycle. Red box represents the portion of the reproductive tract whose conditions we tried to resemble in vitro. IVF results after using these three different sperm processing protocols are included in Table 1.
Figure 2
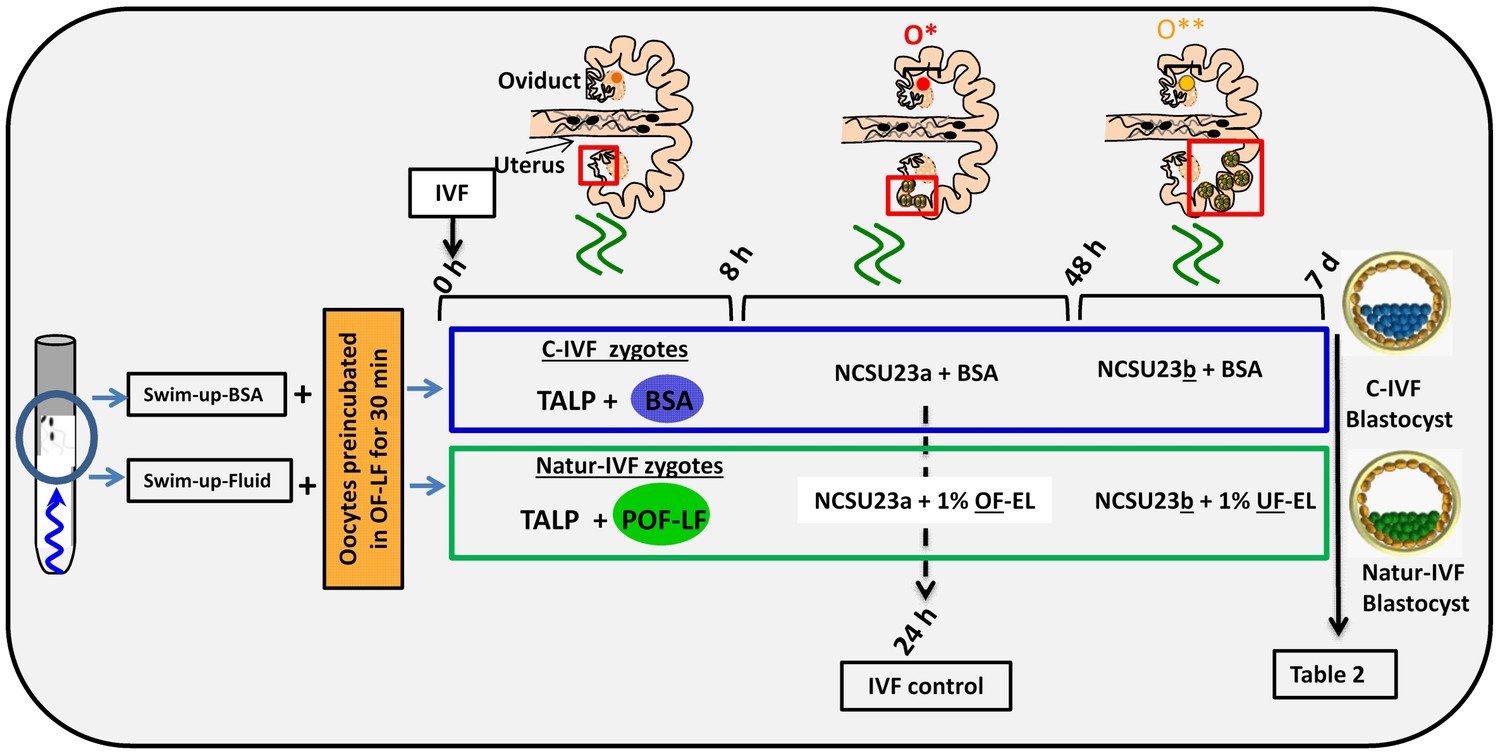
Schematic representation of the different steps of the new IVF/EC system.
Swim-up-BSA or Swim-up-Fluid protocols were used for IVF. Previously, oocytes were preincubated in OF-LF for 30 min. Then, each group of putative zygotes were incubated in different media (0–8 hr, 8–48 hr and 48 hr-7days) as indicated in the diagram. O*: ovary with hemorrhagic corpus luteum; O**: early corpus luteum; OF-LF: oviductal fluid-late follicular phase of the estrous cycle; OF-EL: oviductal fluid-early luteal phase of the estrous cycle; UF-EL: uterine fluid-early luteal phase of the estrous cycle. Swim-up-BSA: NaturARTs PIG medium + BSA; Swim-up-Fluid: NaturARTs PIG medium + POF-LF. TALP: culture medium used for IVF. NCSU23: culture medium used for embryo development in vitro supplemented with sodium lactate, pyruvate and non-essential amino acids (NCSU23a) or with glucose and essential and non-essential amino acids (NCSU23b).
Figure 3
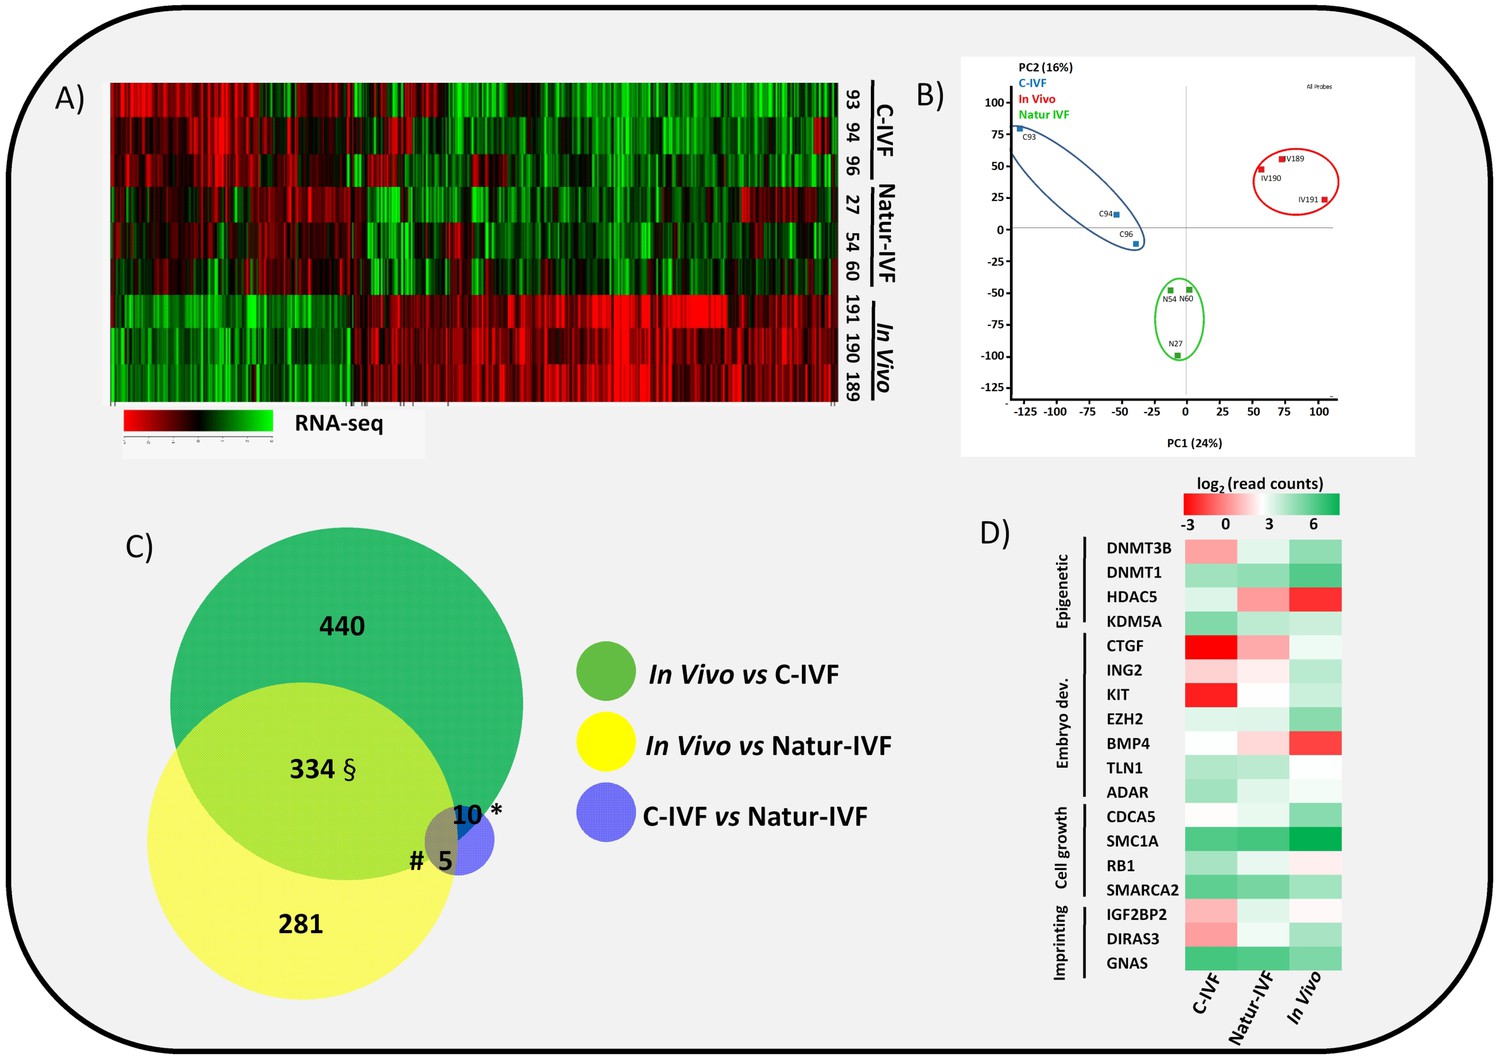
Gene expressed analysis in blastocysts obtained in vivo, by the Natur-IVF system or by C-IVF system.
(A) Heatmap of global gene expression (with log2 fold change >1.5 and adjusted B-H p-value < 0.05). Numbers denote ID of a specific embryo. (B) Principal Component Analysis (PCA) of the RNA-Seq samples: In vivo embryos (IV, red), Natur-IVF (N, green) and C-IVF (C, blue). Numbers denote ID of specific embryos. (C) Venn diagram with DEGs (Figure 3—source data 1). *, #, § denotes DEGs exclusive for C-IVF, Natur-IVF and In vivo, respectively (Figure 3—source data 2). (D) Heat map of gene expression of key genes associated with embryo development/differentiation, epigenetic reprogramming, cell cycle/cell growth, gene expression and imprinting.
-
Figure 3—source data 1
Differentially expressed genes (DEGs) for pair-wise comparisons (C-IVF vs Natur-IVF, In vivovs Natur-IVF, C-IVF vs In vivo) and list of all gene expression values.
This data relates to Figure 3C.
- https://doi.org/10.7554/eLife.23670.008
-
Figure 3—source data 2
DEGs exclusives for each group: 328 DEG exclusive In vivo, 7 DEGs exclusive Natur-IVF and 13 DEGs exclusive C-IVF.
This data relates to Figure 3C.
- https://doi.org/10.7554/eLife.23670.009
Figure 4

Distribution of methylation levels and general view of the methylation profiles of 9 individual pig blastocysts.
(A) Distribution of methylation percentages across tiles of 150 CpGs on the pig genome for three groups of blastocysts (In-vivo, C-IVF and Natur-IVF). (B) Random browser shot as example of methylation landscape of the nine individual blastocysts analysed (Chr8:37027152–118458156). The two first rows in the picture represent the genes and CpG islands annotated (Ensembl, RRID:SCR_006773 Sus scrofa 10.2) in the pig genome, respectively. Color scale represents methylation levels from red (highest methylation, up to 25%) to blue (lowest methylation-0%).
Figure 5
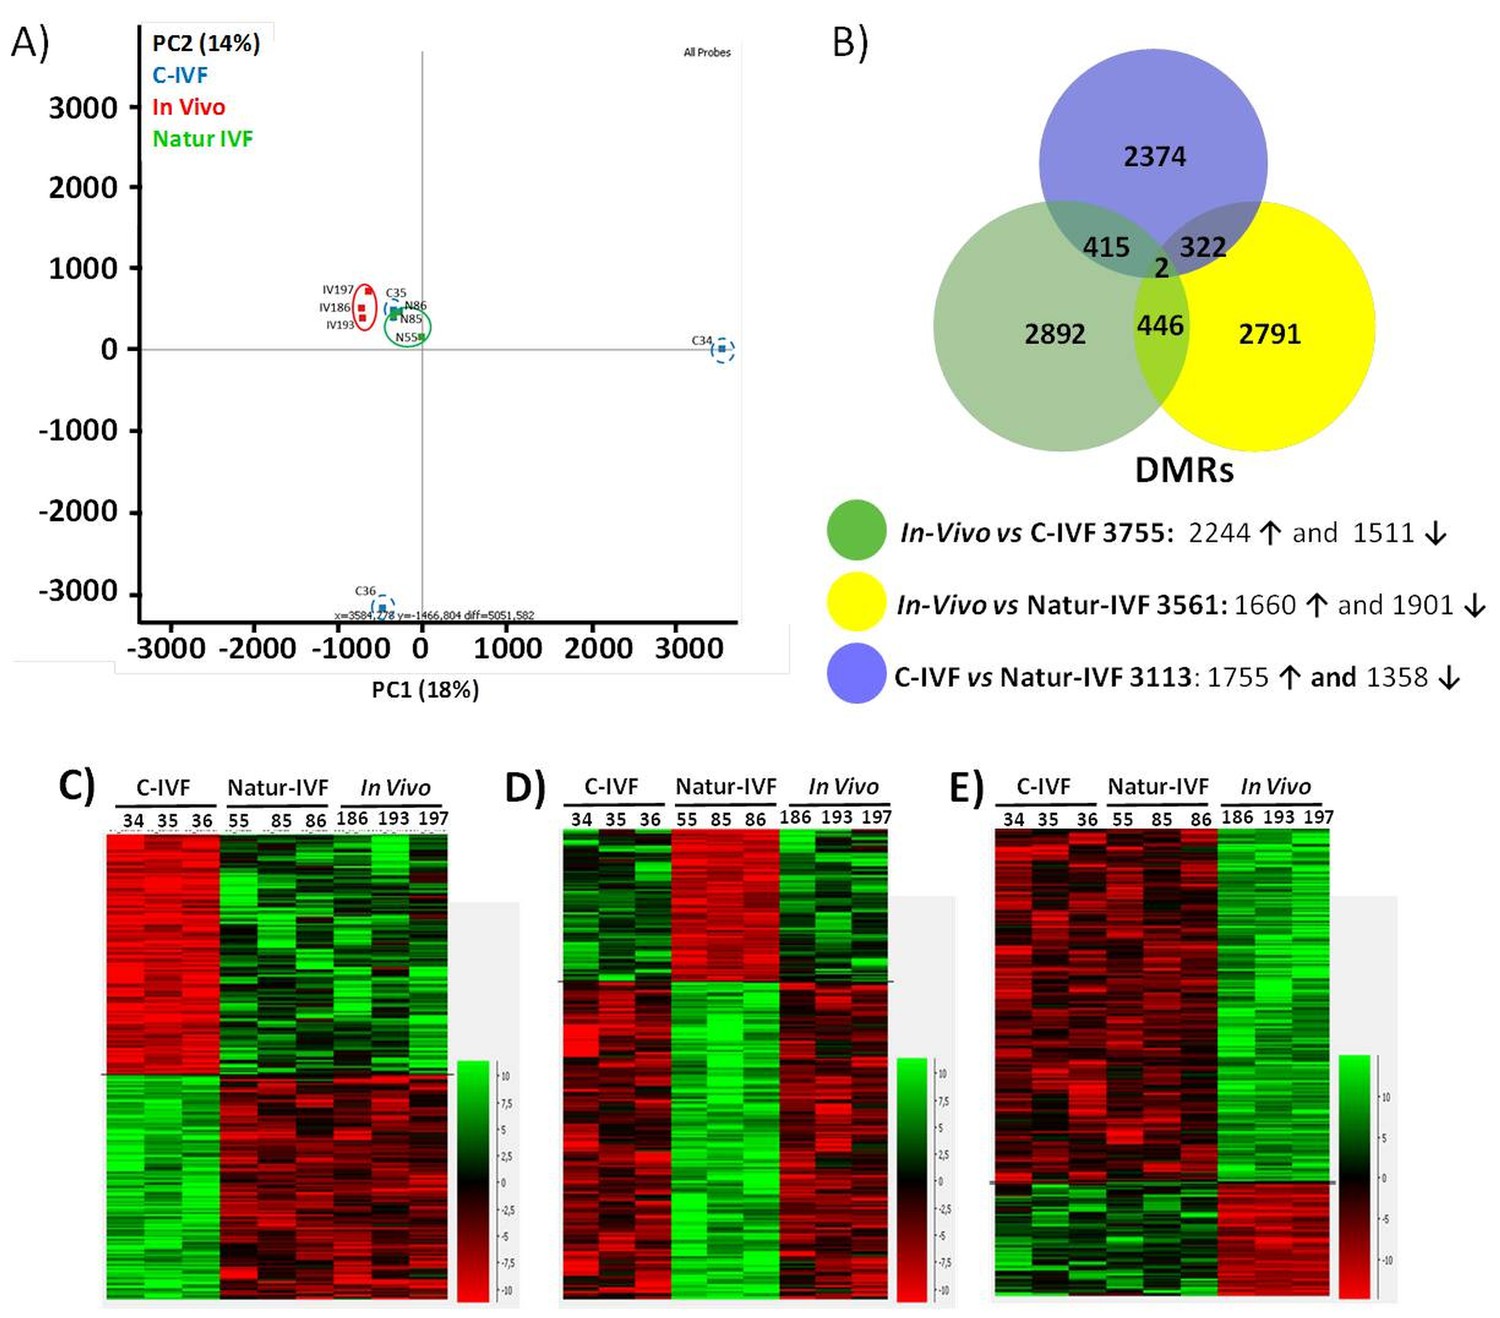
DNA-methylation analysis in blastocysts obtained in vivo, by the Natur-IVF system or by C-IVF system.
(A) Principal Component Analysis (PCA) of the DNA methylation samples: In vivo embryos (red), Natur-IVF (green) and C-IVF (blue). Numbers denote ID of specific embryo. (B) Venn diagram of DMRs by pair-wise comparison (adjusted-p <0.05). Number of DMRs with higher (↑) or lower (↓) methylation in each pair-wise comparison are indicated (Figure 5—source data 1). (C) Heatmap of the 417 DMRs between the C-IVF group and the other two groups (In vivo and Natur-IVF). (D) Heatmap of the 324 DMRs between Natur-IVF group and the other two groups (In vivo and C-IVF). (E) Heatmap of the 448 DMRs between the In vivo group and the other two groups (Natur-IVF and C-IVF). For C, D and E (Figure 5—source data 2): Relative methylation measure as the difference in percent of methylation from the median methylation across all samples.
-
Figure 5—source data 1
All differentially methylated regions (DMRs) for each pair-wise comparison (C-IVF vs Natur-IVF, In vivo vs Natur-IVF, C-IVF vs In vivo).
This data relates to Figure 5B.
- https://doi.org/10.7554/eLife.23670.013
-
Figure 5—source data 2
Differentially methylated regions (DMRs) exclusive for each group (C-IVF, Natur-IVF, In vivo). This data related to Figure 5B,C,D and E.
- https://doi.org/10.7554/eLife.23670.014
Figure 6
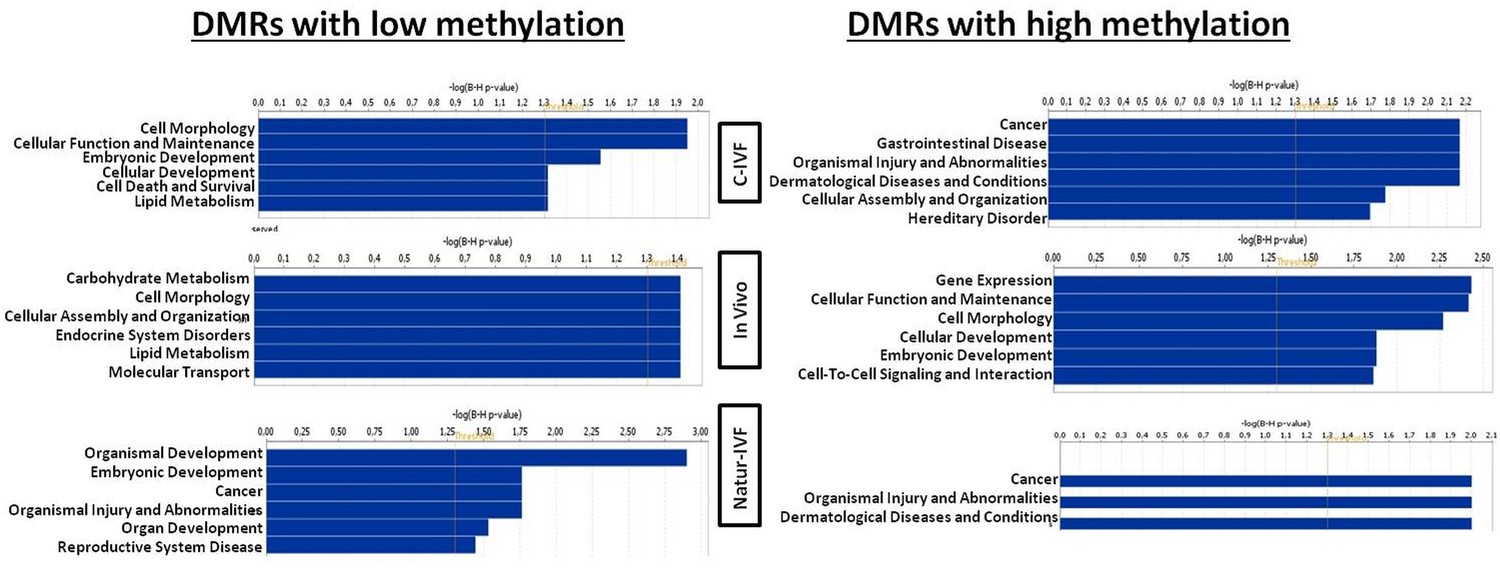
Top Diseases and Bio Functions linked by Ingenuity Pathways Analysis to DMRs exclusive for each group with low or high methylation.
https://doi.org/10.7554/eLife.23670.015
Figure 7
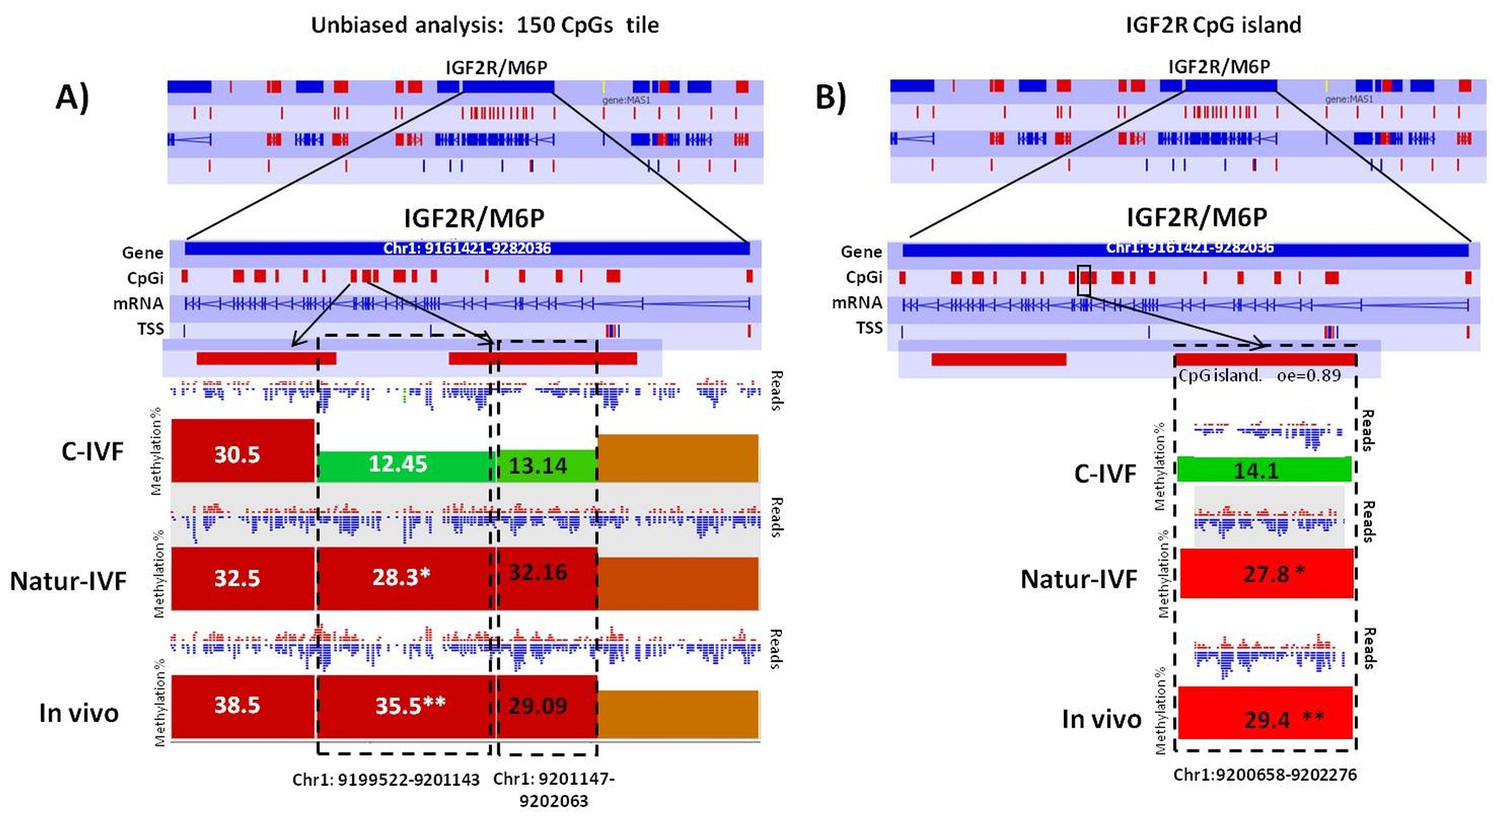
Methylation differences at IGF2R.
(A) Methylation quantitation at IGF2R from the unbiased analysis of genome methylation in SeqMonk with a fixed size of 150 CpG windows. Mean percentages of methylation are shown by the bars for each group. Blue (unmethylated) and red (methylated) dots represent methylation reads. Asterisks indicate that methylation at the indicated region showed significantly different values (p<0.05) in Natur-IVF (*) and In vivo (**) vs C-IVF. TSS: transcription starting site. (B) Detailed view and methylation quantitation of the CpGi at the identified IGF2R DMR. Red rectangles represent, as indicated, CpG islands of the genes. Black boxes indicate the position of the targeted features, whose mean percentages of methylation are shown by the bars for each group. Blue (unmethylated) and red (methylated) dots represent methylation reads.
Figure 8
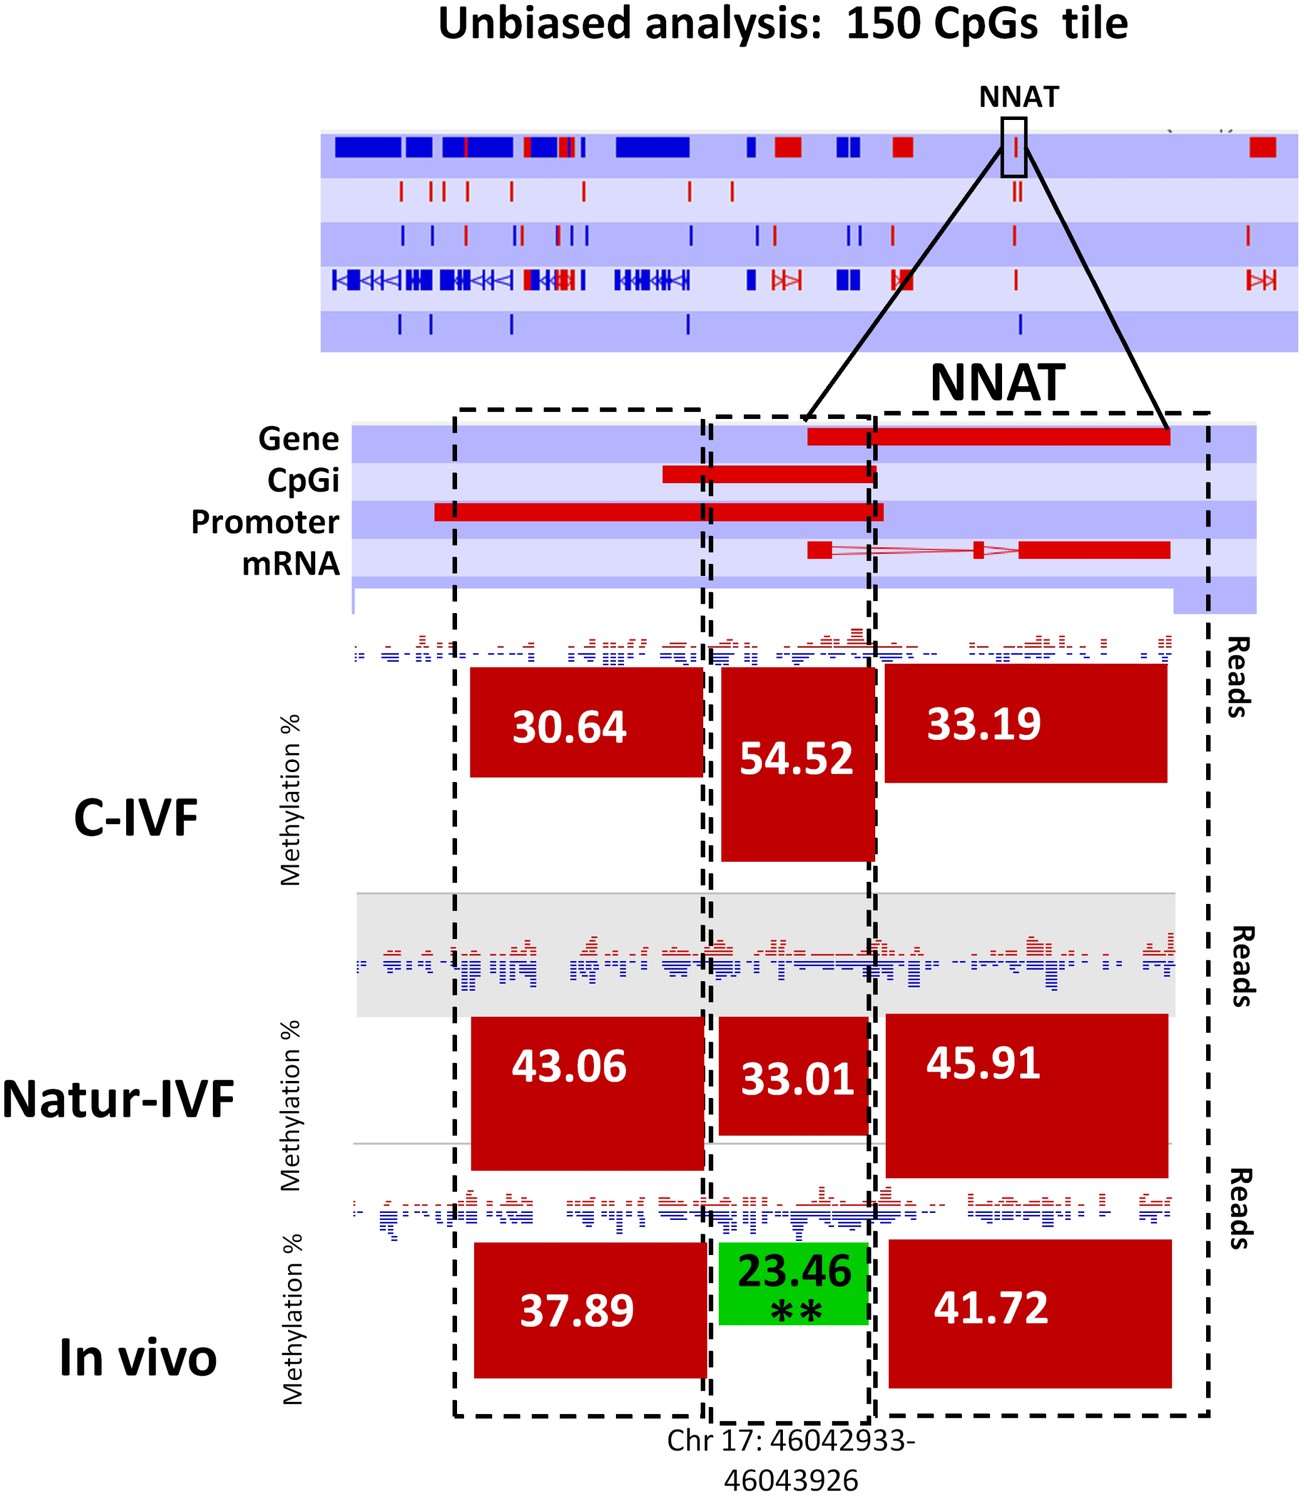
Methylation quantitation at NNAT from the unbiased analysis of genome methylation in SeqMonk with a fixed size of 150 CpG windows.
Black boxes indicate the position of the selected 150 CpG windows, whose mean percentages of methylation are shown by the bars for each group. Blue (unmethylated) and red (methylated) dots represent methylation reads. Asterisks indicate that methylation at the indicated region (black box) showed significantly different values (p<0.05) in Natur-IVF (*) and In-vivo (**) vs C-IVF.
Author response image 1
Tables
Table 1
IVF results after using three different sperm processing protocols (Density gradient, Swim-up-BSA and Swim-up-Fluid) as represented in Figure 1. a,b: Different letters in the same column indicate values statistically different (p<0.05). Penetration: proportion of oocytes penetrated by one or more spermatozoa. Monospermy: Monospermy percentage, calculated from penetrated oocytes, represents the proportion of penetrated oocytes with only one spermatozoon inside the ooplasm. Spermatozoa/Oocyte: Mean number of sperm per penetrated oocyte. Spermatozoa/ZP: Mean number of spermatozoa attached to ZP per oocyte. Yield: Percentage of putative zygotes per oocyte.
| Sperm processing method | N | Penetration (%) | Monospermy (%) | Spermatozoa/Oocyte | Spermatozoa/ZP | Zygote yield (%) |
|---|---|---|---|---|---|---|
| Density gradient centrifugation | 105 | 84.3 ± 3.6a | 17.4 ± 4.1a | 8.4 ± 0.7a | 17.3 ± 2.3a | 14.6 ± 0.1a |
| Swim-up-BSA | 180 | 69.6 ± 3.5b | 42.7 ± 4.6ab | 2.1 ± 0.1b | 7.2 ± 0.5b | 29.7 ± 0.2b |
| Swim-up-Fluid | 183 | 71.1 ± 3.4b | 49.6 ± 4.5b | 2.7 ± 0.1b | 8.6 ± 0.5b | 35.2 ± 0.2c |
Table 2
(A) Comparative results of IVF yield by using BSA (C- IVF) or reproductive fluids (Natur-IVF) as additives in the culture medium for 7.5 days. (B) Results of blastocyst development (for each type) using BSA (C- IVF) or reproductive fluids (Natur-IVF) as additives in the culture medium for 7.5 days. Columns from ‘Early blastocyst’ to ‘Hatched blastocyst’ indicate the percentage of each type of blastocyst from Total blastocyst (Table 2A), classified according to Bo and Mapletoft25. a,b: Different letters in the same column indicate values statistically different (p<0.05). Cleavage: Cleavage percentage from N. Total Blastocysts: Percentage of blastocysts calculated from cleaved embryos. Yield: Percentage of putative blastocysts from N. Cell/blastocyst: mean number of cells per blastocyst.
| A) | |||||||||
| Group | N | Penetration (%) | Monospermy (%) | Cleavage (%) | Total blastocysts (%) | Blastocyst Yield (%) | Cell/ blastocyst | ||
| In vivo | 41 | 87.0 ± 7.2b | |||||||
| C- IVF | 903 | 395 (43.7 ± 0.1a) | 656 (72.7 ± 0.1) | 429 (47.5 ± 1.6a) | 178 (41.4 ± 2.4) | 19.6 ± 1.3 | 49.9 ± 3.7a | ||
| Natur-IVF | 961 | 640 (66.6 ± 0.1b) | 755 (78.6 ± 0.1) | 405 (42.1 ± 1.6b) | 180 (44.5 ± 2.5) | 18.7 ± 1.2 | 81.8 ± 7.2b | ||
 |  |  |  |  | |||||
| B) | |||||||||
| Group | N | Early blastocyst (%) | Blastocyts (%) | Expanded blastocyst (%) | Hatching blastocyst (%) | Hatched blastocyst (%) | |||
| C- IVF | 178 | 57 (31.7 ± 6.1)a | 50 (28.3 ± 5.9) | 71 (40.0 ± 6.4) | 0 (0)a | 0 (0)a | |||
| Natur -IVF | 180 | 23 (12.8 ± 5.4)b | 55 (30.8 ± 7.5) | 65 (35.9 ± 7.8) | 28 (15.4 ± 5.9)b | 9 (5.1 ± 3.6)b | |||
Table 3
Percentages of methylation over genome features in porcine blastocysts produced in vitro (C-IVF and Natur-IVF) or collected in vivo (In vivo).
| % Methylation | ||||
|---|---|---|---|---|
| In vivo | C-IVF | Natur-IVF | ||
| CpG islands | 9.69 | 11.80 | 10.11 | |
| Promoters | 9.26 | 11.61 | 9.11 | |
| TU | 12.84 | 15.47 | 12.36 | |
| Intergenic | 11.75 | 14.48 | 11.37 | |
| LINE1 | 12.63 | 15.43 | 12.02 | |
| LTR | 12.77 | 15.53 | 12.06 | |
| SINE | 12.45 | 15.30 | 11.94 | |
| GLOBAL | 12.33 | 15.02 | 11.09 | |
Table 4
Targeted analysis of candidate imprinted genes. (A) Predicted imprinted regions in the pig genome by lifted-over mouse igDMRs the pig genome and manually inspected. (B) Pair-wise comparison of methylation by Analysis Chi-Square in the three groups of blastocysts for the resulting 14 candidate igDMRs. *C-IVF vs In vivo: p<0.05 with 20 minimum observations and 10 minimum percentage of difference % methylation. ** C-IVF vsNatur-IVF: Analysis Chi- Square p<0.05 with 20 minimum observations and 10 minimum percentage of difference % methylation. Natur-IVF vs In vivo: no statistical differences.
| A) | |||
|---|---|---|---|
| Tile | Chromosome | Start | End |
| IGF2R/AIR | 1 | 9,244,239 | 9,248,054 |
| ZAC1 | 1 | 23,638,887 | 23,643,228 |
| SOCS5 | 3 | 99,885,360 | 99,887,132 |
| ZFP787 | 6 | 55,574,080 | 55,575,926 |
| ZIM2 | 6 | 56,641,190 | 56,644,823 |
| IMPACT | 6 | 102,001,929 | 102,002,533 |
| NAT1l5 | 8 | 139,773,830 | 139,775,461 |
| PEG10 | 9 | 81,642,957 | 81,644,146 |
| INPP5FV2 | 14 | 141,186,219 | 141,188,231 |
| NNAT | 17 | 46,041,843 | 46,045,629 |
| NESPAS | 17 | 66,313,673 | 66,320,932 |
| GNAS-exon1a | 17 | 66,348,009 | 66,352,062 |
| MEST | 18 | 19,340,335 | 19,345,549 |
| ZFP777 | 18 | 60,941,421 | 60,943,096 |
| B) | ||||
|---|---|---|---|---|
| Tile | Chromosome | C-IVF | Natur-IVF | In-vivo |
| ZAC1 | 1 | 42.41 | 33.55 | 23.87* |
| PEG10 | 9 | 47.75 | 36.91** | 30.90* |
| NNAT | 17 | 34.63 | 19.22** | 23.28* |
Additional files
-
Supplementary file 1
Top Canonical Pathways, Physiological Systems and Molecular and Cellular Functions related to DEGs between blastocysts produced in vitro under two different systems.
- https://doi.org/10.7554/eLife.23670.019
-
Supplementary file 2
Functions associated with the down-regulated genes in porcine blastocysts produced without reproductive fluids (C-IVF), compared to blastocyts produced using Natur-IVF system or collected in vivo.
- https://doi.org/10.7554/eLife.23670.020
-
Supplementary file 3
Percentages of specific features included in the 150 CpG size DMRs exclusive for each of three groups.
- https://doi.org/10.7554/eLife.23670.021
-
Supplementary file 4
Top Molecular and Cellular Functions and representative genes related to DMRs with higher or lower methylation in each group (C-IVF, Natur-IVF and In vivo).RNA-Seq and DNA methylation data available from the Dryad Digital Repository: http://dx.doi.org/10.5061/dryad.n77r3
- https://doi.org/10.7554/eLife.23670.022
Download links
A two-part list of links to download the article, or parts of the article, in various formats.
Downloads (link to download the article as PDF)
Open citations (links to open the citations from this article in various online reference manager services)
Cite this article (links to download the citations from this article in formats compatible with various reference manager tools)
DNA methylation and gene expression changes derived from assisted reproductive technologies can be decreased by reproductive fluids
eLife 6:e23670.
https://doi.org/10.7554/eLife.23670


