A theory of working memory without consciousness or sustained activity
- Ecole des Neurosciences de Paris Ile-de-France, 15 rue de l'Ecole de médecine, France
- Université Pierre et Marie Curie, 4 Place Jussieu, France
- Cognitive Neuroimaging Unit, CEA DSV/I2BM, INSERM, Université Paris-Sud, Université Paris-Saclay, NeuroSpin center, France
- University of Oxford, United Kingdom
- New York University, United States
- Frankfurt Institute for Advanced Studies, Germany
- Brain Science Center, Institute of Basic Medical Sciences, China
- Weizmann Institute of Science, Israel
- Columbia University, United States
- Collège de France, 11 Place Marcelin Berthelot, France
Figures
Figure 1
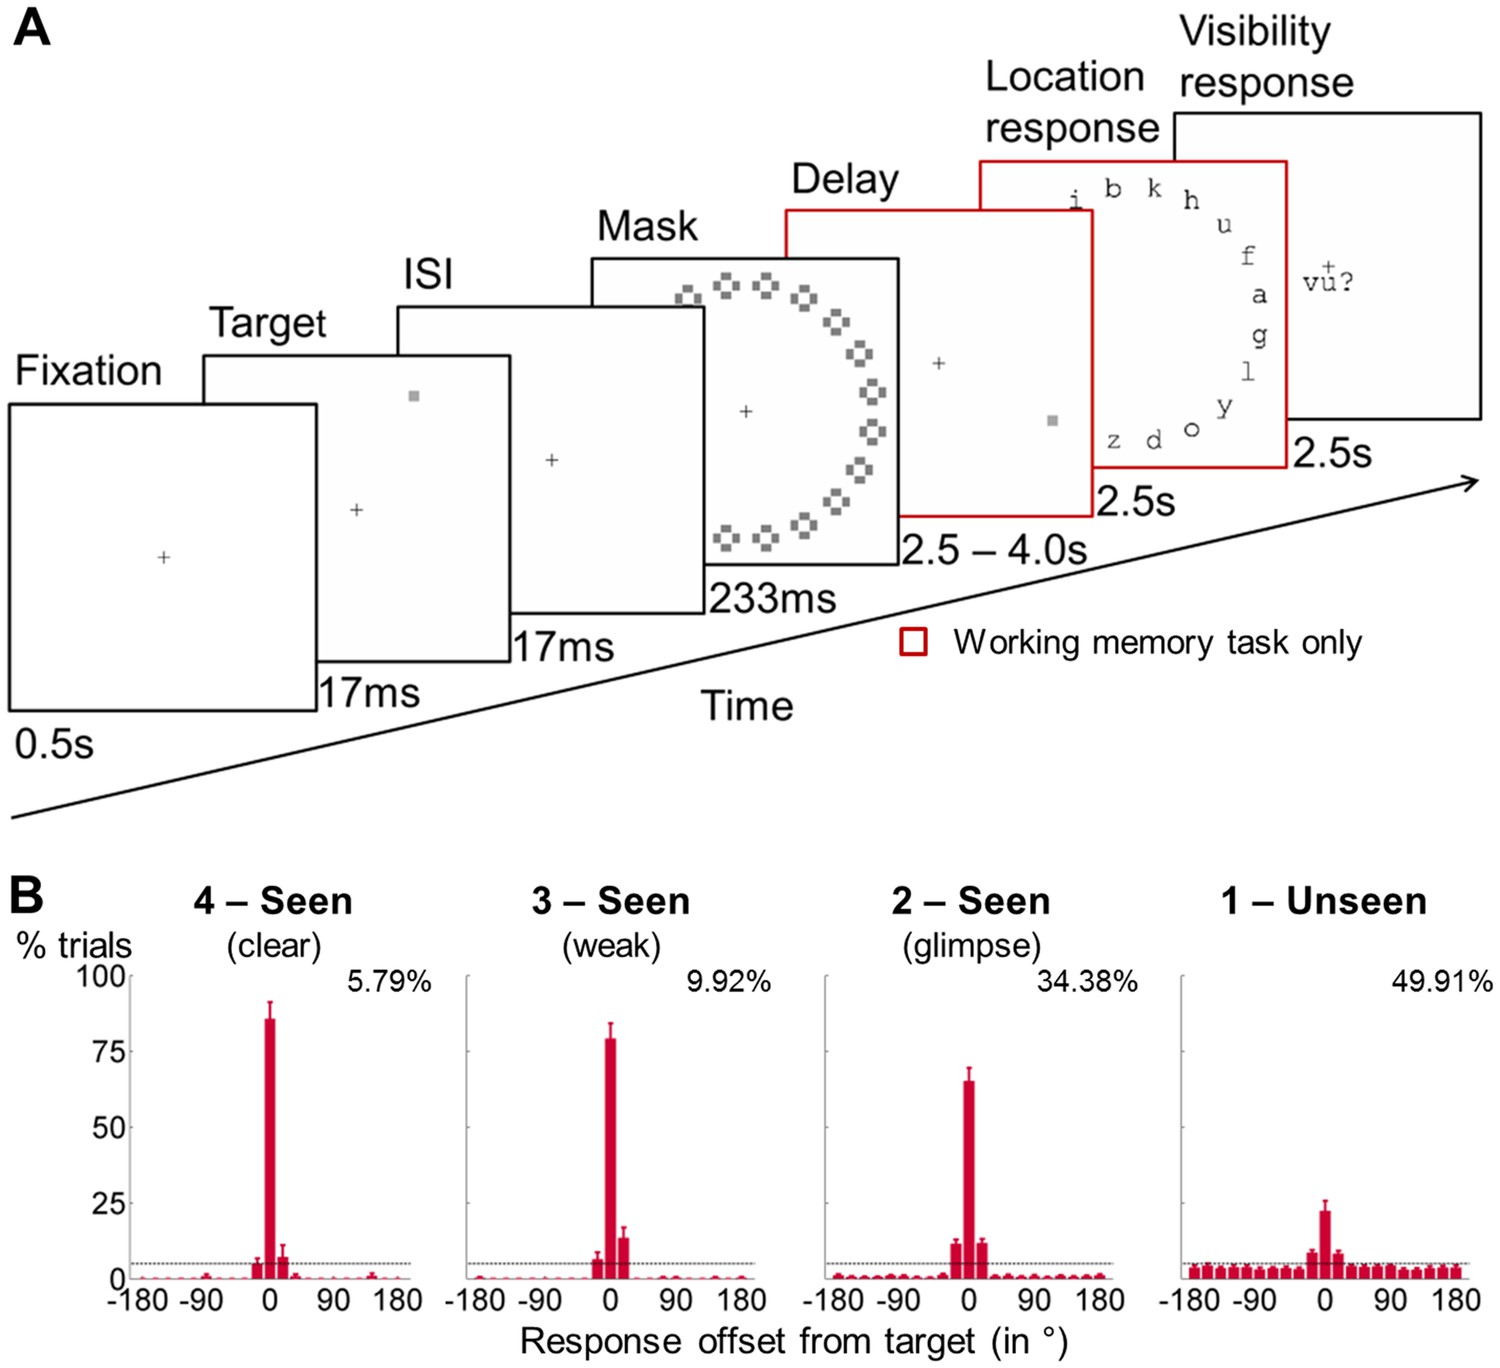
General experimental design and behavioral performance in the working memory task.
(A) Experimental design. A subsequently masked target square was flashed in 1 out of 20 positions. Subjects were asked to report this location after a delay of up to 4 s and to rate the visibility of the target on a 4-point scale. A visible distractor square with features otherwise identical to the target was shown on 50% of the trials during the retention period (at 1.75 s). In a perception-only control condition, the maintenance phase and location response were omitted, and subjects assessed the visibility of the target immediately after the mask. (B) Spatial distributions of forced-choice localization performance in the working memory task (experiment 1; 0 = correct target location; positive = clockwise offset). Error bars indicate standard error of the mean (SEM) across subjects. The horizontal, dotted line illustrates chance-level at 5%. Percentages show proportion of target-present trials from a given visibility category. Due to low number of trials in individual visibility ratings 2, 3, and 4, all seen categories were collapsed for analyses.
Figure 2 with 1 supplement
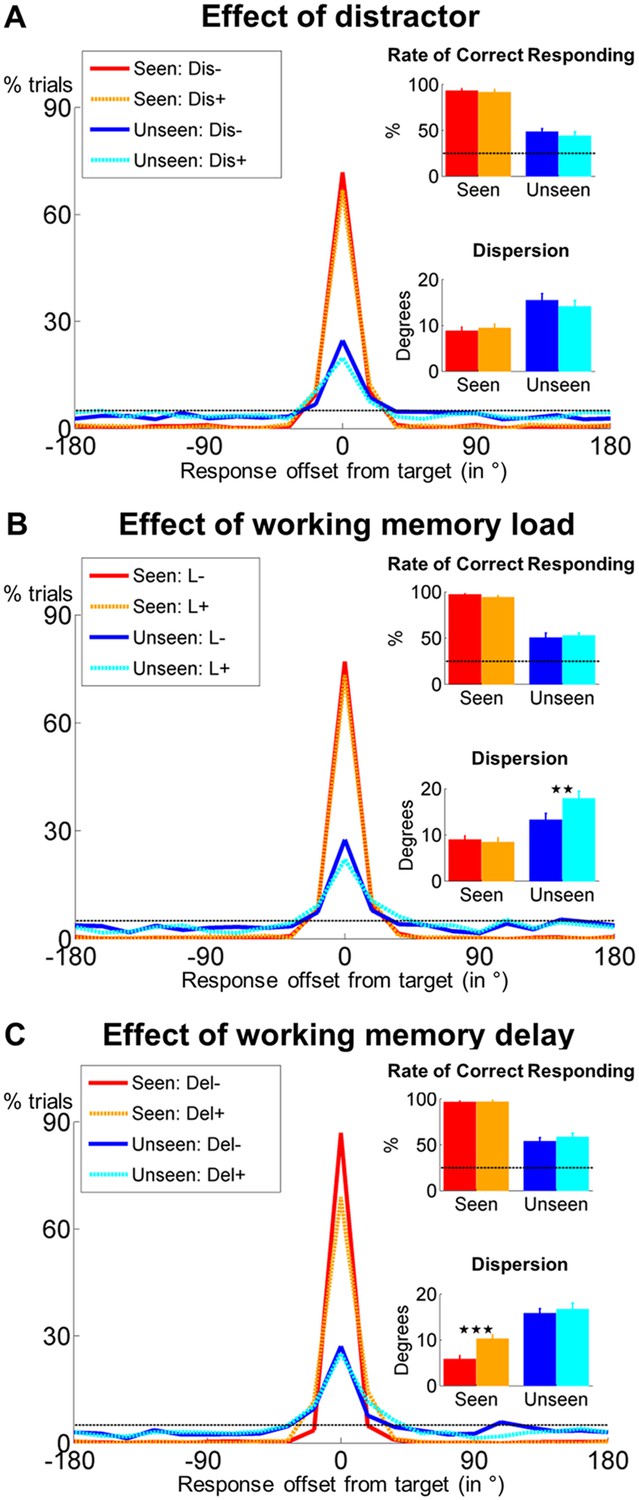
Behavioral evidence for non-conscious working memory.
Spatial distributions of responses (0 = correct target location; positive = clockwise offset) as a function of visibility and distractor presence (A), conscious working memory load (B) and delay duration (C). Insets show rate of correct responding (within ±2 positions of actual location) and precision of working memory representation separately for seen and unseen trials. Error bars represent standard error of the mean (SEM) across subjects and horizontal, dotted line indicates chance-level (5%). *p<0.05, **p<0.01, and ***p<0.001 in a paired sample t-test. Del = delay, Dis = distractor, L = load.
Figure 2—figure supplement 1
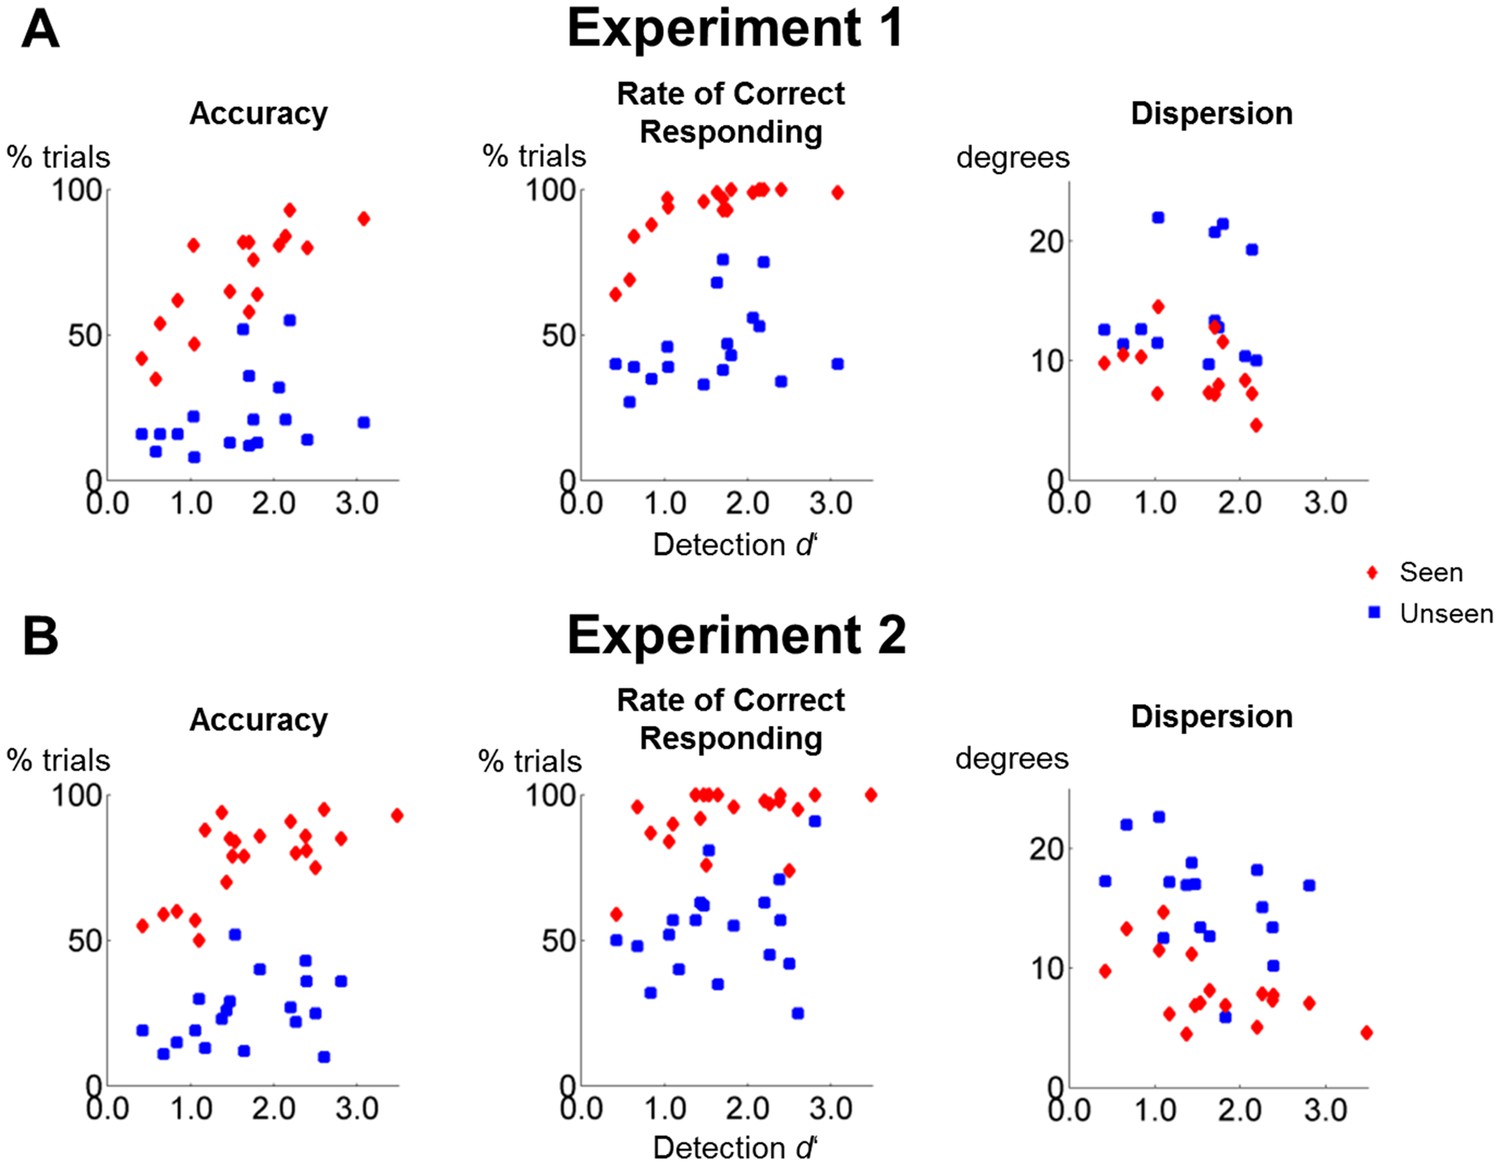
Perceptual sensitivity does not correlate with working memory performance on unseen trials.
(A) Scatter plots depicting the relationship between detection d’ and accuracy (left), the rate of correct responding (middle), and precision (right) in the working memory task of experiment 1 as a function of visibility. (B) Same as in (A), but for experiment 2.
Figure 3
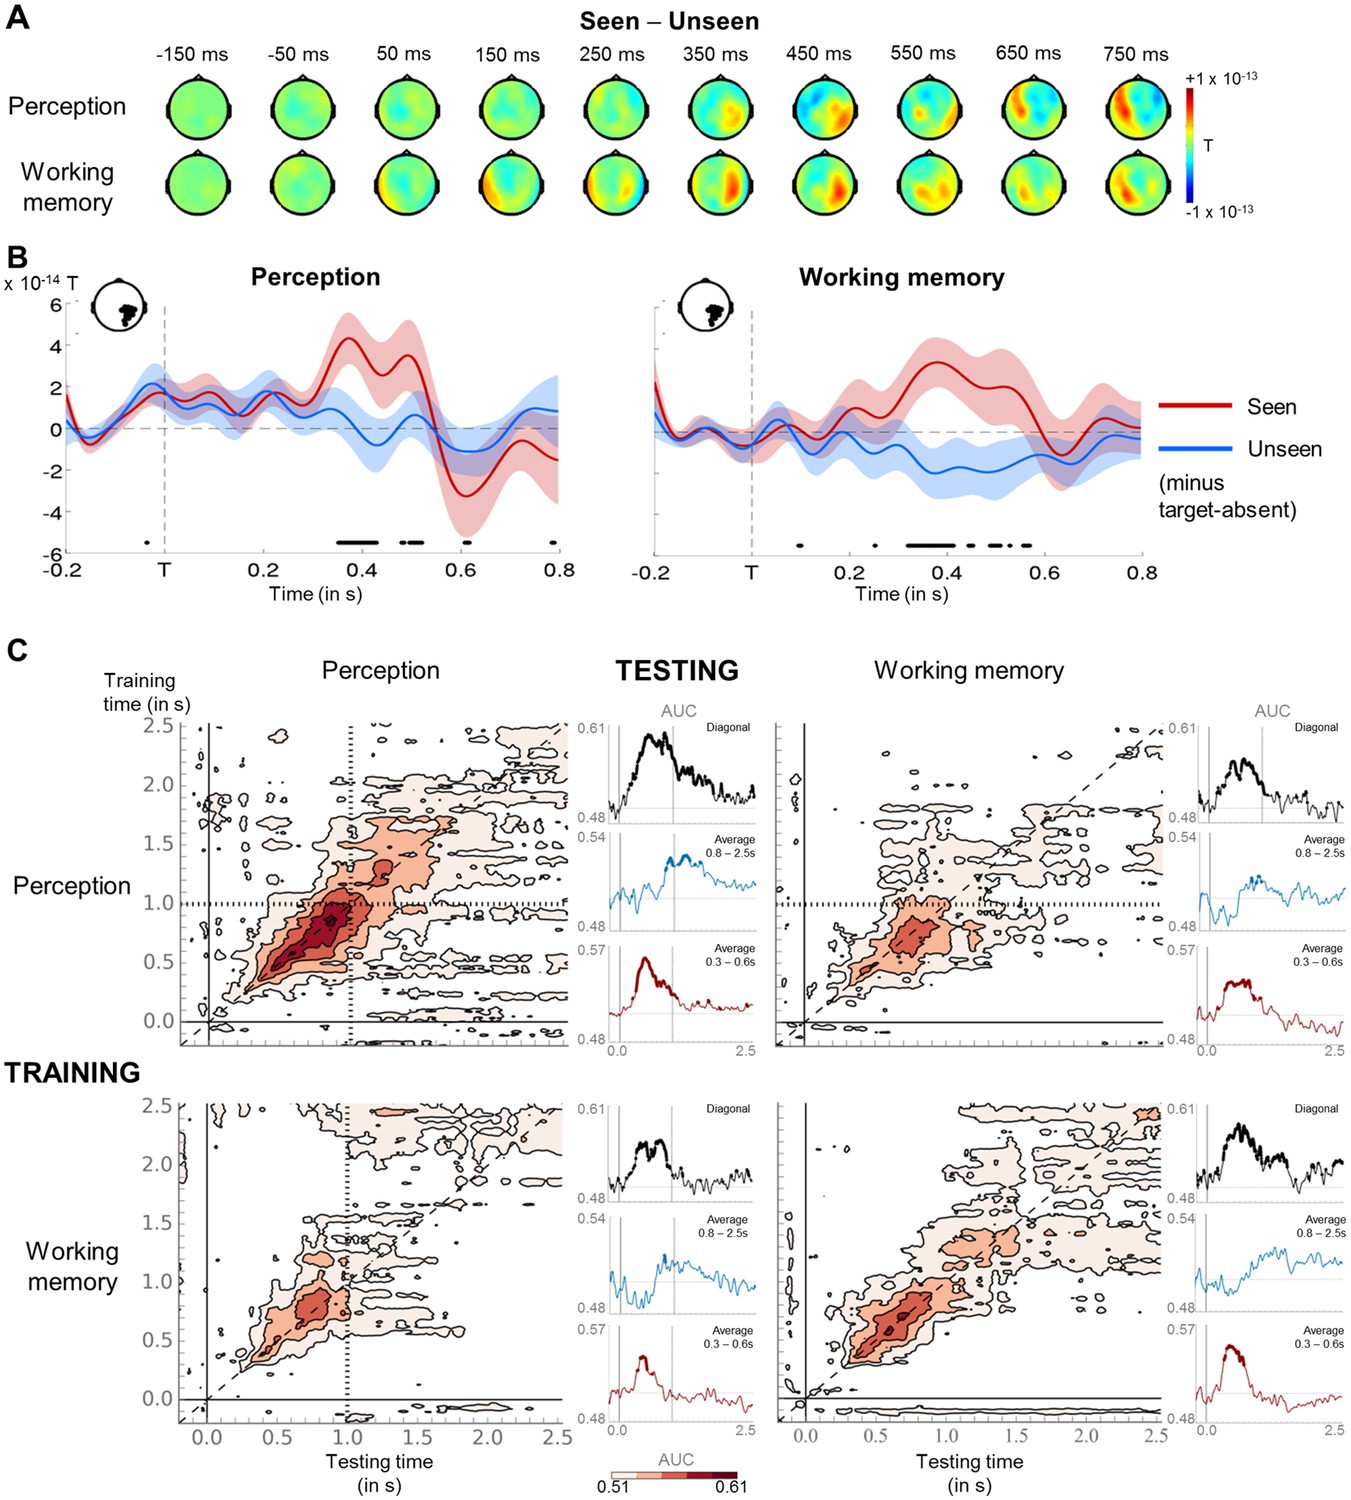
Neural signatures for conscious perception and maintenance in working memory.
(A) Sequence of brain activations (−200–800 ms) evoked by consciously perceiving the target in the perception (top) and working memory (bottom) task. Each topography depicts the difference in amplitude between seen and unseen trials over a 100 ms time window centered on the time points shown (magnetometers only). (B) Average time courses of seen and unseen trials (−200–800 ms) after subtraction of target-absent trials in a group of parietal magnetometers in the perception (left) and working memory (right) task. Shaded area illustrates standard error of the mean (SEM) across subjects. Significant differences between conditions are depicted with a horizontal, black line (Wilcoxon signed-rank test across subjects, uncorrected). For display purposes, data were lowpass-filtered at 8 Hz. T = target onset. (C) Temporal generalization matrices for decoding of visibility category as a function of training and testing task. In each panel, a classifier was trained at every time sample (y-axis) and tested on all other time points (x-axis). The diagonal gray line demarks classifiers trained and tested on the same time sample. Please note the event markers in any panel involving the perception task: Mean reaction time (target-present trials) for the visibility response is indicated as vertical and/or horizontal, dotted lines. Any classifier beyond this point only reflects post-visibility processes. Time courses of diagonal decoding and of classifiers averaged over the P3b time window (300–600 ms) and over the working memory maintenance period (0.8–2.5 s) are shown as black, red, and blue insets. Thick lines indicate significant, above-chance decoding of visibility (Wilcoxon signed-rank test across subjects, uncorrected, two-tailed except for diagonal). For display purposes, data were smoothed using a moving average with a window of eight samples. AUC = area under the curve.
Figure 4 with 3 supplements
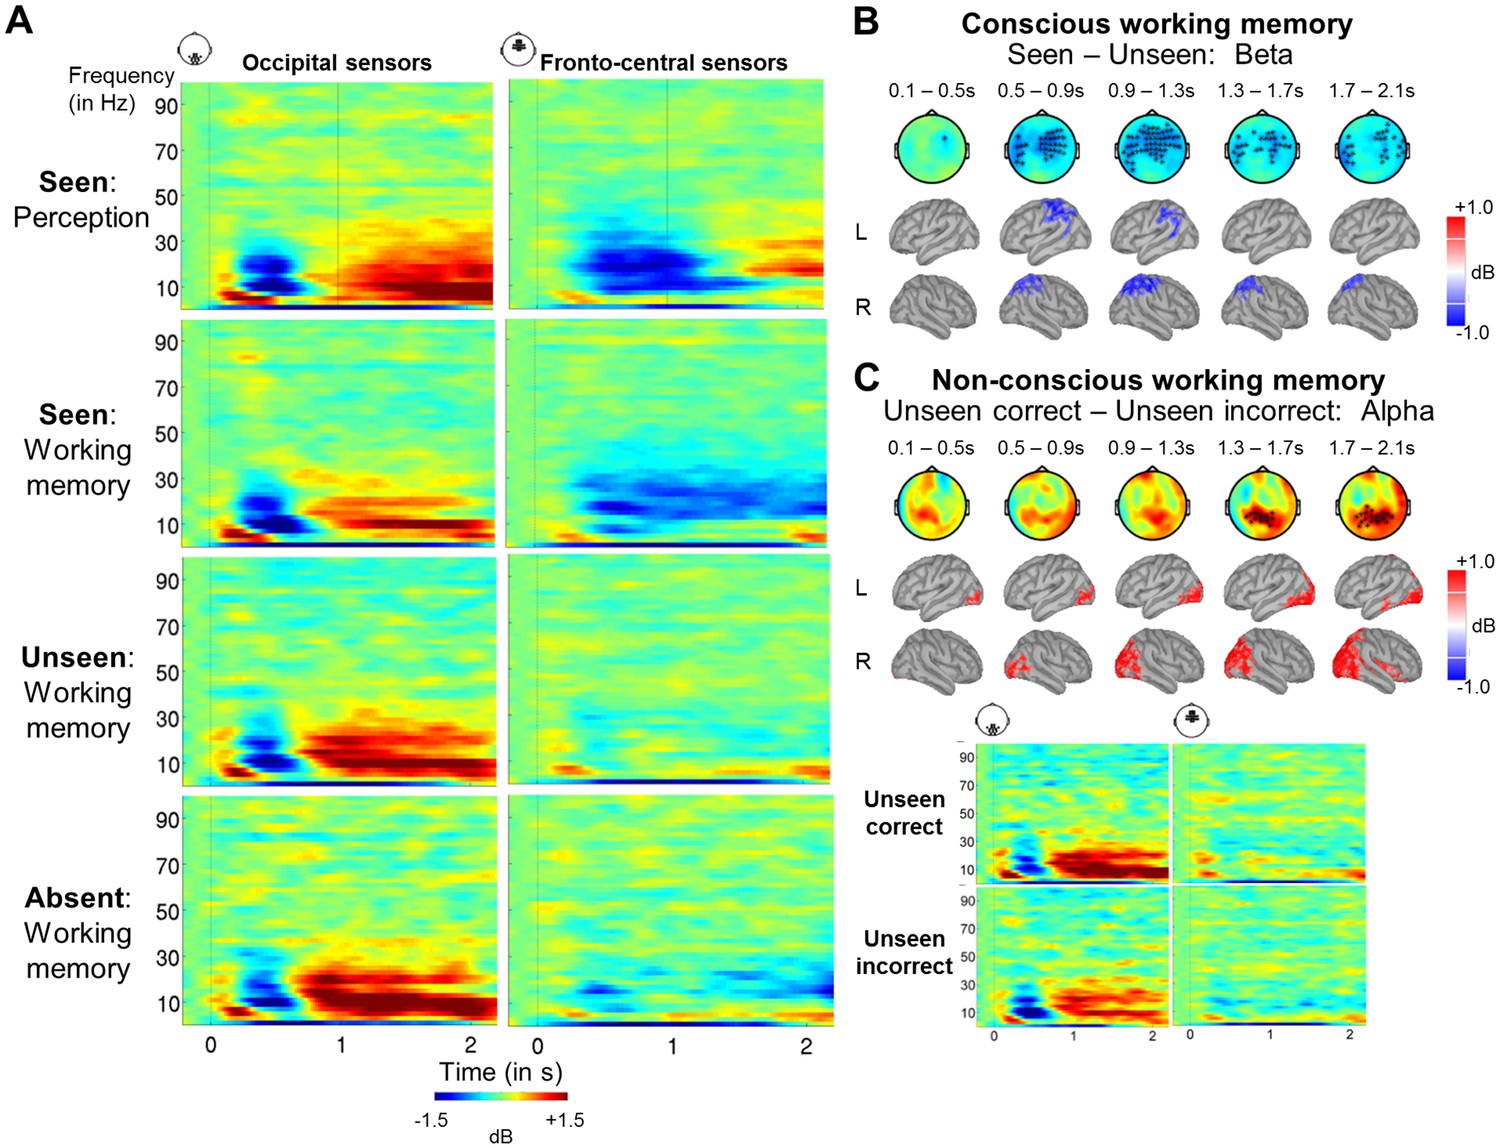
A sustained decrease in alpha/beta power as a marker of conscious working memory.
(A) Average time-frequency power relative to baseline (dB) as a function of task and visibility category in a group of occipital (left) and fronto-central (right) magnetometers. Mean reaction time (target-present trials) for the visibility response in the perception task is indicated as a vertical, dotted line. (B) Beta band activity (13–30 Hz; 0–2.1 s) related to conscious working memory (seen – unseen trials) as shown in magnetometers (top) and source space (bottom; in dB relative to baseline). Black asterisks indicate sensors showing a significant difference as assessed by a Monte-Carlo permutation test. (C) Same as in (A) and (B) but for unseen correct and unseen incorrect trials in the alpha band (8–12 Hz).
Figure 4—figure supplement 1
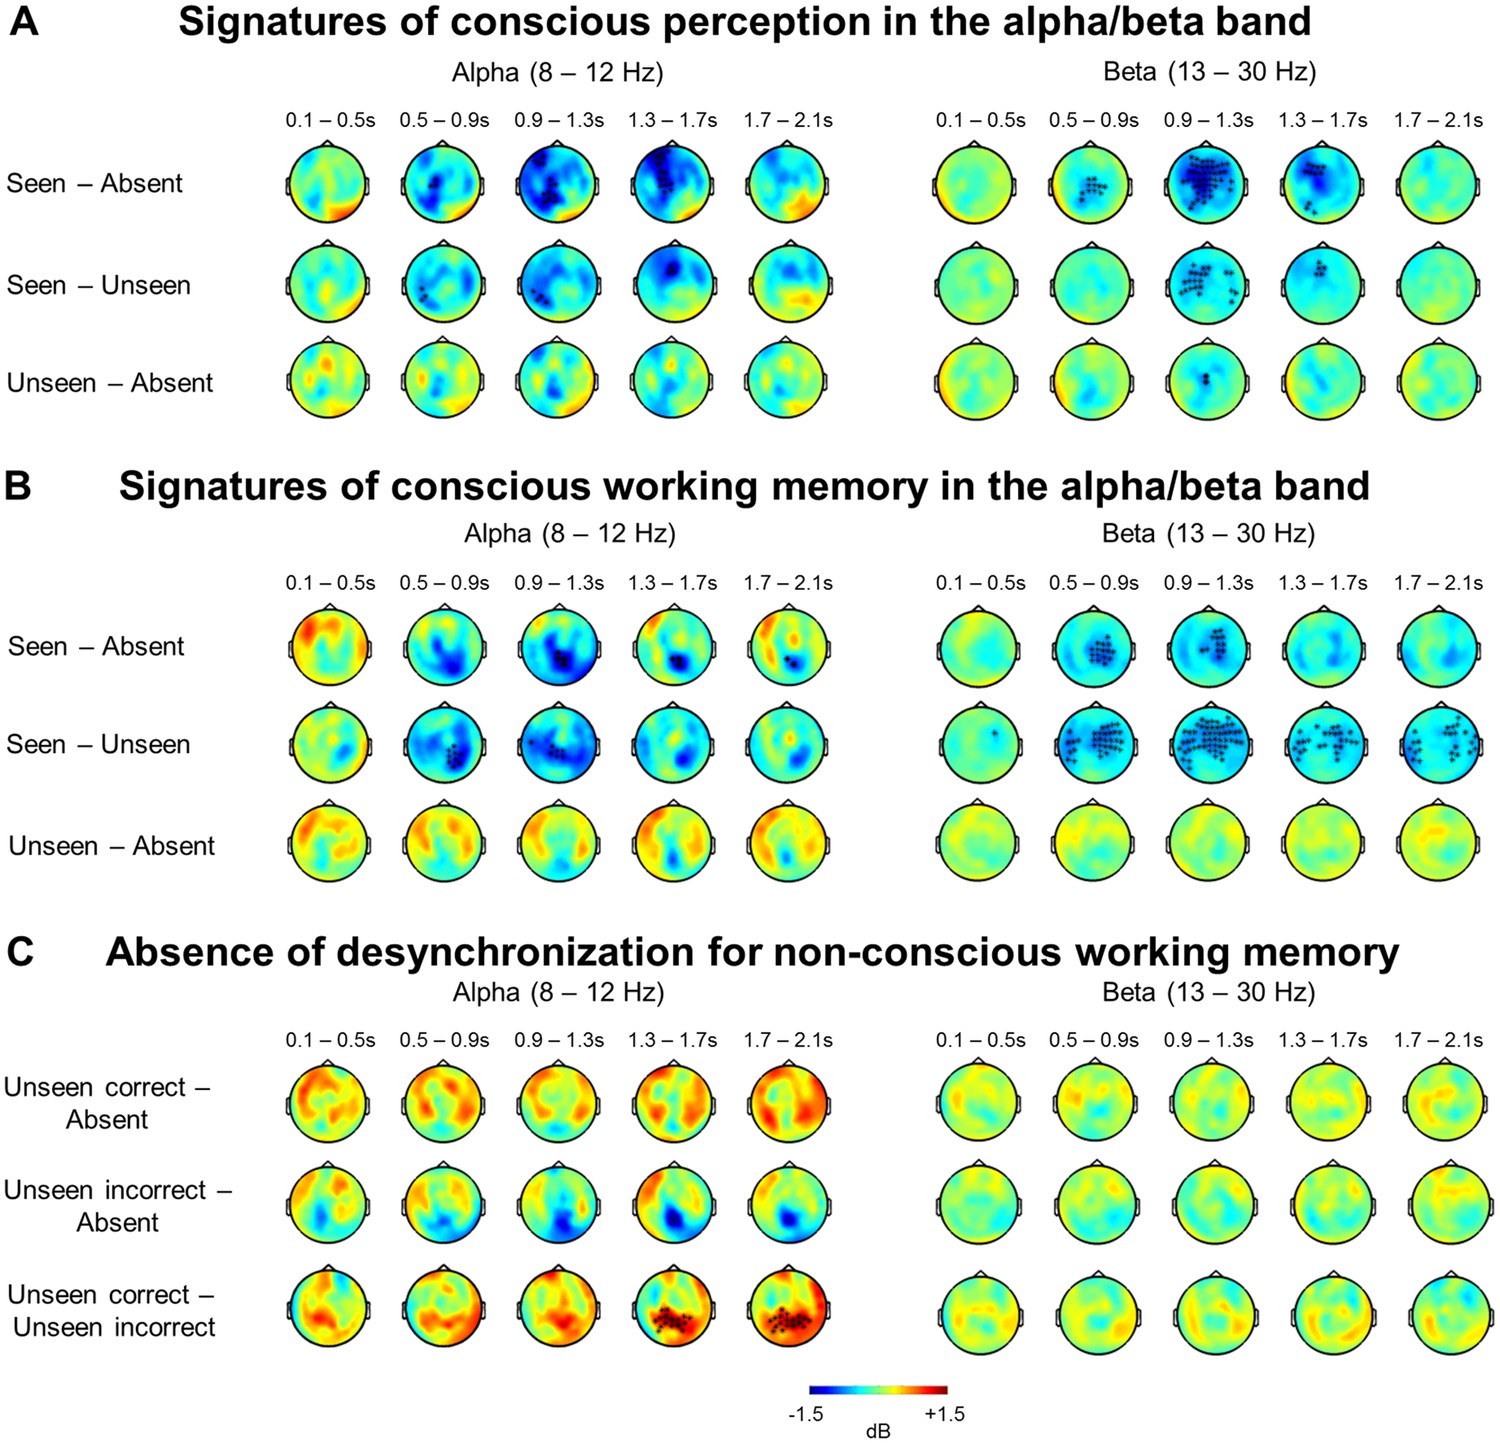
Alpha- and beta-band desynchronizations serve as a general signature of conscious processing and conscious working memory.
(A) Perception task: Topographies represent the power difference (magnetometers) for seen vs target-absent trials (top), seen vs unseen trials (middle), and unseen vs target-absent trials (bottom) in the alpha (8–12 Hz) and beta (13–30 Hz) frequency bands as a function of time (0–2.1 s). Black asterisks indicate sensors showing a significant difference as assessed by a cluster-based permutation test. (B) Working memory task: Topographies and panels are as in (A). (C) Working memory task: Topographies represent the power difference (magnetometers) for unseen correct vs target-absent trials (top), unseen incorrect vs target-absent trials (middle), and unseen correct vs unseen incorrect trials (bottom) in the alpha (8–12 Hz) and beta (13–30 Hz) frequency bands as a function of time (0–2.1 s). Black asterisks indicate sensors showing a significant difference as assessed by a cluster-based permutation test.
Figure 4—figure supplement 2

Seen and unseen correct trials do not share the same discriminative decoding axis.
(A) Temporal generalization matrices for a decoder trained on ERFs to distinguish seen from unseen trials in the perception task and tested in the working memory task, either with the same labels (visibility decoder; left) or the unseen correct and incorrect trials (accuracy decoder; right). In each panel, a classifier was trained at every time sample (y-axis) and tested on all other time points (x-axis). The diagonal gray line demarks classifiers trained and tested on the same time sample. Please note the additional event marker: Mean reaction time (target-present trials) for the visibility response is indicated as a horizontal, dotted line. Any classifier beyond this point only reflects post-visibility processes. Time courses of diagonal decoding are shown as black insets. Thick lines indicate significant, above-chance decoding (Wilcoxon signed-rank test across subjects, uncorrected, one-tailed). For display purposes, data were smoothed using a moving average with a window of eight samples. (B) Same as in (A), except that the decoder was trained and tested on average power (relative to baseline) in the alpha band (8–12 Hz). For display purposes, data were smoothed using a moving average with a window of one sample. (C) Same as in (B), except that the decoder was trained and tested on average power (relative to baseline) in the beta band (13–30 Hz). AUC = area under the curve.
Figure 4—figure supplement 3
Bayesian statistics for the time-frequency analyses.
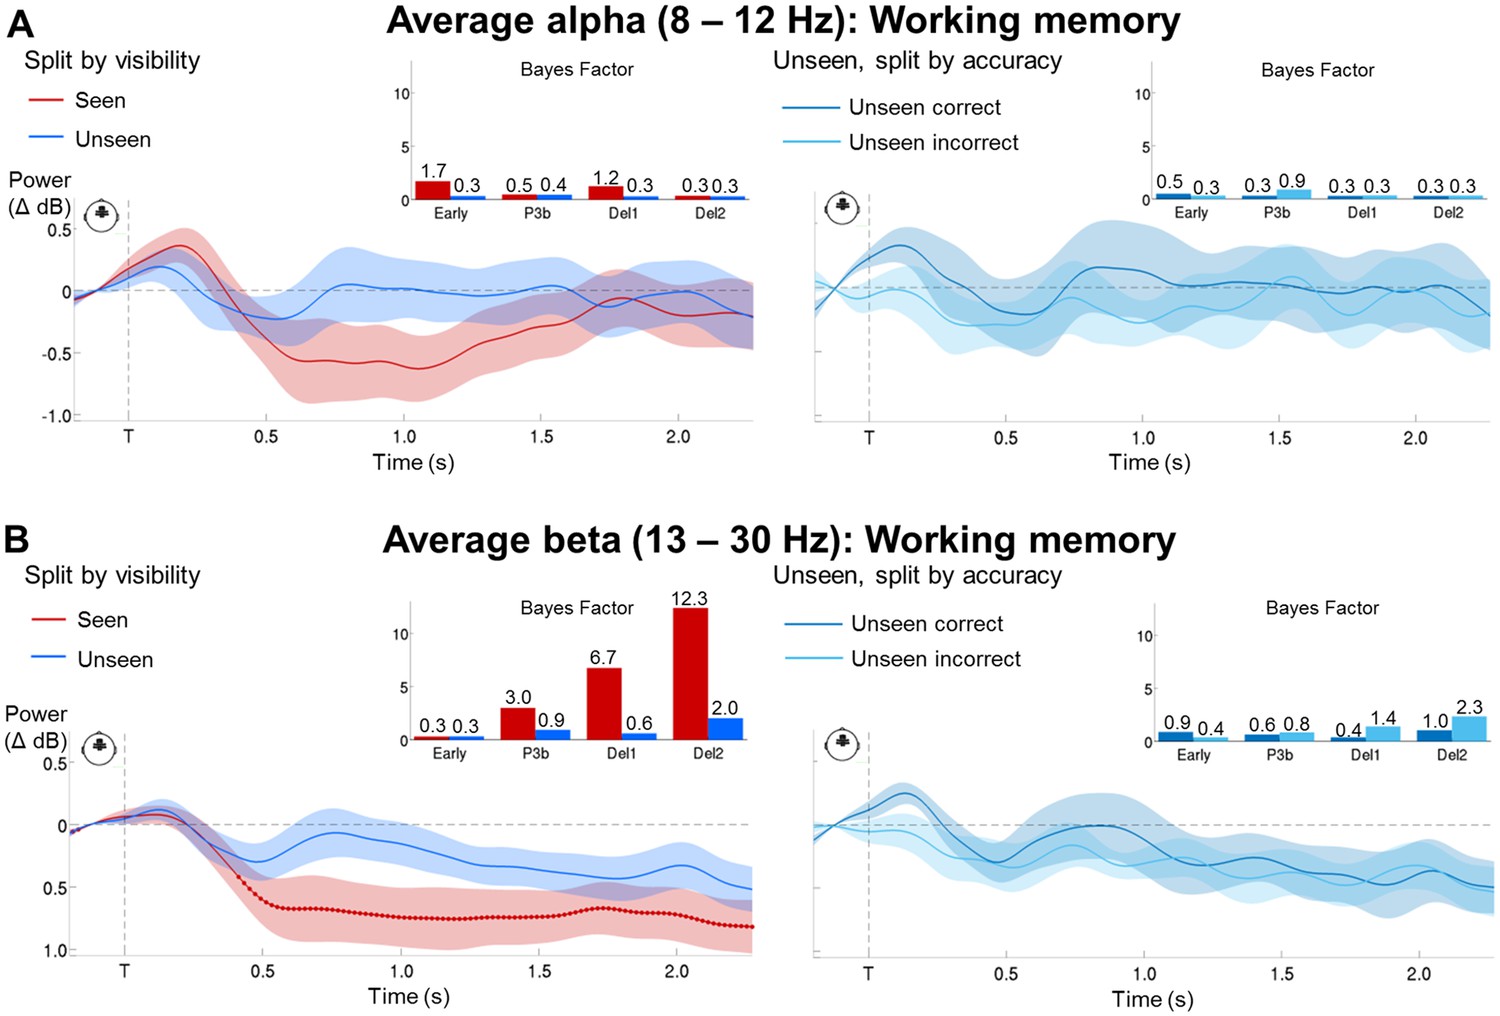
(A) Time courses of average alpha band activity (8–12 Hz; −0.2–2.1 s) in a group of frontal sensors as a function of visibility (left) and accuracy on the unseen trials (right; correct = within ±2 positions of the actual target location). Shaded area demarks standard error of the mean (SEM) across subjects. Thick line represents significant difference in power relative to baseline (Wilcoxon signed-rank test across subjects). Insets show Bayes Factors (as assessed in a two-tailed t-test) in four time windows: 100–300 ms (early), 300–600 ms (P3b), 0.6–1.55 s (Del1), and 1.55–2.1 s (Del2). Del1 = first part of the delay, Del2 = second part of the delay, T = target onset. (B) Same as in (A), but for average beta band (13–30 Hz) activity.
Figure 5 with 3 supplements
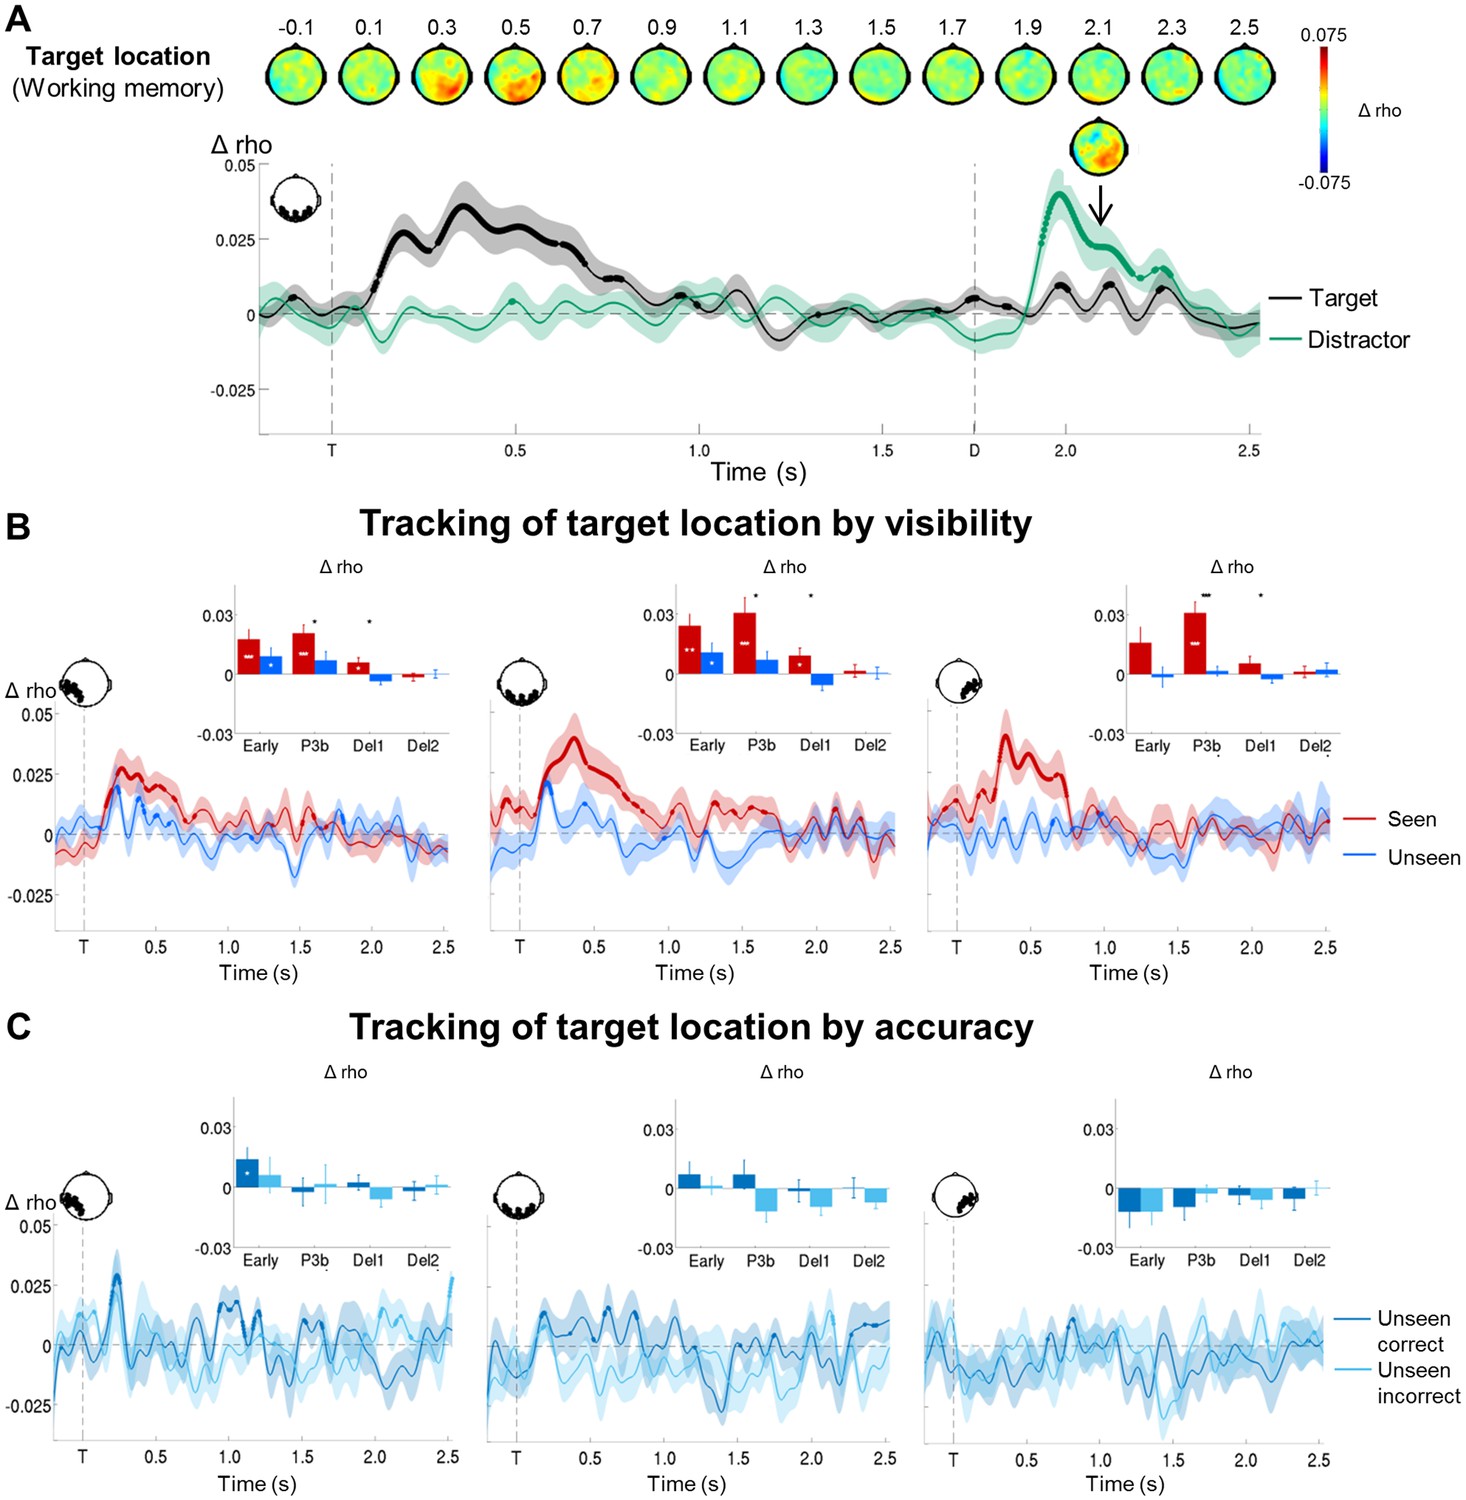
Tracking the contents of conscious and non-conscious working memory.
(A) Topographies (top) and time courses (bottom; −0.2–2.5 s) of average circular-linear correlations between the amplitude of the MEG signal (gradiometers) and target/distractor location. Shaded area demarks standard error of the mean (SEM) across subjects. Thick line represents significant increase in correlation coefficient as compared to an empirical baseline (one-tailed Wilcoxon signed-rank test across subjects, uncorrected). (B) Average time courses (−0.2–2.5 s) of circular-linear correlation coefficients between amplitude of the ERFs and target location as a function of visibility in the working memory task in a group of left temporo-occipital (left), occipital (middle), and right temporo-occipital (right) gradiometers. Shaded area demarks standard error of the mean (SEM) across subjects. Thick line represents significant increase in correlation coefficient as compared to an empirical baseline (one-tailed Wilcoxon signed-rank test across subjects, uncorrected). Insets show average correlation coefficients (relative to an empirical baseline) in four time windows: 100–300 ms (early), 300–600 ms (P3b), 0.6–1.55 s (Del1), and 1.55–2.5 s (Del2). White asterisks denote significant differences to baseline (one-tailed Wilcoxon signed-rank test across subjects), black asterisks significant differences between conditions (two-tailed Wilcoxon signed-rank test across subjects). For display purposes, data were lowpass-filtered at 8 Hz. *p<0.05, **p<0.01, and ***p<0.001. Del1= first part of delay, Del2 = second part of delay, T = target onset. (C) Same as in (B), but as a function of accuracy on the unseen trials (correct = within ±2 positions of the target).
Figure 5—figure supplement 1
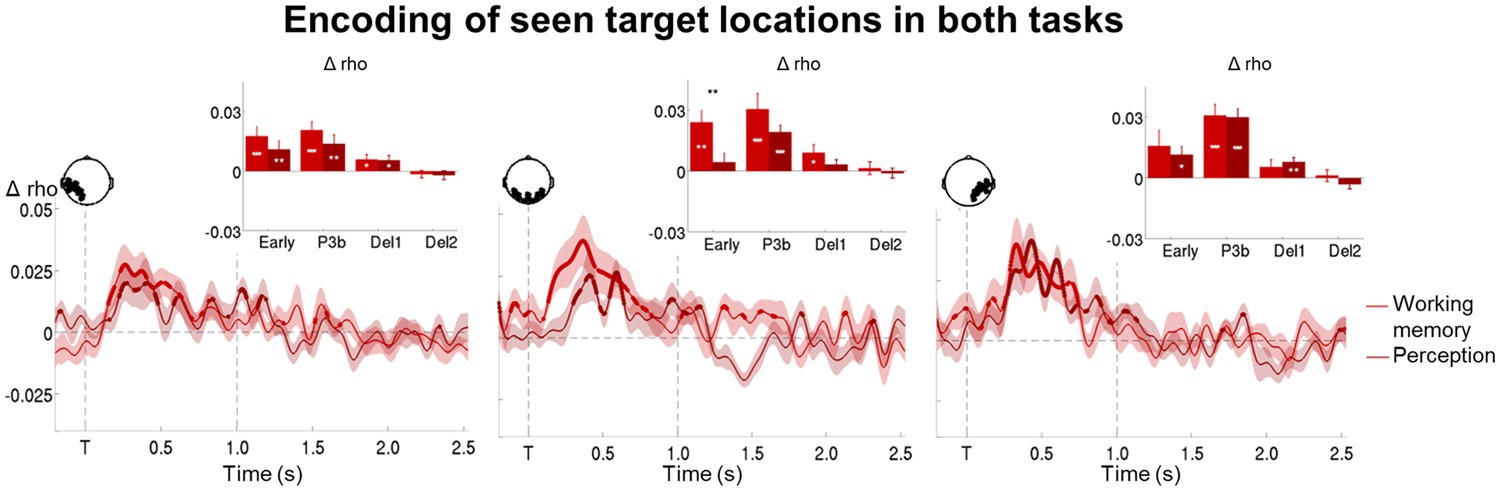
Representation of seen target locations during conscious perception and working memory.
Average time courses of circular-linear correlation coefficients between amplitude of the ERFs and target location on seen trials as a function of task (perception and working memory) in a group of left temporo-occipital (left), occipital (middle), and right temporo-occipital (right) gradiometers. Shaded area demarks standard error of the mean (SEM) across subjects. Mean reaction time (target-present trials) for the visibility response in the perception task is indicated as a vertical, dotted line. Thick line represents significant increase in correlation coefficient as compared to an empirical baseline (one-tailed Wilcoxon signed-rank test across subjects, uncorrected). Insets show average correlation coefficients (relative to baseline) in four time windows: 100–300 ms (early), 300–600 ms (P3b), 0.6–1.55 s (Del1), and 1.55–2.5 s (Del2). White asterisks denote significant differences to baseline (one-tailed Wilcoxon signed-rank test across subjects), black asterisks significant differences between conditions (two-tailed Wilcoxon signed-rank test across subjects). For display purposes, data were lowpass-filtered at 8 Hz. *p<0.05, **p<0.01, and ***p<0.001. Del1 = first part of the delay period, Del2 = second part of the delay period, T = target onset.
Figure 5—figure supplement 2
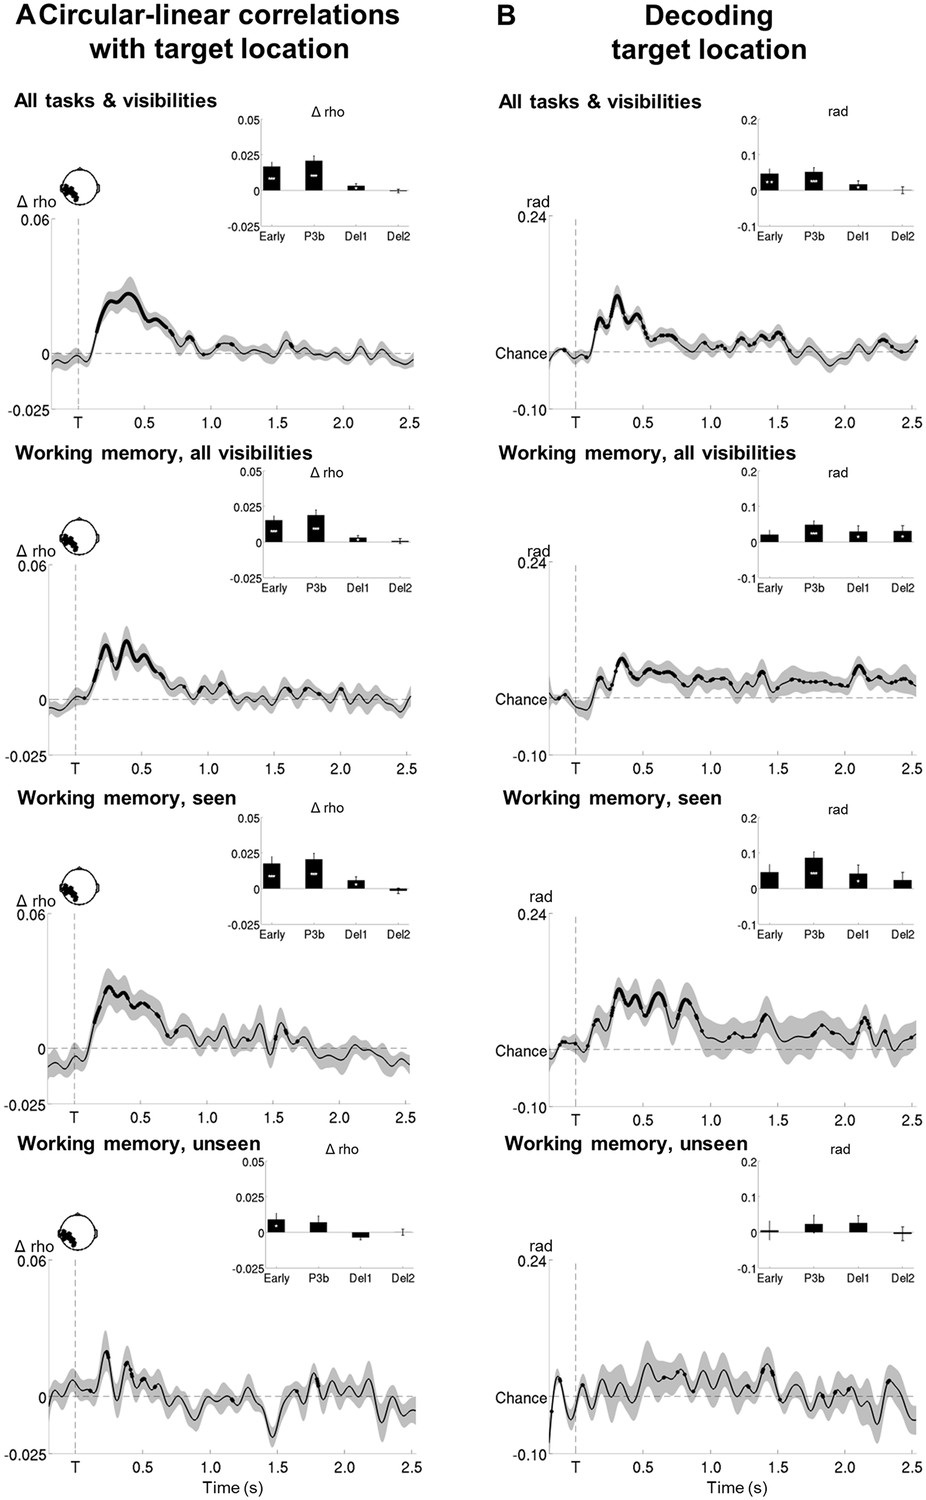
Circular-linear correlations and multivariate decoding reveal similar time courses for target location.
(A) Average time courses of circular-linear correlation coefficients between amplitude of the ERFs and target location as a function of task (perception and working memory) and visibility (seen and unseen) in a group of left temporo-occipital gradiometers. Shaded area demarks standard error of the mean (SEM) across subjects. Thick line represents significant increase in correlation coefficient as compared to an empirical baseline (one-tailed Wilcoxon signed-rank test across subjects, uncorrected). Insets show average correlation coefficients (relative to baseline) in four time windows: 100–300 ms (early), 300–600 ms (P3b), 0.6–1.55 s (Del1), and 1.55–2.5 s (Del2). White asterisks denote significant differences to baseline (one-tailed Wilcoxon signed-rank test across subjects). For display purposes, data were lowpass-filtered at 8 Hz. *p<0.05, **p<0.01, and ***p<0.001. Del1 = first part of the delay period, Del2 = second part of the delay period, T = target onset. (B) Average time courses of a linear support vector regression trained to predict target angle as a function of task (perception and working memory) and visibility (seen and unseen). Thick line represents significant increase in decoding accuracy (in radians) as compared to a baseline (one-tailed Wilcoxon signed-rank test across subjects, uncorrected). Insets show average correlation coefficients (relative to baseline) in four time windows: 100–300 ms (early), 300–600 ms (P3b), 0.6–1.55 s (Del1), and 1.55–2.5 s (Del2). White asterisks denote significant differences to baseline (one-tailed Wilcoxon signed-rank test across subjects). For display purposes, data were lowpass-filtered at 8 Hz. *p<0.05, **p<0.01, and ***p<0.001. Del1 = first part of the delay period, Del2 = second part of the delay period, T = target onset.
Figure 5—figure supplement 3

Tracking target/response location on unseen correct and incorrect trials with multivariate decoding.
(A) Average time courses of a linear support vector regression trained on seen correct trials to predict target angle on the unseen correct (top) and unseen incorrect (bottom) trials. Thick line represents significant increase in decoding accuracy (in radians) as compared to a baseline (one-tailed Wilcoxon signed-rank test across subjects, uncorrected). Insets show average correlation coefficients (relative to baseline) in four time windows: 100–300 ms (early), 300–600 ms (P3b), 0.6–1.55 s (Del1), and 1.55–2.5 s (Del2). White asterisks denote significant differences to baseline (one-tailed Wilcoxon signed-rank test across subjects). For display purposes, data were lowpass-filtered at 8 Hz. *p<0.05, **p<0.01, and ***p<0.001. Del1 = first part of the delay period, Del2 = second part of the delay period, T = target onset. (B) Same as in (A), but for response location.
Figure 6 with 2 supplements
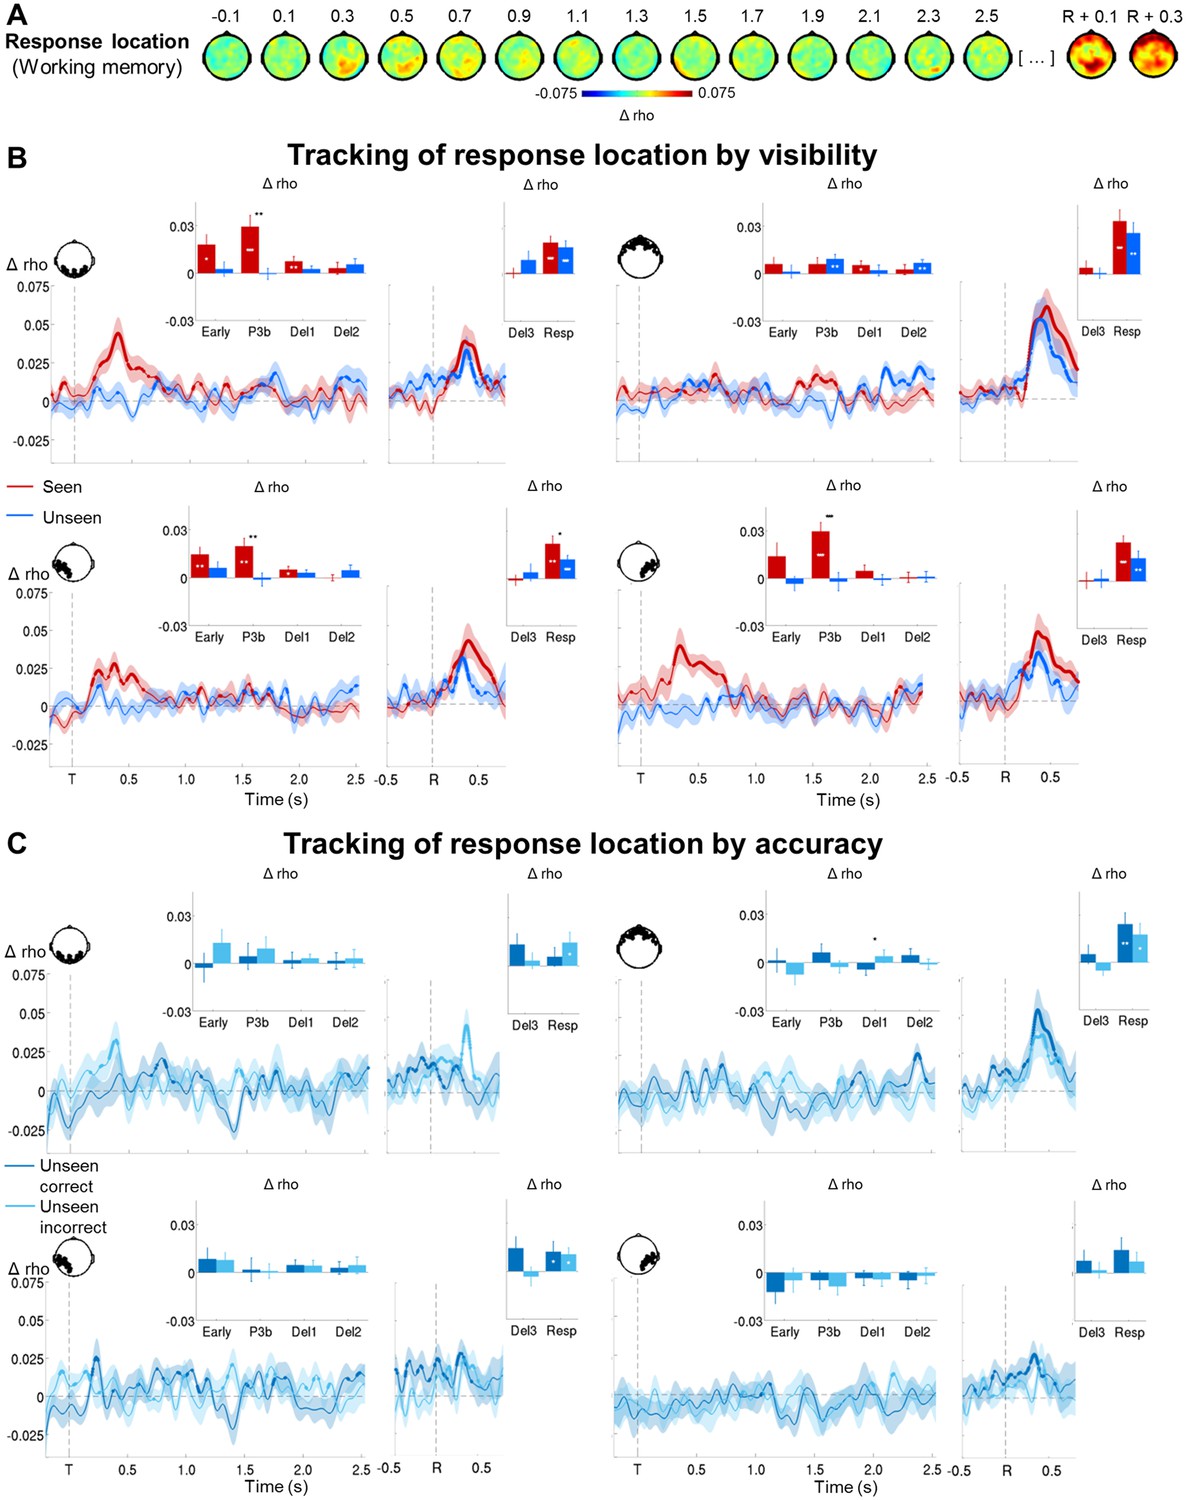
Tracking response location in conscious and non-conscious working memory.
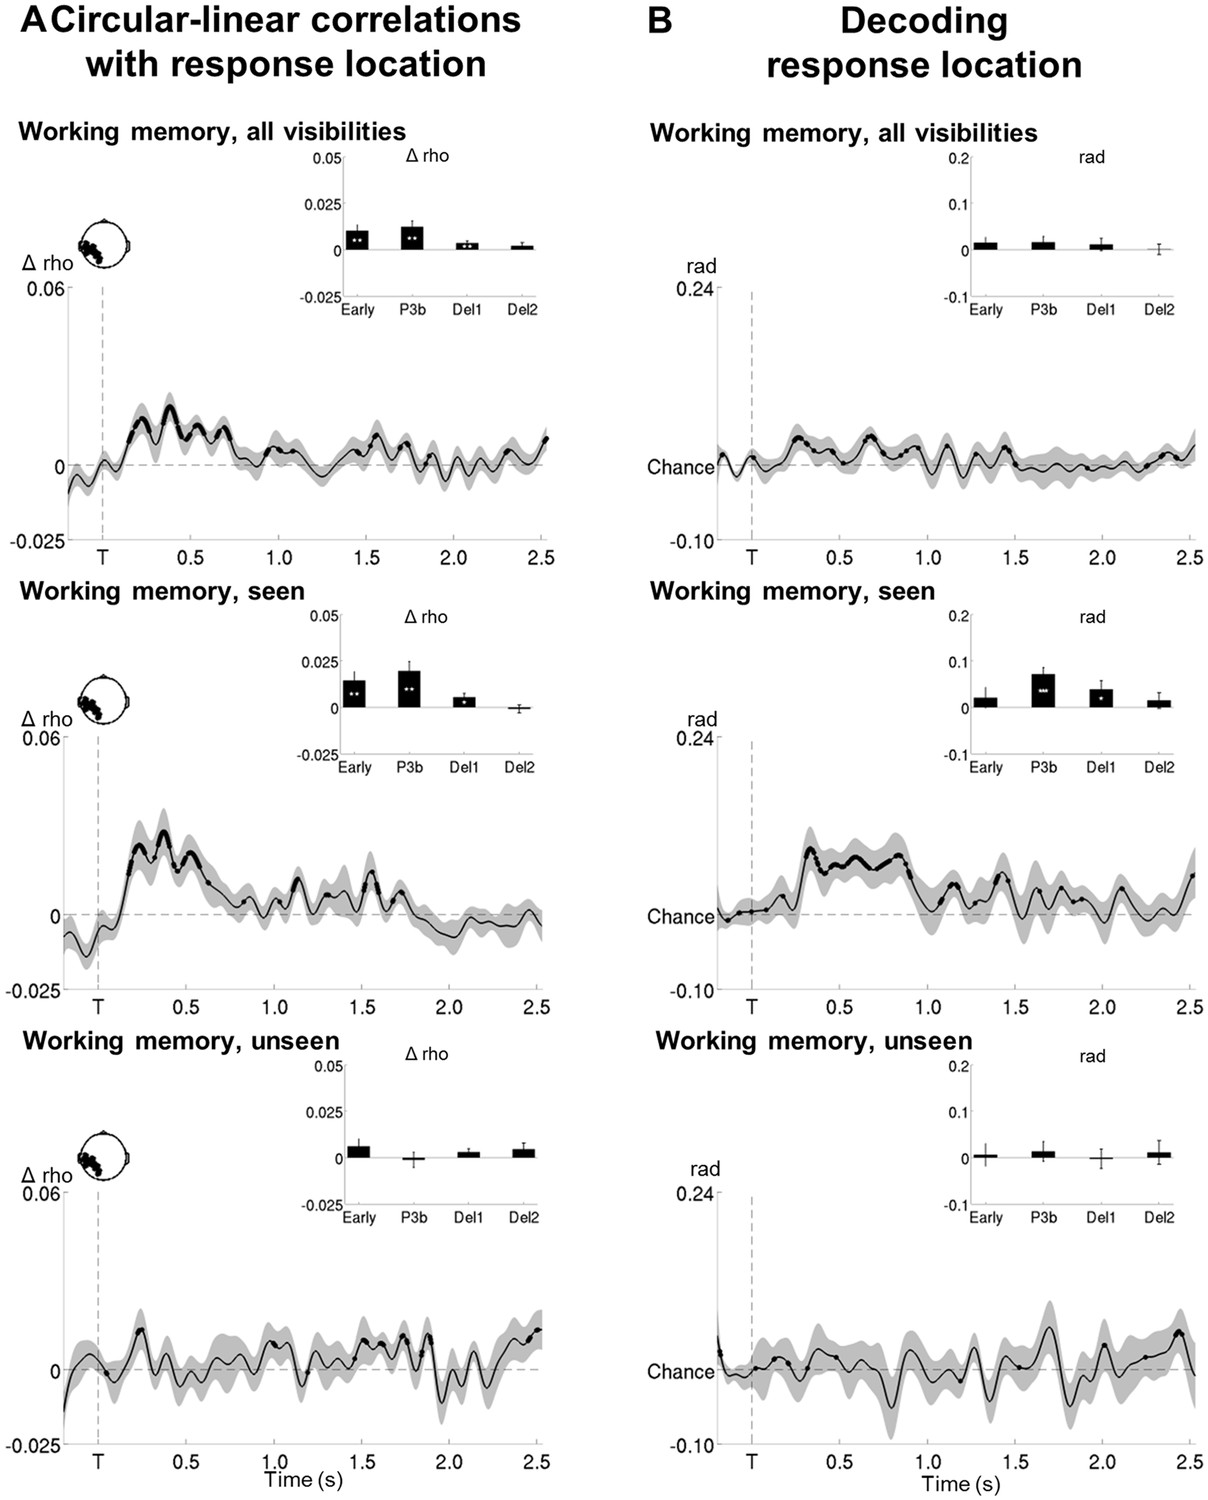
(A) Topographies of average circular-linear correlations between the amplitude of the MEG signal (gradiometers) and response location. R = onset of the response screen. (B) Average time courses (left: stimulus-locked, −0.2–2.5 s; right: response-locked, −0.5–0.8 s) of circular-linear correlation coefficients between the amplitude of the ERFs and response location as a function of visibility in the working memory task in a group of occipital (top, left), frontal (top, right) left temporo-occipital (bottom, left) and right temporo-occipital (bottom, right) gradiometers. Shaded area demarks standard error of the mean (SEM) across subjects. Thick line represents significant increase in correlation coefficient as compared to an empirical baseline (one-tailed Wilcoxon signed-rank test across subjects, uncorrected). Insets show average correlation coefficients (relative to an empirical baseline) in four stimulus-locked time windows, 100–300 ms (early), 300–600 ms (P3b), 0.6–1.55 s (Del1), and 1.55–2.5 s (Del2), and two response-locked time windows, −0.5–0.0 s (Del3) and 0.0–0.8 s (Resp). White asterisks denote significant differences to baseline (one-tailed Wilcoxon signed-rank test across subjects), black asterisks significant differences between conditions (two-tailed Wilcoxon signed-rank test across subjects). For display purposes, data were lowpass-filtered at 8 Hz. *p<0.05, **p<0.01, and ***p<0.001. Del1= first part of delay, Del2 = second part of delay, Del3 = last 500 ms before response screen, R = response screen onset, T = target onset. (C) Same as in (B), but as a function of accuracy on the unseen trials (correct = within ±2 positions of the target).
Figure 6—figure supplement 1
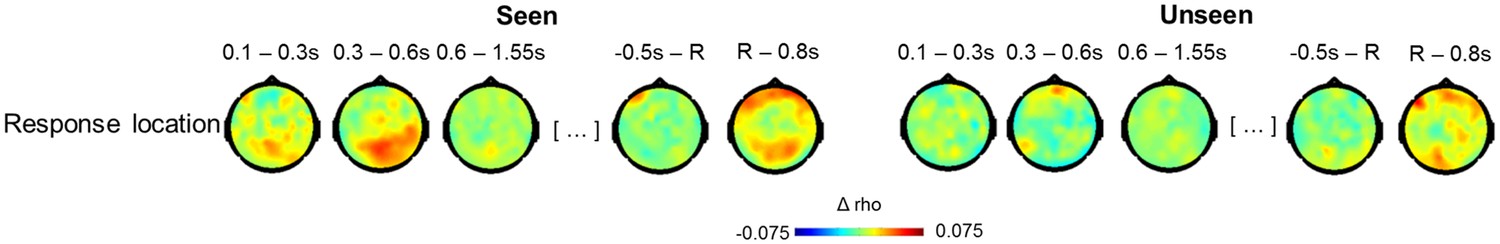
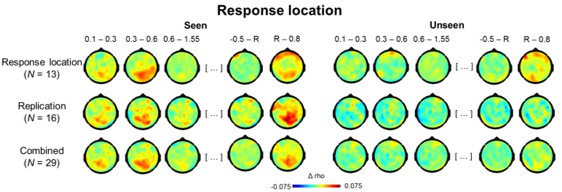
Topographies for circular-linear correlations with response location as a function of visibility.
Topographies of circular-linear correlations with response location as a function of time (in s) for seen (left) and unseen (right) trials. The first three time bins are relative to target, the last two relative to response screen onset. R = response screen onset.
Figure 6—figure supplement 2
Circular-linear correlations and multivariate decoding reveal similar time courses for response location.
(A) Average time courses of circular-linear correlation coefficients between amplitude of the ERFs and response location as a function of task (perception and working memory) and visibility (seen and unseen) in a group of left temporo-occipital gradiometers. Shaded area demarks standard error of the mean (SEM) across subjects. Thick line represents significant increase in correlation coefficient as compared to an empirical baseline (one-tailed Wilcoxon signed-rank test across subjects, uncorrected). Insets show average correlation coefficients (relative to baseline) in four time windows: 100–300 ms (early), 300–600 ms (P3b), 0.6–1.55 s (Del1), and 1.55–2.5 s (Del2). White asterisks denote significant differences to baseline (one-tailed Wilcoxon signed-rank test across subjects). For display purposes, data were lowpass-filtered at 8 Hz. *p<0.05, **p<0.01, and ***p<0.001. Del1 = first part of the delay period, Del2 = second part of the delay period, T = target onset. (B) Average time courses of a linear support vector regression trained to predict response angle as a function of task (perception and working memory) and visibility (seen and unseen). Thick line represents significant increase in decoding accuracy (in radians) as compared to a baseline (one-tailed Wilcoxon signed-rank test across subjects, uncorrected). Insets show average correlation coefficients (relative to baseline) in four time windows: 100–300 ms (early), 300–600 ms (P3b), 0.6–1.55 s (Del1), and 1.55–2.5 s (Del2). White asterisks denote significant differences to baseline (one-tailed Wilcoxon signed-rank test across subjects). For display purposes, data were lowpass-filtered at 8 Hz. *p<0.05, **p<0.01, and ***p<0.001. Del1 = first part of the delay period, Del2 = second part of the delay period, T = target onset.
Figure 7

Activity-silent neural mechanisms underlying conscious and non-conscious working memory.
(A) Structure of a one-dimensional continuous attractor neural network (CANN). Neuronal connections J (θ, θ’) are translation-invariant in the space of the neurons’ preferred stimulus values (-π, π), allowing the network to hold a continuous family of stationary states (bumps). An external input Ie (θ, t) containing the stimulus information triggers a bump state (red curve) at the corresponding location in the network. (B) Model of a synaptic connection with short-term potentiation. In response to a presynaptic spike train (bottom), the neurotransmitter release probability u increases and the fraction of available neurotransmitter x decreases (middle), representing synaptic facilitation and depression. Effective synaptic efficacy is proportional to ux (top). (C) Firing rate of neurons (top) and sequence of events (bottom; target and mask signal) when simulating conscious working memory with Amask = 50 Hz < Acritical. (D) Same as in (C) for non-conscious working memory when Amask = 65 Hz > Acritical. (E, F) Performance of the network (distribution of responses) when mask amplitude was near the critical level, Amask = 62 Hz ~ Acritical, and noise had been added to the system. Out of 4000 trials, 2035 resulted in the conscious (E) and the remainder in the non-conscious regime (F). In both cases, performance remained above chance with the responses concentrated around the initial target location.
Author response image 1
Author response image 2
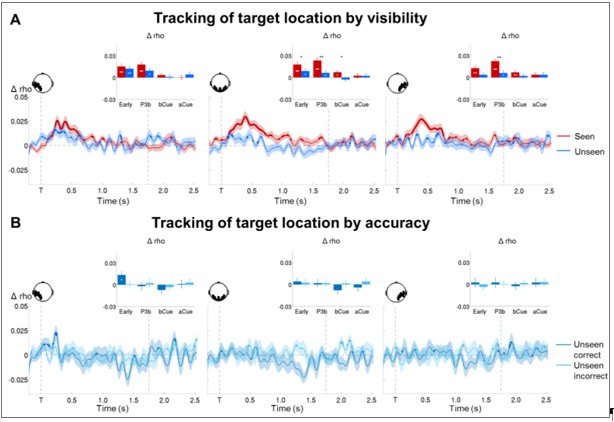
(A) Time courses of circular-linear correlations between MEG signals and target location combined across data from 29 participants for seen (red) and unseen (blue) trials. In the replication study, a visual cue was presented 1.75 s after the presentation of the target stimulus, indicating specific response modalities. (B) Time courses of circular-linear correlations between MEG signals and target location combined across data from 29 participants for unseen correct (dark blue) and unseen incorrect (light blue) trials.
Author response image 3
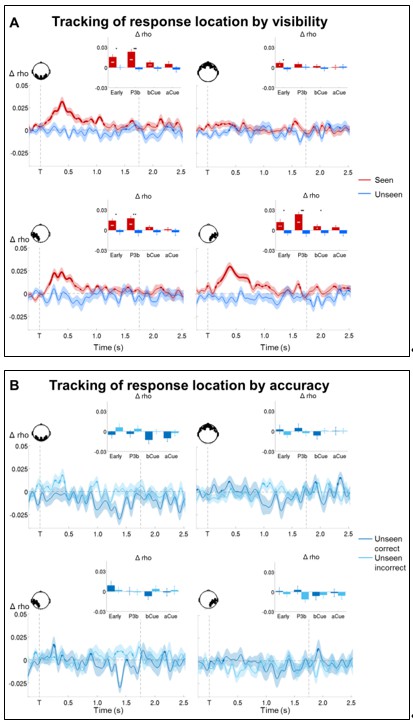
(A) Time courses for circular-linear correlations between MEG signals and response location combined across data from 29 participants for seen (red) and unseen (blue) trials. In the replication study, a visual cue was presented 1.75 s after the presentation of the target stimulus, indicating specific response modalities. (B) Time courses for circular-linear correlations between MEG signals and response location combined across data from 29 participants for unseen correct (dark blue) and unseen incorrect (light blue) trials.
Author response image 4
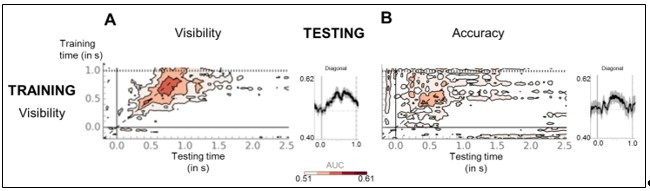
(A) Temporal generalization matrices for classifiers trained to distinguish seen from unseen trials in the perception task and applied to the working memory task. Horizontal, dotted line denotes mean reaction time for the visibility response in the perception task. Inset represents the diagonal of the matrix (black), i.e. classifiers were trained and tested on the same time sample. Thick line indicates above-chance decoding performance (one-tailed Wilcoxon signed-rank test, uncorrected). Shaded area denotes standard error of the mean (SEM) across subjects. For display purposes only, data were smoothed with a moving average of eight samples. (B) Same as in (A), except that classifiers trained to distinguish seen from unseen in the perception task were applied to unseen correct and unseen incorrect trials in the working memory task.
Author response image 5
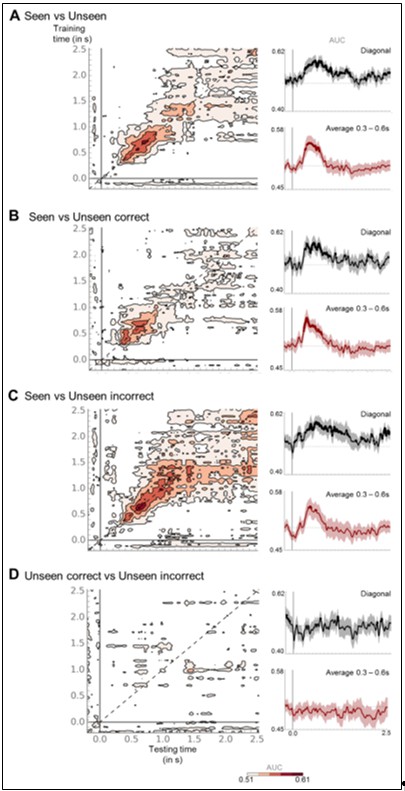
Temporal generalization matrices for classifiers trained to distinguish seen from unseen trials (A), seen from unseen correct (B), seen from unseen incorrect (C), and unseen correct from unseen incorrect (D) in the working memory task. Insets represent the diagonal of the matrix (black), i.e. classifiers were trained and tested on the same time sample, and P3b (red) slices, i.e., classifiers trained between 0.3 and 0.6 s were averaged. Thick line indicates above-chance decoding performance (one-tailed Wilcoxon signed-rank test, uncorrected). Shaded area denotes standard error of the mean (SEM) across subjects. For display purposes only, data were smoothed with a moving average of eight samples. Note that a class weight was applied to counter any class imbalances.
Author response image 6
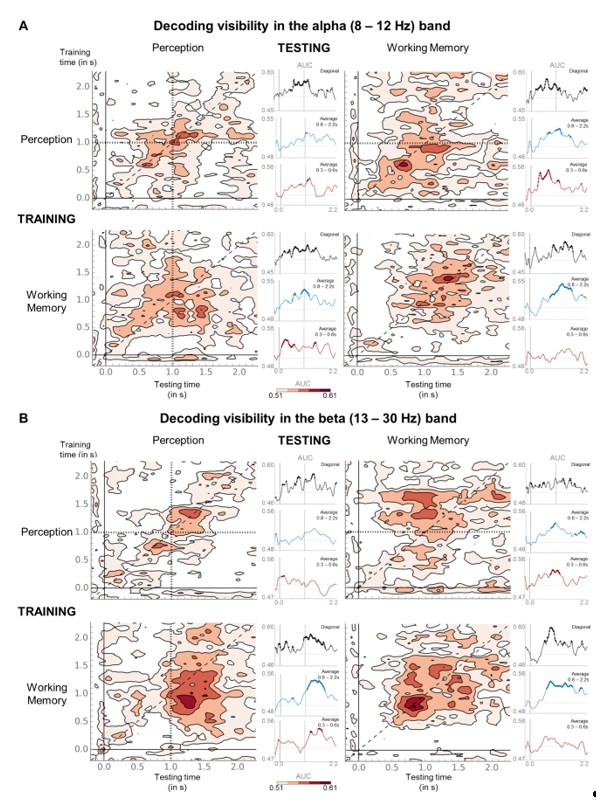
(A) Temporal generalization matrices for decoding of visibility category with relative, average alpha (8–12 Hz) power as a function of training and testing task. In each panel, a classifier was trained at every time sample (y-axis) and tested on all other time points (x-axis). The diagonal gray line demarks classifiers trained and tested on the same time sample. Please note the event markers in any panel involving the perception task: Mean reaction time (target-present trials) for the visibility response is indicated as vertical and/or horizontal, dotted lines. Any classifier beyond this point only reflects post-visibility processes. Time courses of diagonal decoding and of classifiers averaged over the P3b time window (300–600 ms) and over the working memory maintenance period (0.8–2.5 s) are shown as black, red, and blue insets. Thick lines indicate significant, above-chance decoding of visibility (Wilcoxon signed-rank test across subjects, uncorrected, two-tailed except for diagonal). For display purposes, data were smoothed using a moving average with a window of one sample. AUC = area under the curve. (B) Same as in (A) but for average beta (13–30 Hz) power.
Additional files
-
Supplementary file 1
- https://doi.org/10.7554/eLife.23871.019
-
Supplementary file 2
- https://doi.org/10.7554/eLife.23871.020
-
Supplementary file 3
- https://doi.org/10.7554/eLife.23871.021
-
Supplementary file 4
- https://doi.org/10.7554/eLife.23871.022
Download links
A two-part list of links to download the article, or parts of the article, in various formats.
Downloads (link to download the article as PDF)
Open citations (links to open the citations from this article in various online reference manager services)
Cite this article (links to download the citations from this article in formats compatible with various reference manager tools)
A theory of working memory without consciousness or sustained activity
eLife 6:e23871.
https://doi.org/10.7554/eLife.23871


