Modeling of axonal endoplasmic reticulum network by spastic paraplegia proteins
- University of Cambridge, United Kingdom
- University of Connecticut Health Center, United States
Figures
Figure 1 with 1 supplement
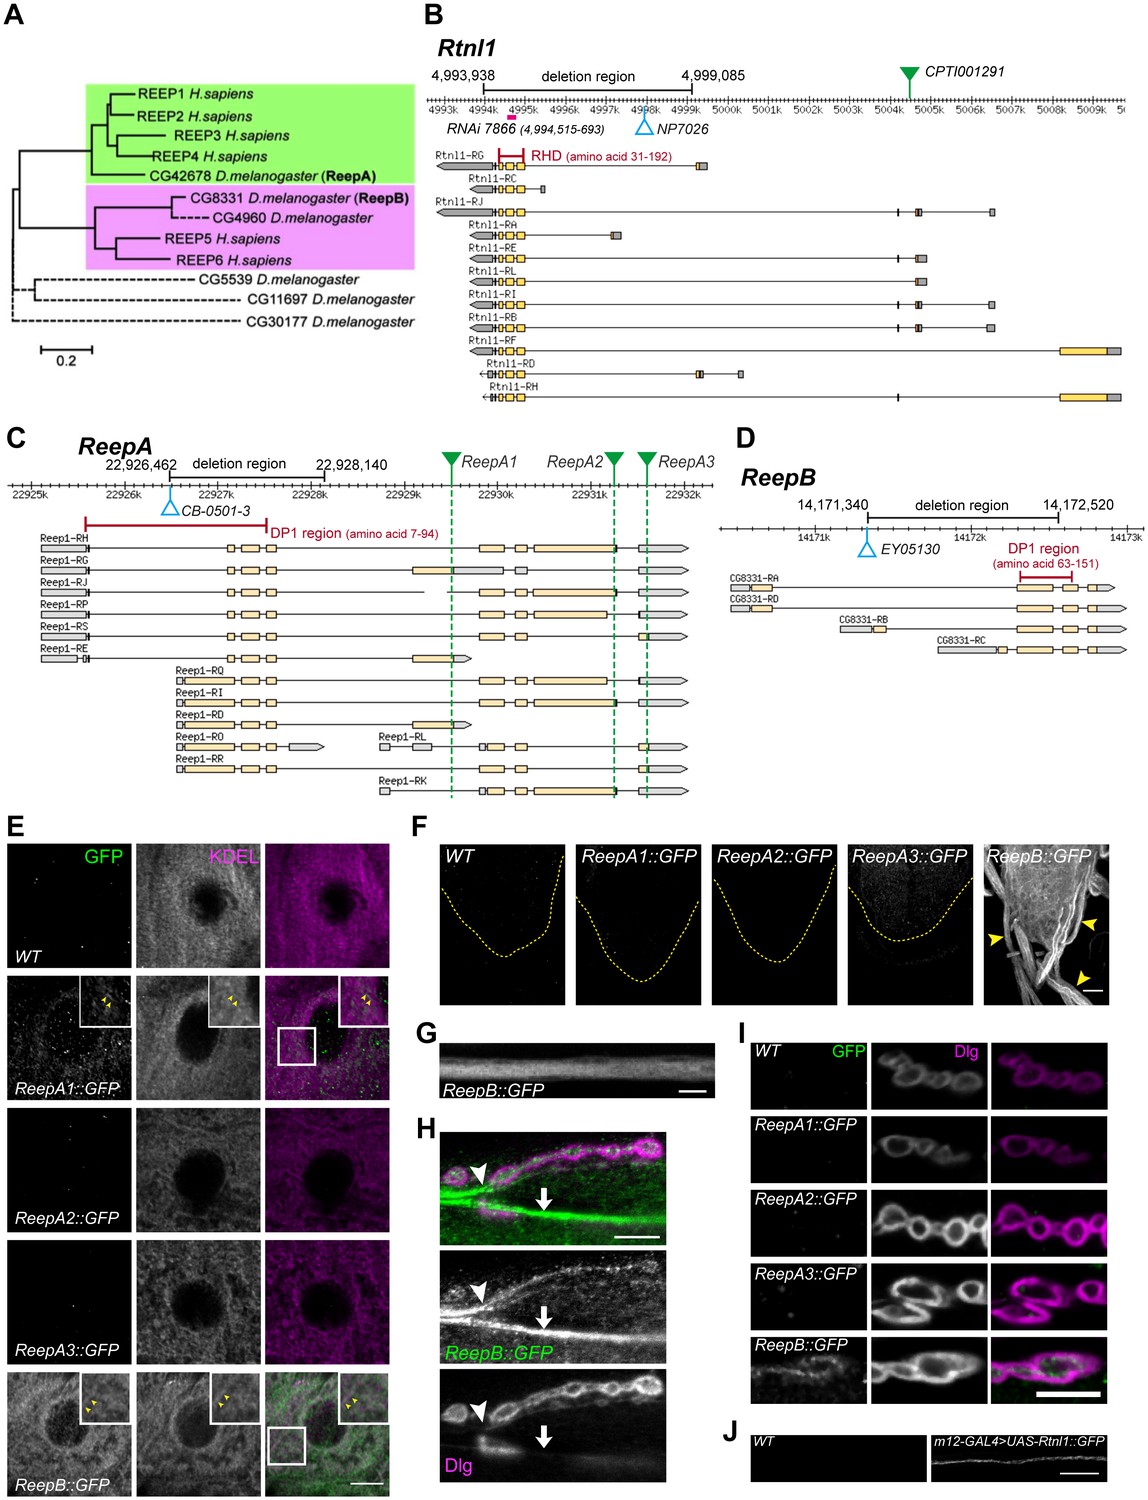
Drosophila Rtnl1 and REEP genes and products.
(A) A dendrogram based on ClustalW sequence alignment of Drosophila and human REEP proteins shows two branches corresponding to human REEP1-4 (CG42678) and human REEP5-6. Broken lines represent Drosophila REEP proteins that are evolving rapidly (Supplementary file 1), reflected by longer branch lengths. Sequences used are NP_075063.1, NP_057690.2, NP_001001330.1, NP_079508.2, NP_005660.4, NP_612402.1, NP_726266.1, NP_610936.2, NP_651429.1, NP_611831.2, NP_572730.1, NP_726366.1. (B) Rtnl1 genomic and transcript map, showing the region deleted in Rtnl1− by excision of P-element NP7026 (Wakefield and Tear, 2006; Figure 1—figure supplement 1), the RHD domain (Pfam 02453) and its coordinates in protein isoform G, the Rtnl1::YFP exon trap insertion CPTI001291 (green triangle), and the fragment targeted by GD RNAi 7866. Map and coordinates are from the Drosophila Genome Browser (www.flybase.org, version R6.04), here and in subsequent panels; light regions in transcripts represent coding regions, dark shaded regions represent untranslated regions. (C) ReepA genomic and transcript map showing the region deleted in ReepA− by excision of P-element CB-0501–3, the position of the DP1 domain (Pfam 03134) and its coordinates in protein isoforms H and J. GFP insertion sites for ReepA1::GFP, ReepA2::GFP and ReepA3::GFP fusions are shown with green triangles. (D) ReepB genomic and transcript map showing the region deleted in ReepB− by excision of P-element EY05130, the position of the DP1 domain (Pfam 03134) and its coordinates in protein isoforms A and D). (E–I) Confocal sections showing localization of ReepA::GFP isoforms and ReepB::GFP. (E) Overlap of ReepA1::GFP and ReepB::GFP with anti-KDEL labeling in larval epidermal cells. To facilitate display of weaker ReepA1::GFP, the GFP channel in wild-type control (WT) and ReepA::GFP images has been brightened four times as much as for ReepB::GFP. (F) Expression of ReepA3::GFP and ReepB::GFP in third instar ventral nerve cord. The GFP channels for WT and ReepA::GFP have been brightened by twice as much as for ReepB::GFP. VNCs are outlined with yellow dashed lines. Arrowheads show ReepB::GFP extending into peripheral nerves. (G) A single confocal section of a peripheral nerve, showing ReepB::GFP localized continuously along its length. (H) Double labeling of an NMJ for ReepB::GFP and the mainly postsynaptic marker Dlg, showing ReepB::GFP in an axon emerging from nerve bundles (arrowhead) to extend to the NMJ, as well as in axons traversing the muscle surface (arrow); note the dispersed ReepB::GFP staining also in the underlying muscle. (I) Double labeling of ReepA::GFP and ReepB::GFP lines for GFP and Dlg (mainly postsynaptic) shows presynaptic expression of ReepB::GFP. (J) GFP expression in a wildtype negative control (WT), or from Rtnl1::GFP expressed in two closely apposed motor neurons by m12-GAL4. Scale bars 10 µm, except F, 20 µm.
Figure 1—figure supplement 1
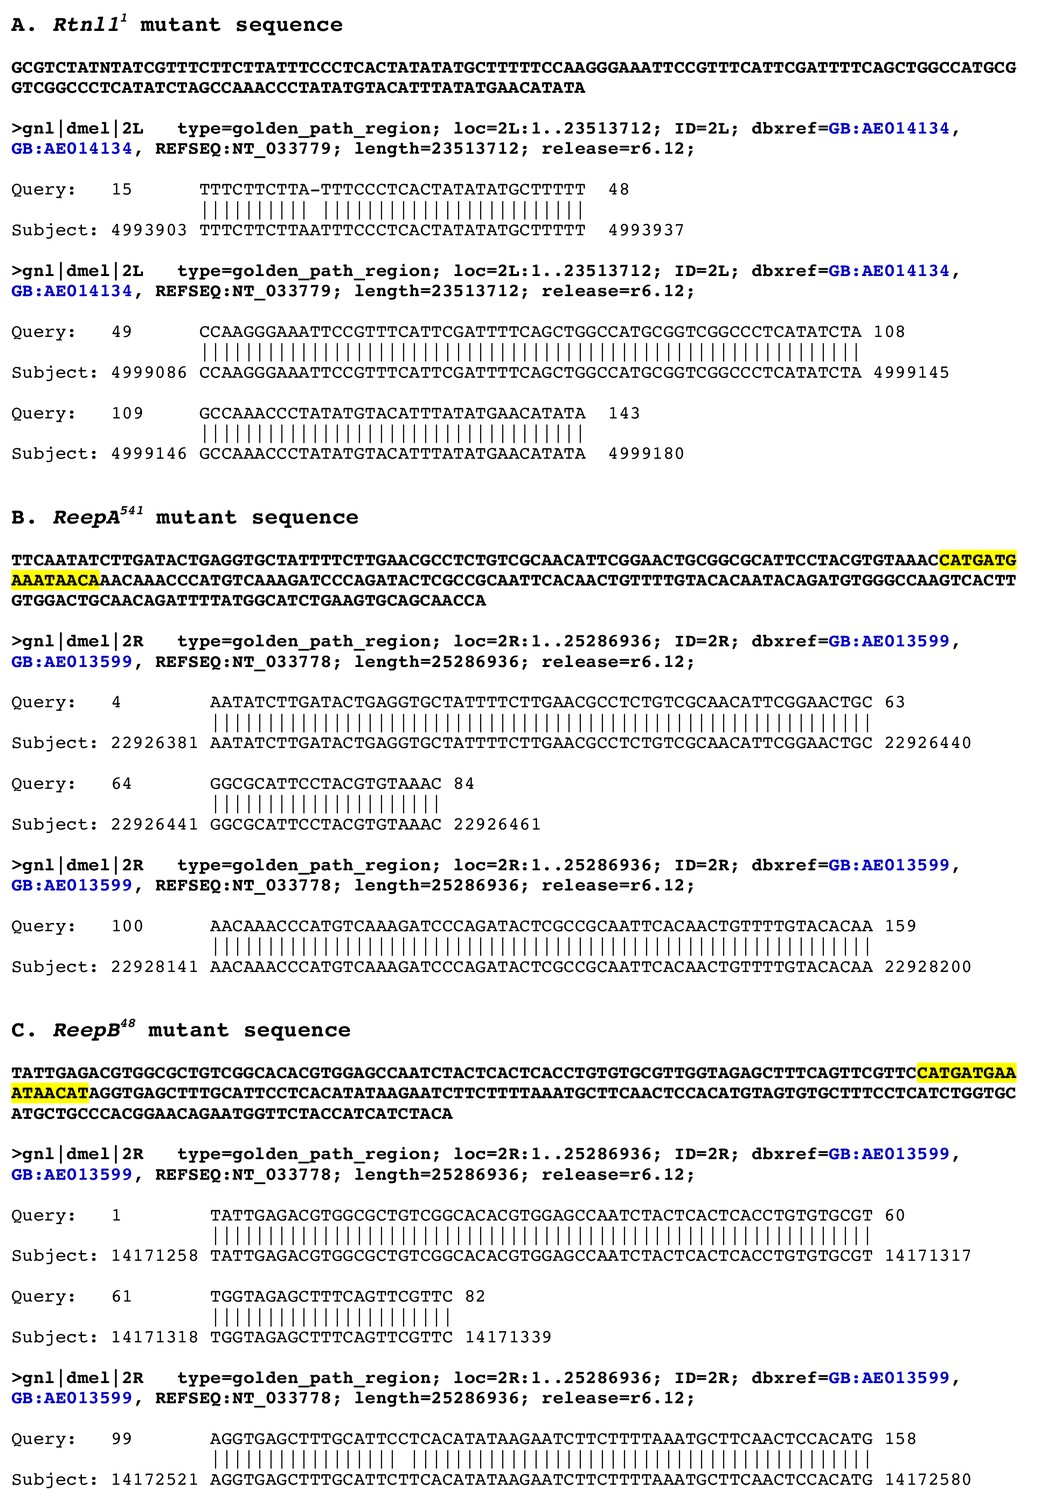
Molecular lesions in Rtnl11, ReepA541 and ReepB48.
BLASTN searches of the Drosophila genome, using the sequences of (A) Rtnl11, (B) ReepA541 and (C) ReepB48 mutations as queries, show the coordinates of each molecular lesion in the genome, as gaps in alignments between mutant and genomic sequences. The ReepA541 and ReepB48 sequences highlighted in yellow show P element footprints left at the excision sites.
Figure 2
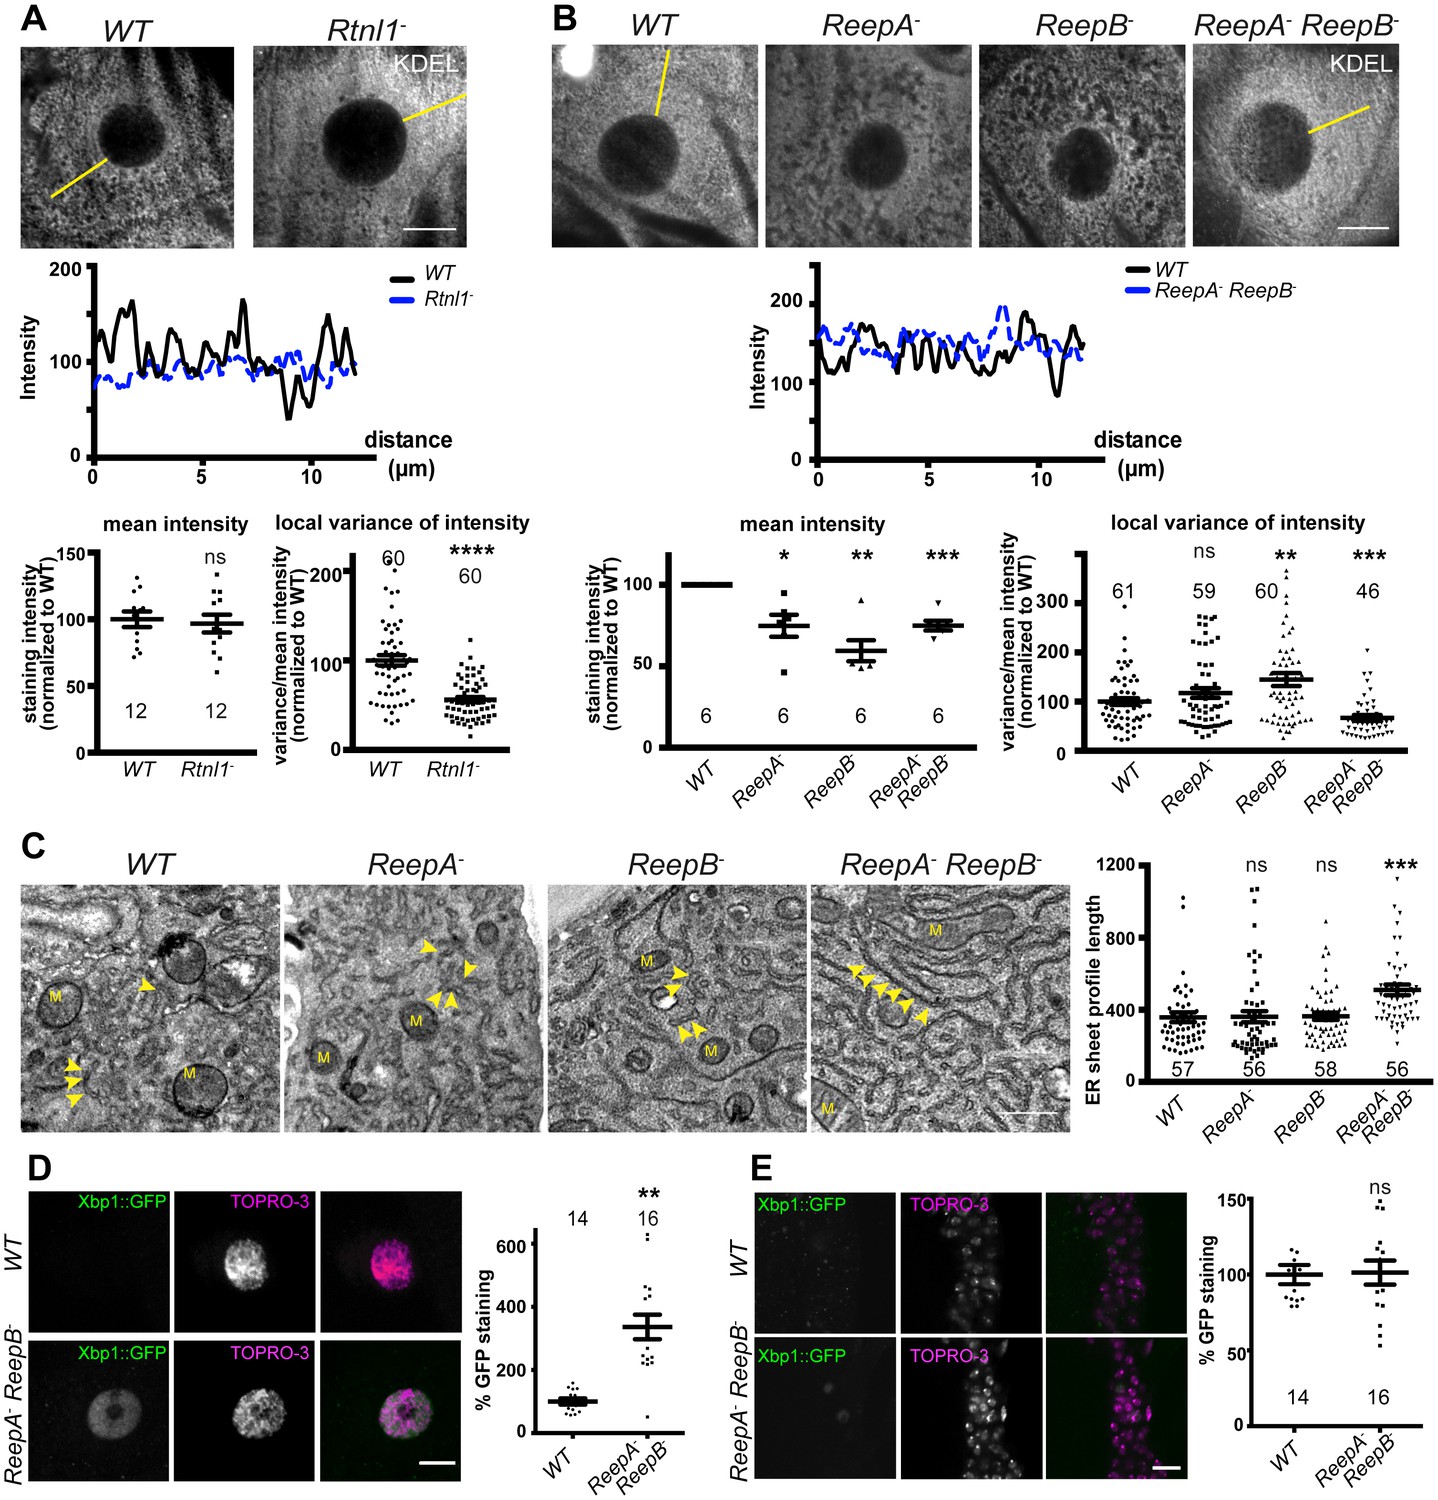
Rtnl1− mutants and ReepA− ReepB− double mutants show disrupted ER organization in epidermal cells.
(A) KDEL distribution in third instar larval epidermal cells appears diffuse in Rtnl1− larvae compared to a more reticular staining in wild-type (WT) larvae. Micrographs show 1.5 µm z-projections of confocal sections. KDEL intensity along yellow lines from nuclear envelope to the cell periphery shows less fluctuation in Rtnl1− (blue dotted line on line graph) than in WT larvae (black line on line graph). Fluctuation of intensity is quantified using the local normalized variance of intensity (variance/mean for rolling 10-pixel windows) over a 12 µm line for each cell. n = 61 epidermal cells from 12 larvae, 3–5 cells from each larva, from 3 independent experiments. (B) KDEL distribution in third instar larval epidermal cells shows less spatial fluctuation in ReepA− ReepB− double mutant larvae compared to ReepA+ (WT), and ReepA− and ReepB− single mutant larvae. This is confirmed by quantification as in A); overall KDEL intensity is reduced in all ReepA and ReepB mutant genotypes. n = 45–61 epidermal cells in total from 12 to 16 different larvae, 3–5 cells from each larva, from 6 independent experiments. Intensity datapoints are experimentwise averages of multiple larvae, compared by paired t-tests, since larva-wise data were too significantly different to pool across experiments in this case. (C) Electron micrographs show increased ER sheet profile length in ReepA− ReepB− double mutant third instar larval epidermal cells compared to single ReepA− and ReepB− mutants and controls. Arrowheads, ER sheets; M, mitochondria. (n = 56–58 cells in total from three independent larvae, 18–19 cells from each. (D,E) ReepA− ReepB− double mutant larvae have an increased ER stress response compared to a ReepA+ (WT) control, measured by Xbp1::GFP expression, in larval epidermis (D) but not in neuronal cell bodies (E). Graphs show quantification of Xbp1::GFP staining intensity relative to controls. (n = 12–15 larvae). All graphs show individual datapoints and mean ±SEM. Occasional outlier datapoints off the top of the scale are omitted from graphs but included in statistical analyses. ns, p>0.05; *p<0.02; **p<0.005; ***p<0.0003; ****p<0.0001, two-tailed Student’s t-test. Scale bars: A, B, D, E, 10 µm; C, 0.5 µm).
Figure 3
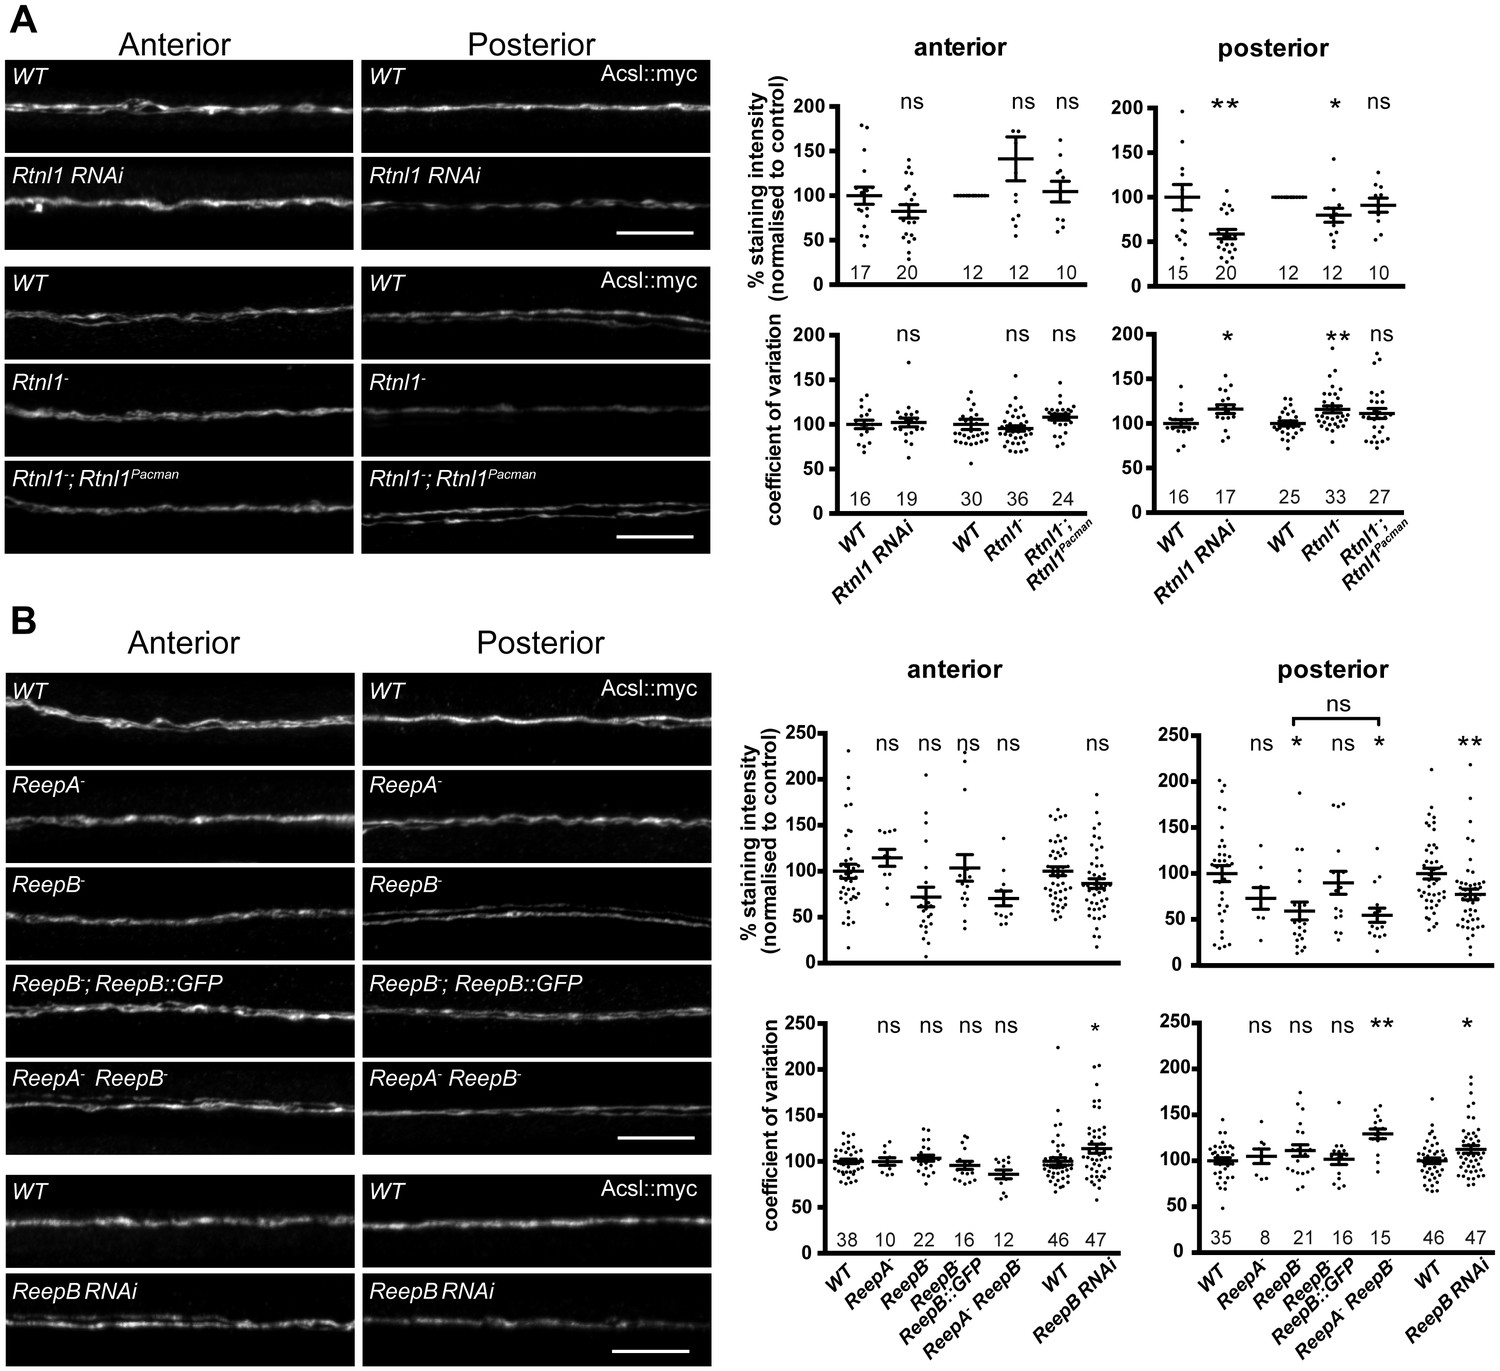
Loss of either Rtnl1 or ReepB leads to partial loss of smooth ER marker from distal motor axons.
(A) Effects of Rtnl1 loss on ER, visualized by Acsl::myc expressed in two adjacent motor axons using m12-GAL4. Images show effects of Rtnl1 knockdown, Rtnl1− mutation, rescue of Rtnl1− by Rtnl1Pacman and respective ReepA+ control (WT) axons. Graphs show mean staining intensity (top graphs) or coefficient of variation of intensity (bottom graphs) as a measurement of staining variability along the length of each axon. Rtnl1 loss leads to partial loss of Acsl::myc in posterior but not anterior axons (top graphs), and to some disorganization of posterior axonal ER seen by increased coefficient of variation of Acsl::myc staining intensity. There is partial rescue of Rtnl1 phenotypes by one copy of a Rtnl1Pacman genomic clone. n = 15–20 larvae per genotype pooled from 5 independent experiments for RNAi; n = 24–36 larvae per genotype from 10 to 12 independent experiments for Rtnl1− mutant. Graphs show individual datapoints with mean ±SEM; ns, p>0.05; *p<0.03; **p<0.005; two-tailed unpaired Student’s t-test; two-tailed paired Student’s t-test was used when larva-wise data were too significantly different across experiments (p<0.05, ANOVA) to pool. (B) Effects of ReepA or ReepB loss on axonal ER. ReepB knockdown or ReepB− mutation, but not ReepA mutation, causes partial loss of smooth ER marker Acsl::myc in posterior but not in anterior motor axons. The ReepB− phenotype can be mostly rescued by one copy of a genomic ReepB::GFP clone. A ReepA− ReepB− double mutant shows a similar phenotype to a ReepB− single mutant. ReepA− ReepB− double mutant, but not single ReepA− or ReepB− mutants, show increased coefficient of variation of Acsl::myc staining levels in posterior axons; n = 7–47 larvae from 4 to 11 independent experiments. All graphs show individual datapoints with mean ±SEM; occasional outlier datapoints off the top of the scale are omitted from graphs but included in statistical analyses. ns, p>0.05; *p<0.04 **p<0.01. ReepB RNAi was analyzed using two-tailed unpaired Student’s t-tests; multiple comparisons of ReepA and ReepB mutant genotypes were analyzed by ANOVA followed by post-hoc Tukey HSD tests. Scale bars, 10 µm.
Figure 4 with 1 supplement
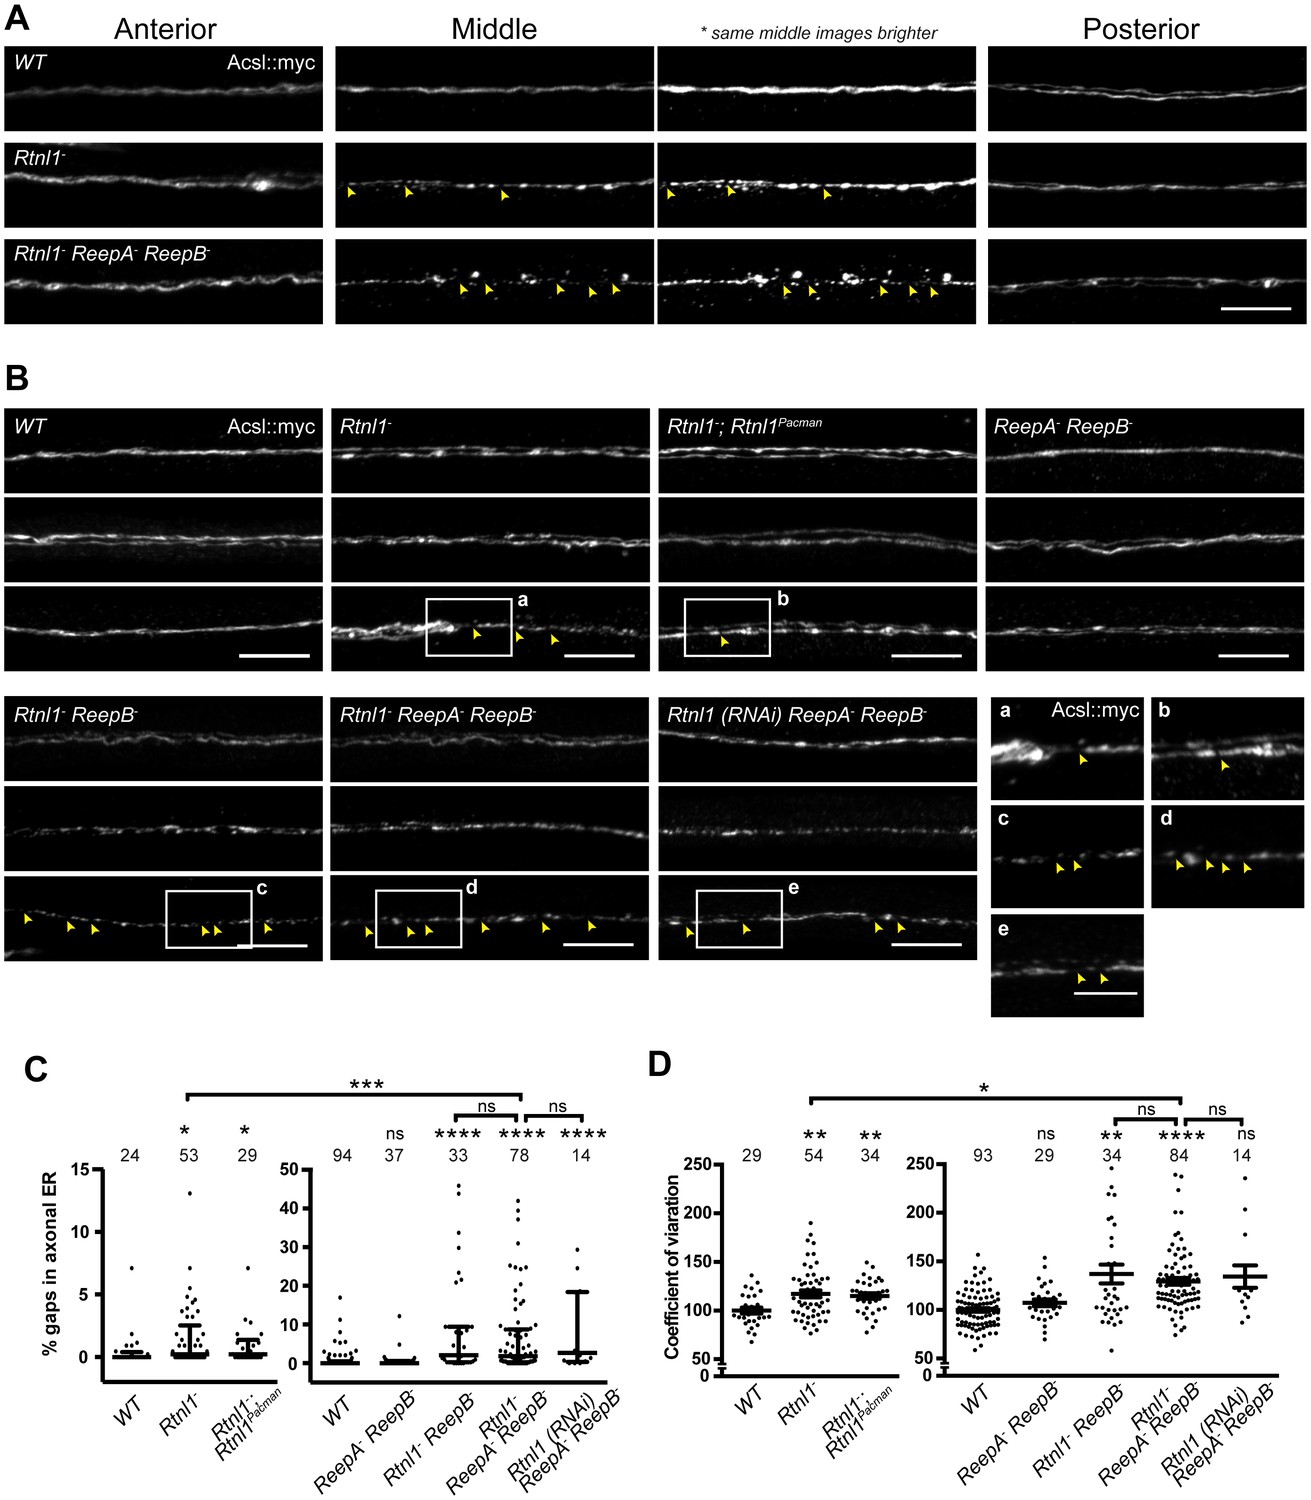
Loss of hairpin proteins leads to discontinuity of axonal ER staining.
(A) Rtnl1− larvae and Rtnl1− ReepA− ReepB− triple mutant larvae sometimes show fragmented axonal ER labeling in the middle parts (segment A5) of long motor axons that express Acsl::myc under control of m12-GAL4. Anterior (segment A2) and posterior (segment A6) portions of the same motor axons show continuous ER labeling. Arrowheads show gaps in Acsl::myc staining; brighter versions of the same images show gaps in staining in mutants but not wild-type (WT), even when brightness of remaining staining is saturating. (B) Panels show three examples of the range of Acsl::myc distributions found in the middle parts of long motor axons of each genotype of ReepA+ (WT), Rtnl1−, Rtnl1− rescued with a Rtnl1Pacman construct, ReepA− ReepB− and Rtnl1− ReepB− double mutants, Rtnl1− ReepA− ReepB− triple mutant, and Rtnl1(RNAi) ReepA− ReepB− larvae. A variety of phenotypes, from continuous to fragmented Acsl::myc labeling, are found in genotypes that lack Rtnl1, and tend to be more severe in genotypes that also lack ReepB. Insets show examples of gaps in ER continuity (arrowheads) at higher magnification. Scale bars 10 µm, and 5 µm in higher zoom images. (C) Percentages of a 45 µm length in the middle (A4/A5 segment) of each axon that lacks Acsl::myc staining, using an intensity threshold of 20 on a scale of 0–255. Individual axons are plotted, together with median and interquartile range; comparisons use Mann-Whitney U-tests. All genotypes that lack Rtnl1 show more gaps than WT; Rtnl1− ReepA− ReepB− triple mutants do not differ from Rtnl1(RNAi) ReepA− ReepB− or Rtnl1− ReepB− double mutants, but are significantly more severe than Rtnl1− single mutants. (D) The coefficient of variation of Acsl::myc labeling in middle axon portions is increased in genotypes lacking Rtnl1, relative to controls. Graphs show individual datapoints with mean ±SEM; occasional outlier datapoints off the top of the scale are omitted from graphs but included in statistical analyses. Comparison between Rtnl1− and Rtnl1− ReepA− ReepB− mutant genotypes was analyzed by two-tailed Student’s t-test, other multiple comparisons by ANOVA followed by Dunnett’s T3 test. ns, p>0.05; *p<0.04; **p<0.01; ***p<0.0005; ****p<0.0001; individual axons are plotted from 3 to 20 independent experiments, each with 2–3 different larvae for each genotype.
Figure 4—figure supplement 1
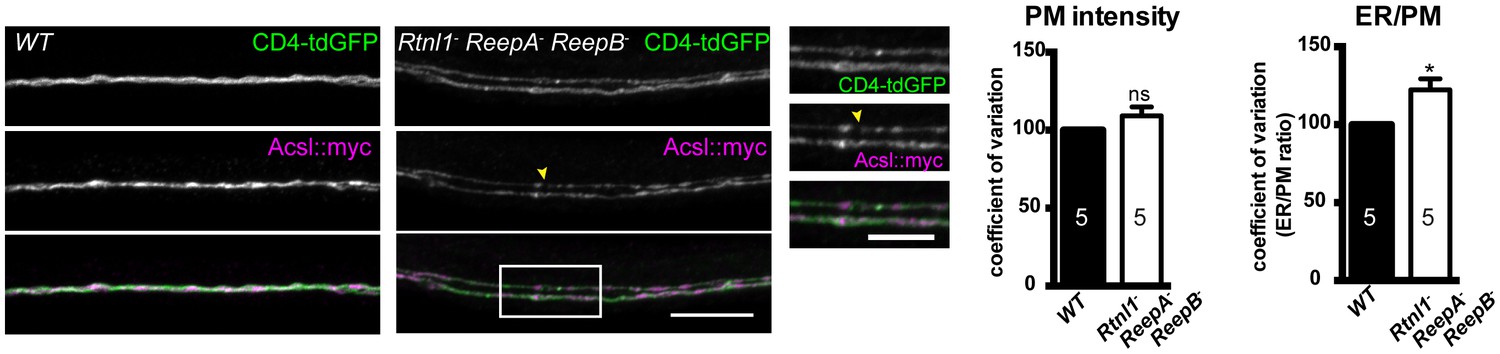
Plasma membrane integrity is not affected in Rtnl1− ReepA− ReepB− triple mutant larvae).
Coefficient of variation for plasma membrane labeling along axon length is unchanged in Rtnl1− ReepA− ReepB− triple mutant compared to control (WT) axons, whereas the ER to plasma membrane ratio of the coefficient of variation is increased. Higher zoom images of the boxed areas show gaps (yellow arrowheads) and brightly labeled axonal ER accumulations. Graphs show mean ±SEM; *p<0.02, two-tailed Student’s t-test; n = 5 different larvae from 3 independent experiments.
Figure 5 with 1 supplement
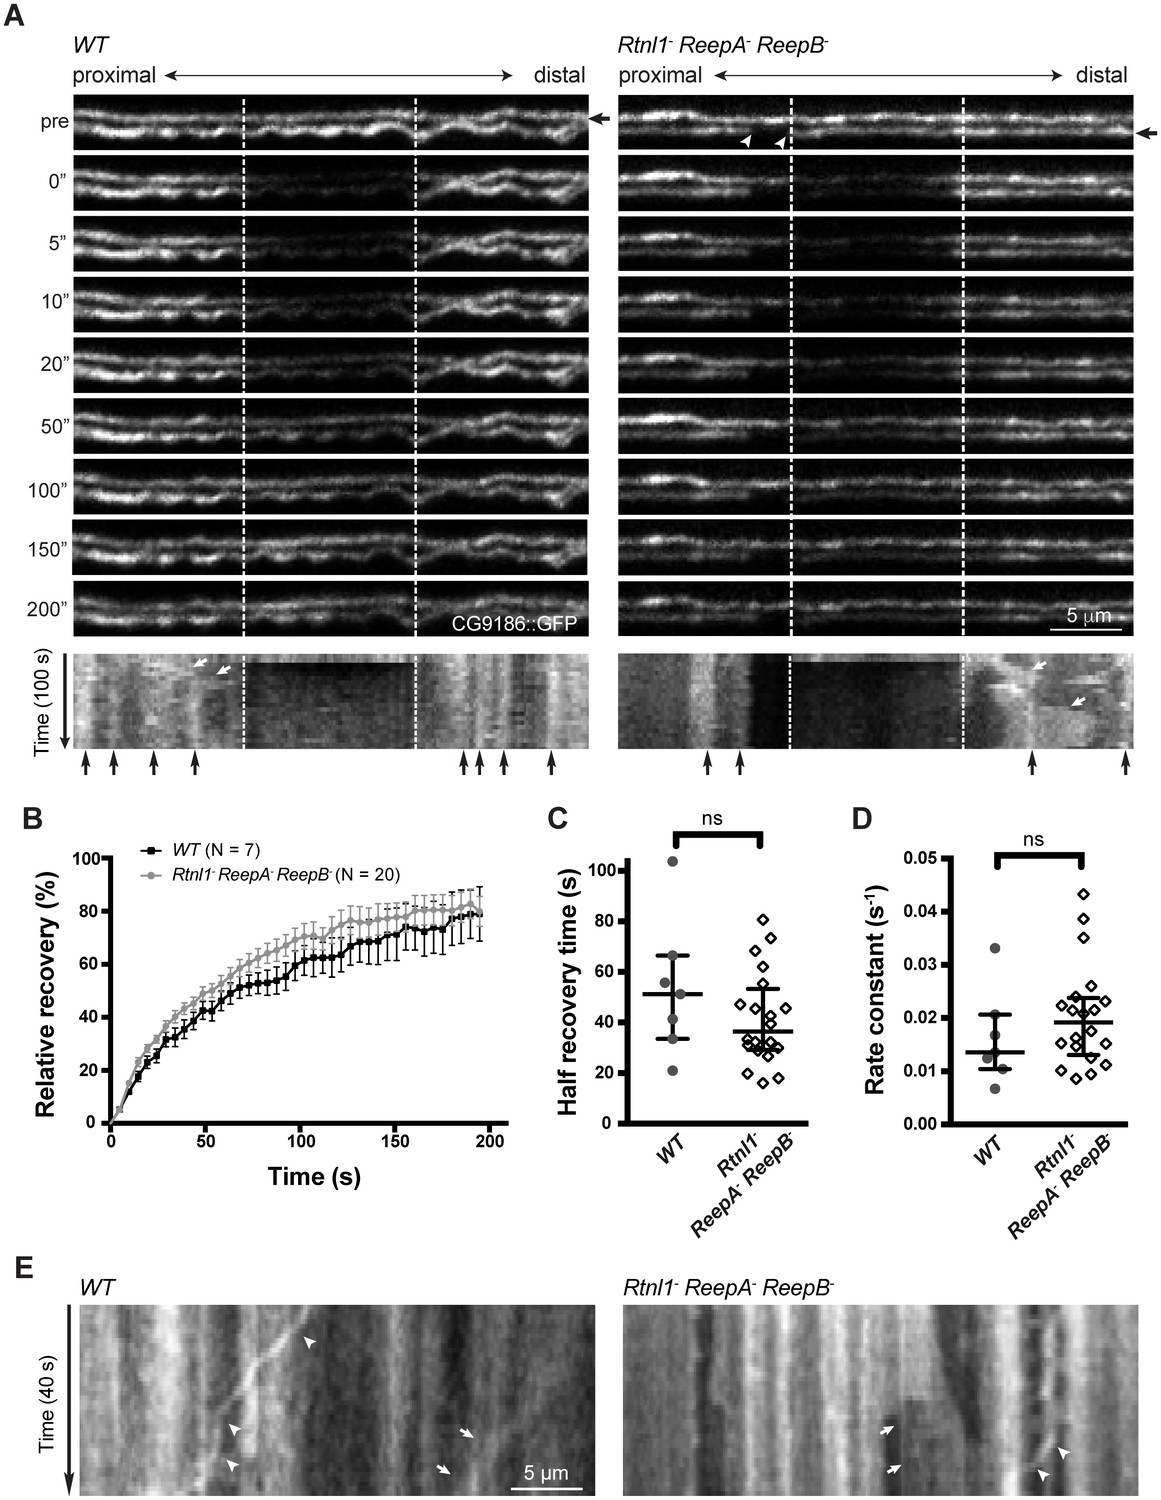
Live imaging of ER in wild type and hairpin mutant axons.
(A) Representative FRAP assay images from ReepA+ (WT) or Rtnl1− ReepA− ReepB− triple mutant axons in which ER was visualized using CG9186::GFP expression driven in two motor axons by m12-GAL4. One triple mutant axon shows a gap in labeling (arrowheads). Regions of interest (12 µm, between dashed lines) were photobleached. Fluorescence was visualized before photobleaching (‘pre’), and during recovery over 200 s. A kymograph was generated for each axon indicated by an arrow in the top panel. Most areas of intense and less intense ER labeling remain stable over time (e.g. black arrows below kymographs); occasional movements of ER features are indicated by white arrows in kymographs. (B) Relative fluorescence intensities within the photobleached region were plotted (mean ±SEM) during recovery for wild-type axons or for triple mutant axons lacking ER gaps. (C–D) Quantification of half recovery time (C) and rate constant (D) for wild-type and triple mutant axons lacking gaps, with median and interquartile range. Data in B–D are from seven recordings from 4 wild-type larvae, and 20 recordings from 14 mutant larvae. ns, p>0.05; Mann-Whitney U test. Scale bars, 5 µm. (E) Representative kymographs from time-lapse recording of CG9186::GFP in unbleached single ReepA+ (WT) or Rtnl1− ReepA− ReepB− triple mutant axons lacking gaps. The left panel shows retrograde movement of a ~ 3 µm length of ER labeling (arrows); the right panel shows anterograde movement of a ~ 5 µm stretch of ER labeling (arrows). Retrograde movements of labeled puncta are seen in both panels (arrowheads).
Figure 5—figure supplement 1

Continuity, stability and movement of fluorescent ER labeling in wild-type (WT) and Rtnl1− ReepA− ReepB− triple mutant axons.
(A) Time series and kymographs of two closely apposed motor axons expressing either Rtnl1::GFP or Sec61bβ::tdTomato ER markers under control of m12-GAL4. Images show continuity of ER staining in axons, and kymographs show stability of most ER features over the acquisition time. (B) Kymographs showing fluorescence recovery after photobleaching in two ReepA+ (WT) axons, or in two Rtnl1− ReepA− ReepB− triple mutant axons lacking ER gaps. Recovery proceeds from both ends of the bleached region (dotted lines). Most ER features seen before bleaching (top line of kymographs) can also be seen after recovery, implying that recovery proceeds by protein diffusion, not by movement of ER structures. (C) Kymographs showing fluorescence recovery after photobleaching immediately distal to gaps in ER staining, in four Rtnl1− ReepA− ReepB− triple mutant axons. Recovery proceeds only from the distal end of the bleached region (dotted lines) opposite the gap, but not across the proximal gap. While most ER gaps and many other features are stable, one axon shows a retrogradely moving particle (white arrowhead), and one shows anterograde movement of ER that closes one gap and opens another more proximally (white asterisk).
Figure 6
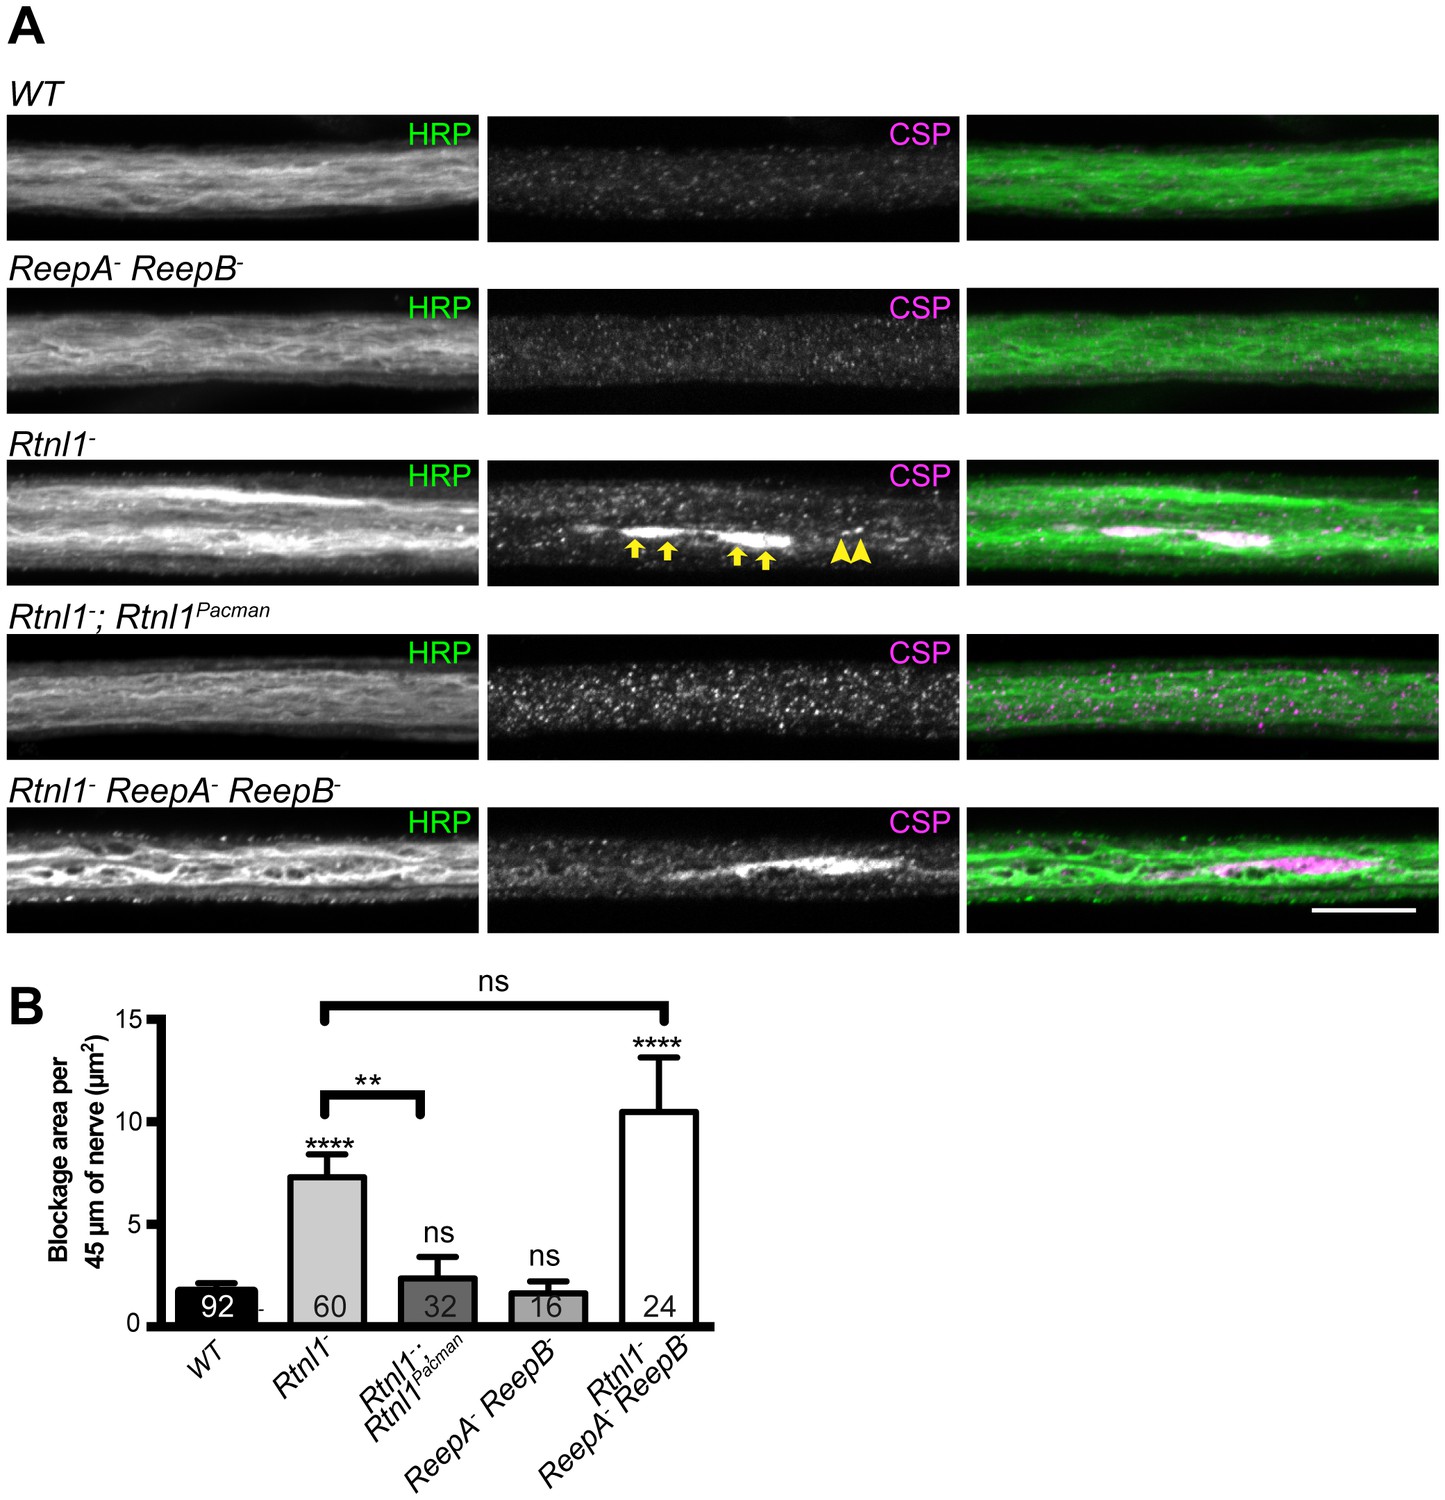
Loss of Rtnl1 causes mild accumulation of synaptic vesicles in axons.
(A) Peripheral nerves of Rtnl1− and Rtnl1− ReepA− ReepB− triple mutant larvae show larger accumulations of synaptic vesicle protein CSP (e.g. yellow arrows), and smaller elongated CSP puncta (e.g. yellow arrowheads). In contrast, control larvae (WT) and ReepA− ReepB− double mutant larvae show an even distribution of small round CSP puncta. CSP accumulations are not significantly bigger in Rtnl1− ReepA− ReepB− triple mutants than in Rtnl1− mutants. The CSP accumulations in Rtnl1− larvae can be rescued by two copies of a Rtnl1Pacman genomic clone. All axons shown are crossing abdominal segment A2. (B) Graph shows mean ±SEM; n = 16–92 axons from 8 to 46 larvae, from 3 different experiments. ns, p>0.05; **p<0.006; ****p<0.0001, two-tailed Student’s t-test. Scale bar, 10 µm).
Figure 7
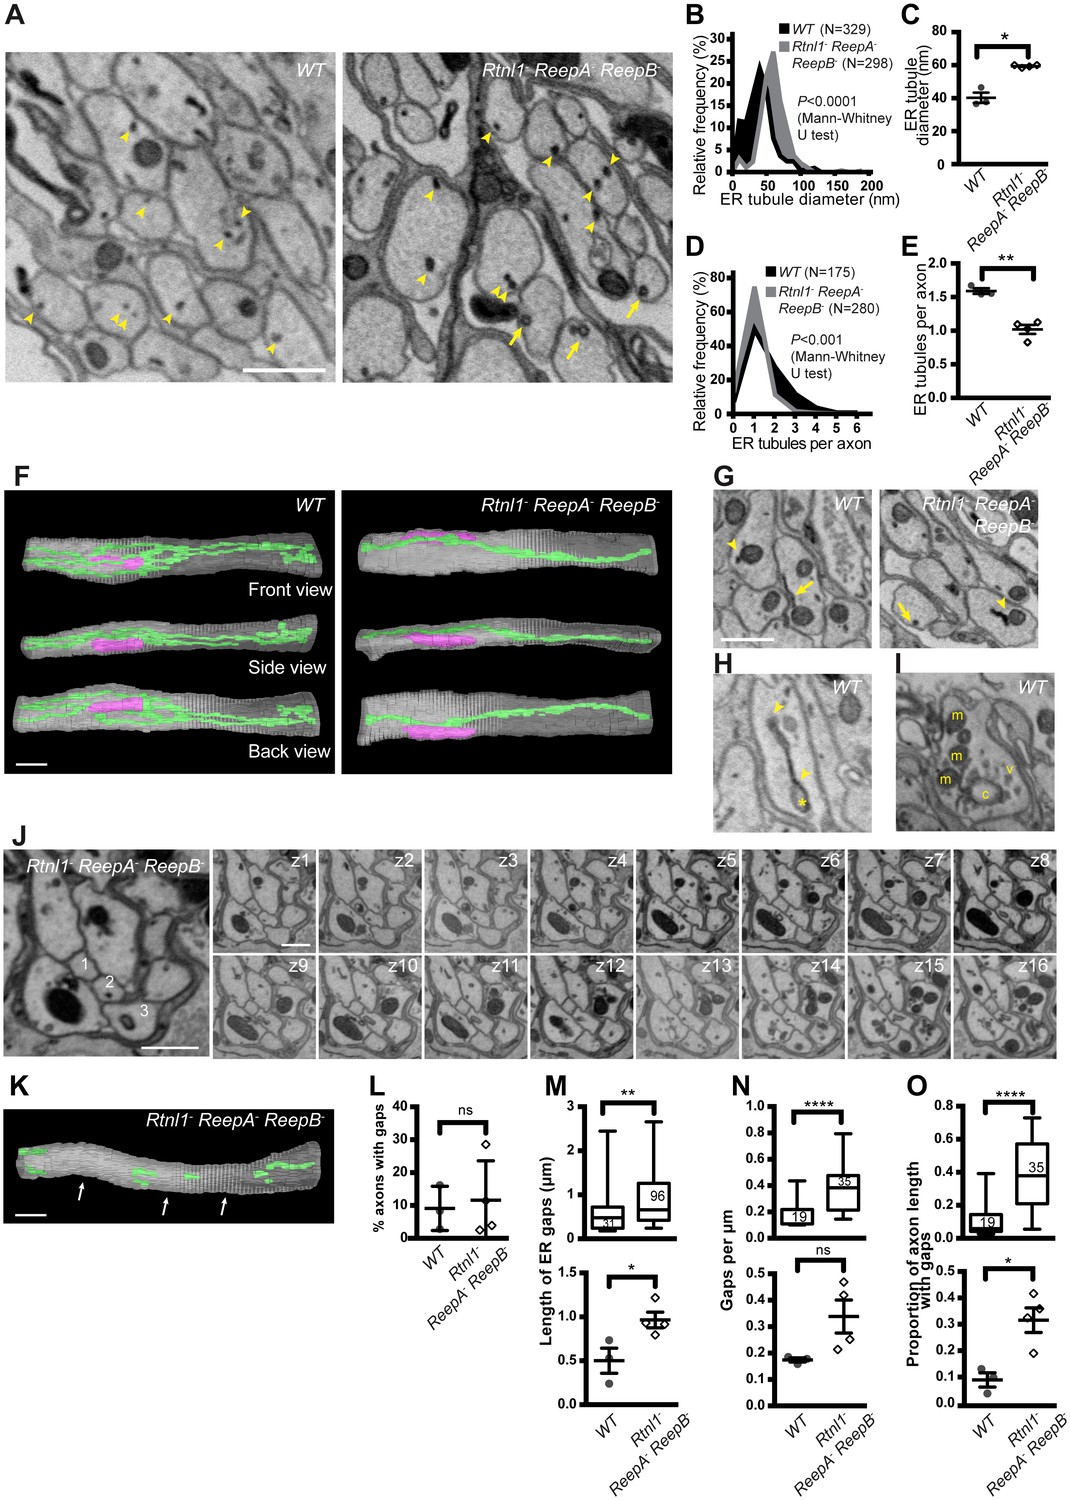
Loss of hairpin proteins leads to fewer but enlarged ER tubules in larval peripheral nerve axons.
(A) EMs of peripheral nerve axons from wild-type ReepA+ (WT, left) or Rtnl1− ReepA− ReepB− triple mutant (right) larvae. Arrowheads indicate ER tubules (seen as continuous structures in serial sections in Videos 5 and 7). Triple mutant axons show enlarged ER tubules, sometimes with a clear lumen (arrows), seldom observed in wild-type. Quantification of ER tubule diameter (B,C) and tubules per axon cross-section (D,E) in control and mutant larvae. Data from individual ER tubules or axons are shown in B and D, averaged larval values, mean ±SEM in C and E. (F) 3D reconstruction of a 4.5 µm axon segment from wild-type (left) or mutant (right) peripheral nerves, generated from 75 serial 60 nm sections, showing ER (green), mitochondria (magenta) and plasma membrane (gray). Interactive versions of the reconstructions are in Supplementary files 2 and 3. (G) Electron micrographs of peripheral nerve axons from wild-type (ReepA+, left) or Rtnl1− ReepA− ReepB− triple mutant (right) larvae, showing proximity of ER to mitochondria (arrowheads) or plasma membrane (arrows). (H) Representative EM of short ER sheet (arrowhead) and cisterna (asterisk) from a wild-type larva; further sections in Video 6. (I) section of an axonal swelling from a wild-type larva showing mitochondria (m), vesicles (v), and a large clear cisterna (c); further sections in Video 8. (J) Serial EM sections show ER discontinuity in two mutant axons: axon 1 lacks ER tubules in sections z6-z14 and axon 3 in sections z1-z11; neighboring axons (e.g. axon 2) show a continuous ER network. (K) 3D reconstruction of a 4.5 µm axon segment from mutant peripheral nerves, generated from 75 serial 60 nm sections, showing multiple gaps (indicated by arrows). ER is in green and plasma membrane in gray. Raw EM data and an interactive version of the reconstruction are in Video 9 and Supplementary file 4, respectively. (L) Frequency of axons with gaps in the 4.5 µm lengths analyzed. ER gap length (M), numbers of ER gaps per µm (N), and proportion of axon length with gaps (O) in affected axons. In M–O, top graphs show data from individual ER gaps (M) or individual axons (N–O), with second and third quartiles and 5th and 95th percentiles; bottom graphs show averaged larval values, mean ±SEM. In all graphs, ns p>0.05; *p<0.04; **p<0.003; ****p<0.0001; Mann-Whitney U test for B, D, top graphs in M–O; two-tailed Student’s T test for C, E, L, bottom graphs in M–O. Scale bars, 500 nm.
Figure 8 with 1 supplement
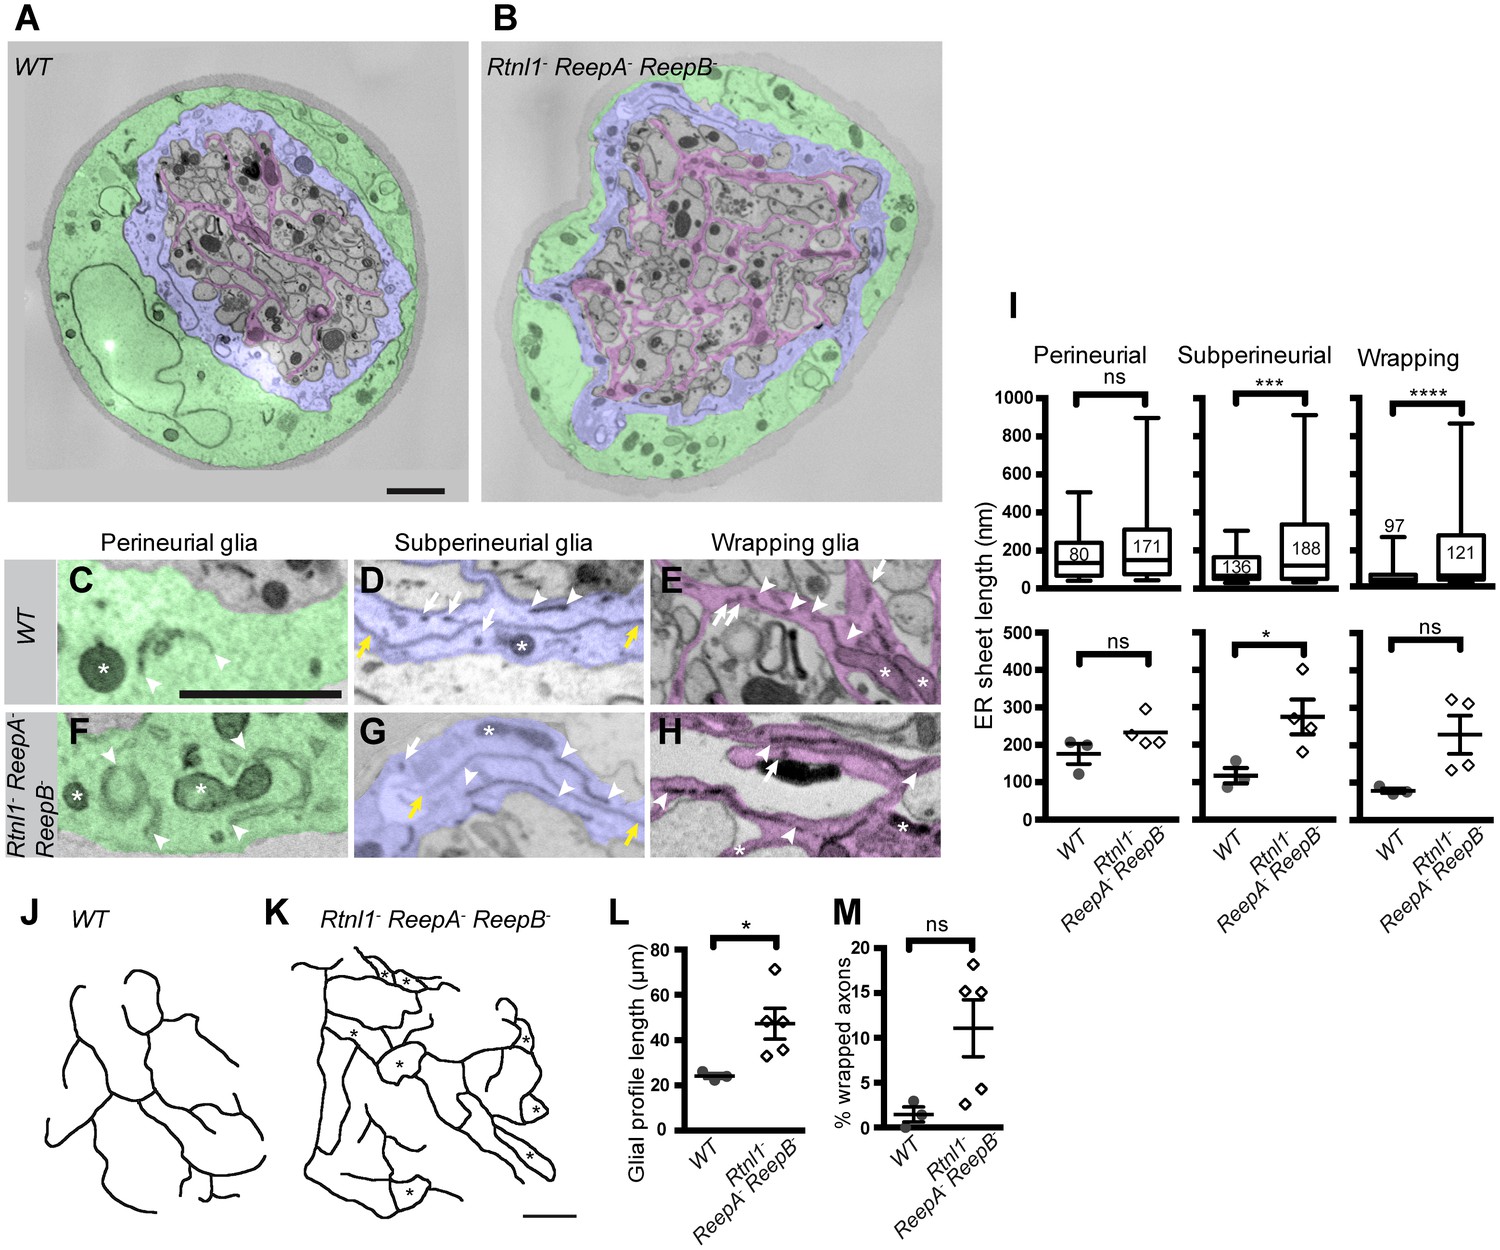
Loss of reticulon and REEP proteins leads to ER disorganization in glial cells and hyper-wrapping of peripheral axons.
(A–B) EMs of peripheral nerve sections from ReepA+ (WT) (A) or Rtnl1− ReepA− ReepB− triple mutant (B) larvae. Perineurial, subperineurial, and wrapping glial cells are shaded green, blue, and magenta, respectively. (C–H) Higher magnification images of perineurial (C,F), subperineurial (D,G), and wrapping (E,H) glia from wild-type (C–E) or mutant (F–H) nerve sections, showing ER tubules (white arrows; confirmed as tubules by presence in adjacent sections) and sheets (white arrowheads). Note the longer ER sheet profiles and fewer ER tubules in the subperineurial (G) and wrapping glial cells (H) of mutant nerves. Asterisks show mitochondria; yellow arrowheads show glial plasma membrane, identified by its continuity. (I) ER sheet profile length in control and mutant glial cells from 3 wild-type and 4 mutant larvae. Top graphs represent all individual sheet profiles, with second and third quartiles and 5th and 95th percentiles; bottom graphs show averaged larval values, showing mean ±SEM. Two-way ANOVA showed a significant effect of genotype (p<0.002) but not glial class (p>0.3) on ER sheet length, with no interaction between factors (p>0.3). (J,K) Sketches of wild-type (J) and mutant (K) wrapping glial cells, showing excess processes in the triple mutant. Asterisks indicate completely wrapped one-axon or two-axon fascicles, rarely seen in wild-type nerve sections. More examples of each phenotype are in Figure 8—figure supplement 1. (L–M) Quantification of wrapping glial membrane profile length per nerve cross-section (L) and percentage of axons that are wrapped individually or as two-axon fascicles (M) in wild-type and mutant nerve sections (mean ±SEM). ns, p>0.05; *p<0.05; ***p<0.001; ****p<0.0001. Mann-Whitney U test (I), top graphs); two-tailed Student’s t-test (I), bottom graphs; L, M,). Scale bars, 1 µm.
Figure 8—figure supplement 1
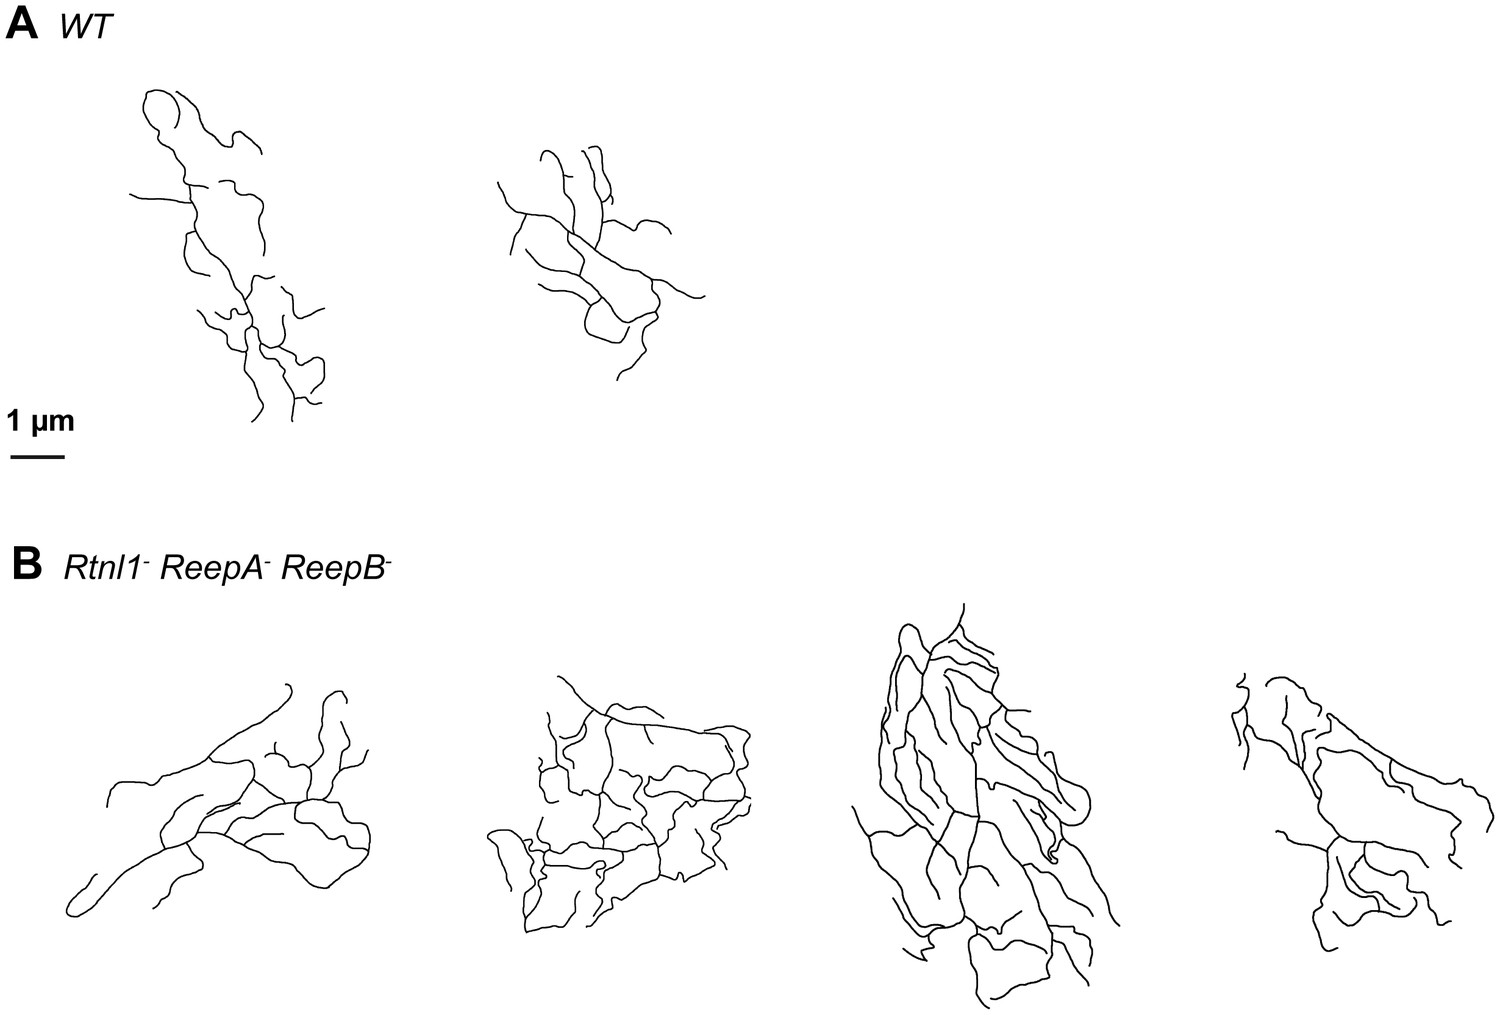
Sketches of wrapping glia in wild-type (ReepA+) and Rtnl1− ReepA− ReepB− mutant peripheral nerves, similar to those in Figure 8J,K.
Sketches of wild-type (ReepA+, upper) and mutant (lower) wrapping glial cells were abstracted from cross-sections of peripheral nerves. Excess formation of processes were observed in triple mutants.
Videos
Video 1
Representative time-lapse microscopy of FRAP analysis in wild-type axons.
Wild-type (WT) axons expressing CG9186::GFP under control of m12-GAL4 were photobleached as described in Figure 5A. The video shows 2 s of pre-bleach images and 200 s of post-bleach images at one frame every 5 s. The bleached area is shown with a rectangle in the bleaching frame.
Video 2
Representative time-lapse microscopy of FRAP analysis in Rtnl1− ReepA− ReepB− triple mutant axons.
Rtnl1− ReepA− ReepB− triple mutant axons expressing CG9186::GFP were photobleached and imaged as in Video 1, in a region immediately distal to a gap (between white arrows) in ER labeling in one axon.
Video 3
FRAP analysis in Rtnl1− ReepA− ReepB− triple mutant axons showing a CG9186::GFP labeled particle passing retrogradely across the gap region.
Rtnl1− ReepA− ReepB− triple mutant axons expressing CG9186::GFP were photobleached and imaged immediately distal to an ER gap as in Video 2. A labeled particle (white arrow) can be seen moving retrogradely across the ER gap (white arrowhead).
Video 4
FRAP analysis in Rtnl1− ReepA− ReepB− triple mutant axons showing dynamic ER gap generation.
Rtnl1− ReepA− ReepB− triple mutant axons expressing CG9186::GFP were photobleached and imaged immediately distal to an ER gap as in Video 2. Anterograde movement of a 5 µm length of ER simultaneously closes up a gap distal to it (first white arrow) and opens up a new gap (second white arrow) proximal to it. A kymograph from this preparation is shown in Figure 5—figure supplement 1C.
Video 5
Serial EM sections of a wild-type peripheral nerve, showing continuity of tubular membrane structures through multiple sections.
The sixth section in the series is shown in Figure 7A (left). ER tubules were identified as darkly stained structures present for multiple sections. See Figure 7A for annotations.
Video 6
Serial EM sections of a sheet-like ER structure in a wild-type axon, shown in Figure 7H.
Arrows indicate short ER sheets and associated cisternae, present across multiple sections. Note that these structures usually appear continuous with tubules in adjacent sections.
Video 7
Serial EM sections of a Rtnl1− ReepA− ReepB− peripheral nerve showing continuity of tubular membrane structures through multiple sections.
The sixth section in the series is shown in Figure 7A (right). ER tubules were identified as darkly stained structures present for multiple sections. See Figure 7A for annotations.
Video 8
Serial EM sections of a wild-type axonal swelling shown in Figure 7I.
An axon with a swelling is highlighted in the first frame. Sections show accumulated mitochondria, vesicles, and a large clear cisterna, as labeled in Figure 7I.
Video 9
Serial EM sections of a 4.5 µm segment of a Rtnl1− ReepA− ReepB− mutant axon with disrupted continuity of ER, used for 3D reconstruction in Figure 7K.
An axon with gaps in its ER network is highlighted in the first frame. Continuous ER tubules were identified as the presence of signals at the same position for three or more sections. Given the varying brightness and contrast of EM sections, faint staining that coincided with a tubule signal in adjacent sections was also considered as an ER tubule. Complete loss of ER tubules from three or more sections was defined as a gap.
Additional files
-
Supplementary file 1
Relative rates of evolutionary divergence of different Drosophila Reep proteins, shown by BLASTP searches.
BLASTP searches of Refseq proteins, using different Drosophila melanogaster Reep protein sequences as queries, show that CG42678 (ReepA) and CG8331 (ReepB) are diverging more slowly than CG4960, CG5539, CG11697, and CG30177, as measured by the change in E value across phylogenetic distance. Each sheet shows the hundred most similar sequences found in each BLASTP search. Hits in D. melanogaster, including the most closely related paralogs, are highlighted in yellow.
- https://doi.org/10.7554/eLife.23882.024
-
Supplementary file 2
Interactive 3D reconstruction of axonal ER from a 4.5 µm segment of a wild-type axon shown in Figure 7F (left).
Reconstruction is generated from 75 serial 60 nm sections, and shows ER (green), a mitochondrion (magenta), and plasma membrane (gray).
- https://doi.org/10.7554/eLife.23882.025
-
Supplementary file 3
Interactive three-dimensional reconstruction of axonal ER from a Rtnl1− ReepA− ReepB− mutant axon shown in Figure 7F (right).
Reconstruction is generated from 75 serial 60 nm sections, and shows ER (green), a mitochondrion (magenta), and plasma membrane (gray).
- https://doi.org/10.7554/eLife.23882.026
-
Supplementary file 4
Interactive 3D reconstruction of a 4.5 µm segment of a Rtnl1− ReepA− ReepB− mutant axon with disrupted continuity of ER, shown in Figure 7K.
The reconstruction was generated from 75 serial sections of 60 nm each. ER is in green and the plasma membrane in gray.
- https://doi.org/10.7554/eLife.23882.027
-
Supplementary file 5
Primers used for genotyping, ReepA and ReepB mutant screening and P[acman] C-terminal tagging.
For P[acman] tagging primers, upper case represents sequence hybridising to the gene of interest while lower case represents tagging sequence.
- https://doi.org/10.7554/eLife.23882.028
Download links
A two-part list of links to download the article, or parts of the article, in various formats.
Downloads (link to download the article as PDF)
Open citations (links to open the citations from this article in various online reference manager services)
Cite this article (links to download the citations from this article in formats compatible with various reference manager tools)
Modeling of axonal endoplasmic reticulum network by spastic paraplegia proteins
eLife 6:e23882.
https://doi.org/10.7554/eLife.23882


