Crystal structure and dynamics of a lipid-induced potential desensitized-state of a pentameric ligand-gated channel
- School of Medicine, Case Western Reserve University, United States
Figures
Figure 1 with 2 supplements

DHA modulation of GLIC function.
(A) A minimal gating scheme showing three fundamental conformational states that constitute pLGIC function: a resting state [C], a transient open-state [O], and a desensitized state [D]. Agonist-binding shifts the equilibrium towards the high-affinity D state such that under steady-state conditions, the channels are predominantly in the desensitized state. Allosteric modulators exert their effect by altering the transition, and hence the equilibrium, between the three states. (B) The trace shows a continuous recording of GLIC currents in oocytes measured by two electrode voltage-clamp (TEVC) in response to multiple pH-4.5 pulses. The pH-pulses were interspaced by perfusion with the pH 7.4 solution (for deactivation and recovery). Currents were measured in the absence (marked by red lines) or presence of 50 μM DHA (marked by red and blue lines). The baseline is marked as a dotted black line. DHA inhibits GLIC currents by increasing desensitization (faster current decay and lower steady-state currents; highlighted by the vertical blue arrow and dotted blue/red lines). The effect of DHA on the current decay was fully reversible, as seen in the second and fourth pH-pulses. (C) A plot of the ratio of steady-state (measured at t = 2.2 min) over the peak current amplitude for the two conditions (n = 12) with s.d shown as error bars.
Figure 1—figure supplement 1
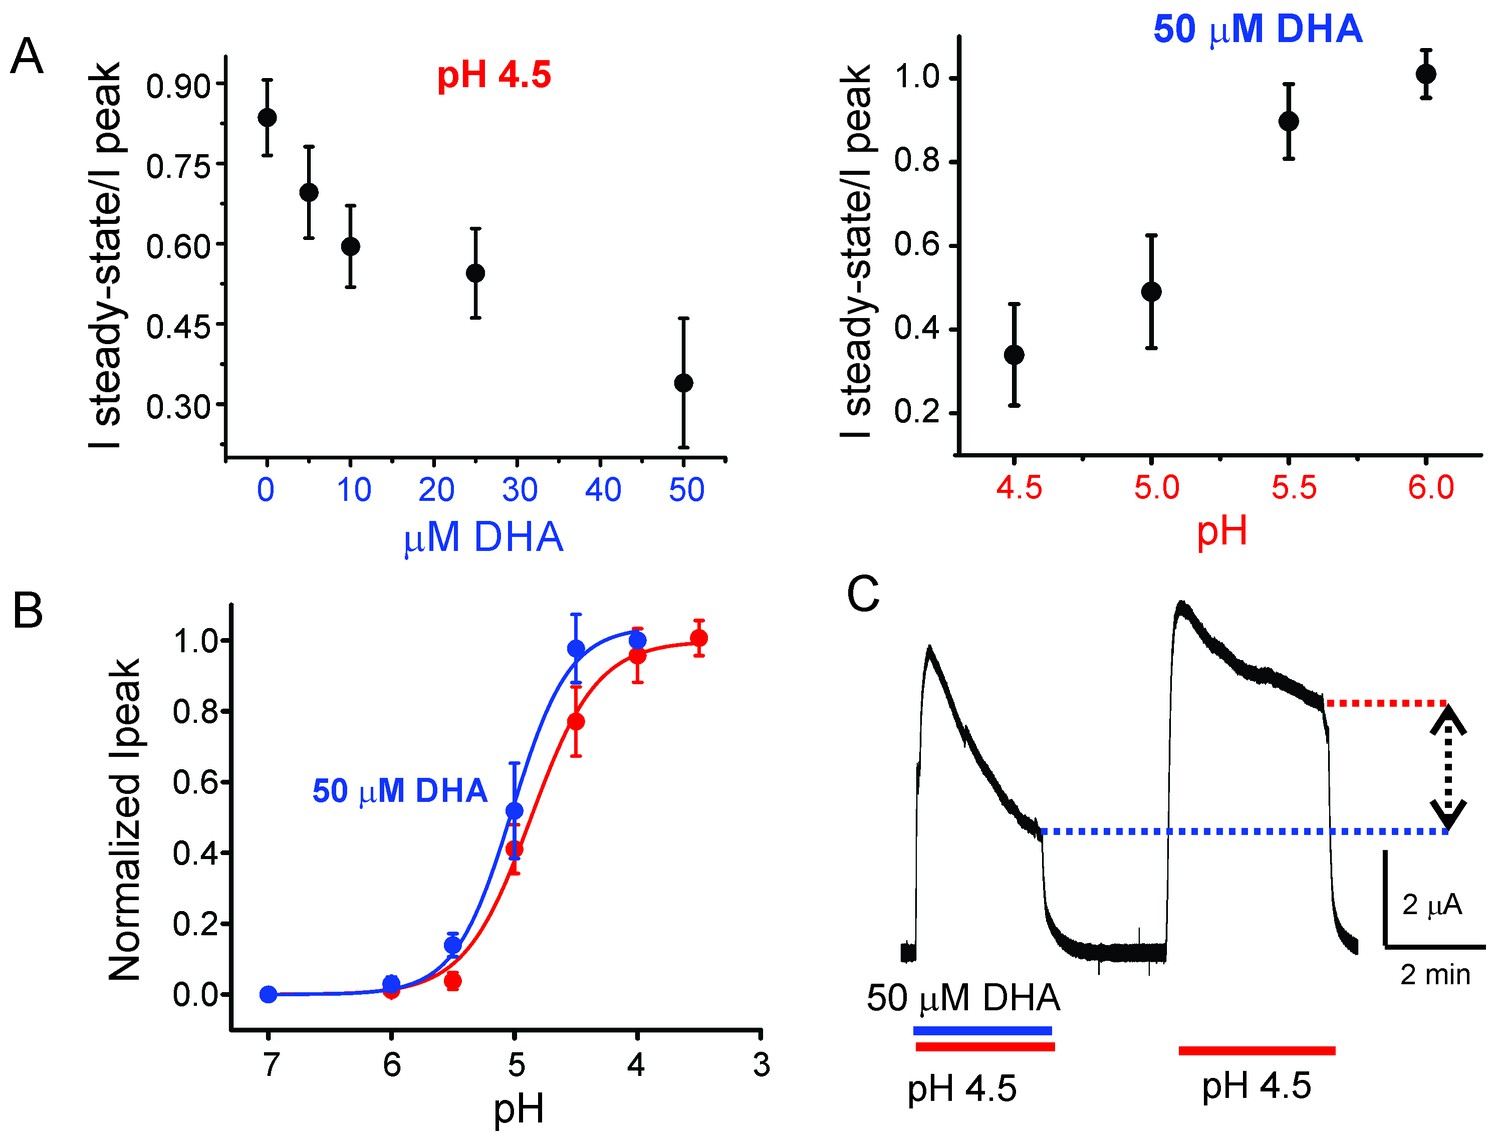
Effect of DHA on GLIC desensitization.
(A) The effect of DHA at various concentrations (left) on currents at pH 4.5 and the effect of 50 μM DHA on currents elicited by various extracellular pH (right). The currents were recorded by TEVC at a holding potential of −60 mV. In each case, a ratio of the steady-state current (measured at t = 4.5 min) to the peak amplitude was plotted. The error bars denote s.d (n = 6) (B) Normalized peak amplitudes in the presence (blue) and absence (red) of 50 μM DHA plotted as a function of pH, and the data were fitted with the Hill equation to yield pH504.87 ± 0.04 and nH1.6 ± 0.2 in the absence of DHA; pH505.02 ± 0.03 and nH1.9 ± 0.3 in the presence of DHA. The error bars denote s.d (n = 3) (C) Outward currents recorded at pH 4.5 and +60 mV holding potential in the presence and absence of 50 μM DHA. The dashed lines and arrow mark the level of steady-state currents under the two conditions.
Figure 1—figure supplement 2
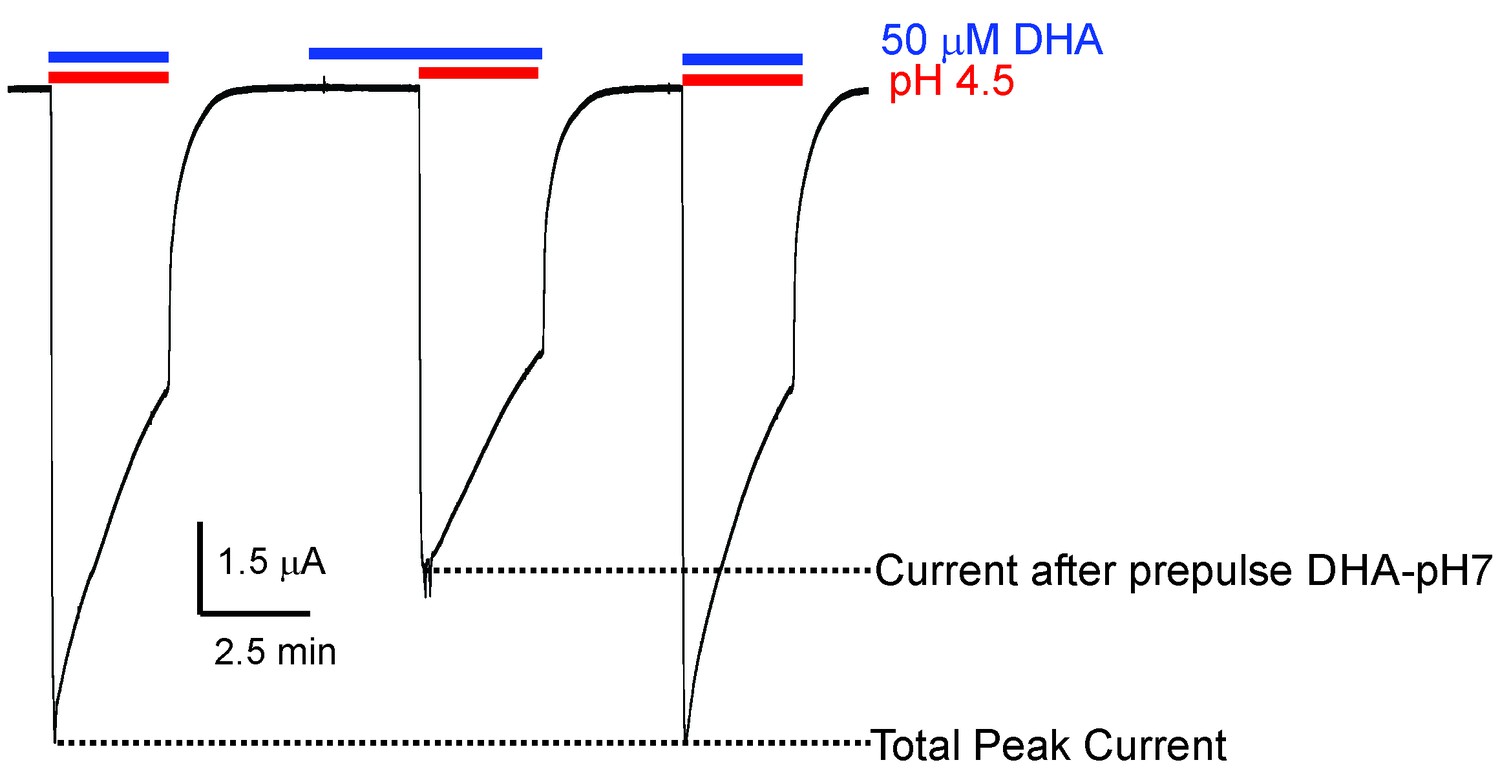
Effect of DHA-pre-application on GLIC currents.
Representative pH-elicited GLIC-currents recorded by TEVC at −60 mV membrane potential in response to pre-application of 50 μM DHA at pH 7.4 (2.2 min duration) (middle trace) and compared with currents recorded without DHA pre-application (first and third pulses). All the three pH 4.5-pulses had 50 μM DHA. The ratio of the peak-current amplitudes measured with and without pre-application of DHA was 0.64 ± 0.11 (n = 5).
Figure 2 with 1 supplement

DHA has no effect on the non-desensitizing GLIC I9′A/H11′F mutant.
(A) Normalized pH-response for GLIC-wt (red) and GLIC I9′A/H11′F double mutant (orange) at −60 mV. The error bars denote s.d and the curve is a fit to the Hill equation. GLIC-wt (pH50 4.87 ± 0.04 and nH 1.6 ± 0.2; n = 3) and GLIC I9′A/H11′F (pH50 5.17 ± 0.19 and nH 0.88 ± 0.29; n = 7). (B) Macroscopic currents measured by TEVC for GLIC I9′A/H11′F in response to pH jumps (from 7.4 to 4.5), at −60 mV holding potential, in the presence or absence of 50 μM DHA. (C) Currents recorded at pH 4.5 in the presence of either 50 μM DHA or 100 μM DHA.
Figure 2—figure supplement 1
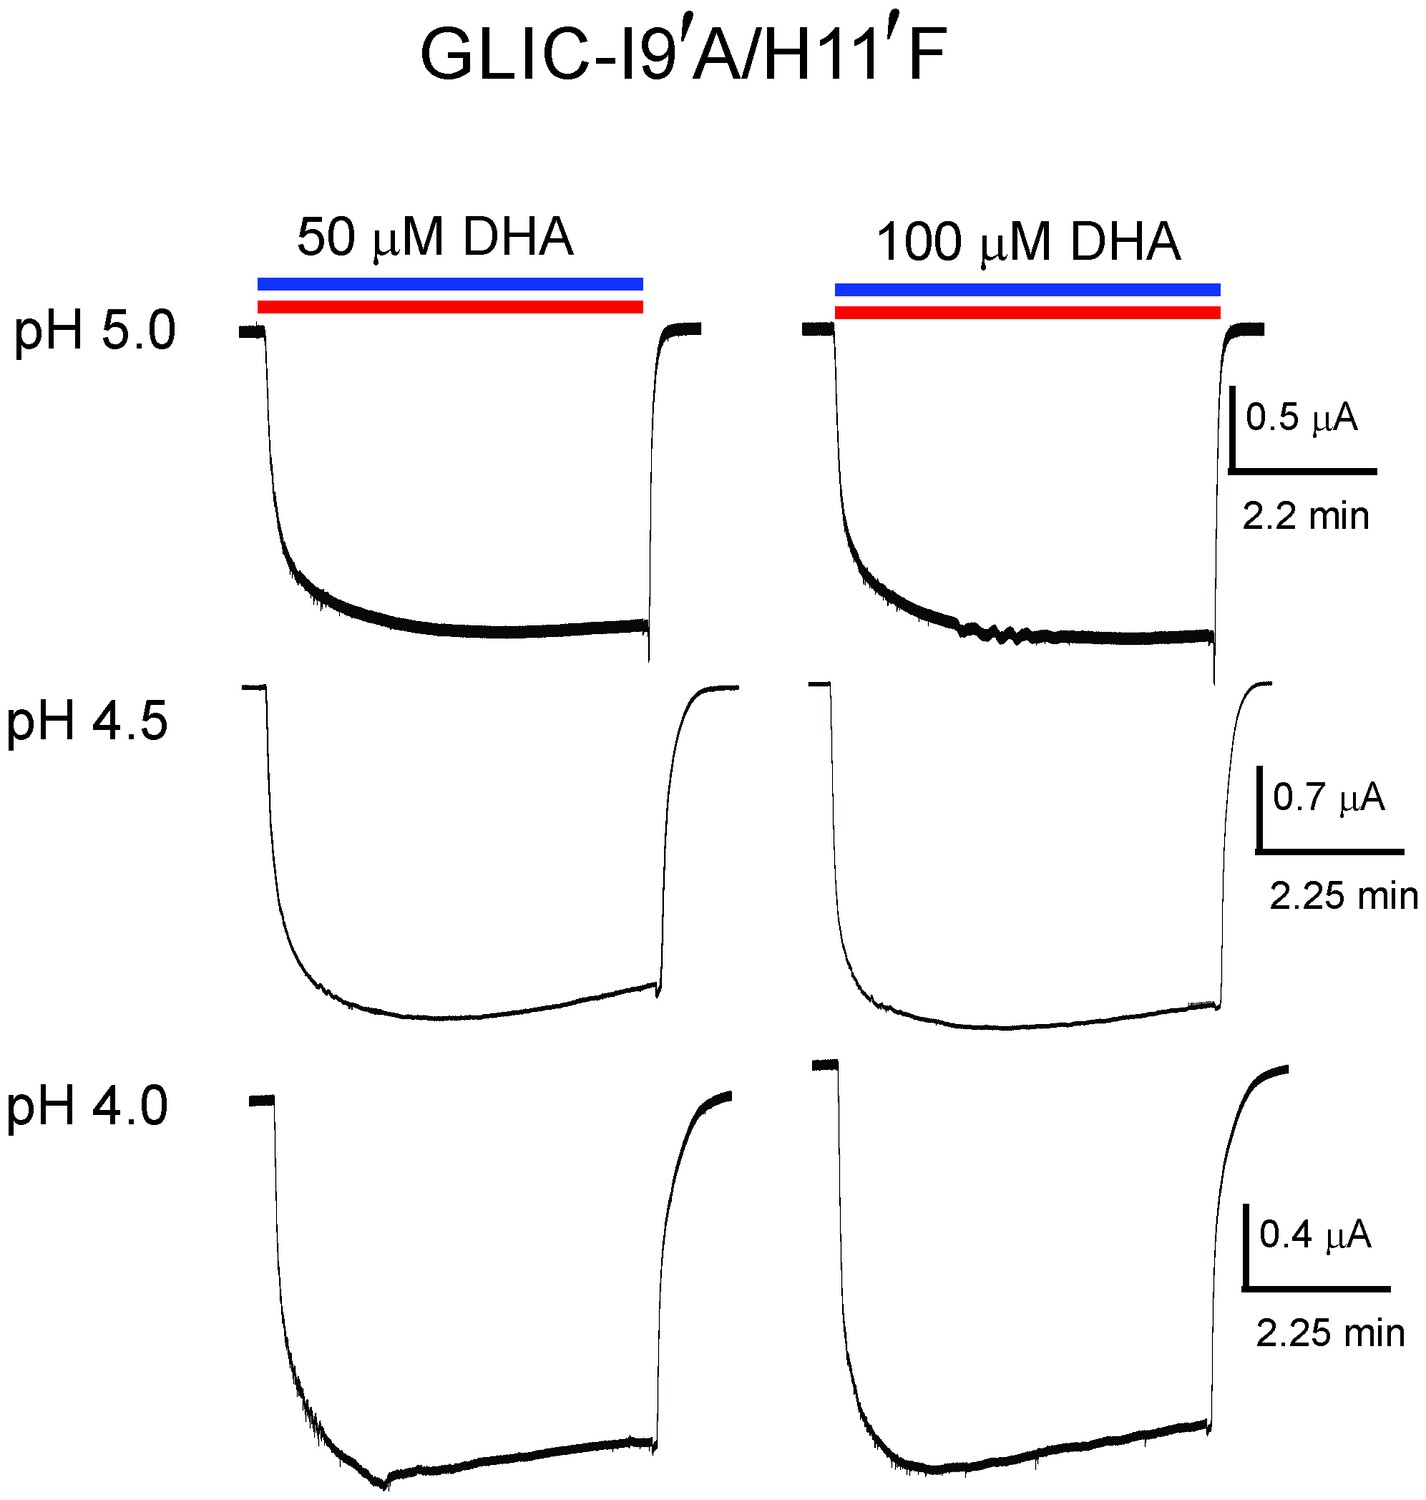
Lack of DHA effect on the non-desensitizing GLIC I9′A/H11′F mutant.
Macroscopic currents measured by TEVC for GLIC I9′A/H11′F in response to pH jumps (from 7.4 to the indicated pH value), at −60 mV holding potential, in the presence of either 50 μM DHA or 100 μM DHA.
Figure 3 with 3 supplements
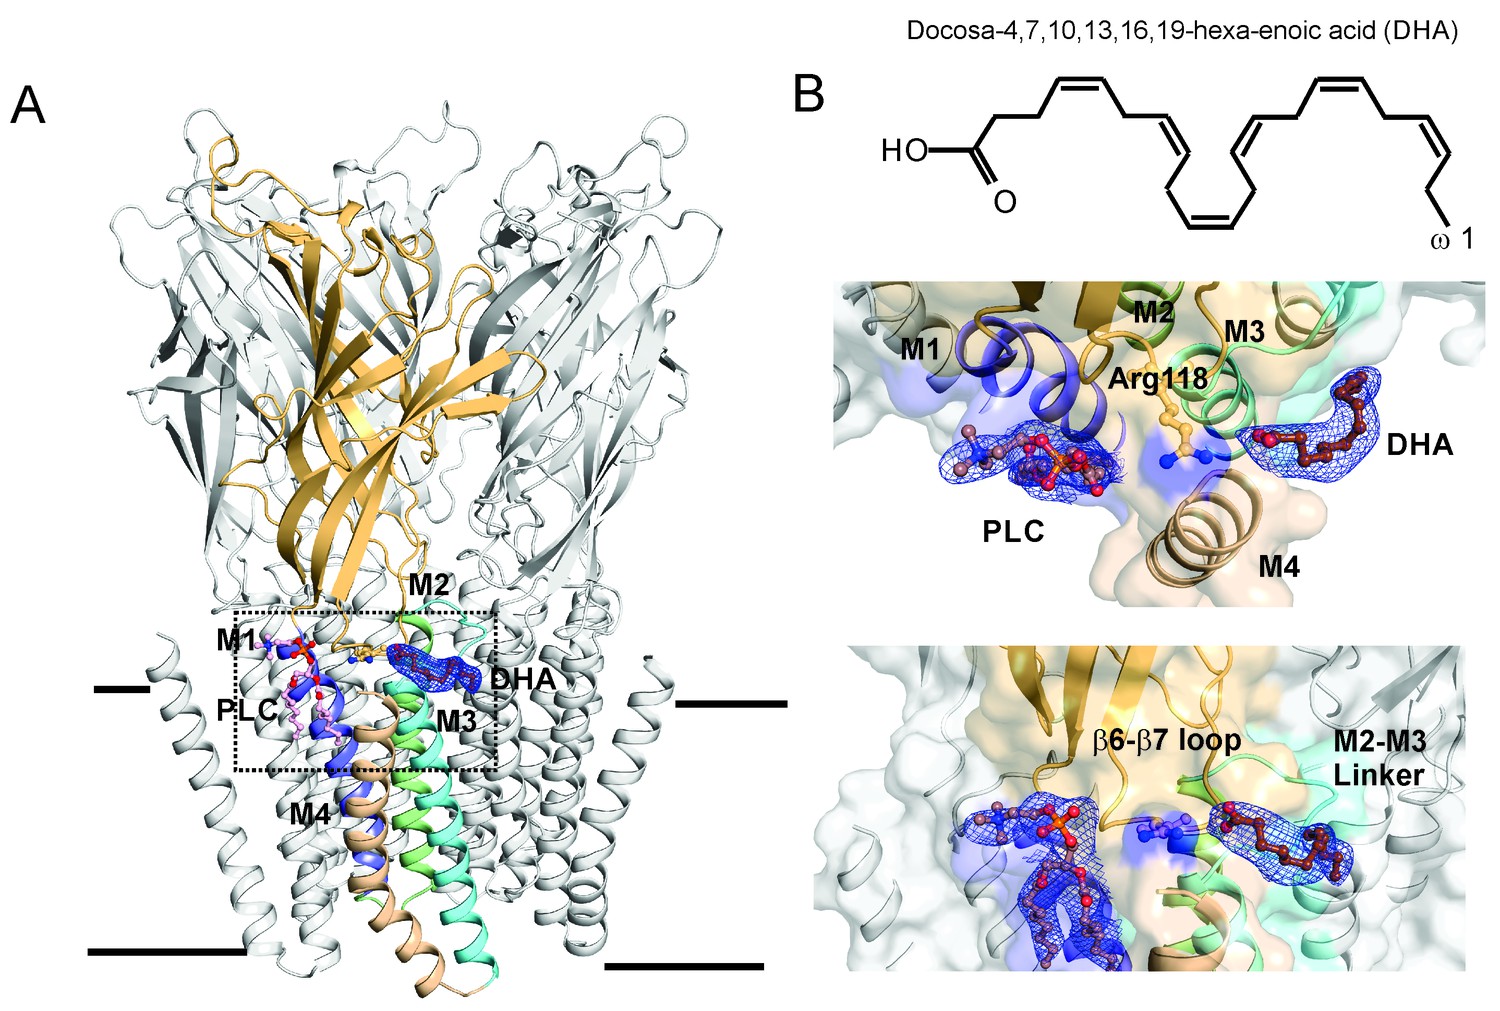
DHA binding site in GLIC.
(A) A side-view of the GLIC-pH4-DHA structure at pH 4.0 solved to 3.25 Å resolution with a bound DHA molecule shown in stick representation. Only one subunit is colored for clarity (The TM helices are colored as: M1-blue, M2-green, M3-cyan, and M4-wheat). The 2Fo-Fc electron density map for DHA, contoured at 1.0 σ-level, is shown as a blue mesh. The phospholipid molecule (PLC), shown in sticks, was also present in previously reported GLIC structures at acidic pH. (B) The chemical structure of the DHA molecule (top) and zoomed-in views of the region marked by the inset in panel A (bottom).
Figure 3—figure supplement 1
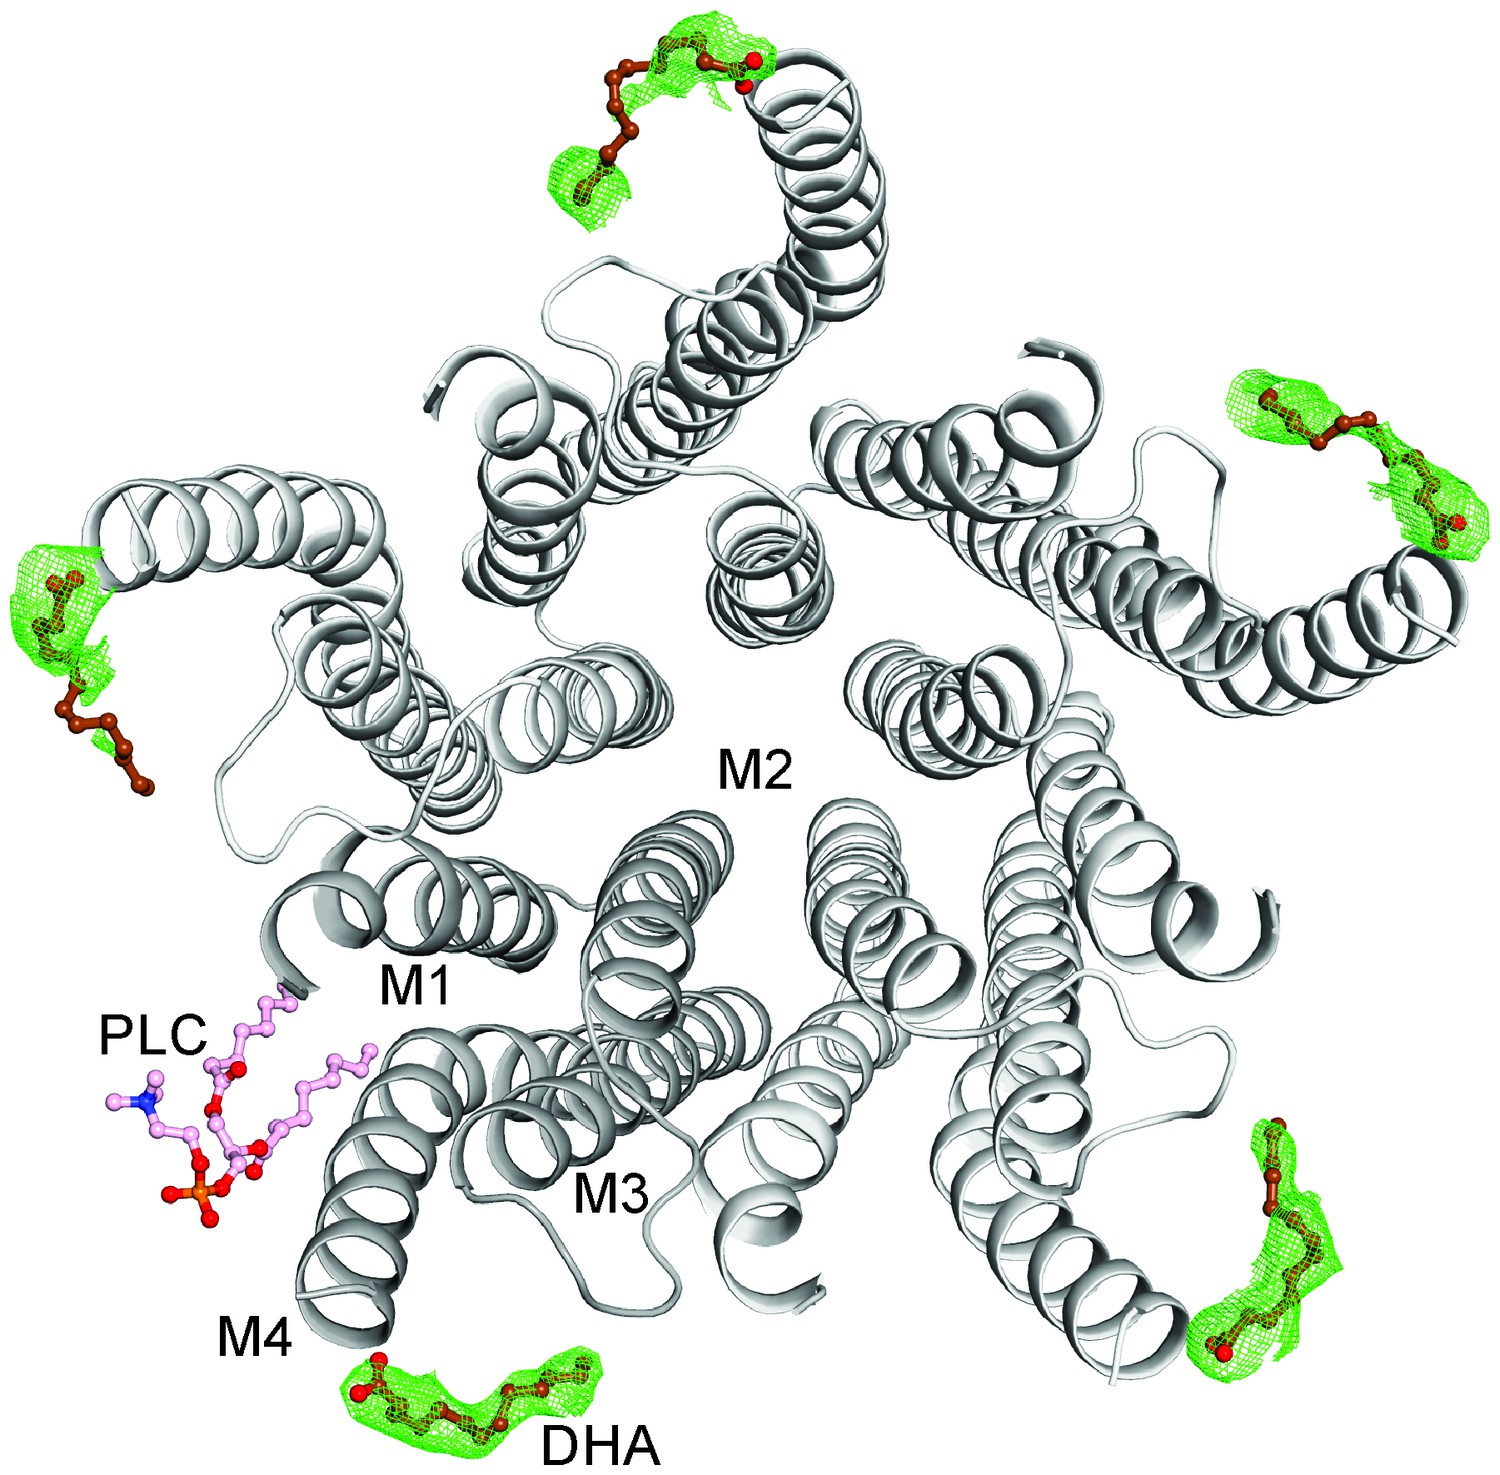
The DHA binding site.
The GLIC-pentamer viewed from the extracellular side, overlaid with the Fo-Fc ‘omit’ electron density map generated by excluding DHA molecules from structure factor calculations. The green mesh is contoured at 2.0 σ and DHA molecules are drawn as ball-and-sticks. Prominent electron density is visible for all the five subunits although the continuity was variable among subunits. The lipid molecule (PLC) is also shown in a ball-and-stick presentation. Clear density for the bound PLC was observed at only one subunit.
Figure 3—figure supplement 2
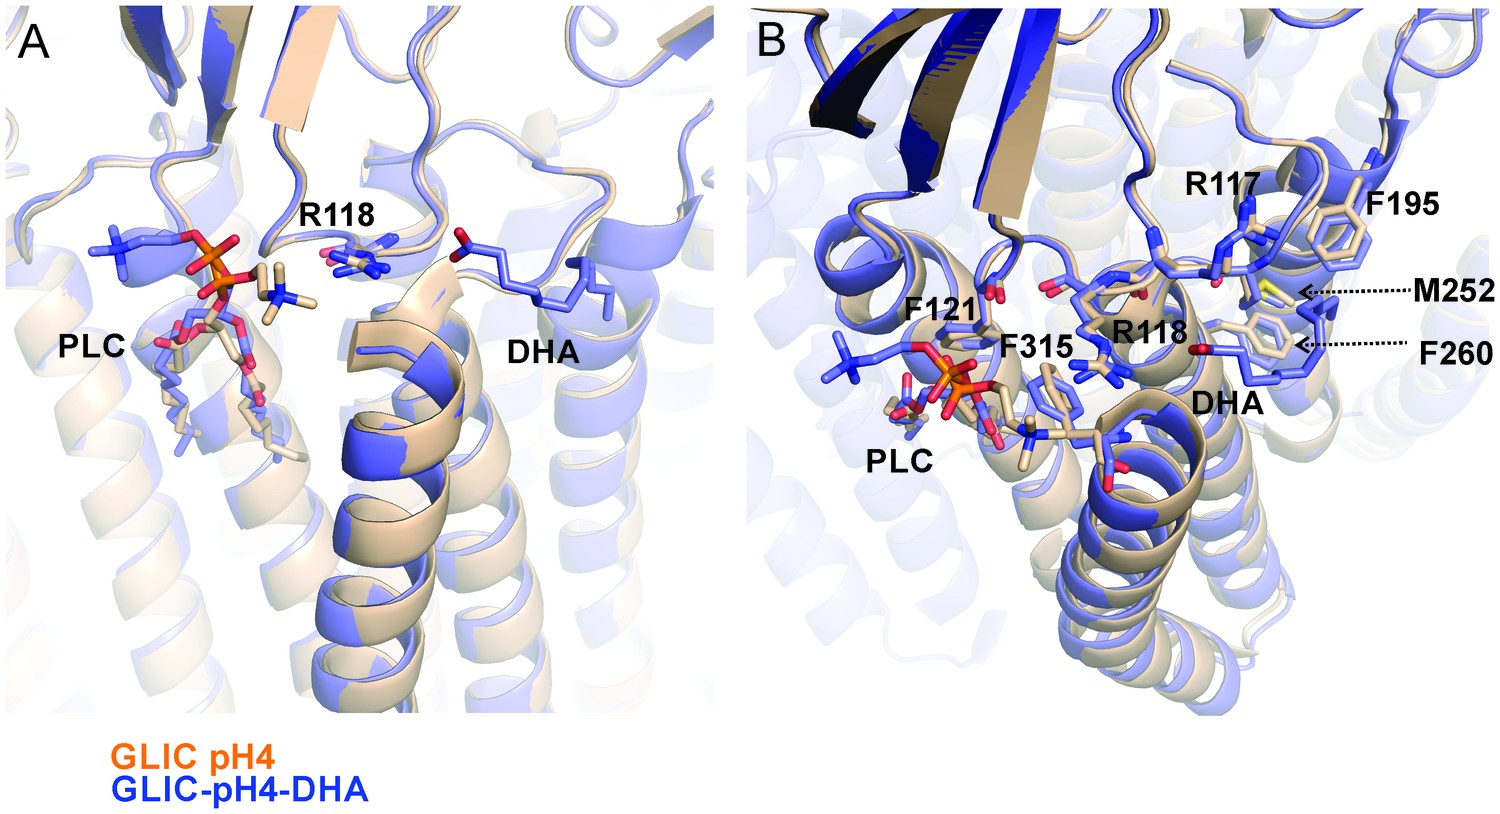
Reorientation of lipid molecule.
An alignment of GLIC-pH4 (PDB ID: 4HFI) (Sauguet et al., 2013) and GLIC-pH4-DHA structures shows that the lipid molecule (PLC) bound close to M4 is reoriented. (A) A side view of the DHA binding site is shown. (B) A top view of the DHA binding pocket. Small changes in side-chain orientation are seen for residues in the β6−β7 loop (Arg117, Arg118, and Phe121), the M2-M3 linker (Met252), M3 (Phe260), M4 (Phe315), and M1 from the adjacent subunit (Phe195).
Figure 3—figure supplement 3
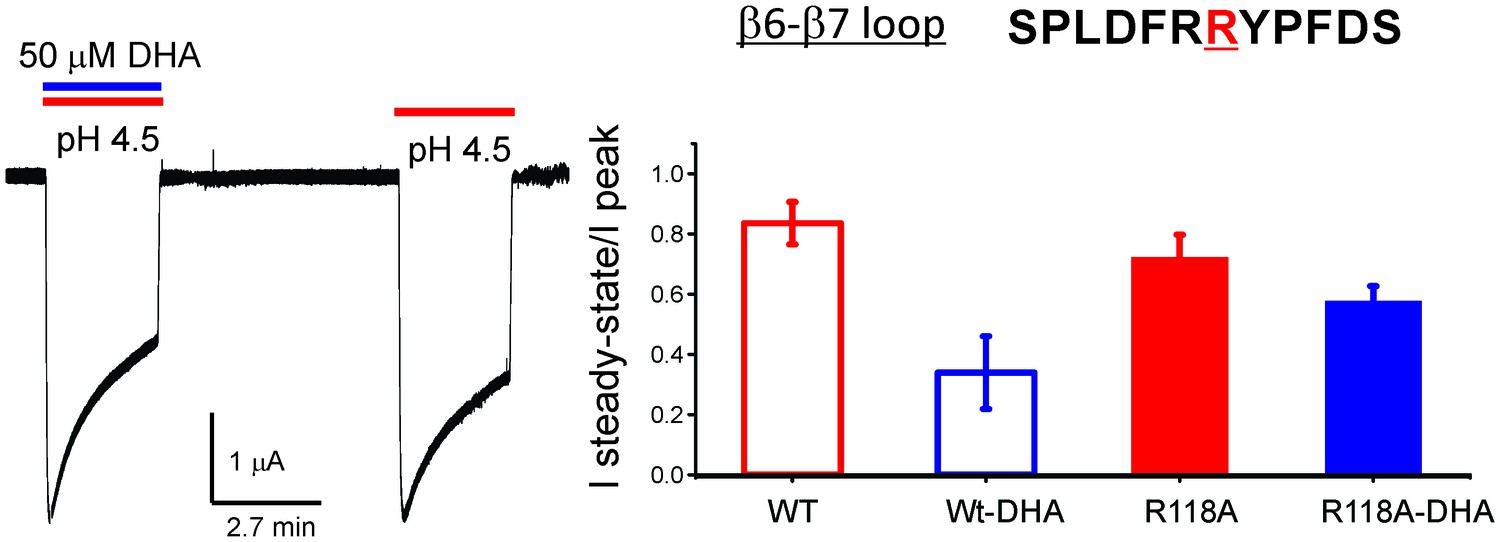
R118A mutation reduces the effect of DHA on desensitization.
Sequence for the β6−β7 loop is shown, and the position Arg118 is highlighted in red. Typical GLIC-R118A currents measured by TEVC in response to pH jumps (from 7.4 to 4.5), at −60 mV holding potential, in the presence or absence of 50 μM DHA (left). Ratio of the steady-state current (measured at 2.2 min) to the peak amplitude was plotted (n = 12 for GLIC wt and n = 7 for R118A) with s.d shown as error bars (right).
Figure 4 with 4 supplements
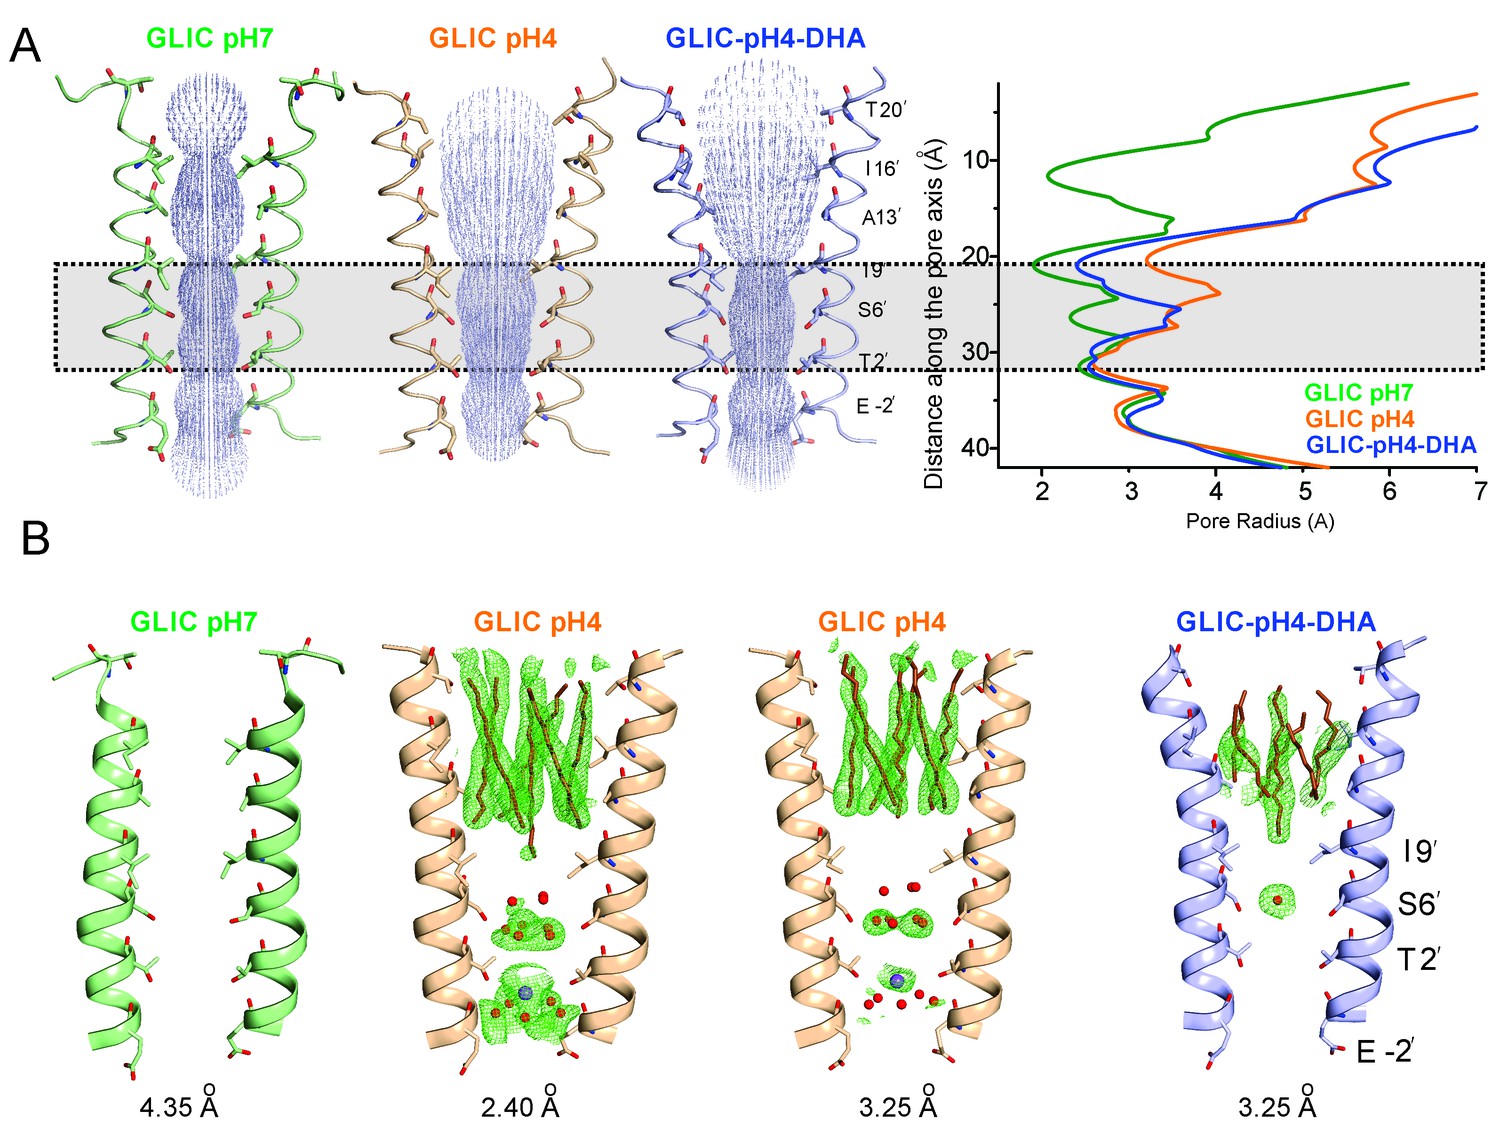
Conformational changes in the GLIC pore.
(A) The ion-permeation pathway through the channel pore, as determined by the MOLE PyMOL plugin (Petrek et al., 2007). The M2 from two subunits are shown using a ribbon representation, with residues lining the pore represented as sticks (left). Pore radius along the channel axis in GLIC structures at pH 7.0 (PDB ID: 4NPQ), pH 4.0 (PDB ID: 4HFI), and at pH 4.0 in the presence of DHA calculated using HOLE software (Petrek et al., 2007; Smart et al., 1996) (right). The constricted region from Ile9′ to Thr2′ is highlighted by a grey box. (B) Fo-Fc omit electron density of six dodecyl-maltoside molecules (shown in stick representation) and water pentagon (shown as red spheres) at 3.0 σ-level in M2 for different GLIC structures. The PDB ID for the structures are: GLIC-pH7: 4NPQ; GLIC-pH4: 4HFI; GLIC-pH4 (lower resolution): 3UU8. The resolution for each of the structures is indicated below.
Figure 4—figure supplement 1
M2 conformation in the GLIC-pH4-DHA structure.
Fo-Fc ‘omit’ electron density map (green mesh, contoured at 2.3 σ) for the M2 and M2-M3 linker (228-255) of the GLIC-pH4-DHA structure (shown in stick representation). Two non-adjacent opposed subunits are shown for clarity from the side and top views.
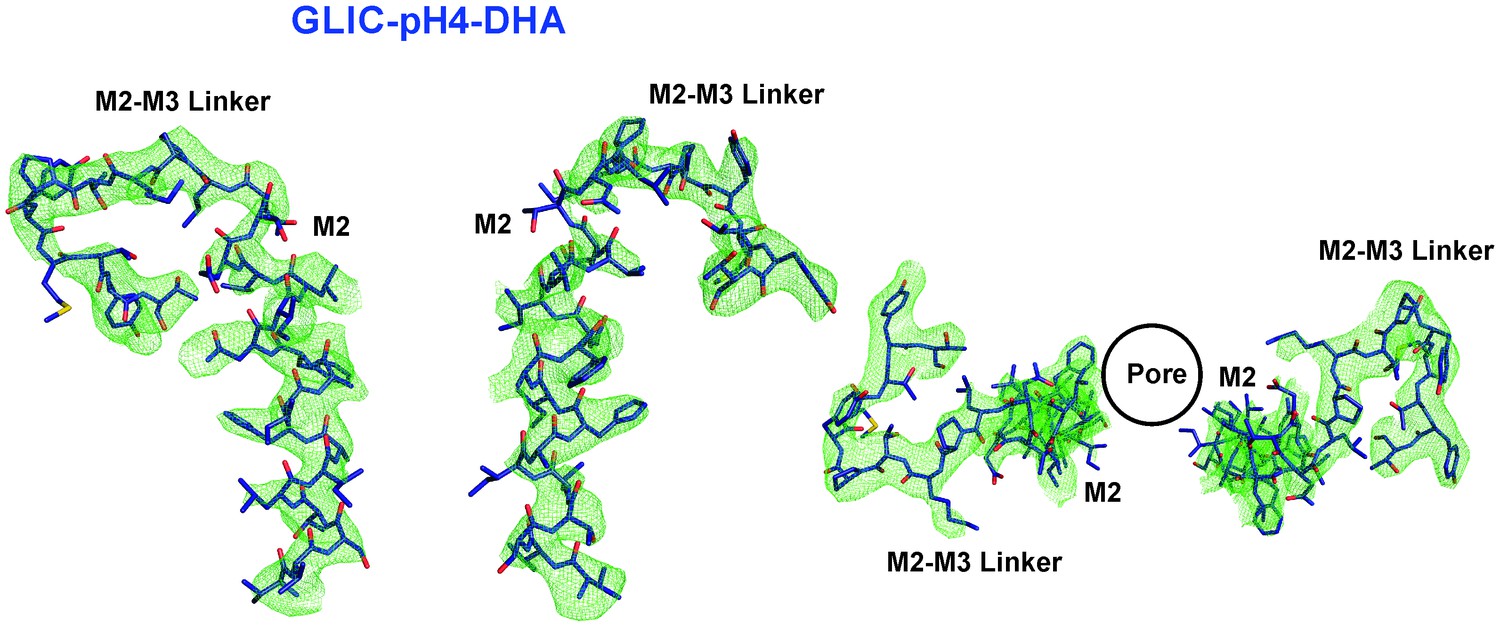
Figure 4—figure supplement 2
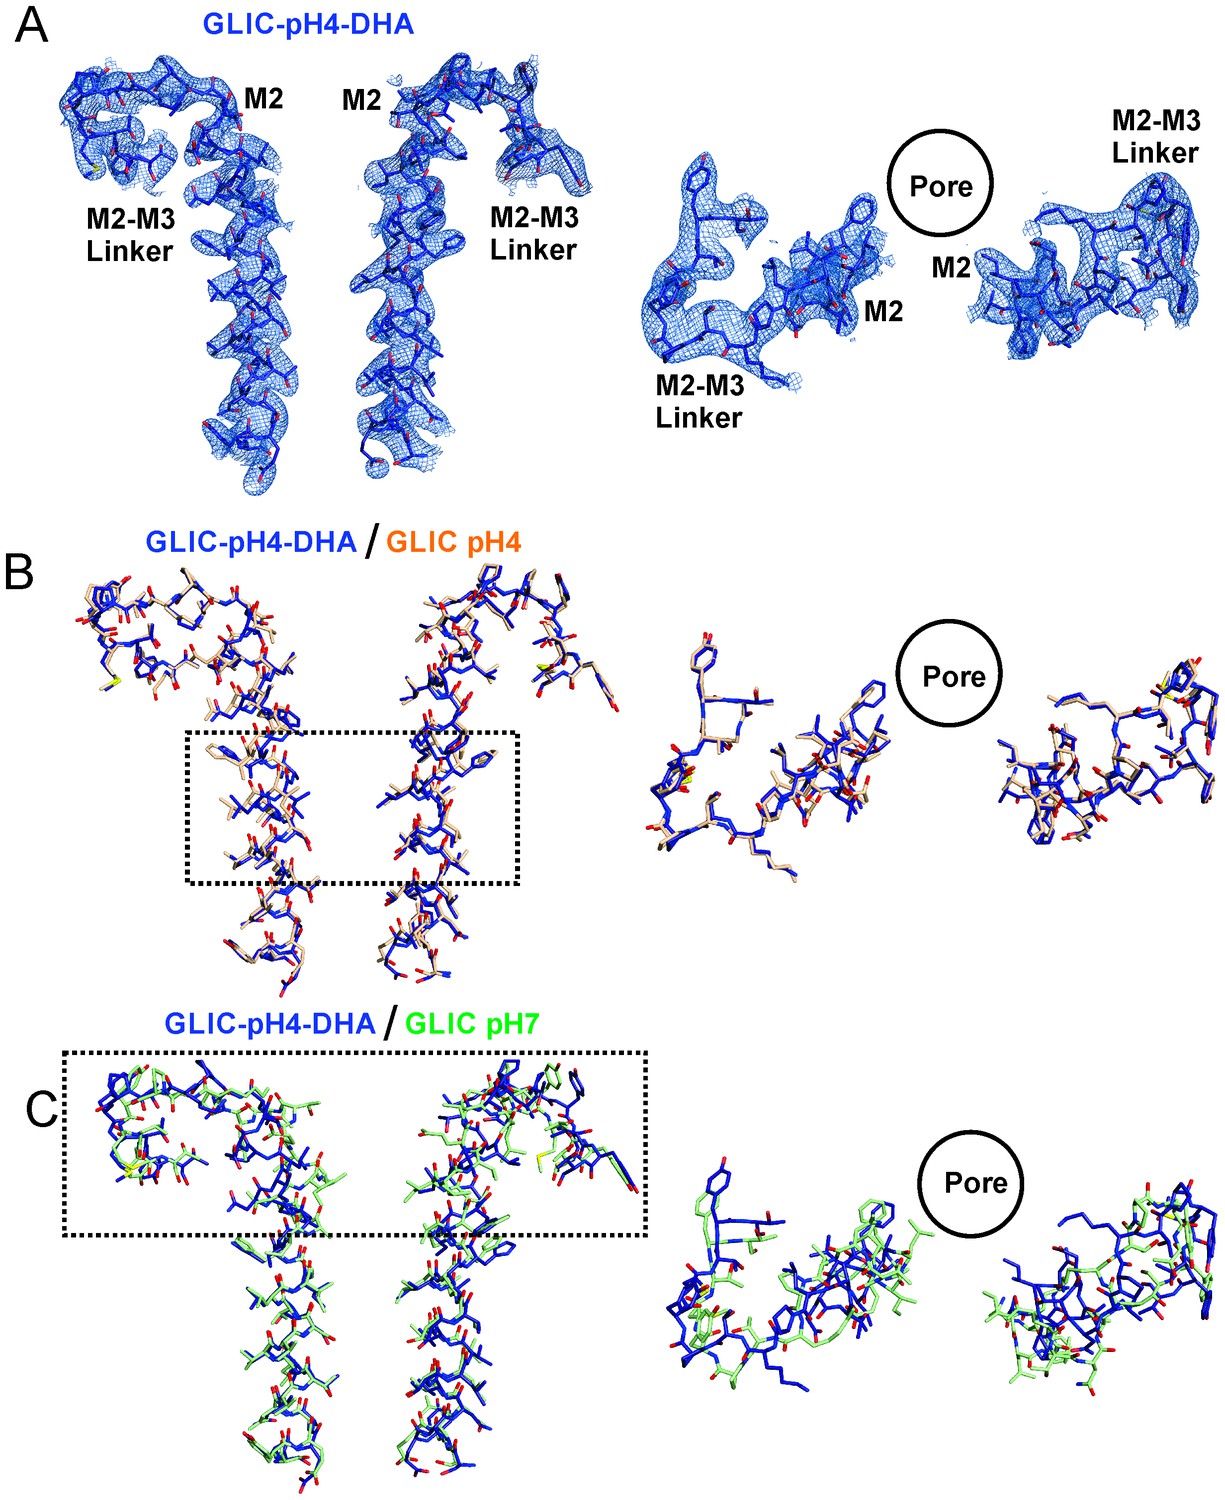
Conformational changes in the GLIC-pH4-DHA structure.
The 2Fo-Fc electron density map for the GLIC-pH4-DHA structure contoured at 1.5 σ-level and shown for two non-adjacent subunits. (A) Views of M2 and the M2-M3 linker parallel to the membrane (left) and from the extracellular end of the membrane (right) for the GLIC-pH4-DHA structure. (B) The GLIC-pH4-DHA structure aligned with the GLIC-pH4 structure (PDB ID: 4HFI) (Sauguet et al., 2013). (C) The GLIC-pH4-DHA structure aligned with the GLIC-pH7 structure (PDB ID: 4NPQ) (Sauguet et al., 2014).
Figure 4—figure supplement 3
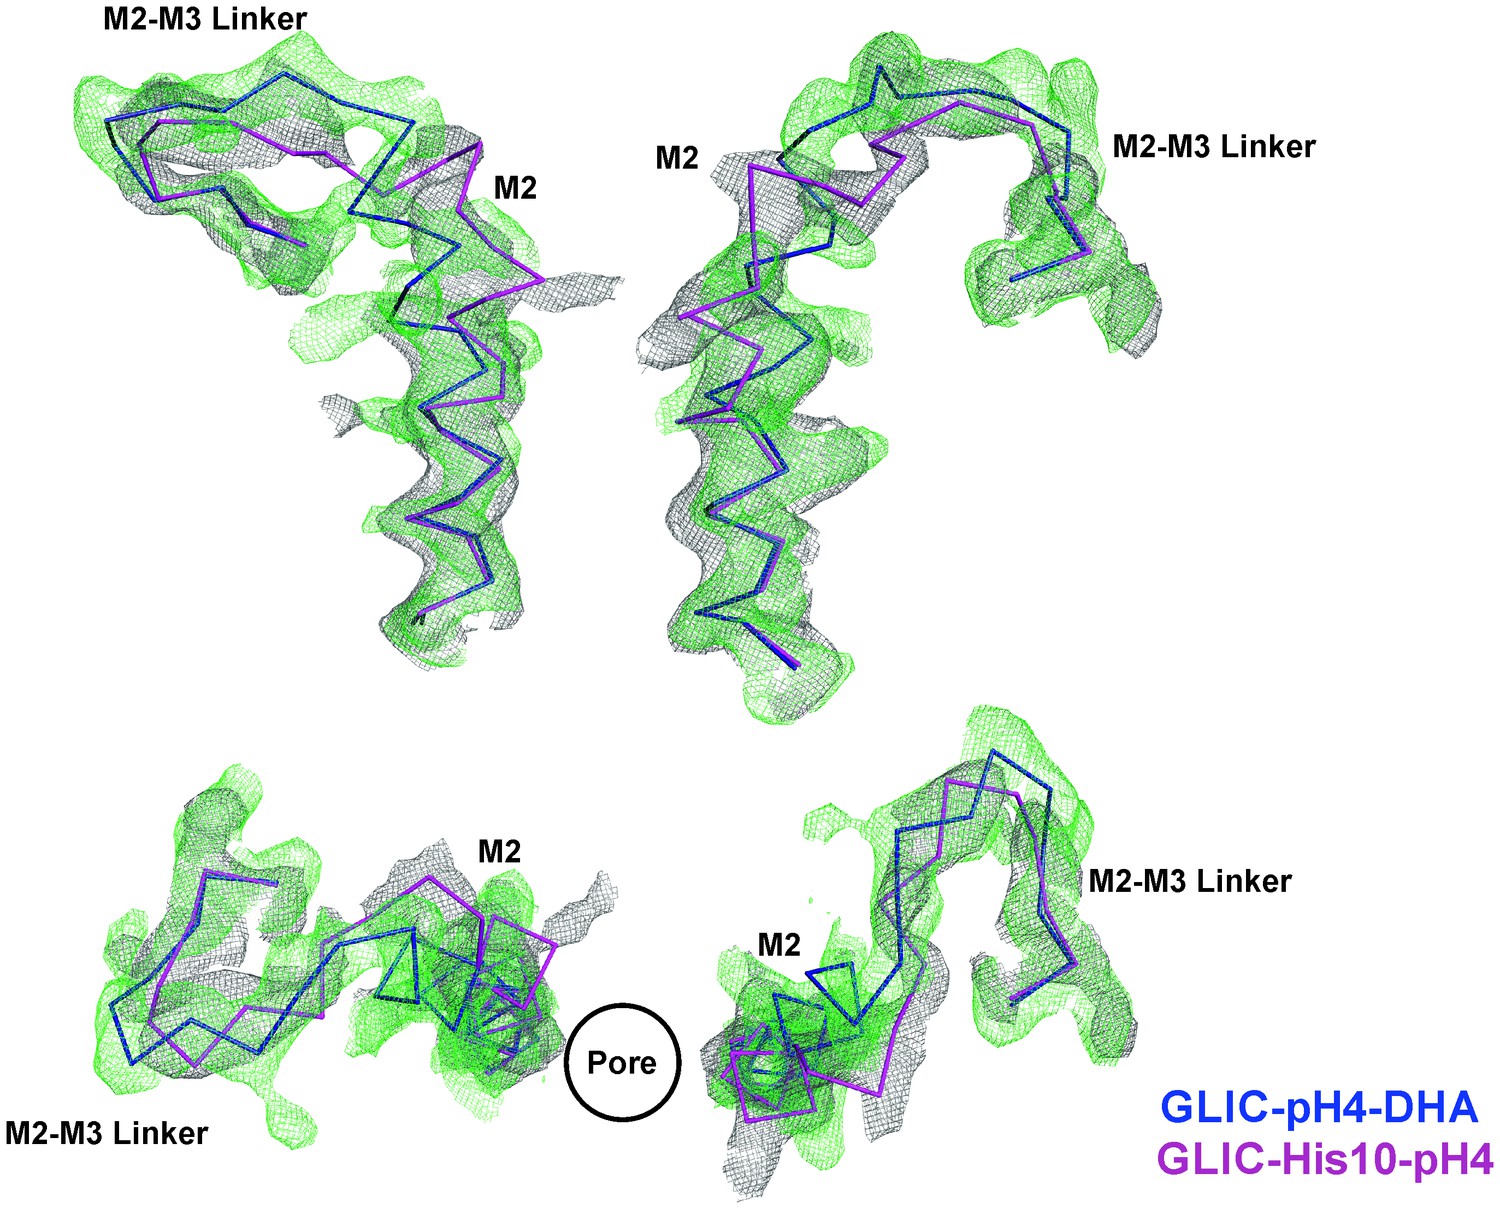
Comparison of Fo-Fc omit maps for the GLIC-pH4-DHA with that of the GLIC-His10-pH4 structure.
Fo-Fc ‘omit’ electron density map (green mesh, contoured at 2.4 σ) for the M2 and M2-M3 linker (228-255) of the GLIC-pH4-DHA structure (blue, ribbon representation) overlaid with the Fo-Fc map (grey mesh, contoured at 2.4 σ) for the M2 and M2-M3 linker (228-255) of the GLIC-His10-pH4 structure (PDB ID: 4NPP) (Sauguet et al., 2014) containing a mixture of locally-closed and open conformations. Magenta, ribbon representation shows the locally-closed conformation in 4NPP. Two non-adjacent subunits are shown for clarity from the side and top views.
Figure 4—figure supplement 4
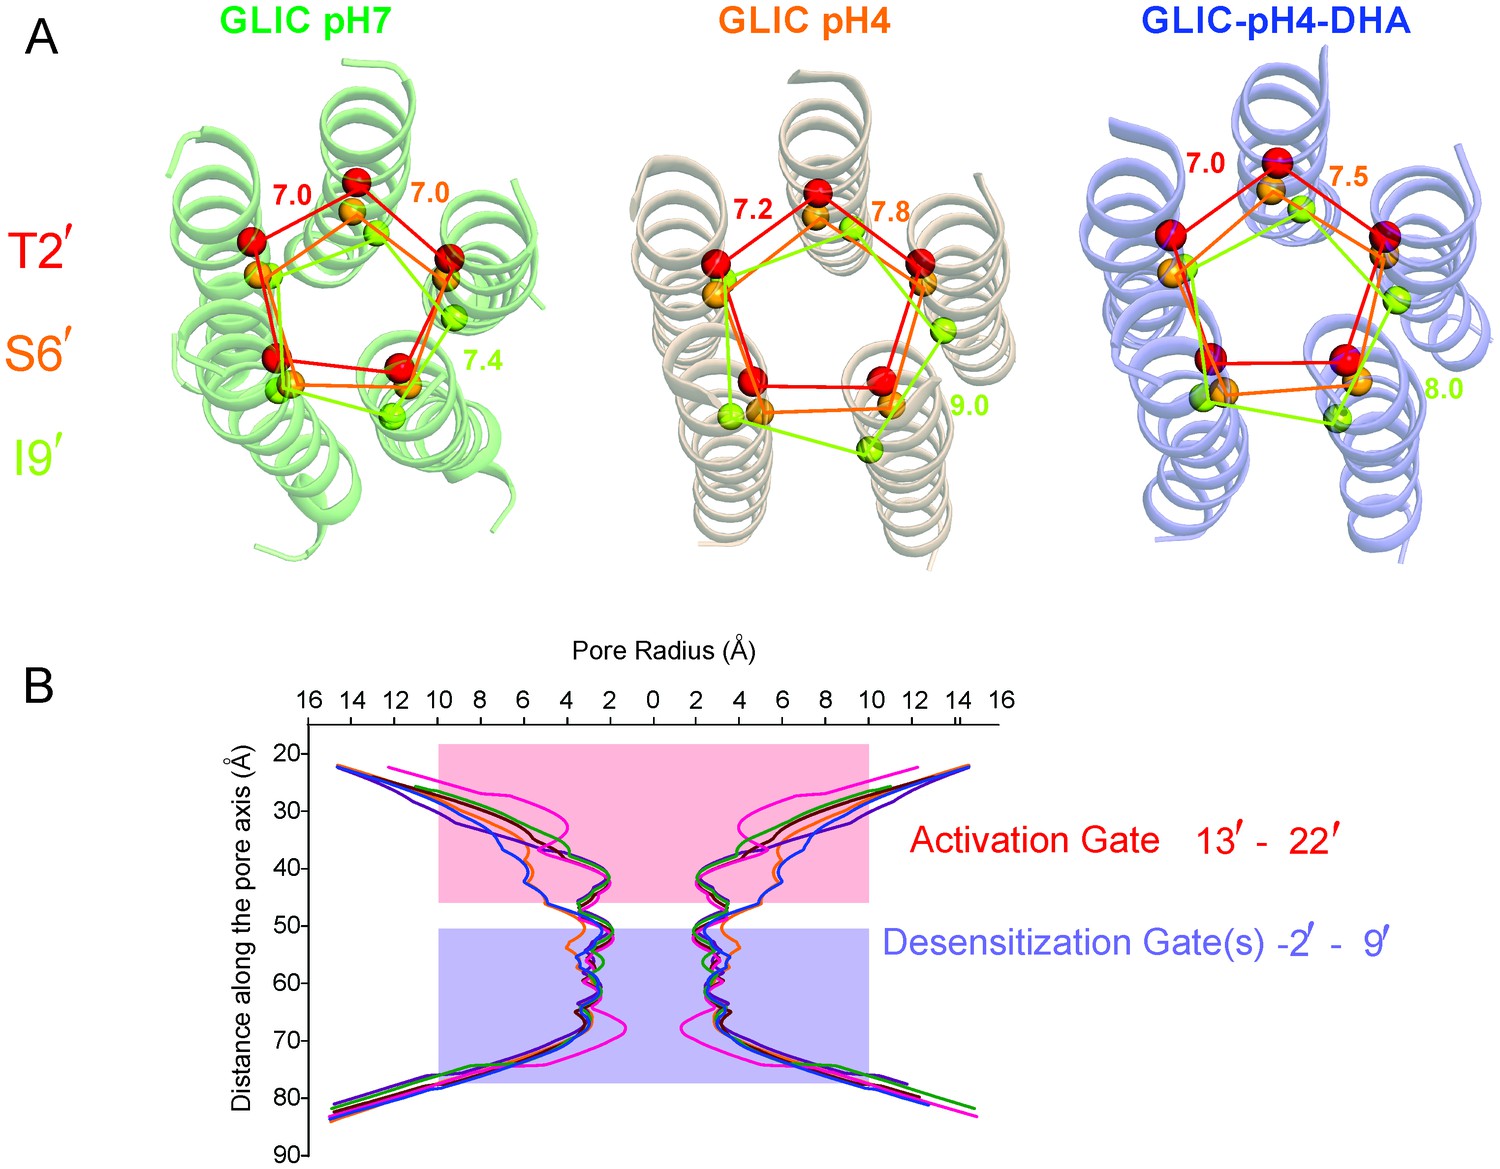
Pore conformations in GLIC structures.
(A) Cα-Cα distance for the residues lining the narrow constrictions in the GLIC-pH7, GLIC-pH4, and GLIC-pH4-DHA structures (B) Pore radius calculated using HOLE (Smart et al., 1996) for GLIC-pH7 (PDB ID: 4NPQ, green), GLIC-pH4 (PDB ID: 4HFI, orange), GLIC-pH4-DHA (blue), and various locally-closed GLIC structures (PDB ID: 3TLS, purple; PDB ID: 3TLT, wine; PDB ID: 3TLV, pink) (Prevost et al., 2012). Residues Leu22′- Ala13′ form narrow constrictions at the extracellular activation gate. The Ile9′ position and the residues below, through the intracellular end, contribute to the desensitization gate(s).
Figure 5 with 3 supplements
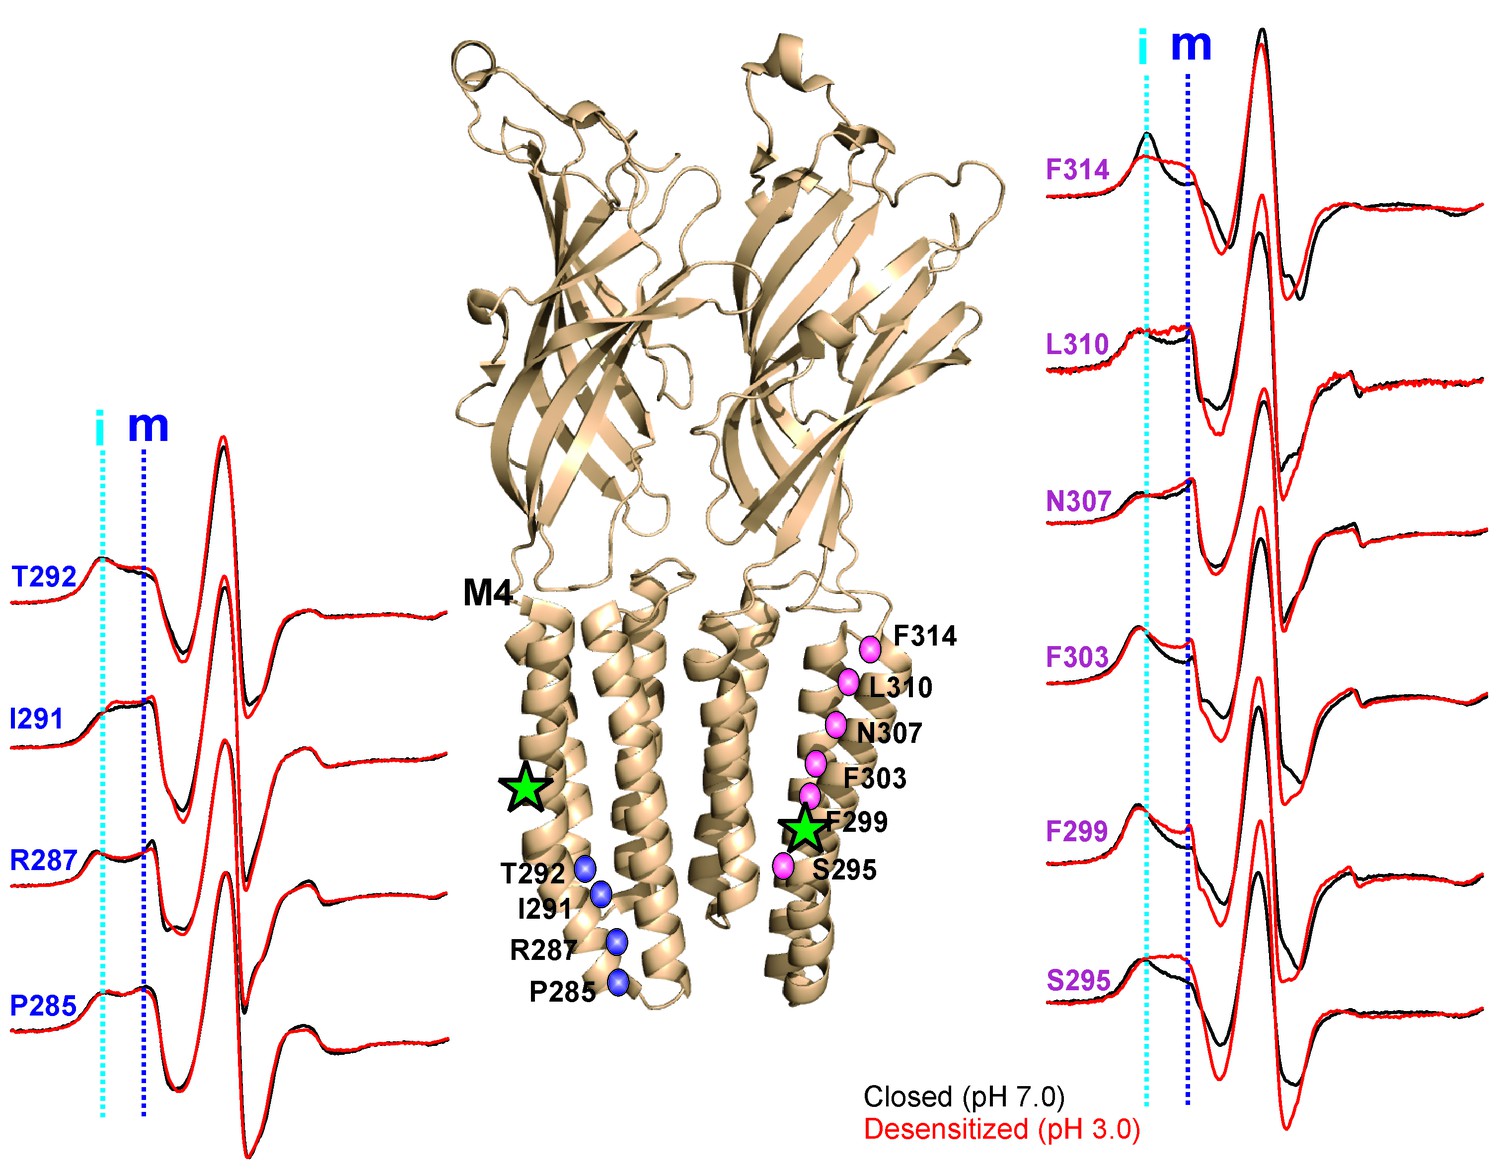
pH-dependent conformational changes in M4 for membrane-reconstituted GLIC.
Spin-normalized CW-EPR spectra for representative positions along M4 in the closed (black, pH 7.0) and desensitized (red, pH 3.0) states. Location of spin-labels are shown on the GLIC-pH4 structure (PDB ID: 4HFI). Only two subunits are shown for clarity. The position of Pro300, which introduces a kink in the helix, is marked by a green star. Positions close to and above Pro300 (295-298) show an increase in ΔHo−1 in the desensitized state (marked by magenta balls), while positions further below are essentially unchanged in the two conformations (marked by blue balls). Dotted lines marked as ‘i’ (cyan) and ‘m’ (dark blue) represent the immobile and mobile components of the spectra, respectively. The two components may arise from two different rotameric orientations of the spin-labels and/or from two conformational states of the protein in equilibrium.
Figure 5—figure supplement 1
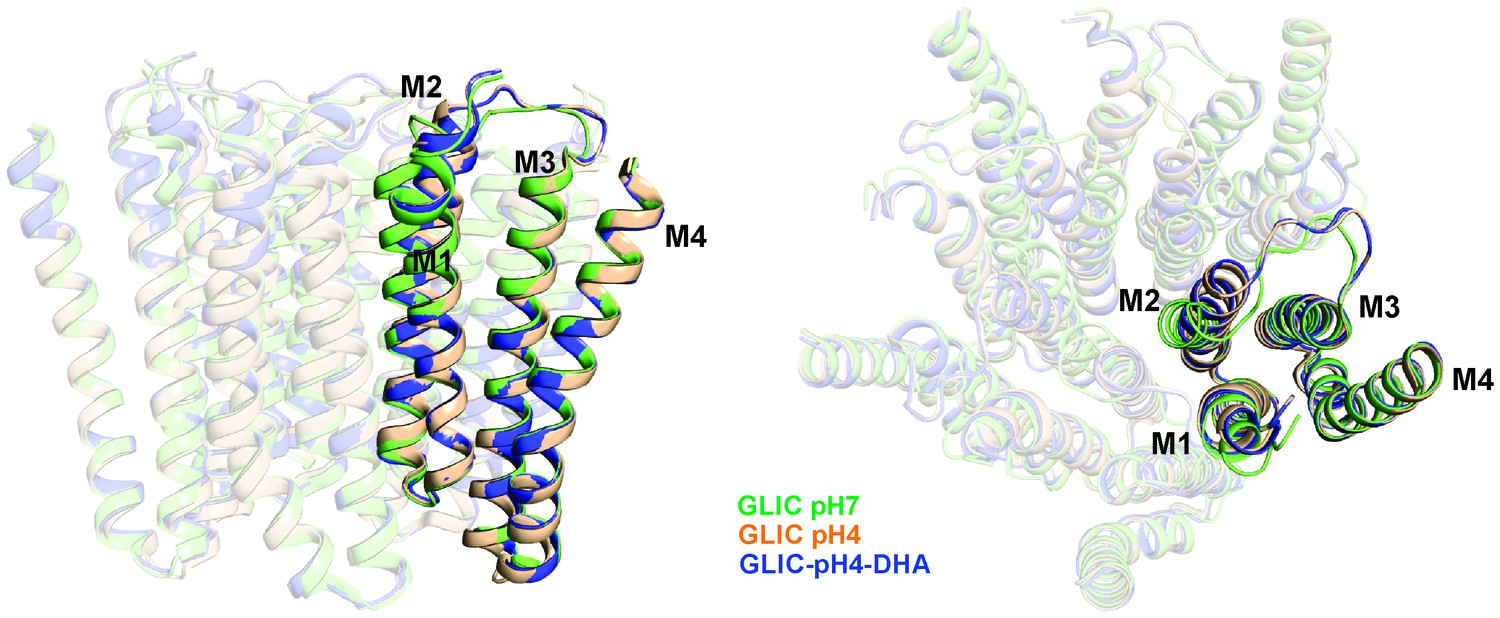
Alignment of GLIC transmembrane domains (TMD).
A superposition of GLIC-TMDs (GLIC-pH7, PDB ID: 4NPQ; GLIC-pH4, PDB ID: 4HFI; and GLIC-pH4-DHA) shows minimal conformational differences in the M4 segment.
Figure 5—figure supplement 2
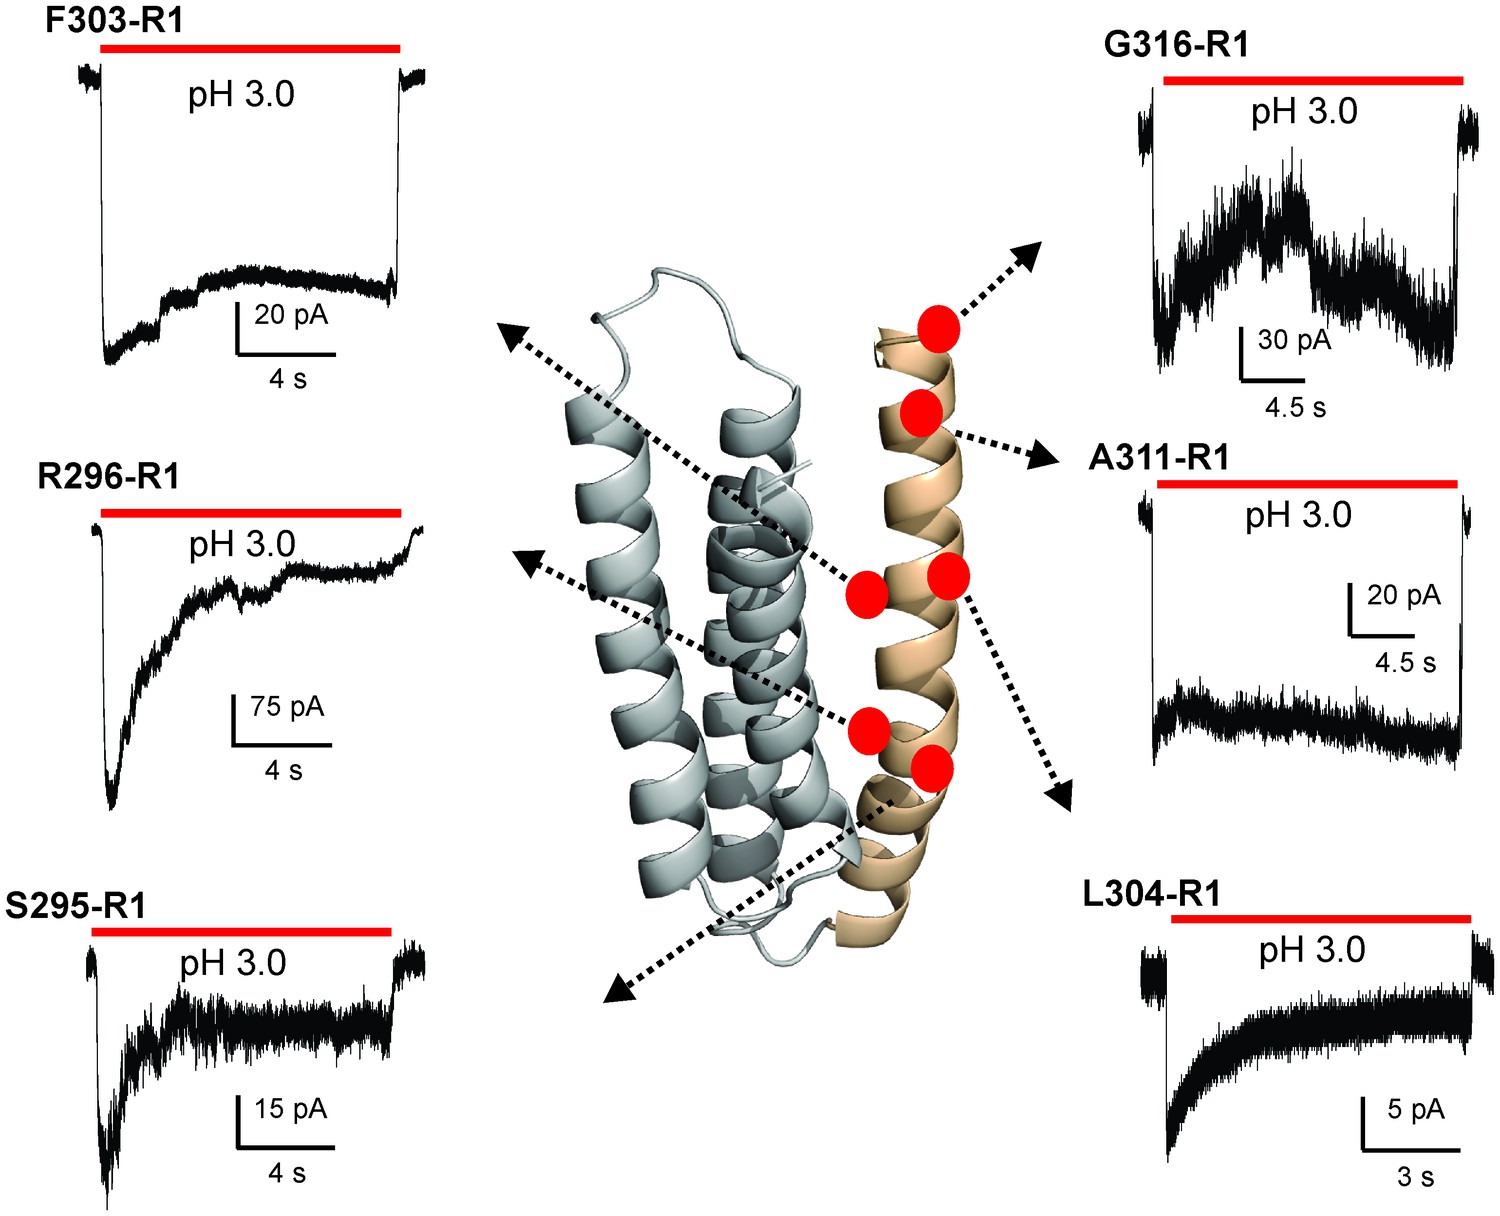
Functional characterization of spin-labeled M4 mutants by patch-clamp recordings in reconstituted proteoliposomes.
Macroscopic current traces from ‘inside-out’ patches of representative spin-labeled M4 mutants reconstituted into asolectin membranes. Currents were recorded in response to fast application of pH-jumps from 7.0 to 3.0. Currents were recorded under symmetrical 150 mM Na+ at −50 mV holding membrane potential.
Figure 5—figure supplement 3
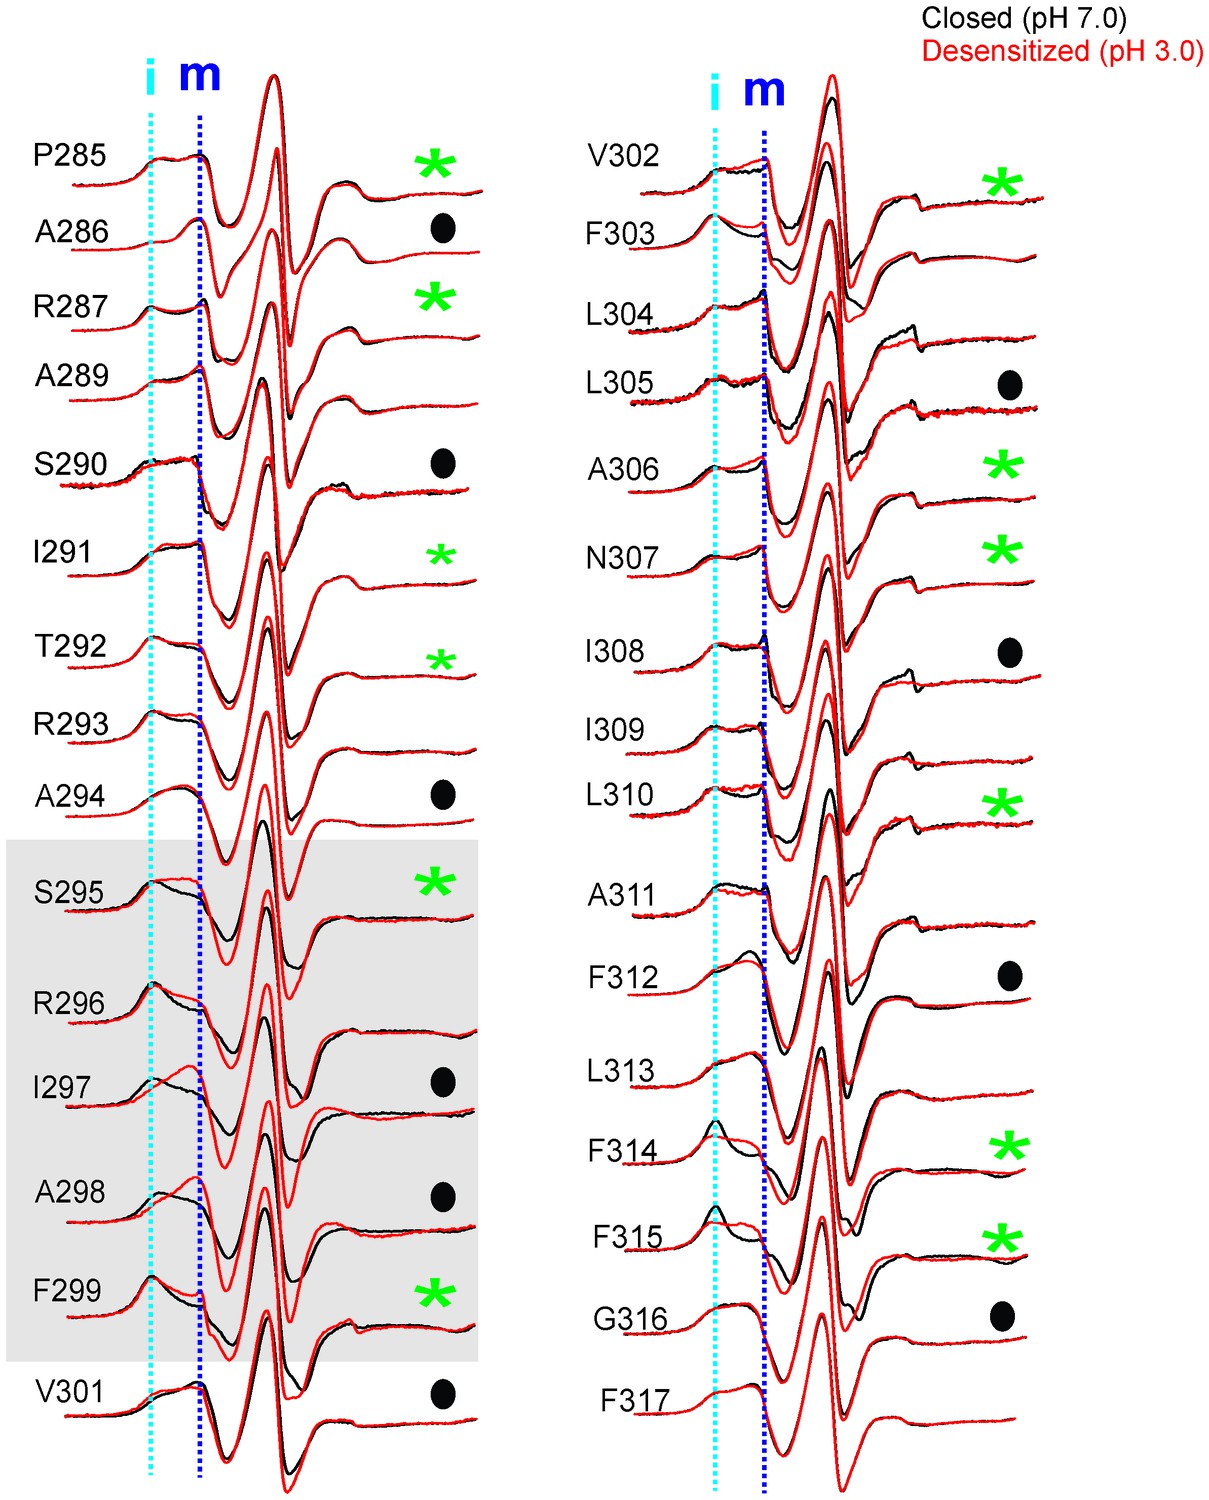
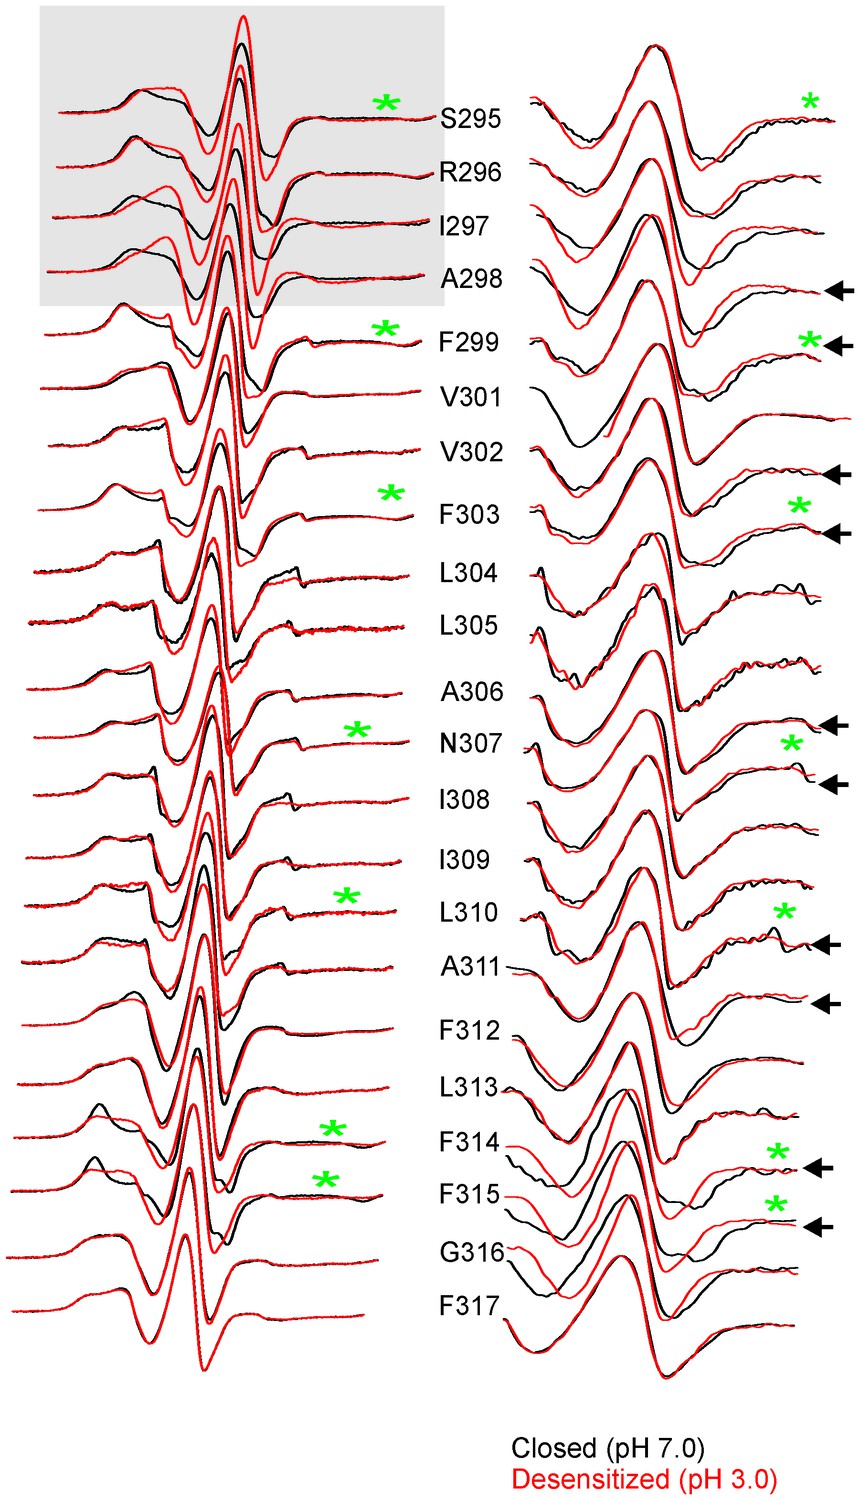
Conformational changes in M4 reported by EPR lineshapes.
CW-EPR spectra for the M4 residues in the closed (pH 7.0, black) and desensitized (pH 3.0, red) states. The residues facing the intrasubunit cavity are highlighted by green asterisks and those facing the membrane are indicated by black circles. Dotted lines marked as ‘i’ and ‘m’ represent the immobile and mobile components of the spectra, respectively. Grey box highlights residues at positions (i-5) to (i-1) with respect to Pro300 (i = 0).
Figure 6 with 1 supplement
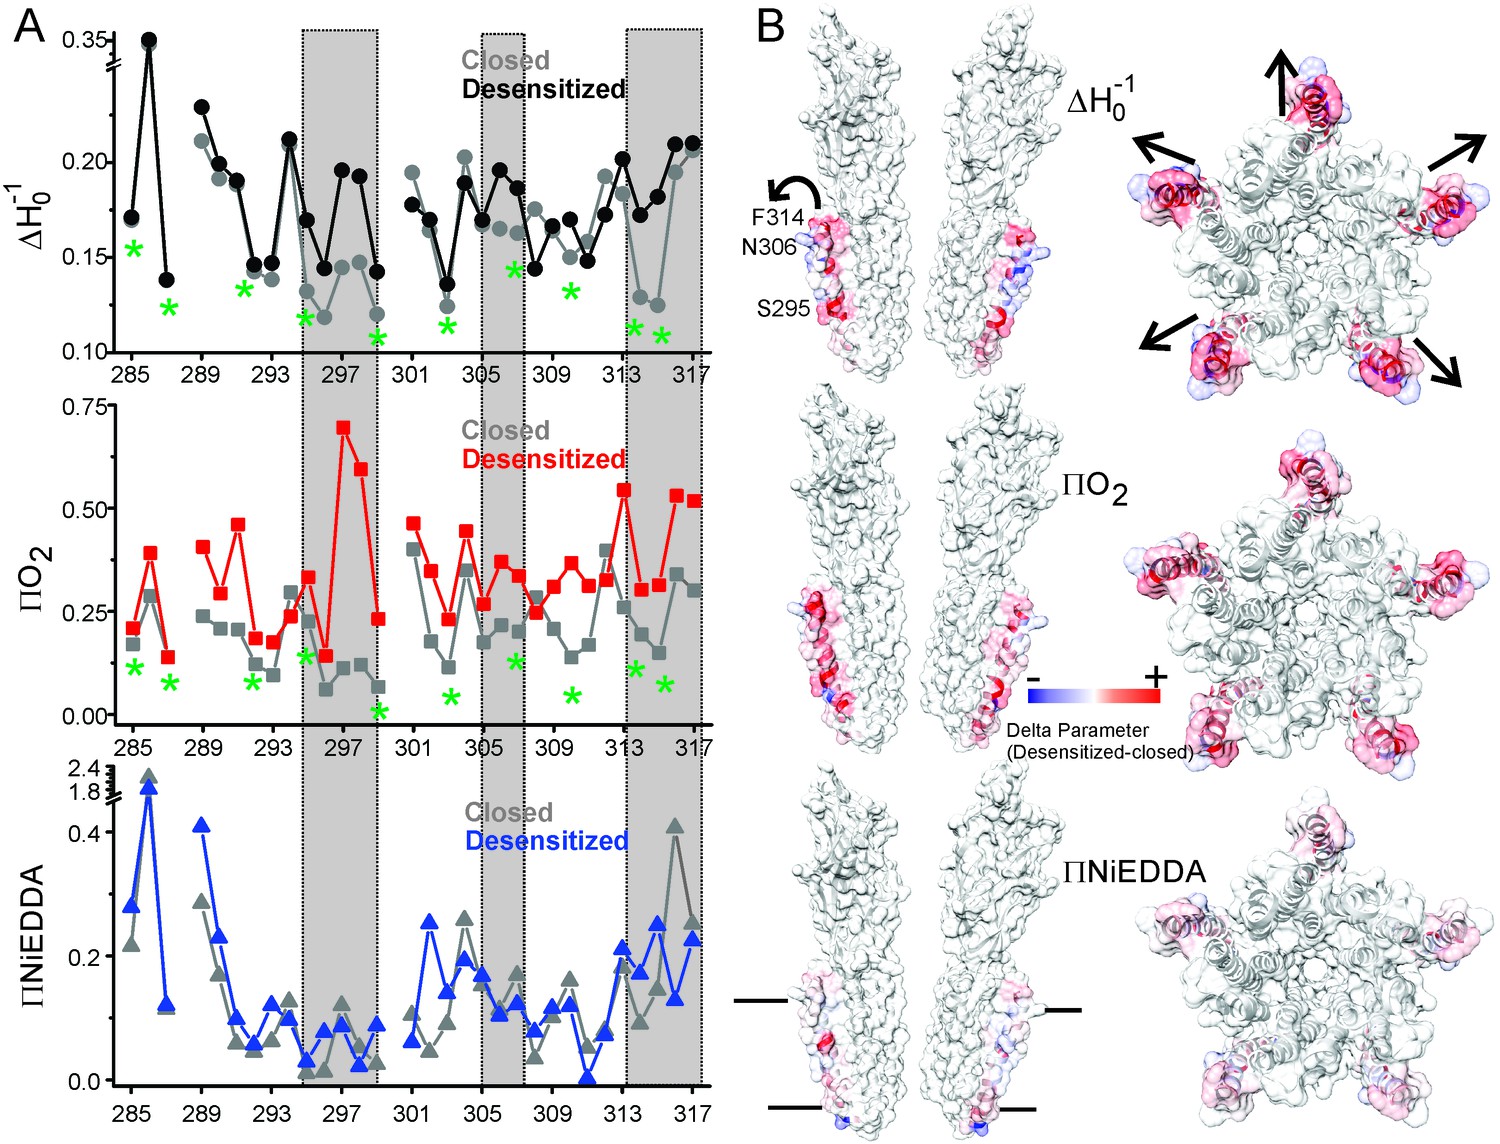
Solvent accessibility changes in M4 during desensitization.
(A) A plot of residue environmental parameters for the closed (shown in grey) and desensitized (shown in color) states. ΔHo−1 parameter (top); O2 accessibility ΠO2 (middle); water accessibility ΠNiEDDA (bottom). Positions along the protein-facing side of M4 are marked by green asterisks. Regions of most prominent change are highlighted within grey boxes. (B) Difference in individual parameters between the desensitized and closed states are mapped on the GLIC-pH4 structure (PDB ID: 4HFI) and color-coded with red denoting an increase and blue representing a decrease in the environmental parameter. The direction of putative M4 motion is indicated by the arrows. The putative membrane boundaries as reflected by NiEDDA accessibility are marked by solid black lines in the bottom panel.
Figure 6—figure supplement 1
Changes in EPR lineshapes due to relaxation broadening vs mobility changes.
CW-EPR spectra for positions along M4 in the closed (pH 7.0) and desensitized (pH 3.0) states before (left) and after purging N2 (for 15 min) (right). Positions of notable change are marked by black arrows. Positions on the TMD-facing side of M4 are marked green asterisks (these residues are highlighted in the GLIC-pH4 structure as a stick representation). The grey box highlights positions in the vicinity of Pro300 that show large changes in linehapes under the two conditions.
Figure 7 with 1 supplement

Changes in M4 distance measured by DEER for GLIC in nanodiscs.
GLIC structure showing the positions investigated by DEER and the two expected distance distributions (from the adjacent and non-adjacent subunits). Background subtracted DEER- echo intensity is plotted against evolution time and fit using model-free Tikhonov regularization. The corresponding inter-spin distance distribution (right) for the closed (black, pH 7.0) and desensitized (red, pH 4.0) states for different spin-labeled positions. The arrows highlight the direction of change.
Figure 7—figure supplement 1
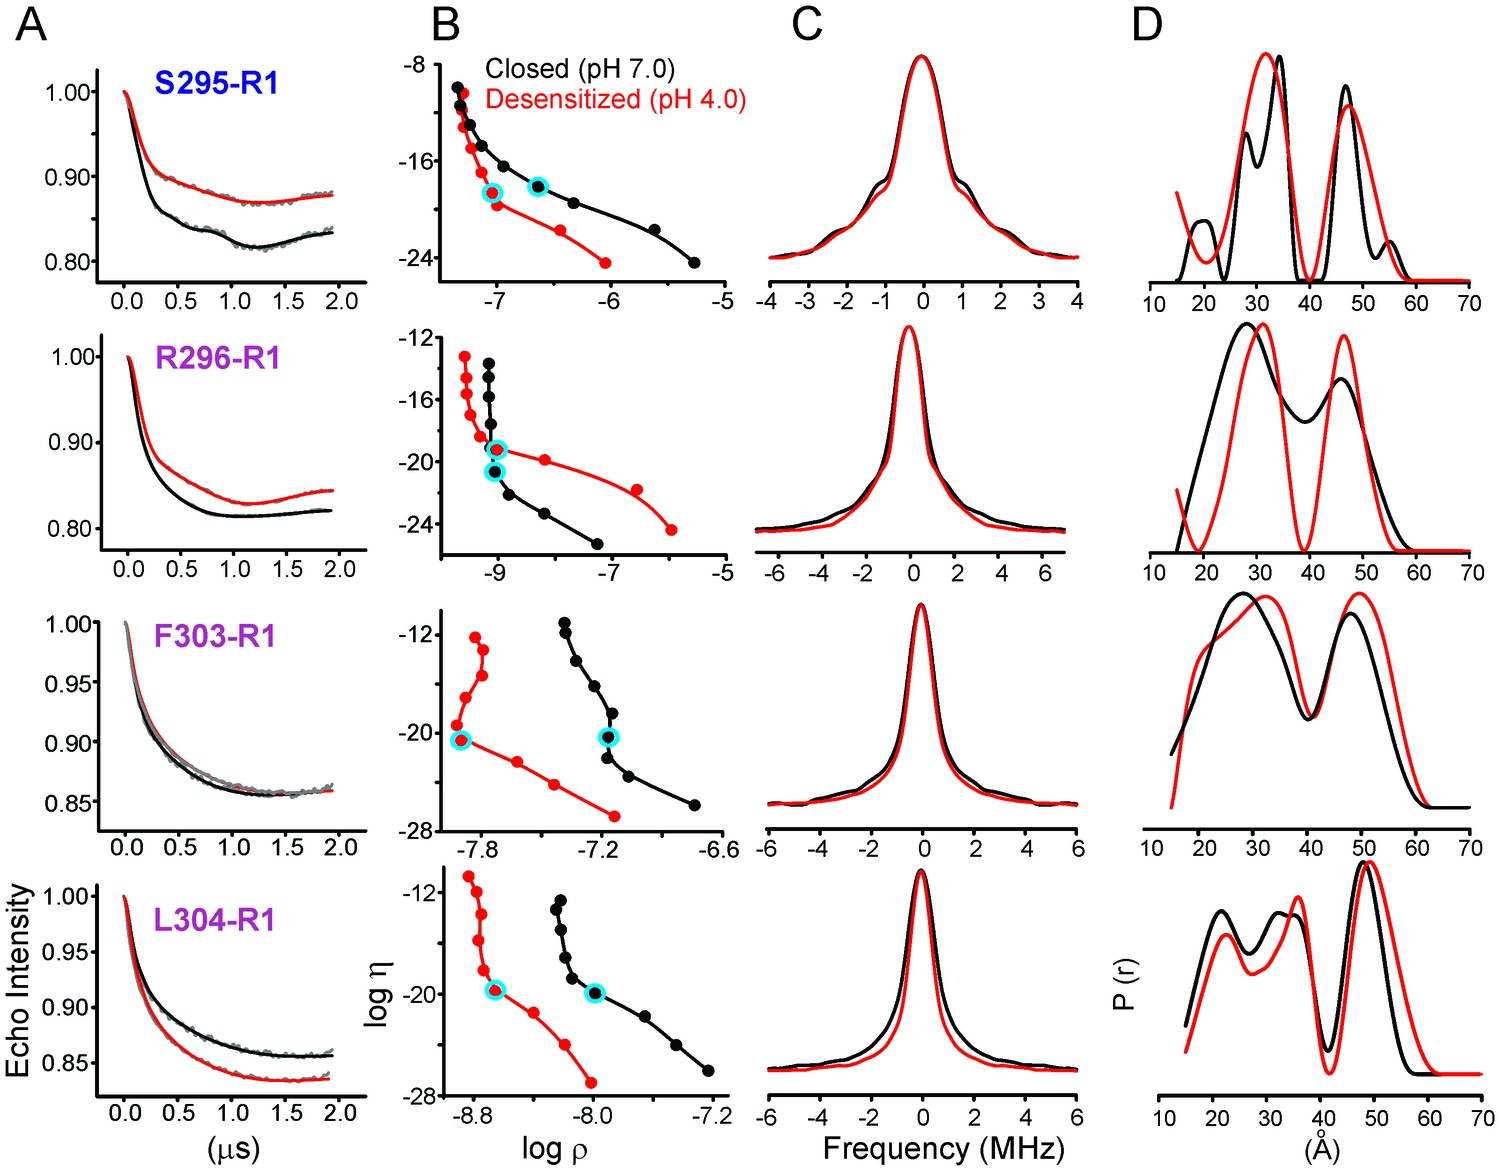
Analysis of DEER data.
(A) Background corrected Q-band dipolar evolution data for spin-labeled GLIC mutants reconstituted in nanodisc. (B) Corresponding Tikhonov L-curve. The highlighted blue circle in the L-curve represents the regularization parameter (α = 100) corresponding to the distance distribution in panel D. (C) The FT spectra of the traces shown in panel A. The black and red traces are fits based on the distance distribution shown in panel D for samples in the closed (pH 7.0) and desensitized (pH 4.0) states, respectively. (D) Distance distribution obtained by Tikhonov regularization.
Figure 8
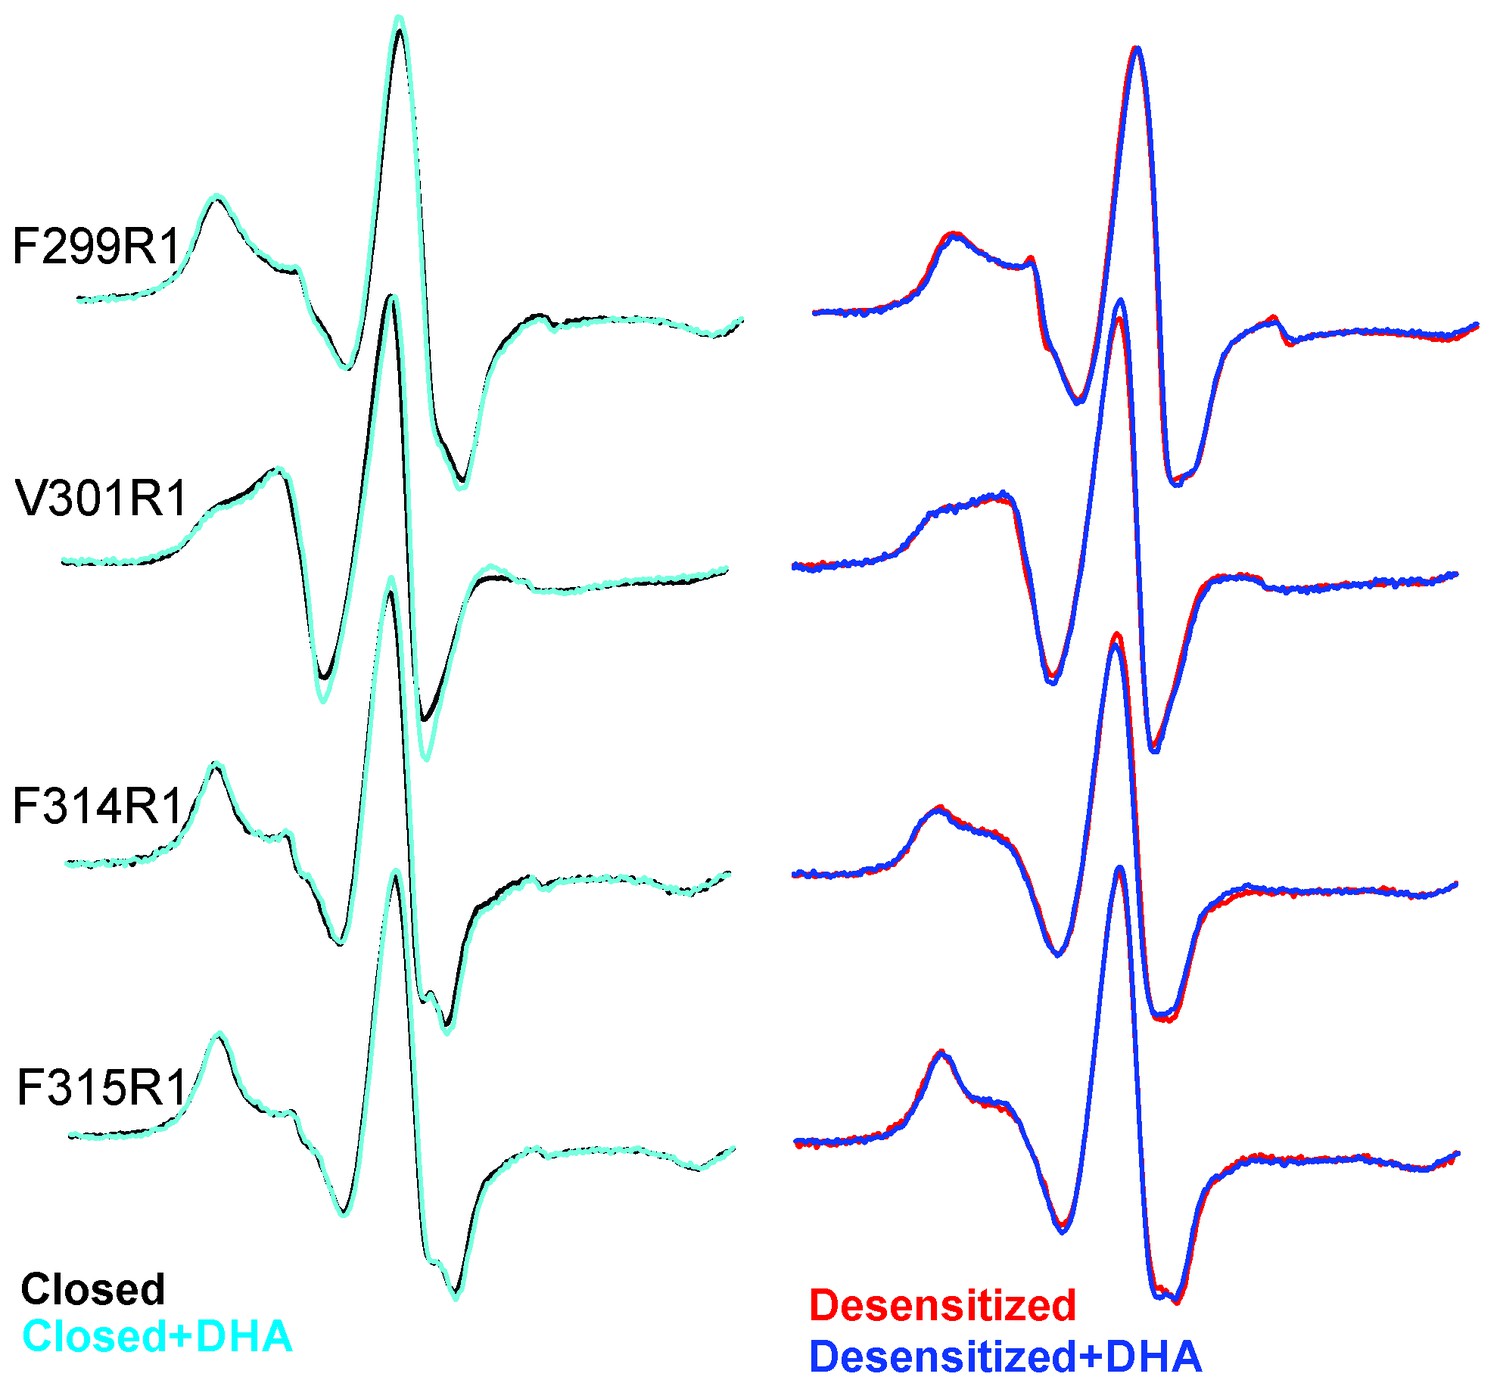
EPR spectral analysis of M4 positions in the absence or presence of DHA.
Spin-normalized CW-spectra for representative positions along M4 in the closed (pH 7.0) and desensitized (pH 3.0) states and measured in the presence or absence of 50 μM DHA.
Tables
Table 1
Data collection and refinement and statistics of GLIC.
| Data collection | |
|---|---|
| Beamline | NE-CAT 24-ID-C/E |
| Wavelength | 0.97870 |
| Space group | C121 |
| Cell dimensions a, b, c, (Å); β (°) | 181.87, 133.32, 159.92; 102.36 |
| No. of observations | 198167 |
| No. of unique observations | 64340 |
| Resolution range (Å) | 61.31–3.25 (3.34–3.25) |
| CC1/2 = 0.3 (Å)* | 3.25 |
| Mean I/σ (I) | 6.7 (1.4) |
| Rpim† | 0.057 (0.439) |
| Completeness (%) | 96.7 (98.6) |
| Multiplicity | 2.8 (2.8) |
| Average Mosaicity | 0.49 |
| Refinement | |
| Resolution (Å) | 30.0–3.25 |
| Rwork (%) | 23.15 |
| Rfree‡ (%) | 26.11 |
| B-factor (Å2) | |
| Protein | 102.55 |
| R.M.S deviations: | |
| Bond lengths (Å) | 0.006 |
| Bond angles (°) | 1.45 |
| Molprobity Score | 98th percentile |
| Ramachandran Analysis§ | |
| Favored | 88.15% |
| Allowed | 11.32% |
| Generously Allowed all Allowed8 | 0.53% (8 residues) |
-
*CC1/2 is the Pearson correlation coefficient of two-half data sets (Karplus et al., 2012).
-
†Rpim (all I+/I-).
-
‡5.0% of reflections were excluded from refinement for calculation of Rfree.
-
§Calculated using PROCHECK (Laskowski et al., 1993).
Table 2
DEER distances measured in nanodiscs compared with (cβ-cβ) distances from crystal structures.
| pH 7.0 | pH 4.0 | ||||
|---|---|---|---|---|---|
| Residue | Short (Å) | Long (Å) | Short (Å) | Long (Å) | |
| S295R1 | GLIC Crystal Structure | 26.3 | 42.6 | 26.5 | 42.9 |
| GLIC Nanodisc DEER | 27.8/34.3 | 46.6 | 31.6 | 47.2 | |
| R296R1 | GLIC Crystal Structure | 28.0 | 45.3 | 28.2 | 45.7 |
| GLIC Nanodisc DEER | 27.8 | 46.1 | 31.1 | 46.7 | |
| F303R1 | GLIC Crystal Structure | 29.2 | 47.3 | 29.5 | 47.8 |
| GLIC Nanodisc DEER | 28.1 | 48.3 | 32.2 | 49.4 | |
| L304R1 | GLIC Crystal Structure | 34.5 | 55.9 | 35.3 | 57 |
| GLIC Nanodisc DEER | 21.4/33.8 | 47.8 | 22.6/35.6 | 49.4 | |
-
GLIC crystal structure at pH 7.0 (PDB ID: 4NPQ) (Sauguet et al., 2014).
-
GLIC crystal structure at pH 4.0 (PDB ID: 4HFI) (Sauguet et al., 2013).
Download links
A two-part list of links to download the article, or parts of the article, in various formats.
Downloads (link to download the article as PDF)
Open citations (links to open the citations from this article in various online reference manager services)
Cite this article (links to download the citations from this article in formats compatible with various reference manager tools)
Crystal structure and dynamics of a lipid-induced potential desensitized-state of a pentameric ligand-gated channel
eLife 6:e23886.
https://doi.org/10.7554/eLife.23886


