Moderate nucleotide diversity in the Atlantic herring is associated with a low mutation rate
- Uppsala University, Sweden
- Swedish University of Agricultural Sciences, Sweden
- University of Bergen and the Hjort Center of Marine Ecosystem Dynamics, Norway
- Institute of Marine Research, Norway
- Texas A&M University, United States
Figures
Figure 1 with 1 supplement
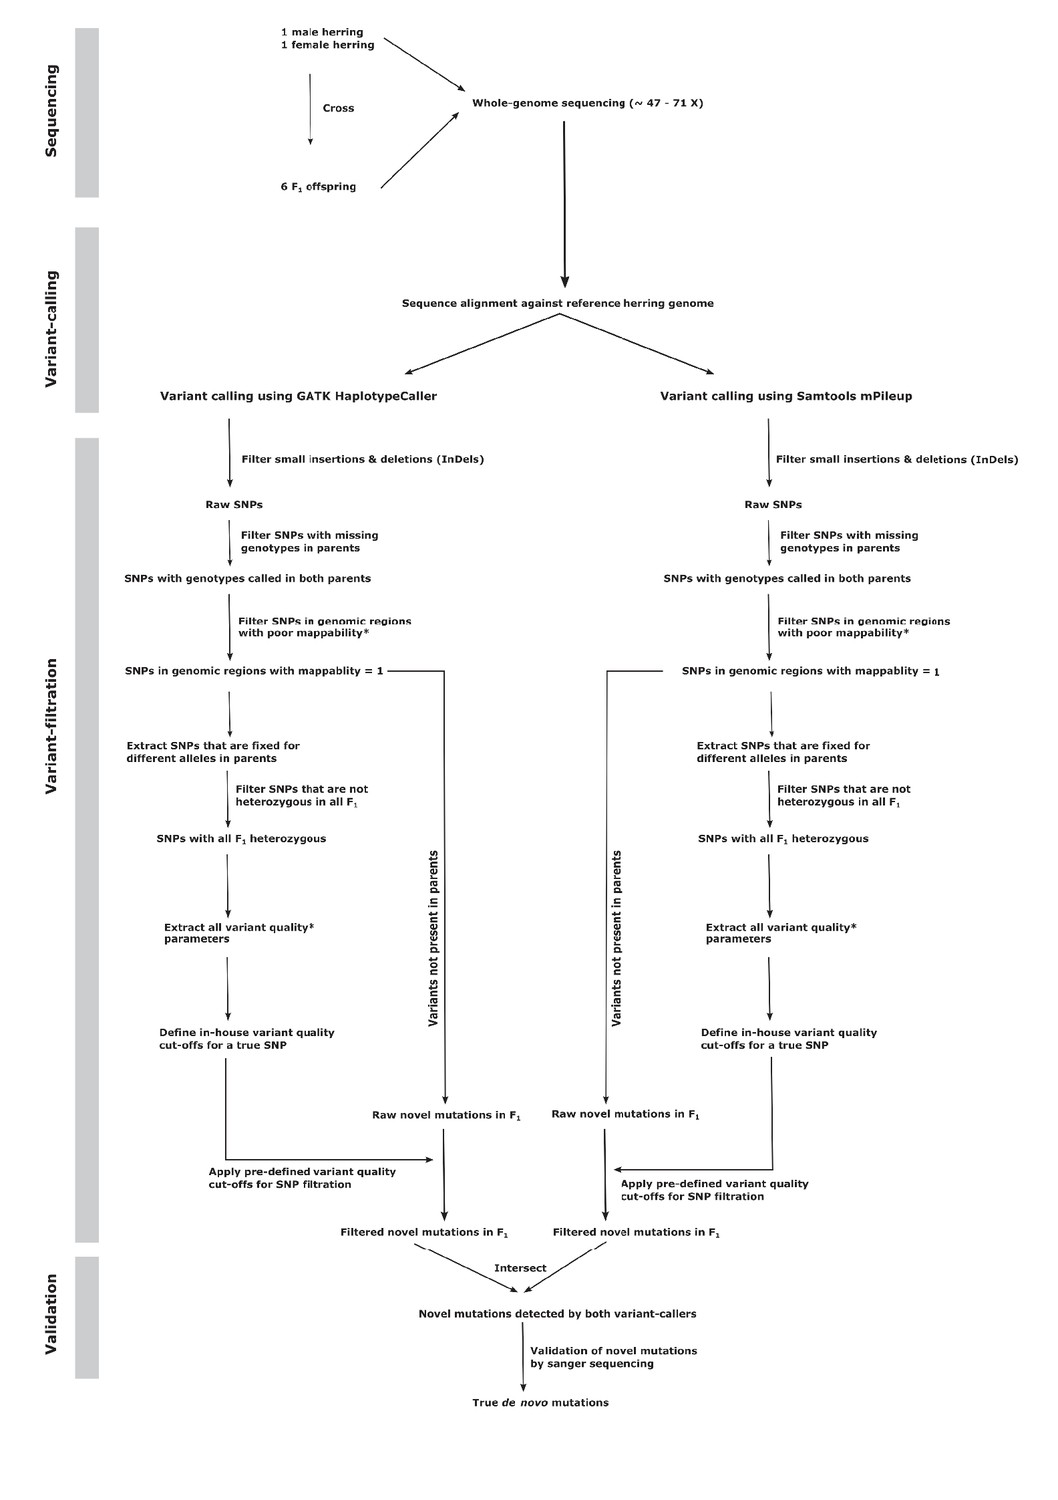
Flowchart describing the de novo mutation-calling pipeline.
A schematic illustration of the steps used in calling and filtering the candidate mutations.
Figure 1—figure supplement 1
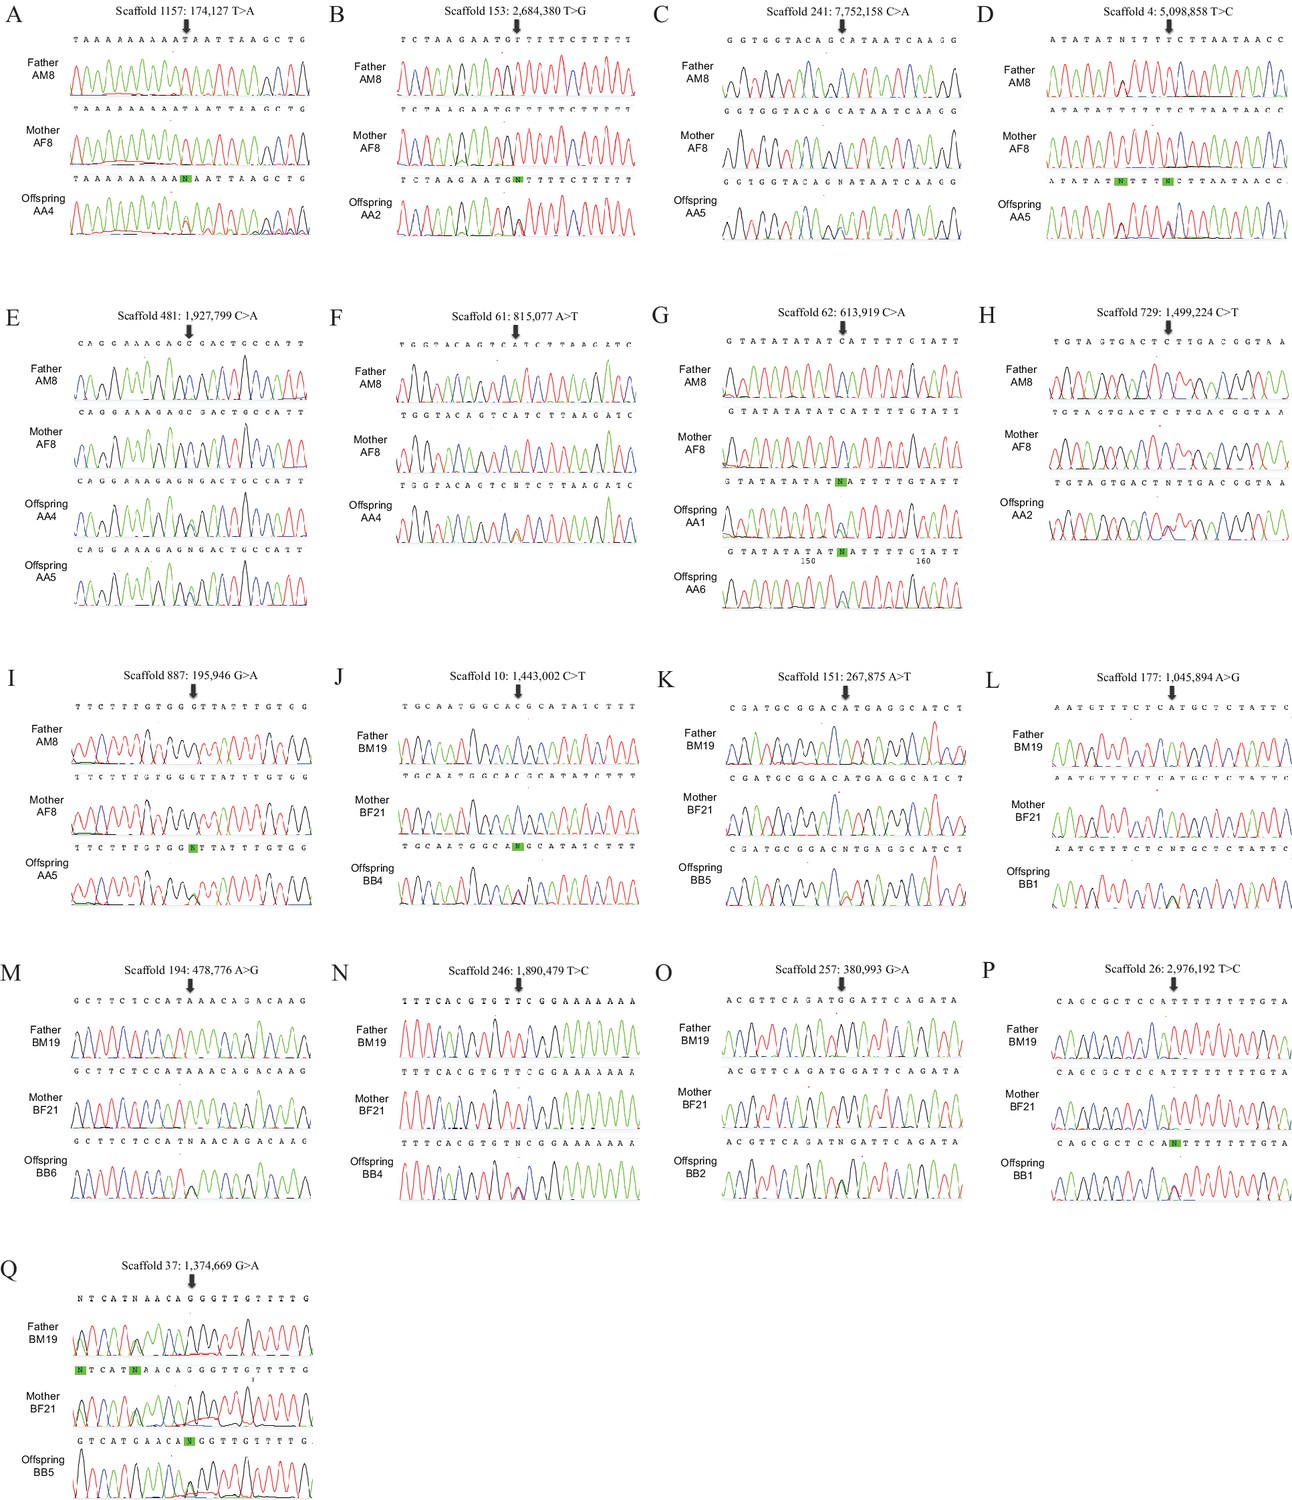
Sanger sequencing chromatograms of the de novo mutations.
Chromatograms from the identified target offspring and its parents for each region containing a candidate de novo mutation.
Tables
Table 1
Summary of the pedigrees used for whole-genome sequencing.
| No | ID | Pedigree | Sequencing depth (x) | De novo mutations |
|---|---|---|---|---|
| Pedigree 1, Atlantic herring | ||||
| 1 | AM8 | Father | 65.7 | N.A. |
| 2 | AF8 | Mother | 70.2 | N.A. |
| 3 | AA1 | Offspring | 65.6 | 1 |
| 4 | AA2 | Offspring | 70.9 | 2 |
| 5 | AA3 | Offspring | 47.2 | 0 |
| 6 | AA4 | Offspring | 66.9 | 3 |
| 7 | AA5 | Offspring | 64.2 | 4 |
| 8 | AA6 | Offspring | 61.2 | 1 |
| Pedigree 2, Baltic herring | ||||
| 9 | BM19 | Father | 71.8 | N.A. |
| 10 | BF21 | Mother | 65.1 | N.A. |
| 11 | BB1 | Offspring | 74.5 | 2 |
| 12 | BB2 | Offspring | 61.6 | 1 |
| 13 | BB3 | Offspring | 75.0 | 0 |
| 14 | BB4 | Offspring | 69.9 | 2 |
| 15 | BB5 | Offspring | 60.6 | 2 |
| 16 | BB6 | Offspring | 62.6 | 1 |
-
N.A. = Not available.
Table 2
Summary of the de novo mutations identified in Atlantic herring.
| SNP position | Mutation | ||||||
|---|---|---|---|---|---|---|---|
| Scaffold:position | Id | Ref | Var | Freq† | Origin‡ | Type§ | Region |
| 1157:174,127 | AA4 | T | A | 1/50 (-) | M | TV | Intergenic |
| 153:2,684,380 | AA2 | T | G | 9/50 (18%) | P | TV | Intronic |
| 241:7,752,158 | AA5 | C | A | 5/50 (10%) | M | TV | Intergenic |
| 4:5,098,858 | AA5 | T | C | 2/50 (4%) | M | TS | Intronic |
| 481:1,927,799 | AA4, AA5* | C | A | 6/50 (12%) | P | TV | 3' UTR |
| 61:815,077 | AA4 | A | T | 3/50 (6%) | N.A. | TV | Intergenic |
| 62:613,919 | AA1, AA6* | C | A | 6/50 (12%) | M | TV | Intergenic |
| 729:1,499,224 | AA2 | C | T | 4/50 (8%) | M | TS | Intronic |
| 887:195,946 | AA5 | G | A | 1/50 (-) | P | TS | Intronic |
| 10:1,443,002 | BB4 | C | T | 1/46 (-) | P | TS | Intronic |
| 151:267,875 | BB5 | A | T | 1/46 (-) | P | TV | Exonic |
| 177:1,045,894 | BB1 | A | G | 1/46 (-) | P | TS | Intronic |
| 194:478,776 | BB6 | A | G | 1/46 (-) | N.A. | TS | Intronic |
| 246:1,890,479 | BB4 | T | C | 1/46 (-) | P | TS | Intergenic |
| 257:380,993 | BB2 | G | A | 1/46 (-) | M | TS | Intergenic |
| 26:2,976,192 | BB1 | T | C | 2/46 (4%) | P | TS | Intronic |
| 37:1,374,669 | BB5 | G | A | 1/46 (-) | M | TS | Intronic |
-
*Same mutation detected in two progeny.
-
†Number of siblings carrying the de novo mutation; - the frequency of transmission was only estimated when two or more progeny with the de novo mutation was detected.
-
‡M:Maternal, P:Paternal, N.A. = Not available
-
§TV = Transversion, TS = Transition
Table 3
Summary of mutation rates measured to date.
| Species | Taxonomic group | μ | Method* | Genome size (Mb) | Ne† |
|---|---|---|---|---|---|
| Pseudomonas aeruginosa | Bacteria | 7.9 × 10⁻¹¹ | MA1 | 6.3 | 2.1 × 10⁸ |
| Burkholderia cenocepacia | Bacteria | 1.3 × 10⁻¹⁰ | MA2 | 8.1 | 2.5 × 10⁸ |
| Escherichia coli | Bacteria | 2.2 × 10⁻¹⁰ | MA3 | 4.6 | 1.6 × 10⁸ |
| Chlamydomonas reinhardtii | Unicellular eukaryotes | 2.1 × 10⁻¹⁰ | MA4 | 120 | 7.8 × 10⁷ |
| Saccharomyces cerevisiae | Unicellular eukaryotes | 1.7 × 10⁻¹⁰ | MA5 | 12.2 | 1.2 × 10⁷ |
| Schizosaccharomyces pombe | Unicellular eukaryotes | 2.1 × 10⁻¹⁰ | MA6 | 12.6 | 1.4 × 10⁷ |
| Arabidopsis thaliana | Plants | 7.1 × 10⁻⁹ | MA7 | 119 | 2.8 × 10⁵ |
| Pristionchus pacificus | Invertebrates | 2.0 × 10⁻⁹ | MA8 | 133 | 1.8 × 10⁶ |
| Caenorhabditis elegans | Invertebrates | 1.5 × 10⁻⁹ | MA9 | 100 | 5.2 × 10⁵ |
| Caenorhabditis briggsae | Invertebrates | 1.3 × 10⁻⁹ | MA9 | 108 | 2.7 × 10⁵ |
| Drosophila melanogaster | Invertebrates | 3.2 × 10⁻⁹ | MA10 PO11 | 144 | 1.4 × 10⁶ |
| Heliconius melpomene | Invertebrates | 2.9 × 10⁻⁹ | PO12 | 274 | 2.1 × 10⁶ |
| Daphnia pulex | Invertebrates | 5.7 × 10⁻⁹ | MA13 | 250 | 8.2 × 10⁵ |
| Atlantic herring (Clupea harengus) | Teleosts | 2.0 × 10⁻⁹ | PO* | 850 | 4.0 × 10⁵ |
| Collared flycatcher (Ficedula albicollis) | Birds | 4.6 × 10⁻⁹ | PO14 | 1118 | 2.0 × 10⁵ |
| Mouse (Mus musculus) | Mammals | 5.4 × 10⁻⁹ | MA15,16 | 2808 | 1.8 × 10⁵ |
| Cattle (Bos taurus) | Mammals | 9.7 × 10⁻⁹ | PO17 | 2725 | 3.7 × 10⁴ |
| Chimpanzee (Pan troglodytes) | Mammals | 1.2 × 10⁻⁸ | PO18 | 3231 | 2.9 × 10⁴ |
| Human (Homo sapiens) | Mammals | 1.2 × 10⁻⁸ | PO19 | 3236 | 2.4 × 10⁴ |
-
*MA = Mutation Accumulation, PO = Parent-Offspring. The values are from the following sources: 1. Dettman et al. (2016); 2. Dillon et al. (2015); 3. Lee et al. (2012); 4. Ness et al. (2012); 5. Zhu et al. (2014); 6. Farlow et al. (2015); 7. Ossowski et al. (2010); 8. Weller et al. (2014); 9. Denver et al. (2012); 10. Keightley et al. (2009); 11. Keightley et al. (2014); 12. Keightley et al. (2015); 13. Keith et al. (2016); 14. Smeds et al. (2016); 15. Lindsay et al. (2016); 16. Uchimura et al. (2015); 17. Harland et al. (2016); 18. Venn et al. (2014); 19. Kong et al. (2012).
-
†Ne is calculated as π/4μ. The underlying π estimates are all from Lynch et al. (2016) except for herring (present study), collared flycatcher (Ellegren et al., 2012) and cattle (Daetwyler et al., 2014).
Additional files
-
Supplementary file 1
Estimated population size of major stocks of Atlantic herring in the North East Atlantic Ocean including the Baltic Sea.
- https://doi.org/10.7554/eLife.23907.008
-
Supplementary file 2
Summary statistics of the SNP calls underlying the estimation of the false negative rate by means of simulation.
- https://doi.org/10.7554/eLife.23907.009
-
Supplementary file 3
Estimates of generation time for different stocks of herring.
- https://doi.org/10.7554/eLife.23907.010
Download links
A two-part list of links to download the article, or parts of the article, in various formats.
Downloads (link to download the article as PDF)
Open citations (links to open the citations from this article in various online reference manager services)
Cite this article (links to download the citations from this article in formats compatible with various reference manager tools)
Moderate nucleotide diversity in the Atlantic herring is associated with a low mutation rate
eLife 6:e23907.
https://doi.org/10.7554/eLife.23907


