Single-molecule visualization of fast polymerase turnover in the bacterial replisome
- University of Wollongong, Australia
- University of Groningen, The Netherlands
- University of Wisconsin-Madison, United States
- Max Planck Institute of Biochemistry, Germany
- Technishche Universität München, Germany
Figures
Figure 1 with 1 supplement
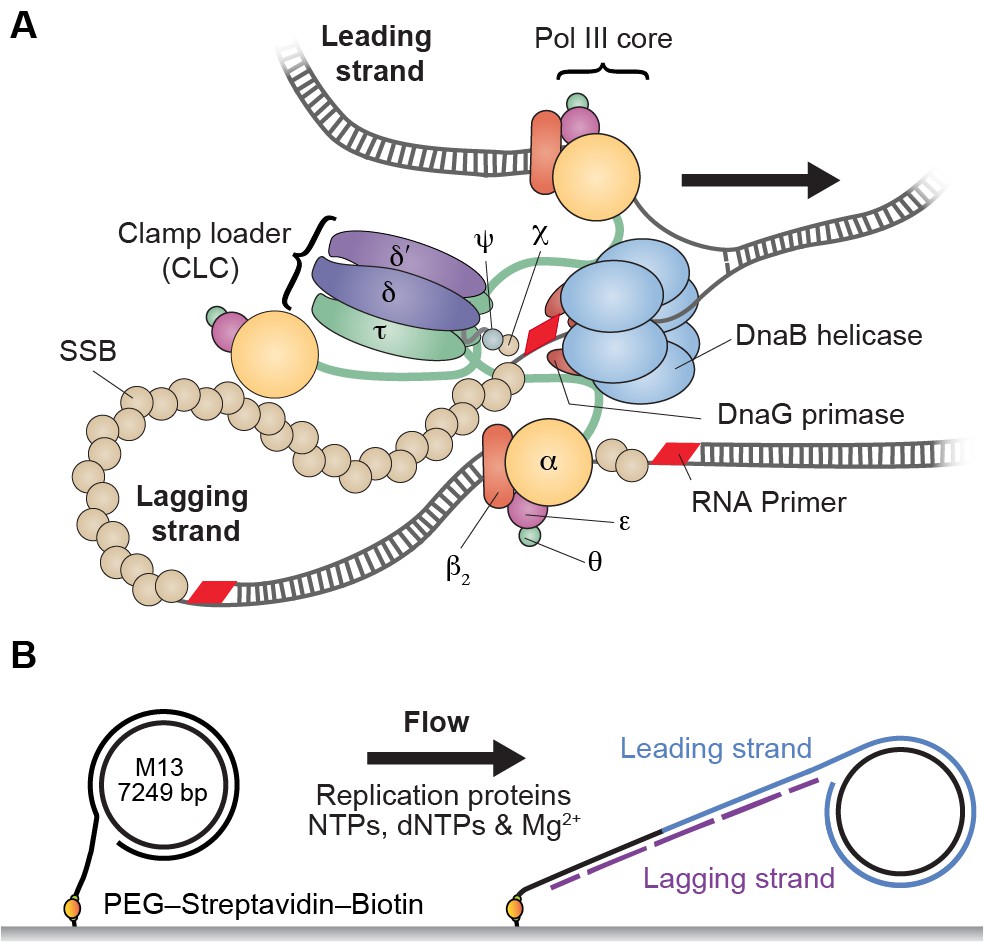
Single-molecule rolling-circle replication assay.
(A) Canonical view of the organization of the E. coli replication fork. The DnaB helicase encircles the lagging strand, facilitates unwinding of dsDNA through ATP hydrolysis, and recruits DnaG primase for synthesis of RNA primers that initiate synthesis of 1–2 kb Okazaki fragments on the lagging strand. The extruded single-stranded (ss) DNA is protected by ssDNA-binding protein, SSB. The Pol III holoenzyme (HE) uses the ssDNA of both strands as a template for coupled, simultaneous synthesis of a pair of new DNA duplex molecules. The β2 sliding clamp confers high processivity on the Pol III HE by tethering the αεθ Pol III core onto the DNA. The clamp loader complex (CLC) assembles the β2 clamp onto RNA primer junctions. Up to three Pol III cores interact with the CLC through its τ subunits to form the Pol III* complex, and the τ subunits also interact with DnaB, thus coupling the Pol III HE to the helicase. (B) Schematic representation of the experimental design. 5'-Biotinylated M13 DNA is coupled to the passivated surface of a microfluidic flow cell through a streptavidin linkage. Addition of the E. coli replication proteins and nucleotides initiates DNA synthesis. The DNA products are elongated hydrodynamically by flow, labeled with intercalating DNA stain, and visualized using fluorescence microscopy (Figure 1—figure supplement 1).
Figure 1—figure supplement 1
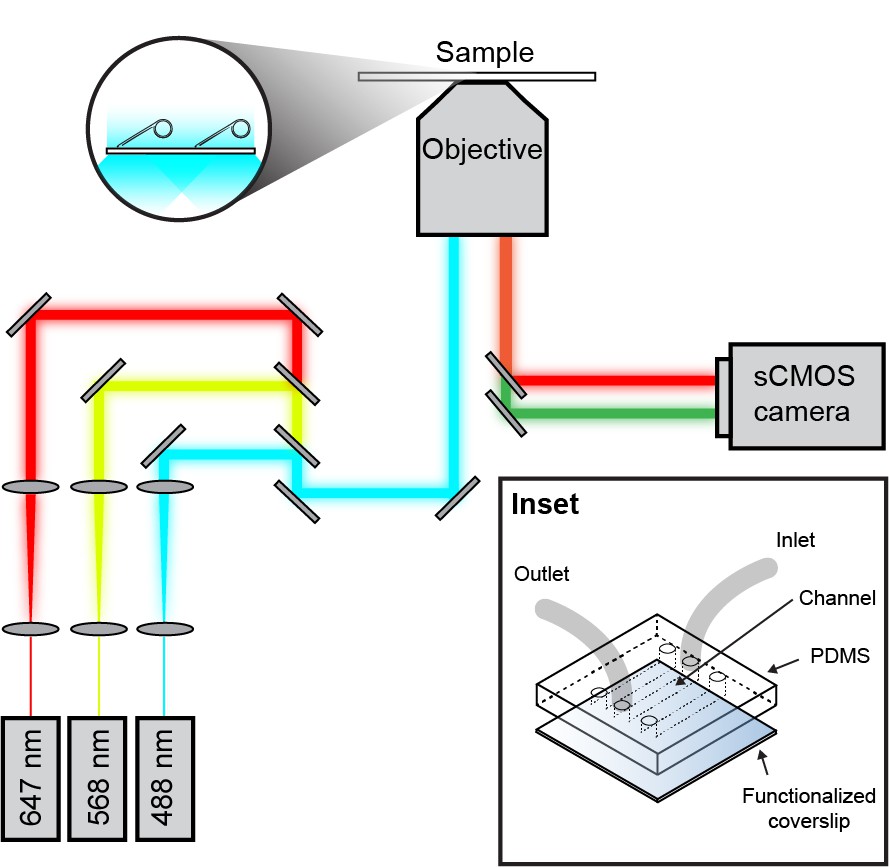
Schematic overview of the single-molecule fluorescence microscope.
Laser light of a specific wavelength is coupled into the microscope objective. The fluorescence signal from the sample is detected with an EMCCD or sCMOS camera. (Inset) Micro-fluidic flow cell schematic. A PDMS lid containing three flow chambers is placed on top of a PEG-biotin-functionalized microscope coverslip. Tubing is inserted into 1 mm holes in the PDMS.
Figure 2 with 4 supplements
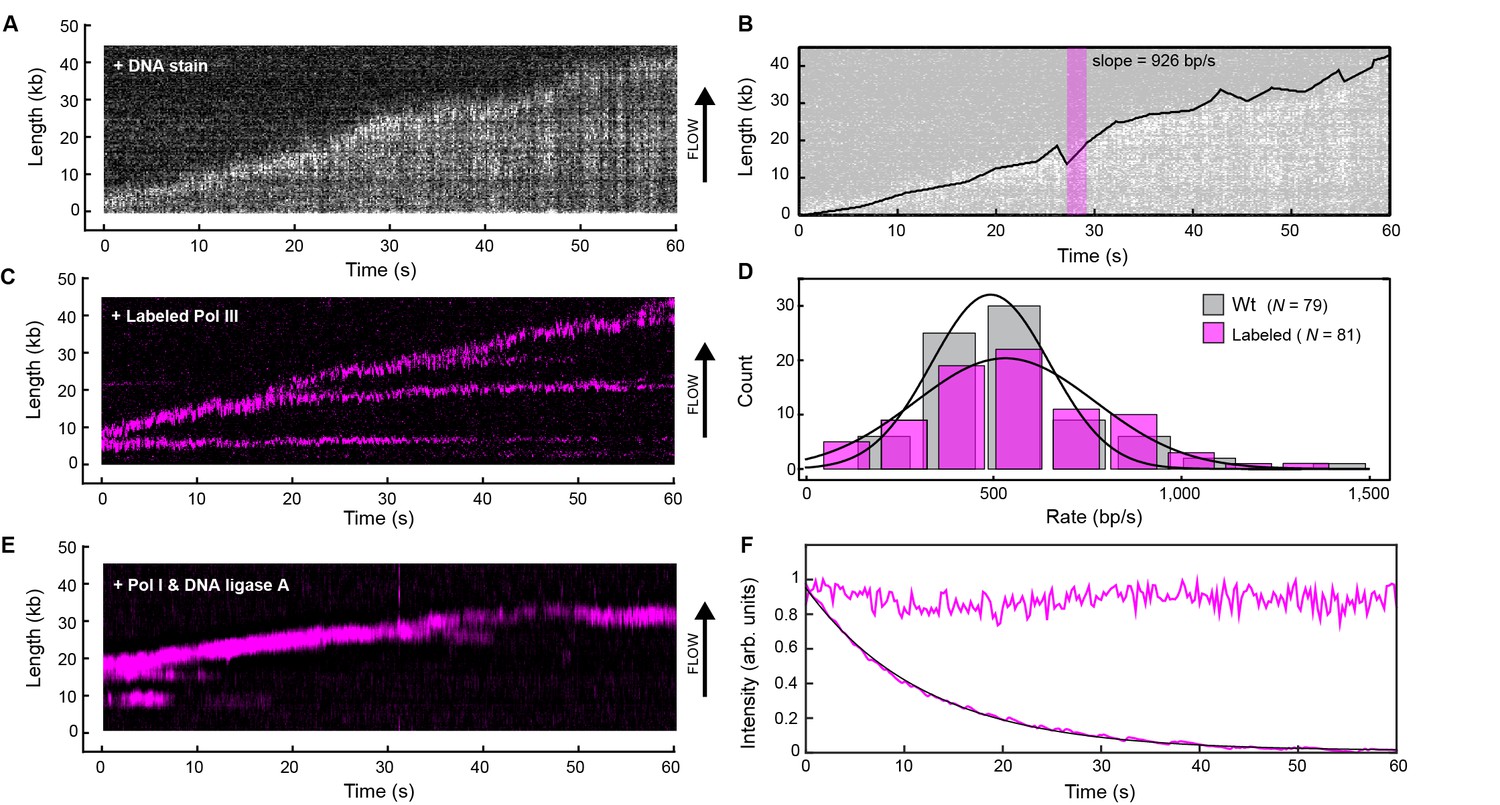
Real-time fluorescence imaging of coupled DNA replication.
(A) Kymograph of an individual DNA molecule undergoing coupled leading and lagging strand replication. The gray scale indicates the fluorescence intensity of stained DNA. (B) Single-molecule trajectory obtained from the kymograph in (A), used to quantify the rates and processivities of replication events. The magenta box represents an example line segment used to determine rates. (C) Kymograph of the dynamics of red-labeled Pol IIIs on an individual DNA molecule. The Pol III moves with the replisome in the direction of flow as it elongates the DNA, visible as a bright magenta spot moving away from the surface anchor point. Additional Pol IIIs are left behind the moving replisome, seen as horizontal lines on the kymograph. (D) Histograms of the rate of replication for wild-type Pol III (492 ± 23 bp/s) and red Pol III (561 ± 27 bp/s) fit to Gaussian distributions. (E) Kymograph of the distribution of red Pol III on an individual DNA molecule in the presence of 150 nM Pol I and 100 nM DNA ligase. Prolonged Pol III spots behind the replisome are no longer observed due to the action of Pol I in Okazaki fragment processing. (F) Fluorescence intensity as a function of time of individual red Pol IIIs immobilized on the surface of a coverslip (lower trace; black line is an exponential fit with lifetime = 14.1 ± 0.4 s), and of the replisomal spot in (C) (upper trace). The fluorescence lifetime of red Pol III at the replisome is much longer than the photobleaching lifetime of the dye. The errors represent the standard errors of the mean.
Figure 2—figure supplement 1
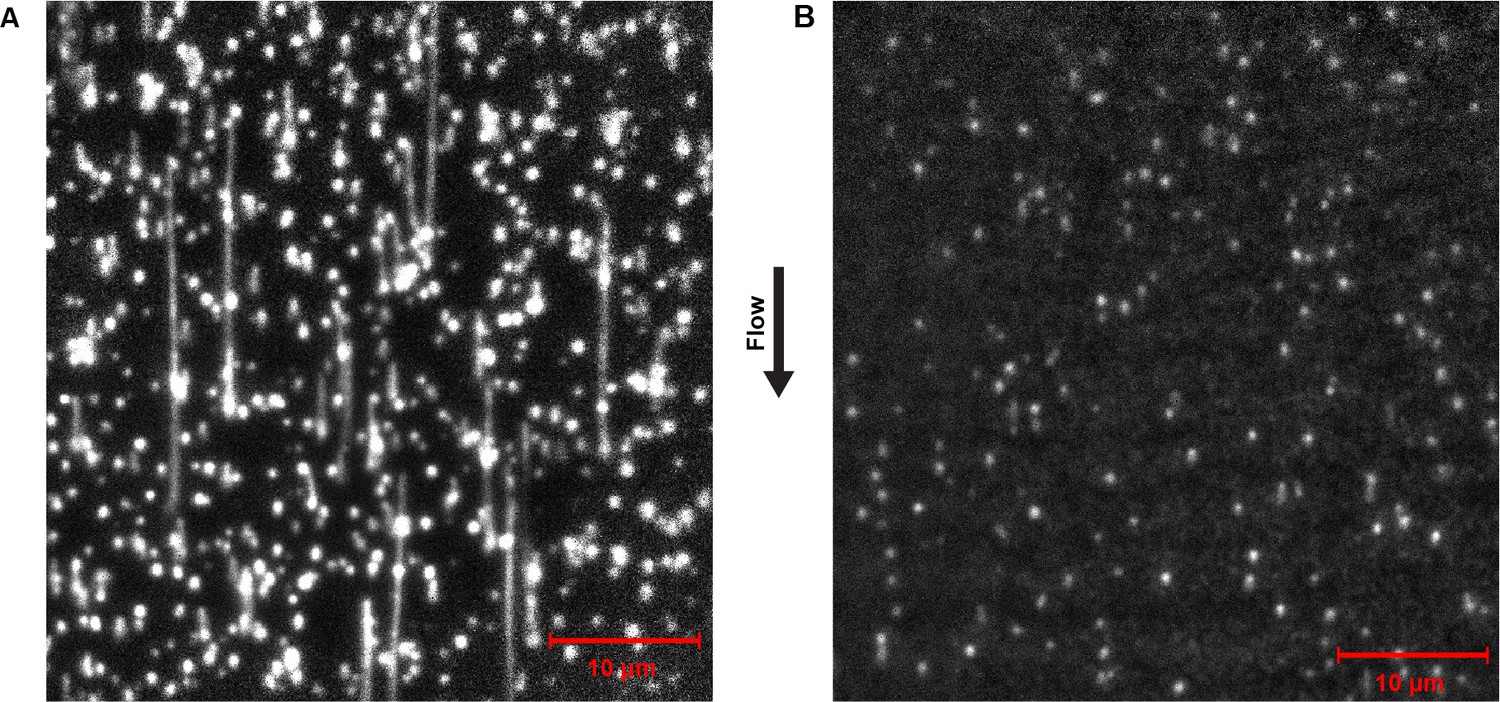
Representative field of view of SYTOX orange-stained dsDNA from the single-molecule rolling-circle DNA replication assay.
(A) Efficient DNA replication proceeds in the presence of the full complement of replication reaction mix, including the reconstituted E. coli replisome, NTPs and dNTPs. Note both the length and number of products. (B) No DNA products are evident in the entire flow cell in the absence of dNTPs from the replication reaction mix. Note some rolling-circle templates become linearized due to photodamage, visible as lines shorter than 7 kb (2.1 μm).
Figure 2—figure supplement 2
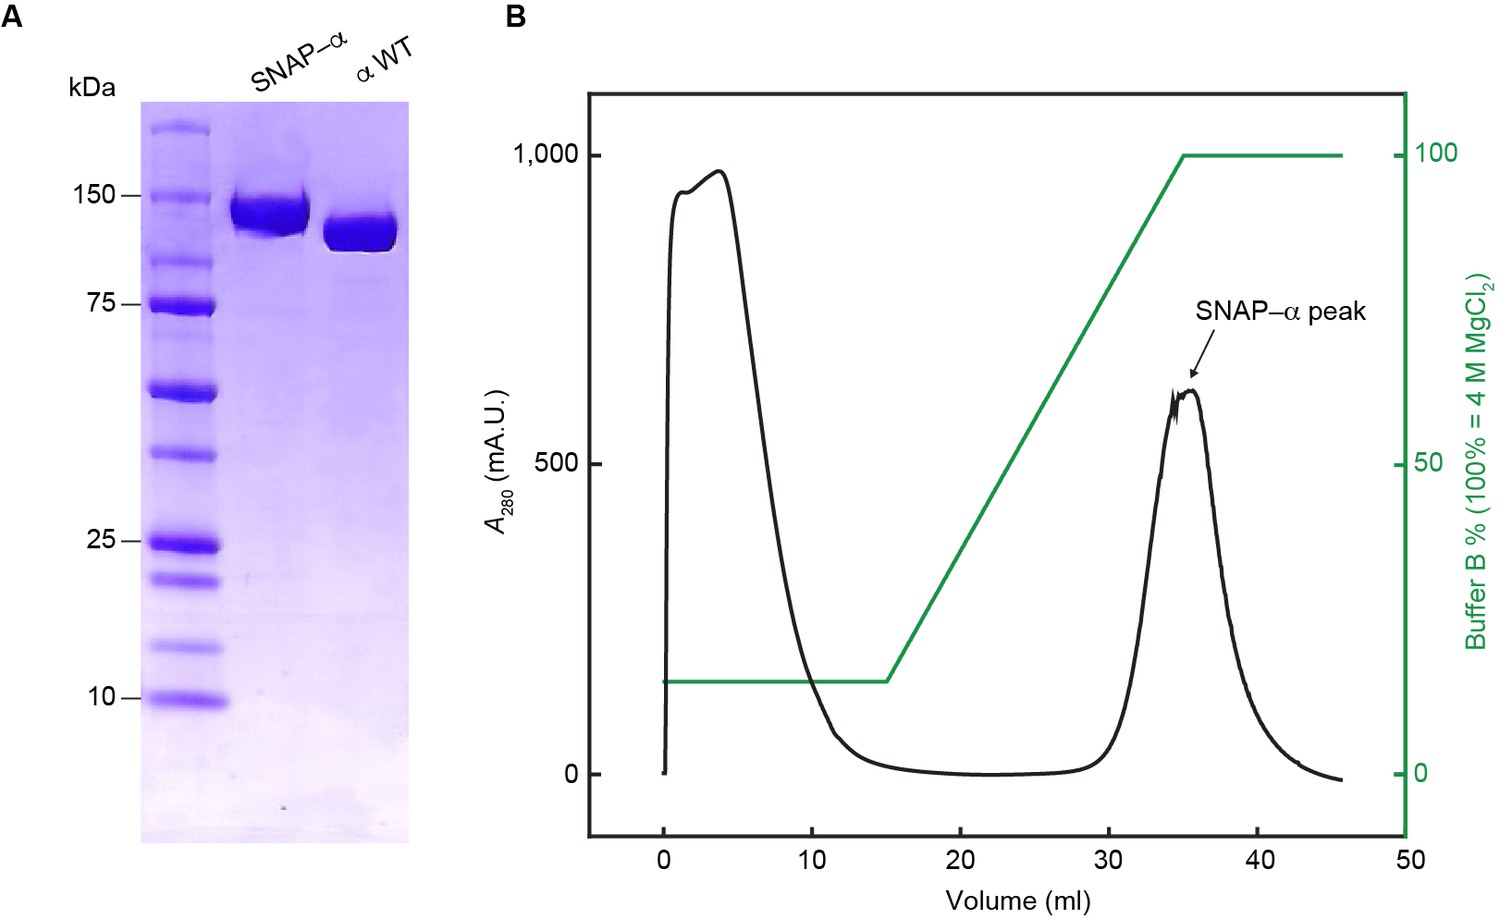
Separation of proteolytic fragments of SNAP-α from full-length SNAP-α.
(A) SDS-PAGE of the final fraction from the τC16 affinity chromatography, pooled from successive samples from the peak in the chromatography profile in (B).
Figure 2—figure supplement 3
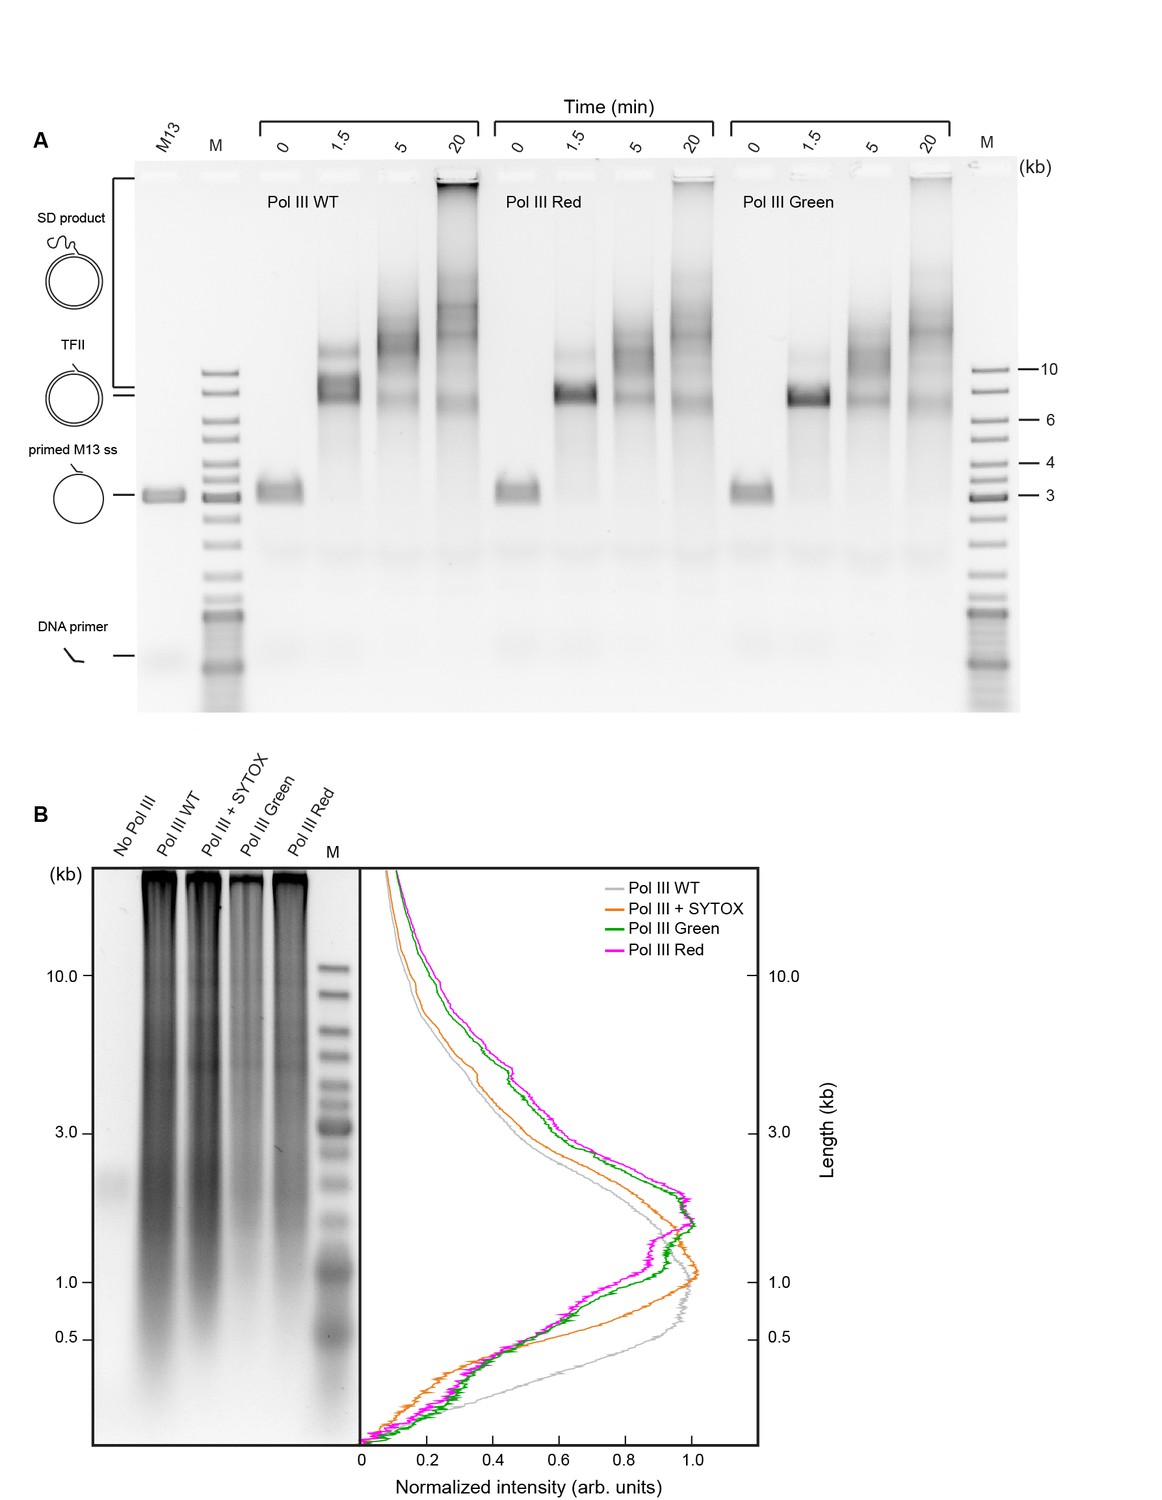
Comparison of activities of wild-type and SNAP-labeled Pol III cores.
(a) Agarose gel of products of Pol III strand-displacement (SD) DNA synthesis, a demanding assay for Pol III* activity (Jergic et al., 2013). The time course of flap-primer extension on M13 ssDNA depicts products larger than unit length of dsDNA (TFII) generated by SD DNA synthesis. (B) Alkaline agarose gel of coupled DNA replication. Reactions were performed on a 2 kb circular dsDNA template with wild-type (WT) Pol III*, WT Pol III* + SYTOX orange, red SNAP-labeled Pol III* and green SNAP-labeled Pol III*. (Left panel) The gel was stained with SYBR-Gold. (Right panel) Intensity profiles of lanes 2–5 of the left panel. The Okazaki fragment size distribution is centered at 1.3 ± 0.4 kb. Intensity profiles have been corrected for the difference in intensity of different size fragments using the ladder as a standard.
Figure 2—figure supplement 4
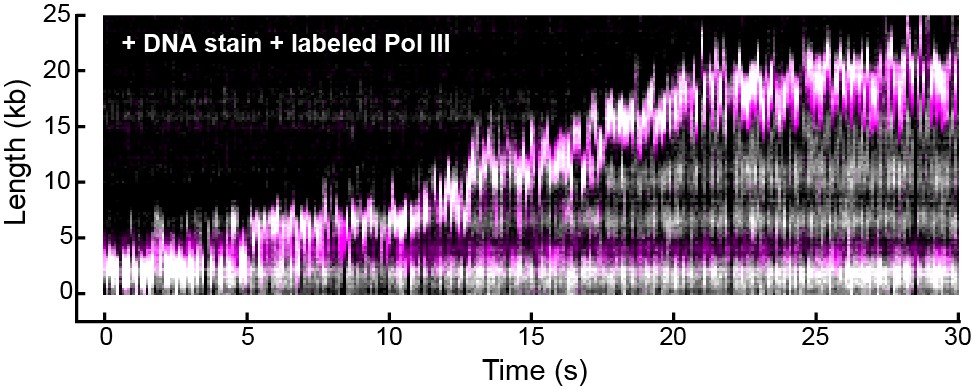
Representative kymograph of simultaneous staining of double-stranded DNA and fluorescence imaging of Pol III in real time.
Double-stranded DNA was stained with SYTOX orange (gray scale) and Pol III was labeled with a red fluorophore (magenta). The kymograph demonstrates the fluorescent spot corresponding to Pol III co-localizes with the tip of the growing DNA product (evident as a white spot) where the replication fork is located.
Figure 3 with 2 supplements
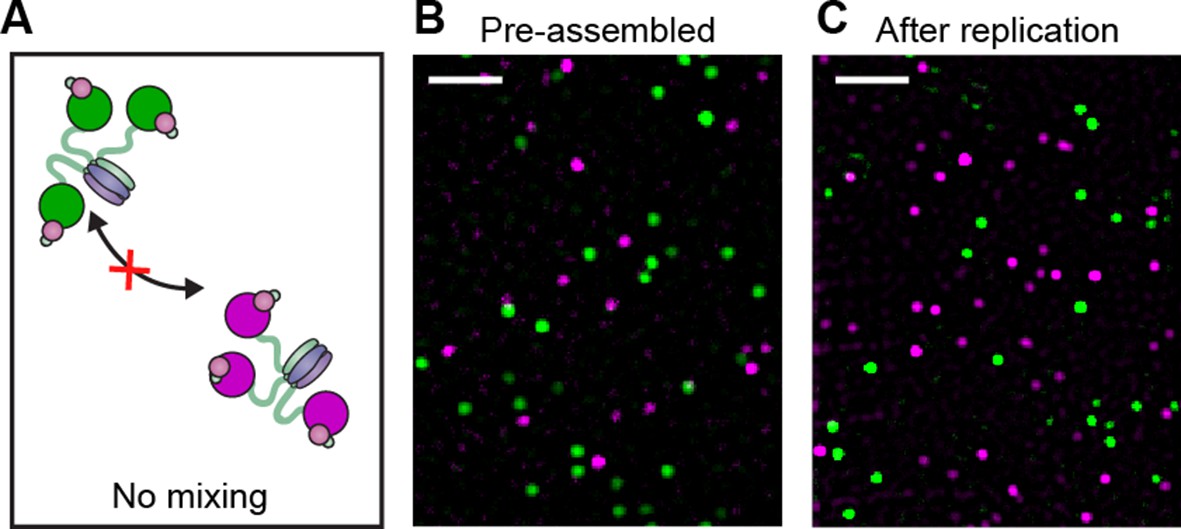
Pre-assembled Pol III* complexes do not exchange Pol III core.
(A) Red and green Pol III* are separately pre-assembled by treatment at 37°C for 15 min (30 nM Pol III core and 10 nM τ3-CLC). These are then mixed in equal ratios and kept at 37°C for 1 hr prior to dilution to 6 pM Pol III* for imaging. (B) Red Pol III* complexes and green Pol III* complexes do not co-localize to produce any white spots as seen in Figure 3—figure supplement 1, demonstrating the α–τ interaction within the Pol III* complex remains intact for the duration of the DNA replication assays. (C) Pre-assembled red and green Pol III* complexes that have participated in DNA replication (at 3.3 nM of each) do not co-localize, demonstrating that the Pol III cores within a Pol III* do not exchange with cores from other Pol III*s at the replication fork during active DNA synthesis. White scale bars represent 5 μm.
Figure 3—figure supplement 1
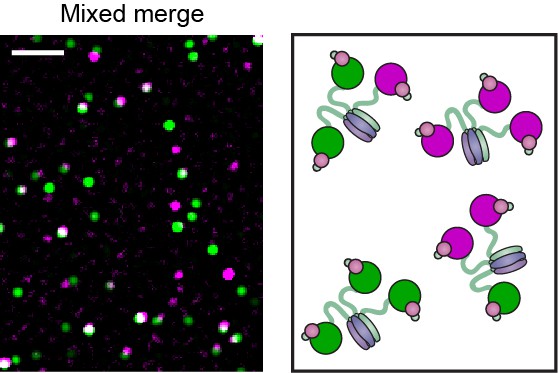
Pol III* complexes of mixed Pol III core composition (1:1) show co-localization.
(Right) Red and green Pol III cores are mixed before adding the CLC (30 nM Pol III core and 10 nM τ3-CLC). Pol III* is formed by treatment at 37°C for 15 min. Complexes are then allowed to equilibrate for 1 hr at 37°C prior to dilution to 6 pM for imaging. (Left) Red and green Pol III cores co-localize (white spots). White scale bar represents 5 μm.
Figure 3—figure supplement 2
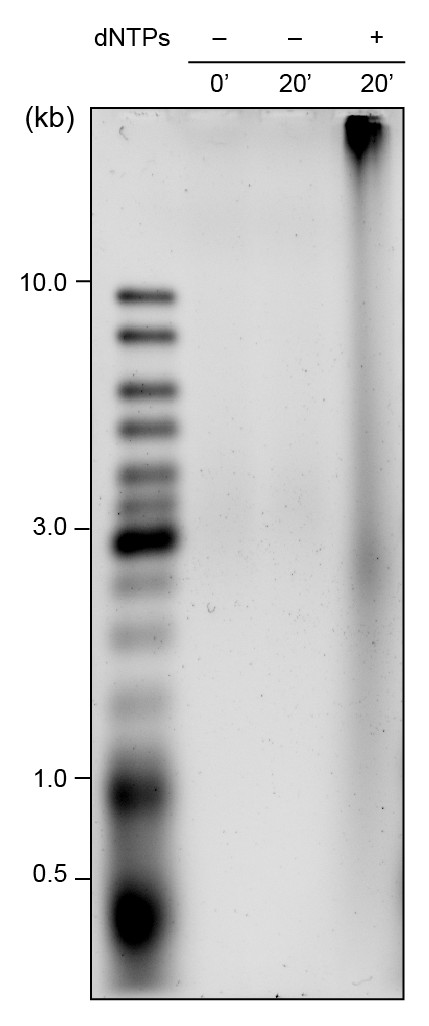
Alkaline gel showing leading- and lagging-strand products using pre-assembled red and green Pol III*s.
Reactions were performed on a 2 kb circular dsDNA template without dNTPs (lanes 1 and 2) and with dNTPs (lane 3). Lane 3 shows long leading strand and shorter lagging strand products are generated after 20 min; the leading strand products remain bound to beads in the well. The gel was stained with SYBR-Gold.
Figure 4 with 5 supplements
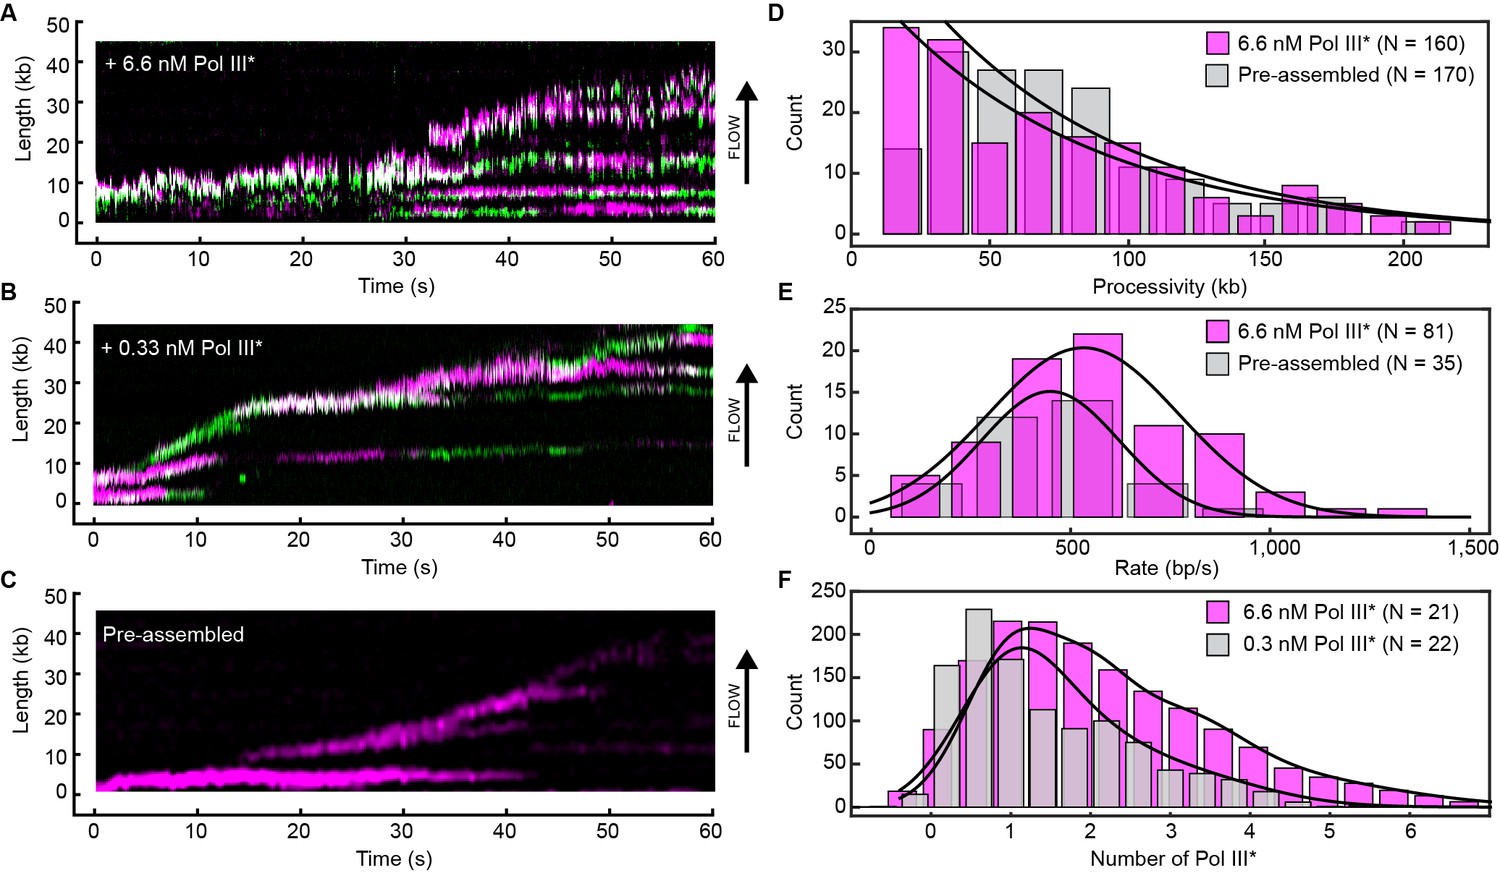
Rapid and frequent exchange of Pol III* is concentration dependent.
(A) and (B), Kymographs of the distributions of red Pol III* (magenta) and green Pol III* (green) on an individual DNA molecule at a total Pol III* concentration of 6.7 (A) or 0.3 nM (B). Co-localization of the two signals is shown as a bright white fluorescent spot. (C) Kymograph of a pre-assembled replisome containing red Pol III*. The intensity of the signal from the replisomal spot decreases after a Pol III* is left behind. It subsequently bleaches and the signal does not recover. (D) Histograms of the processivity of replication with Pol III* present in solution (73 ± 25 kb) and under pre-assembly conditions (76 ± 26 kb), each fit with a single exponential decay function. The errors represent the error of the fit. (E) Histograms of the rates of replication with Pol III* present in solution (561 ± 27 bp/s) and under pre-assembly conditions (445 ± 33 bp/s), each fit to a Gaussian distribution. (F) Histograms of the stoichiometry of Pol III* at the replication fork, fit to four (6.7 nM) or three (0.3 nM) Gaussians centered at integral numbers of Pol III* calculated from single Pol III core intensities (see Figure 4—figure supplement 4). The black lines represent the sums of these distributions. The errors in (E) and (F) represent the standard errors of the mean.
Figure 4—figure supplement 1
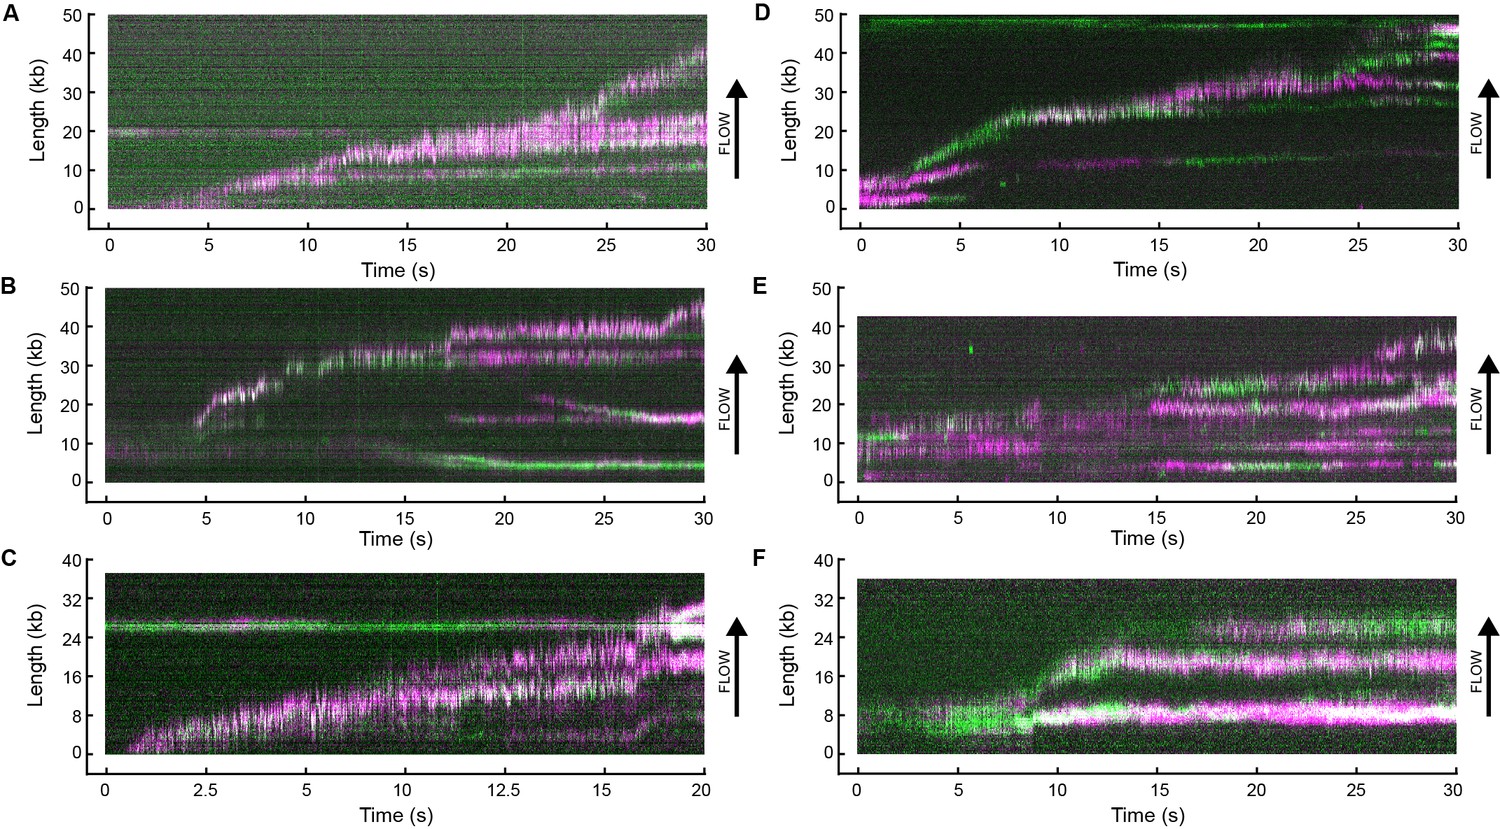
Example kymographs.
Kymographs of the distributions of red (magenta) and green Pol III* (green) on individual DNA molecules at a total Pol III* concentration of 6.7 (A–C) or 0.3 nM (D–F). Co-localization of the two signals is shown as a white fluorescent spot.
Figure 4—figure supplement 2
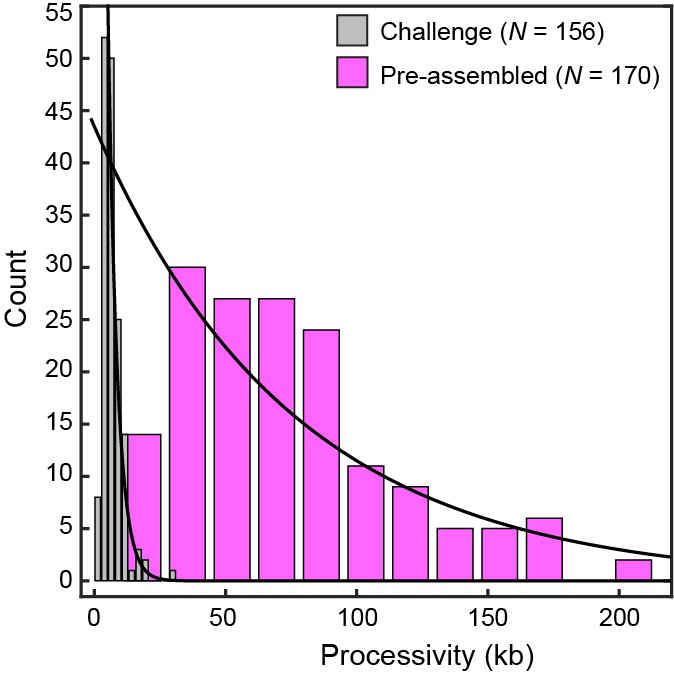
Processivity of replication challenged by Pol III core.
Histograms for conditions with pre-assembled replisomes (no polymerases in solution; processivity = 76 ± 26 kb) and under conditions where pre-assembled replisomes are challenged with 10 nM Pol III core (3.5 ± 0.6 kb), each fit with a single exponential decay function. The data show that actively replicating Pol III* can be easily displaced when challenged with entities that bind to the clamp, but cannot support coordinated leading and lagging strand synthesis. The errors represent the errors of the fit.
Figure 4—figure supplement 3
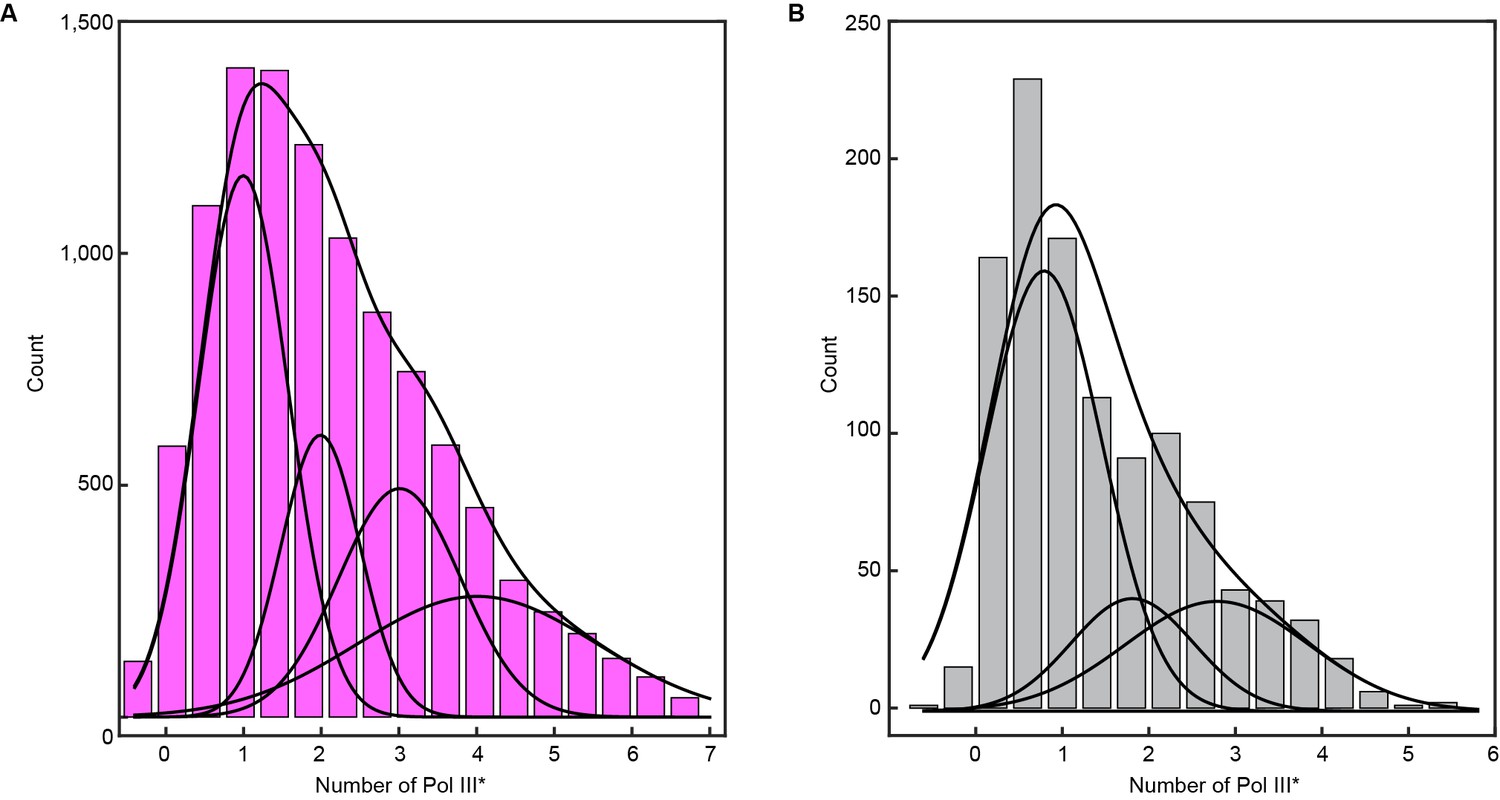
Histograms of the stoichiometry of Pol III* at the replication fork.
(A) Intensity distribution at 6.7 nM Pol III* and (B), intensity distribution at 0.3 nM Pol III*. The histograms are fit with sums of either four (6.7 nM) or three (0.3 nM) Gaussian distribution functions centered at integral numbers of Pol III*.
Figure 4—figure supplement 4
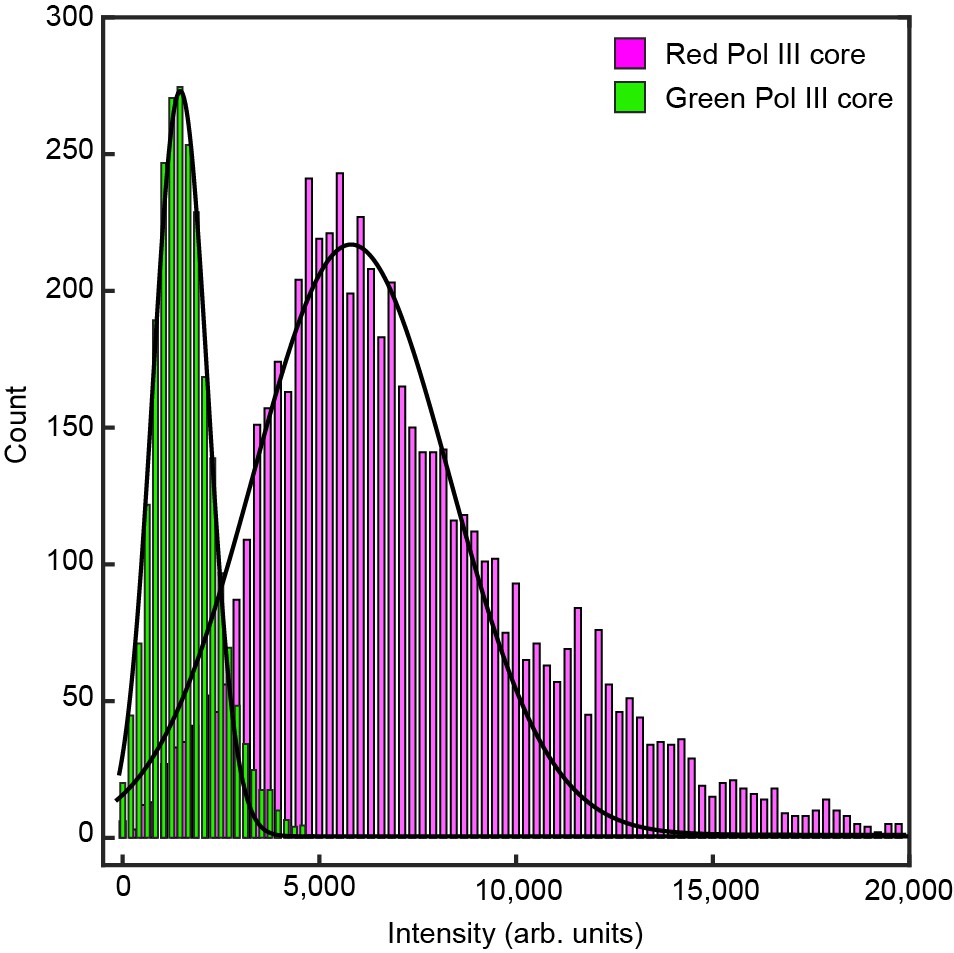
Histograms of the intensity distribution of single Pol III cores.
The histograms are fit with Gaussian distribution functions to give a mean intensity of 5100 ± 2000 for the red Pol III core and 1600 ± 700 for the green Pol III core. The errors represent the standard errors of the mean.
Figure 4—figure supplement 5
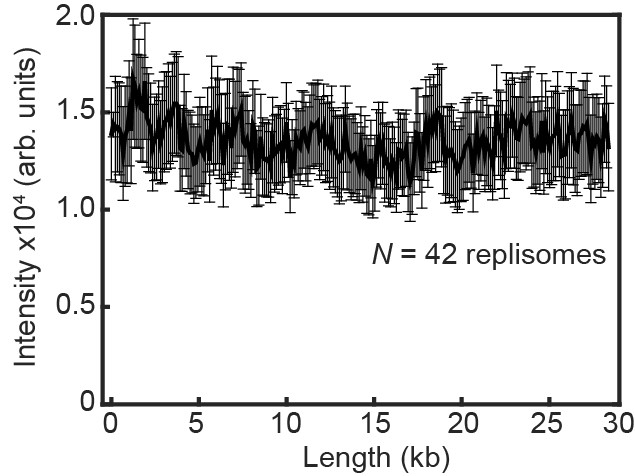
Fluorescence intensity of replicating Pol III* complexes does not change at longer DNA lengths under near-TIRF imaging conditions.
The fluorescence intensity of labeled Pol III* complexes does not change as a function of DNA length during single-molecule rolling-circle DNA replication under constant flow. The error bars represent the standard deviation from the mean.
Figure 5 with 1 supplement
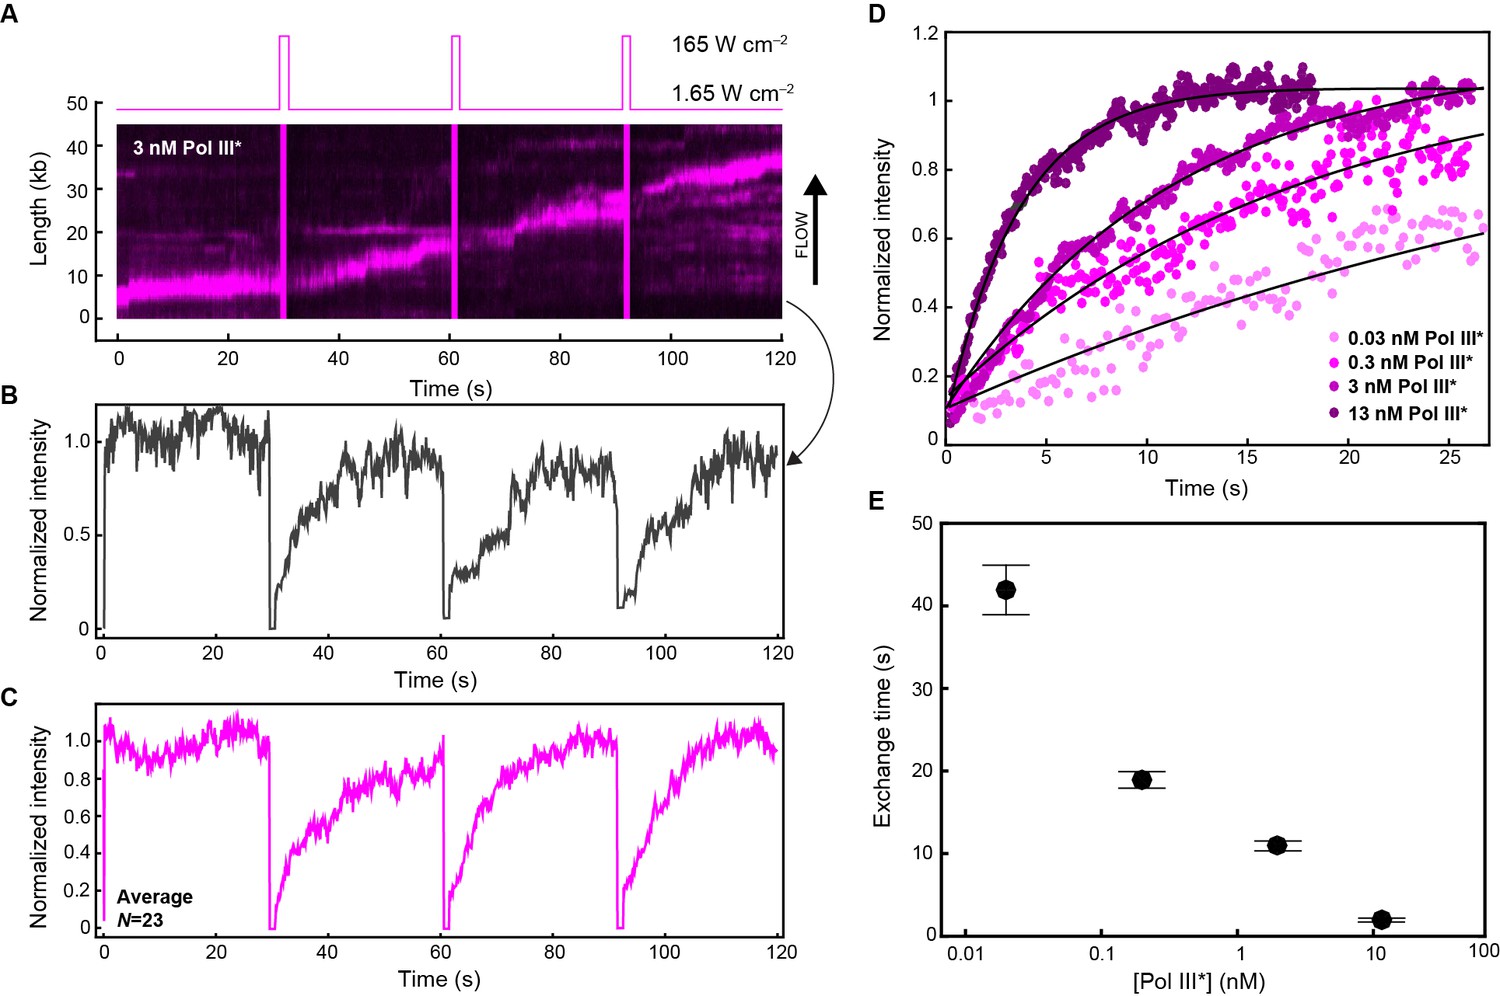
Quantification of Pol III* exchange time using single-molecule FRAP.
(A) (Top panel) Imaging sequence used during the FRAP experiments. Periodically, a FRAP pulse of high-laser power was used to rapidly photobleach all the Pol III* in the field of view. (Bottom panel) A representative kymograph of red Pol III*s at the replication fork. After each FRAP pulse (indicated by the magenta line), all Pol III*s have bleached, but the fluorescence intensity recovers as unbleached Pol III*s exchange into the replisome. (B) Normalized intensity over time for an individual replisome in the presence of 3 nM Pol III* in solution. (C) The average intensity over time from 23 replisomes with 3 nM Pol III* in solution. (D) The three recovery phases in (C) were averaged again to give the final averaged normalized intensity over time after a FRAP pulse. This curve was then fit to provide a characteristic exchange time. This was done for four concentrations of Pol III* ranging from 13 to 0.03 nM. (E) Exchange time as a function of Pol III* concentration.
Figure 5—figure supplement 1
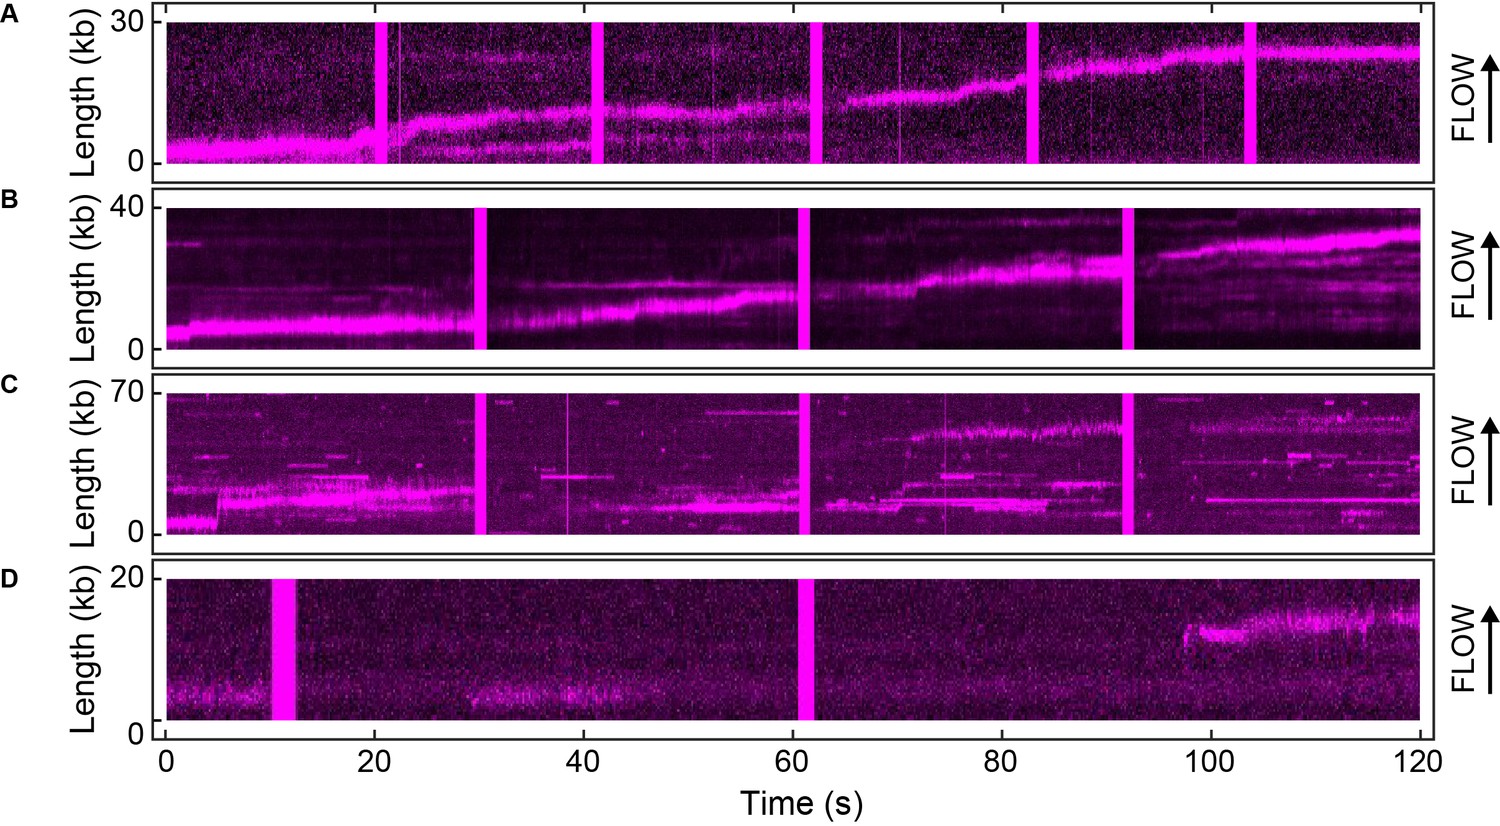
Example kymographs for the single-molecule FRAP experiments.
Kymographs of the distributions of red Pol III* (magenta) on individual DNA molecules at a total Pol III* concentration of 13 (A), 3 (B), 0.3 (C) and 0.03 nM (D).
Figure 6 with 3 supplements
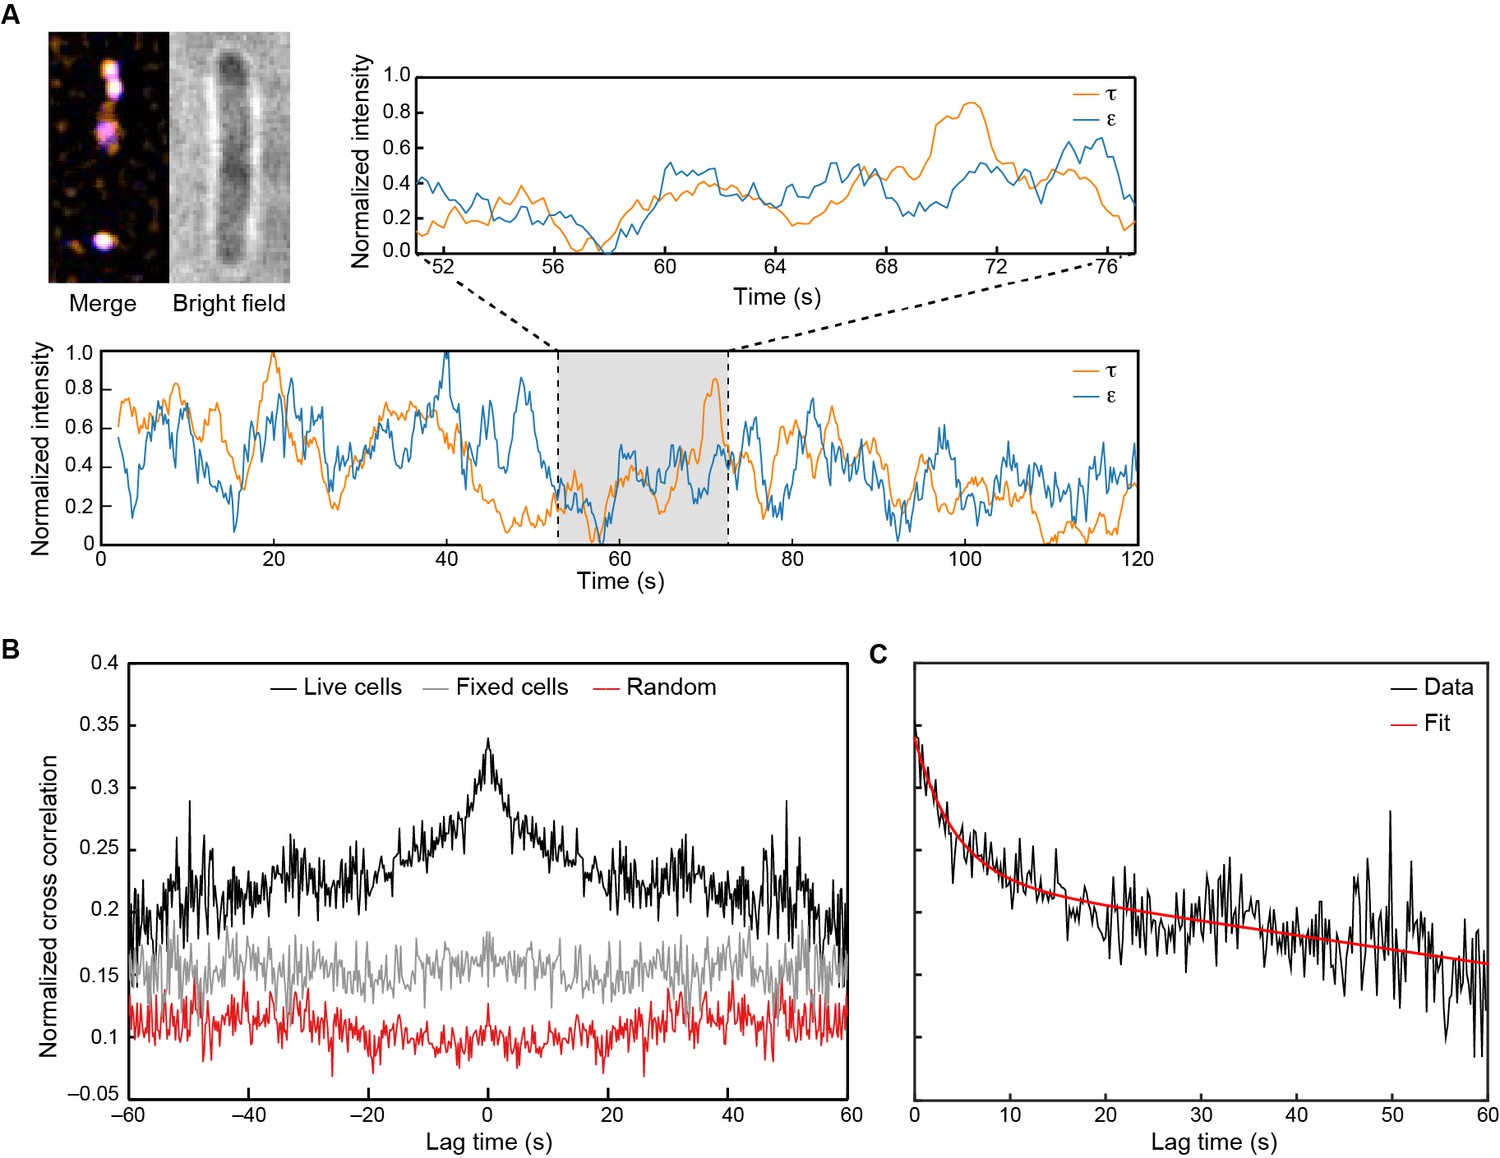
Visualization of Pol III* exchange in vivo.
(A) Left: image of τ (orange) and ε (blue) foci within a single E. coli cell, averaged over 40 s. Co-localization of the two signals is shown as a white spot. Middle: bright field image of the same cell. Right and below: fluorescence intensity of τ (orange) and ε (blue) over time. The trajectories are averaged using a 2 s moving average filter. (B) Averaged, normalized cross-correlation functions. The cross-correlation function of 1210 pairs of foci in living cells shows a clear positive peak (black line). The cross-correlation function for 297 pairs of foci in fixed cells (gray line) and the cross-correlation function of 1210 pairs of foci, randomized within the same field of view (red line) show no positive cross correlation. Cross-correlation functions have been vertically offset for clarity. (C) Exponential fit (red) to the cross-correlation function in (B). We obtained an exchange time scale of τ = 4 ± 2 s. The error represents the error of the fit.
Figure 6—figure supplement 1
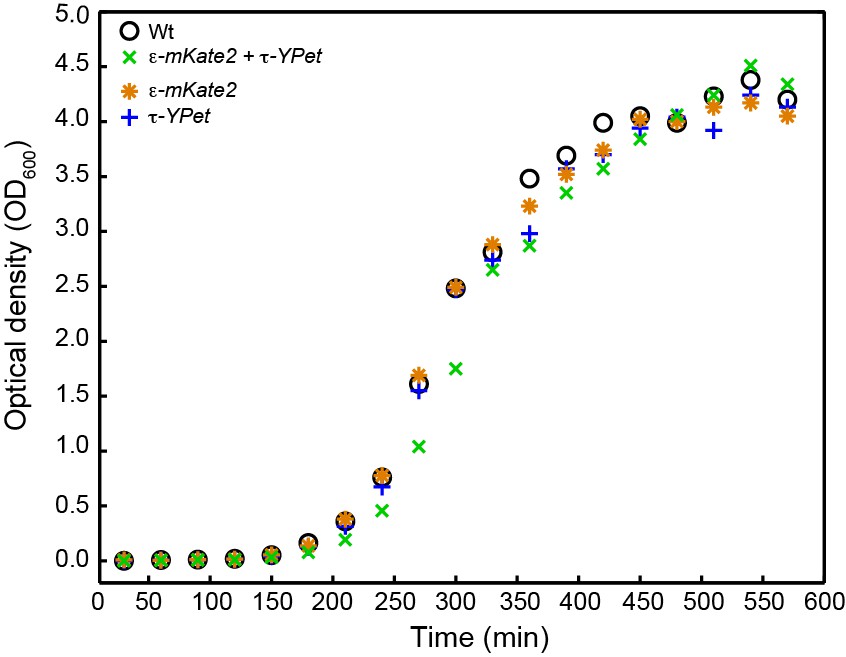
Growth curves for E. coli strains: wild-type E. coli (black), cells expressing both C-terminal derivatives of τ (dnaX-YPet) and ε (dnaQ-mKate2) subunits under control from their endogenous promoters (green), and cells expressing only dnaX-YPet (blue) and dnaQ-mKate2 (orange).
Growth curves were measured for 9.5 hr. The division times were obtained from a linear fit of the exponential growth phase. They are 33 ± 8 min for wild-type, 32 ± 5 min for dnaX-YPet, 32 ± 8 min for dnaQ-mKate2, and 33 ± 4 min for the double mutant. The errors represent the errors of the fit.
Figure 6—figure supplement 2
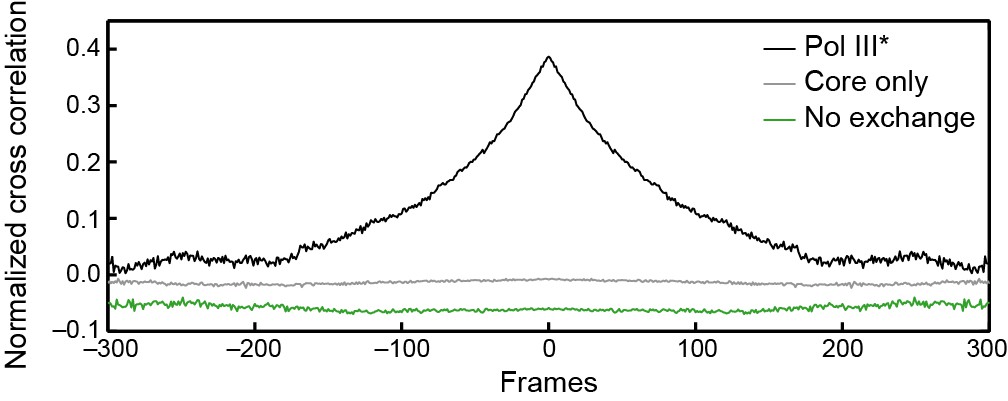
Cross-correlation analysis of simulated intensity trajectories for pairs of ε and τ foci.
Individual intensity trajectories for 300 ε and τ foci were simulated in MATLAB 2014b. The simulation allows us to set kon and koff (in units of frames–1) for ε exchanging into Pol III*, and kon and koff for Pol III* exchanging into the replisome. By changing these rate constants, we can simulate different exchange mechanisms. The black line represents the average cross-correlation function for Pol III* exchange (both ε and τ). Here, kon and koff for Pol III* were set to 0.01 and the rate constants for ε were set to kon = 1 and koff <<1 to simulate stable binding of core to Pol III*. A clear positive peak can be seen. The green line represents the average cross-correlation function for simulated trajectories without any exchange. Here, kon = 1 and koff<<1 for all rate constants, to simulate stable binding to the replisome. In this case, there is no positive cross correlation. The gray line represents the average cross-correlation function for core exchange. In this case kon = 1 and koff<<1 for Pol III* and kon and koff for ε were set to 0.01. Again, we do not observe a positive cross correlation. Cross-correlation functions have been vertically offset for clarity.
Figure 6—figure supplement 3
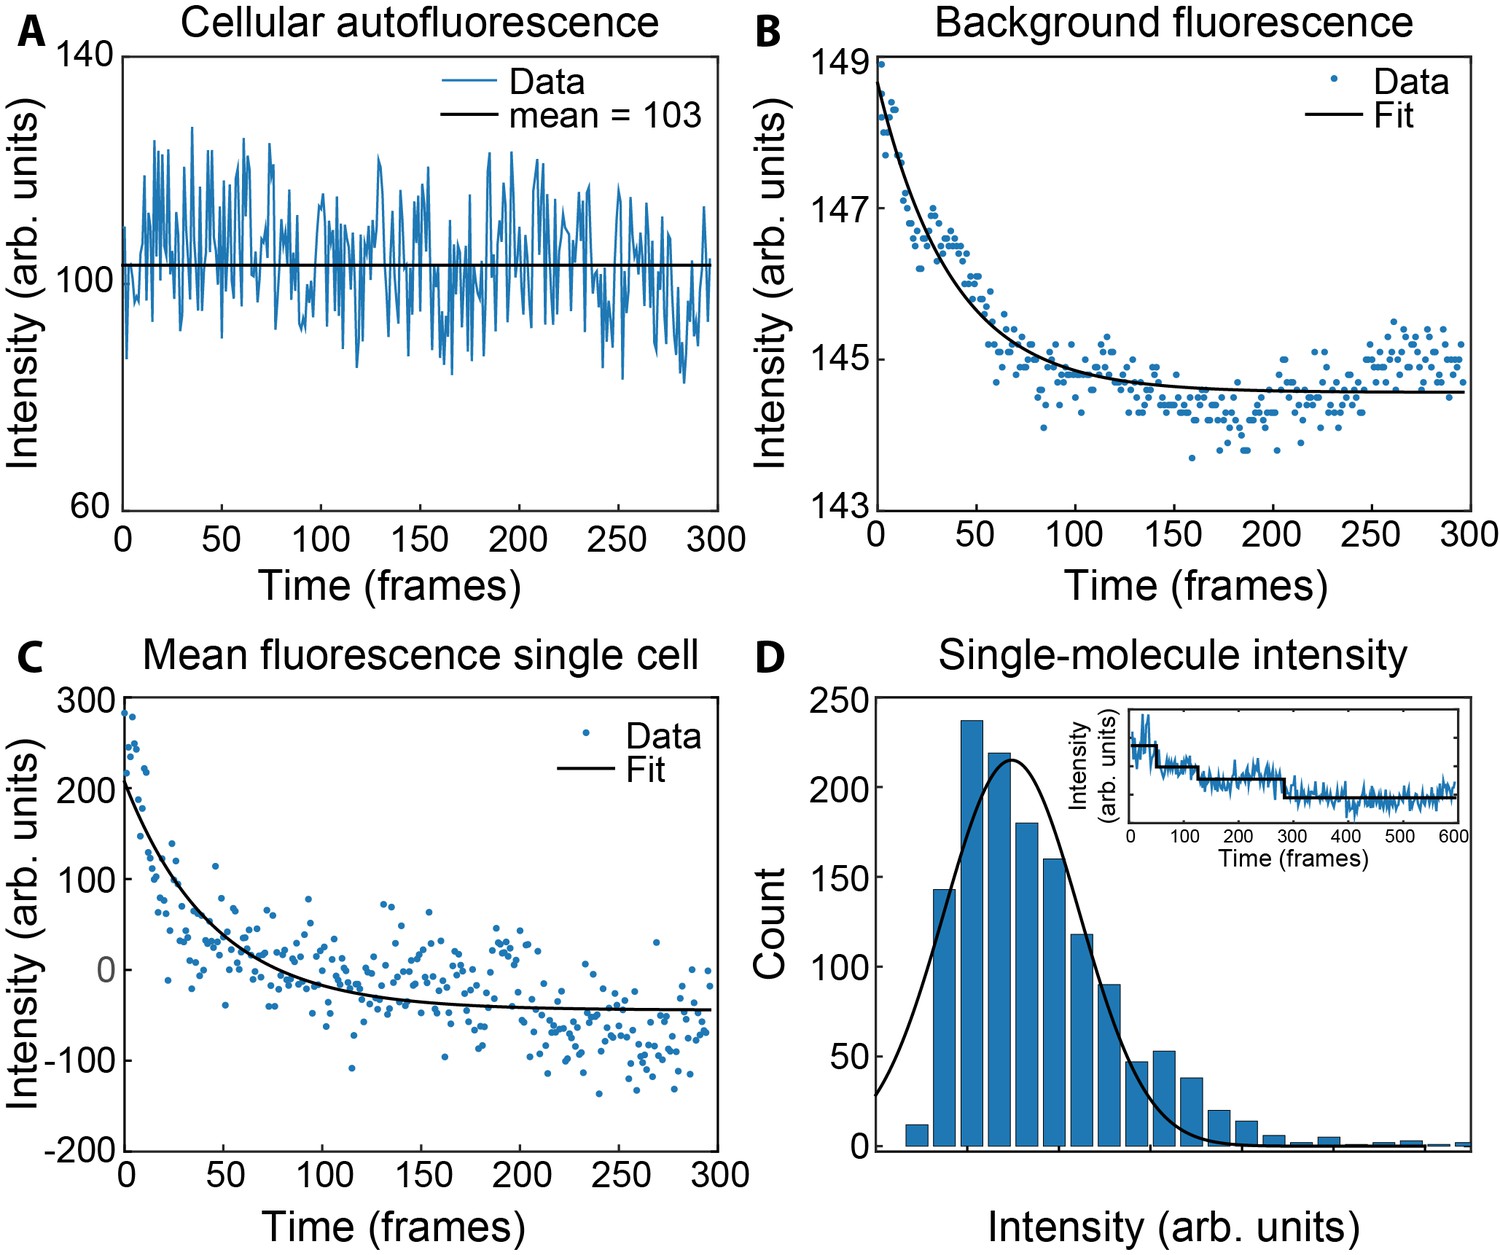
Measurement of concentrations of τ and ε in live cells.
(A) Mean fluorescence signal during photobleaching of wild-type MG1655. (B) Bleaching of the coverslip background signal within a single field of view. (C) Bleaching of ε-mKate2 fluorescence within a single cell, corrected for the cellular autofluorescence (A) and the background fluorescence of the coverslip (B). This was fit with a single exponential decay (black line) to determine the maximum intensity. (D) Histogram of the single-molecule intensities obtained from the change-point step-fitting algorithm (inset). This was fit to a Gaussian distribution to find the mean intensity of a single mKate2 molecule.
Videos
Video 1
Movie of red Pol III* (magenta) and green Pol III* (green) on an individual DNA molecule at a total Pol III* concentration of 6.7 nM.
This movie was used to generate the kymograph in Figure 4A.
Video 2
Movie of red Pol III* (magenta) and green Pol III* (green) on an individual DNA molecule at a total Pol III* concentration of 0.3 nM.
This movie was used to generate the kymograph in Figure 4B.
Download links
A two-part list of links to download the article, or parts of the article, in various formats.
Downloads (link to download the article as PDF)
Open citations (links to open the citations from this article in various online reference manager services)
Cite this article (links to download the citations from this article in formats compatible with various reference manager tools)
Single-molecule visualization of fast polymerase turnover in the bacterial replisome
eLife 6:e23932.
https://doi.org/10.7554/eLife.23932


