Inhibitor of ppGalNAc-T3-mediated O-glycosylation blocks cancer cell invasiveness and lowers FGF23 levels
- Carnegie Mellon University, United States
Figures
Figure 1 with 3 supplements

Screen for modulators of ppGalNAc-T2/T3.
(A) Diagram showing sensor design and the linker sequences used. O-glycosylation of the linker masks the furin site but if an inhibitor blocks the ppGalNAc-transferase then furin cleaves the linker releasing the blocking domain (BD) allowing fluorescent activating protein (FAP) dimerization and dye activation. Linker furin sites are underlined and sites of glycosylation or mutation are in bold. (B) HEK cell lines with or without ppGalNAc-T2 or T3 stably expressing the WT or ∆glycan T2 or T3 sensor constructs (see linkers in A) were imaged in the presence of 110 nM of the dye MG11p (MG) to detect GFP or MG. Bar = 20 µm. (C) Schematic showing cell plating, drug treatment, cell release, fluorescence measurement and parallel analysis using both T2 and T3 sensors. Hits that activate both may be pan-specific or act on off-target pathways common to both sensors whereas sensor specific hits are likely acting directly on the corresponding ppGalNAc-transferase. (D) The plot shows Q values (Q=(R-RNeg)/SDNeg) for each compound (treatment at 10 µM for 6 hr) using the average of duplicate MG/GFP ratios for the compound (R), the vehicle-only control (RNeg), and the standard deviation of the vehicle-only controls (SDNeg). The cut-off values of +3 and −2.5 are indicated (*). Also indicated are the values for the positive controls (T2∆glycan and T3∆glycan) and the structure of the indicated T3-specific hit (inset). (E) Values (% enzyme activity relative to vehicle-only controls) in the in vitro assay using purified ppGalNAc-T2 or T3 as a secondary screen are shown for 20 hits from the primary screen. Compounds were present at 50 µM. Compound 1614 is T3Inh-1.
-
Figure 1—source data 1
Primary screen data for HEK cells expressing T2 or T3 sensors.
The accompanying spreadsheet shows calculated Q values (see Methods) for each compound tested. Note that autofluorescent compounds are left blank.
- https://doi.org/10.7554/eLife.24051.004
-
Figure 1—source data 2
Secondary screen data (in vitro enzyme assays).
- https://doi.org/10.7554/eLife.24051.005
Figure 1—figure supplement 1
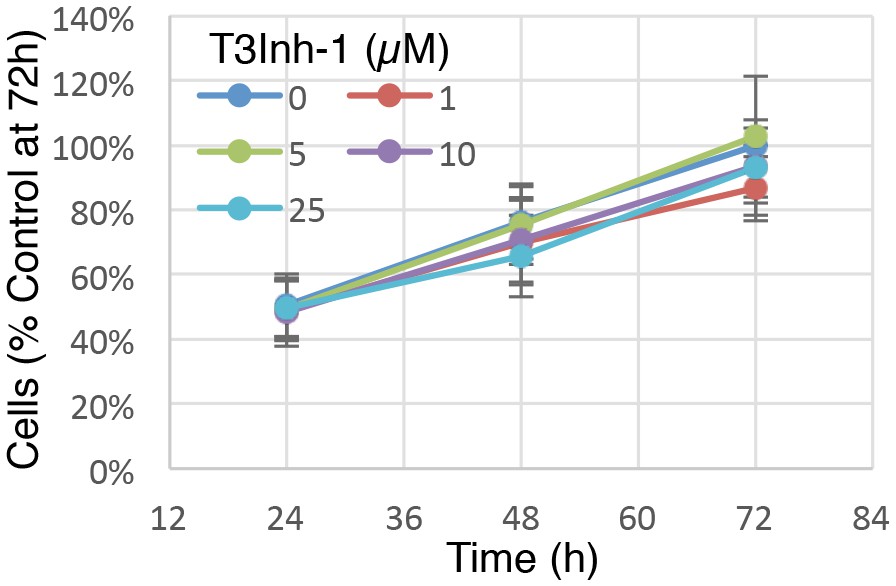
Cell growth at various T3Inh-1 exposures.
Identical numbers of HEK cells were plated and grown in the continuous presence of the indicated concentrations of T3Inh-1 and then at 24, 48, or 72 hr they were released and counted. Averages are shown normalized using the untreated sample at 72 hr (n = 3 ± SEM).
-
Figure 1—figure supplement 1—source data 1
Cell counts at differing time points and T3Inh-1 concentrations.
- https://doi.org/10.7554/eLife.24051.007
Figure 1—figure supplement 2
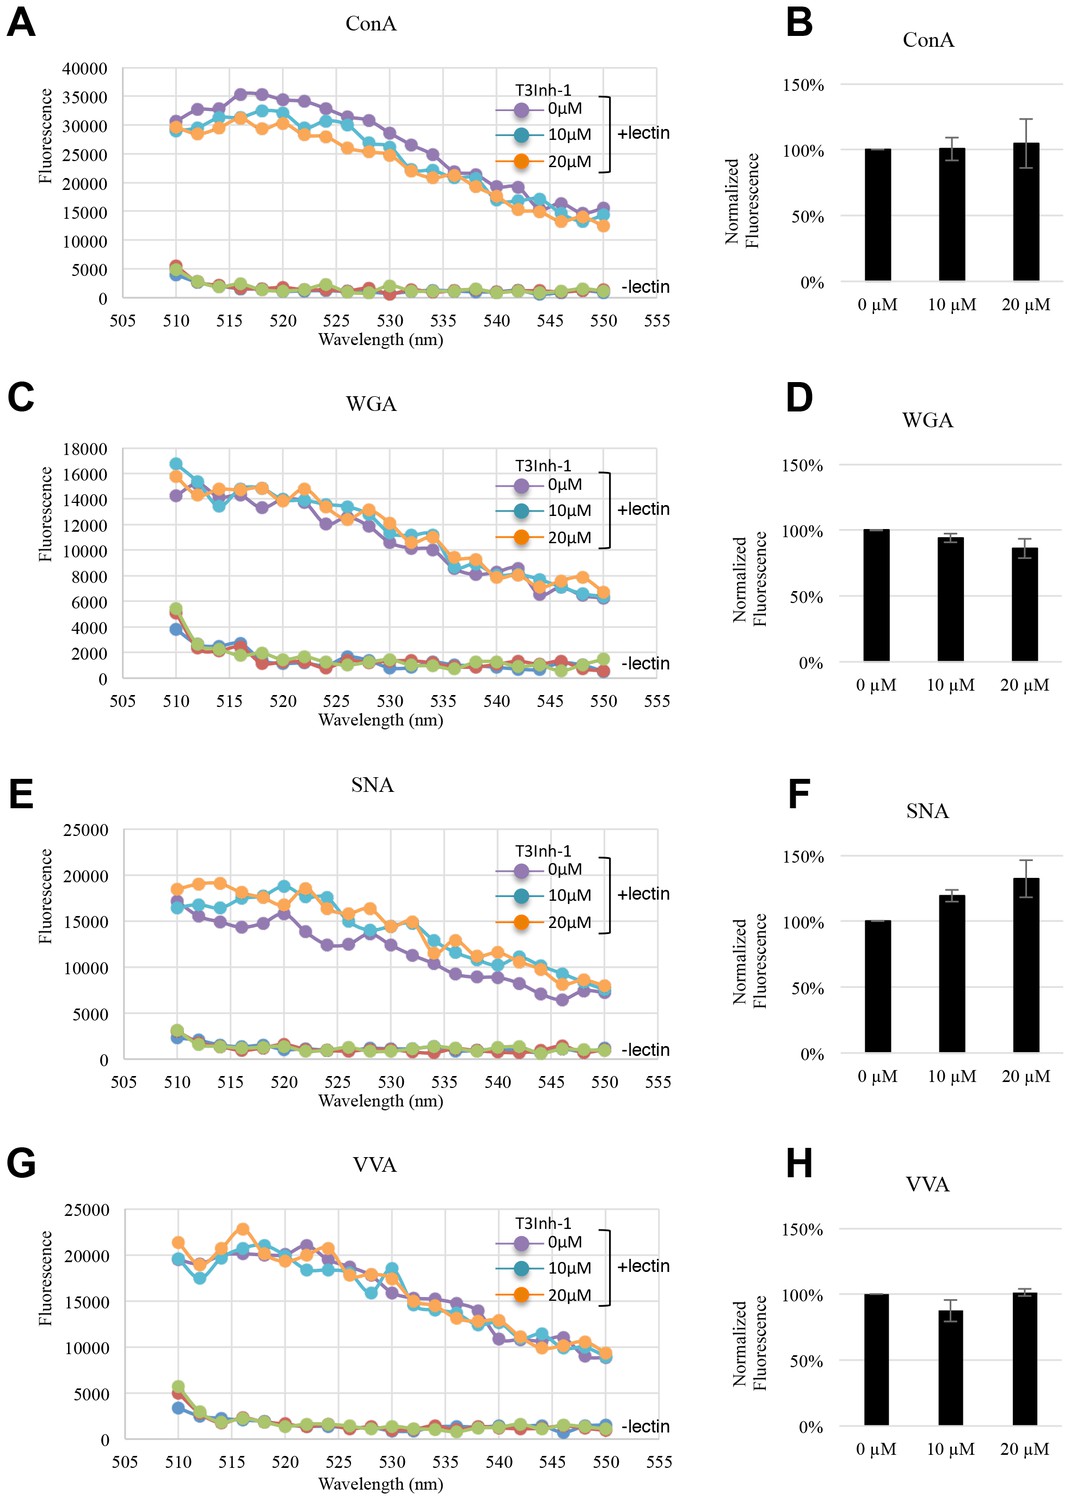
General N- and O-glycosylation are unaffected.
(A, C, E, G) Representative fluorescent emission spectra from 510–550 nm of lysates obtained from HeLa cells treated with T3Inh-1 for 24 hr at 0, 10, or 20 µM. The cells were stained with the indicated lectin for 30 min just prior to analysis. (B, D, F, H) Quantified average staining values for the indicated lectins (at 520 nm emission) and T3Inh-1 treatments (n = 3 ± SEM).
-
Figure 1—figure supplement 2—source data 1
Fluorescent lectin staining of cells at differing T3Inh-1 concentrations.
- https://doi.org/10.7554/eLife.24051.009
Figure 1—figure supplement 3
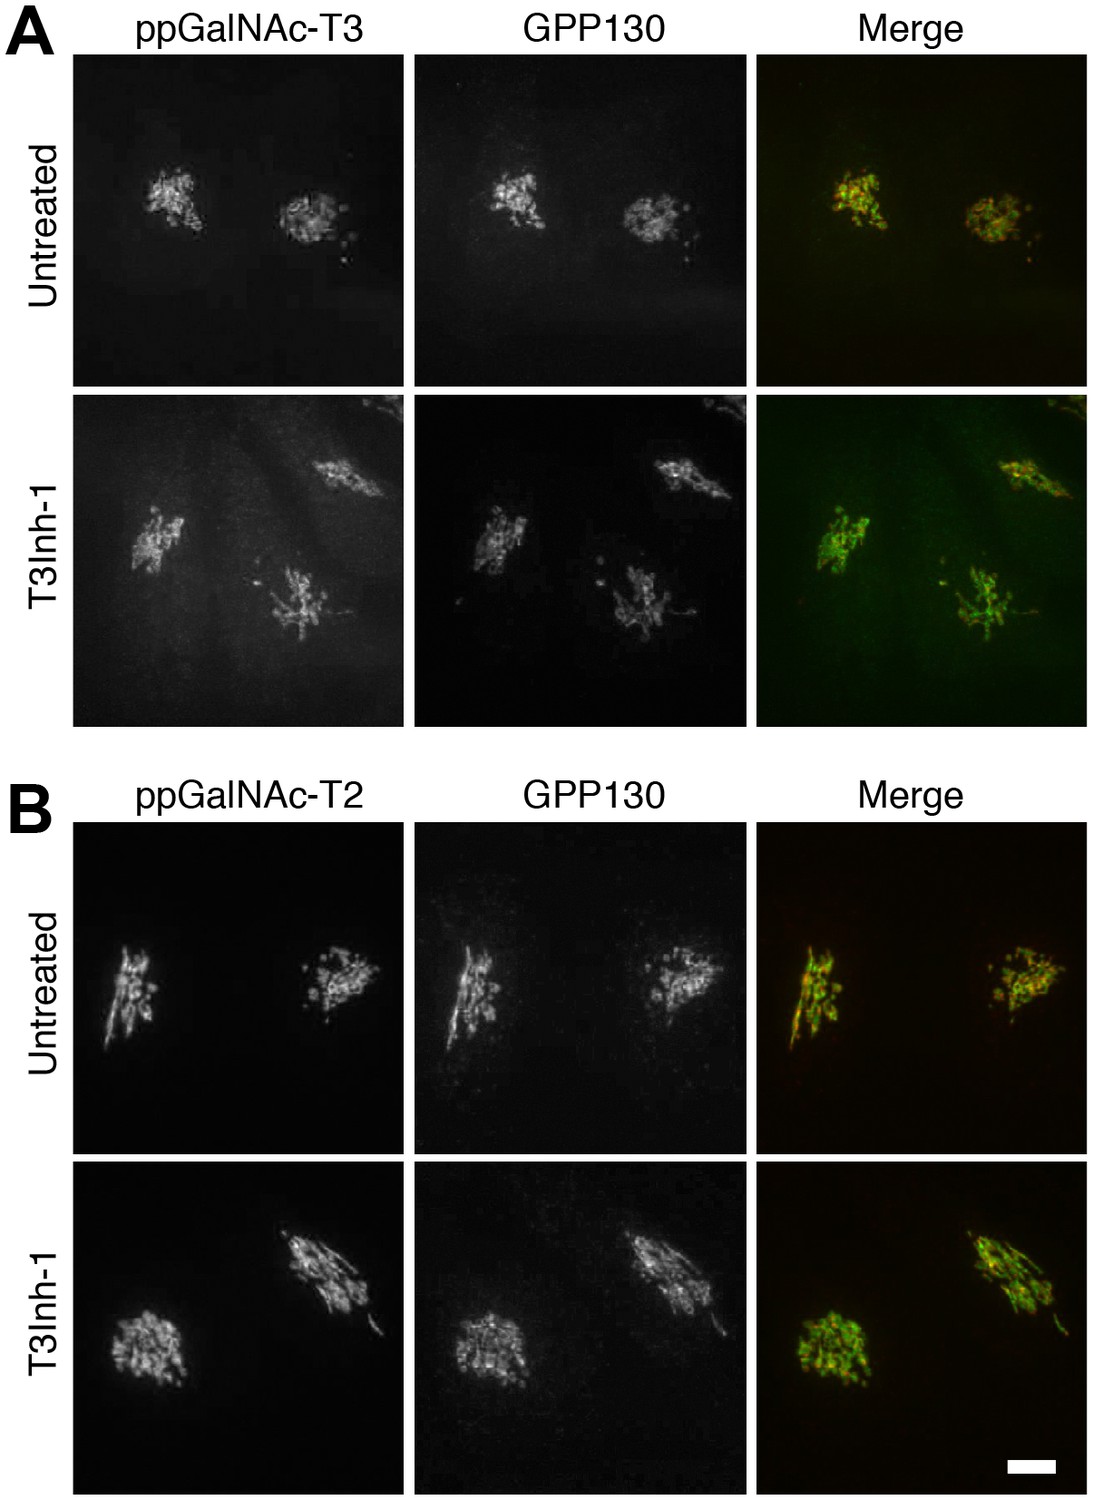
ppGalNAc-transferase levels are unaffected.
(A) Representative images of untreated or T3Inh-1 treated (6 hr, 10 µM) HeLa cells after fixation and staining with antibodies against the indicated ppGalNAc-transferase and the Golgi marker GPP130. Bar = 10 µm.
Figure 2
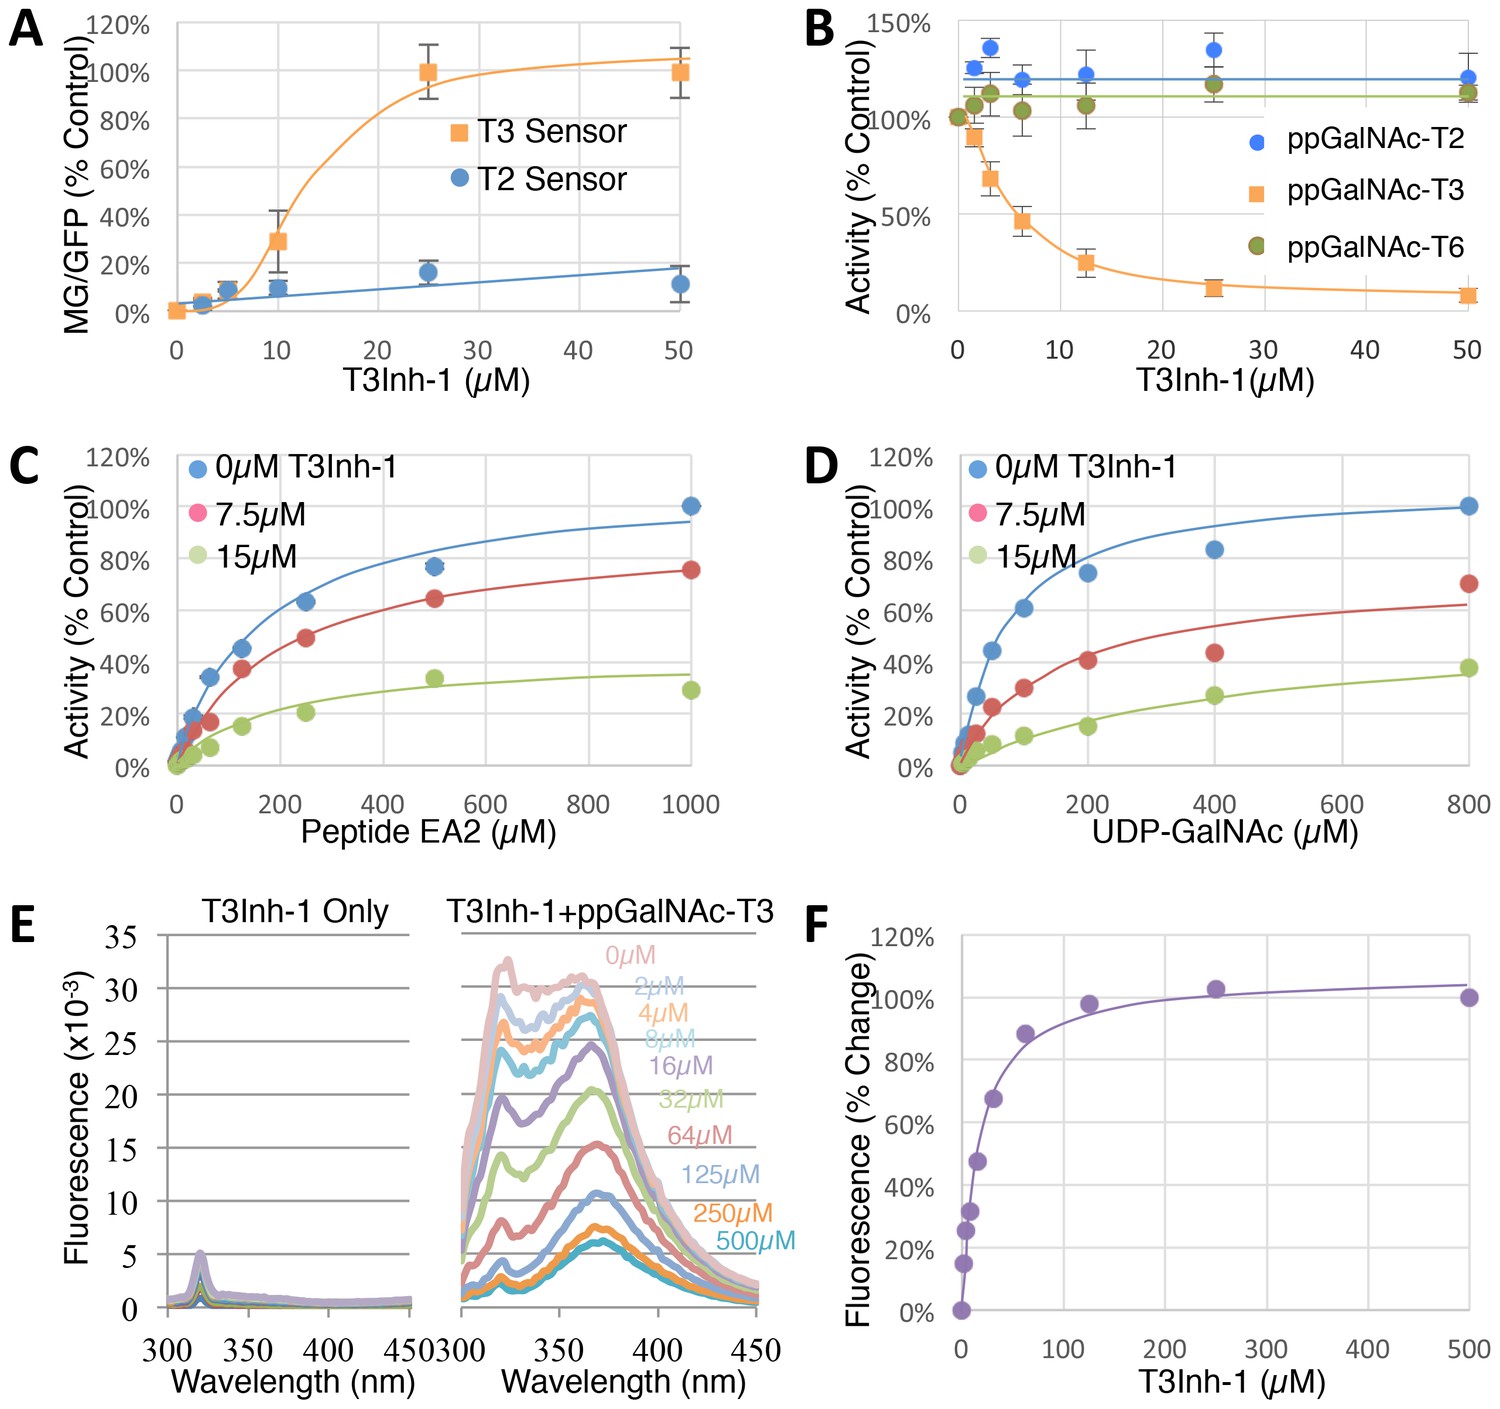
T3Inh-1 is a direct mixed-mode inhibitor of ppGalNAc-T3.
(A) Comparison of T2 and T3 sensor activation at the indicated concentrations of T3Inh-1 (n = 3 ± SEM). MG/GFP ratio was determined for 20,000 cells by FACS and average value is plotted as percent of the positive control (i.e. the ∆glycan version of each sensor). (B) Comparison of effect of the indicated concentrations of T3Inh-1 on in vitro glycosylation mediated by purified ppGalNAc-T2, ppGalNAc-T3, or ppGalNAc-T6. Values are averages expressed as percentage of the control ‘vehicle-only’ reactions (n = 6 ± SEM for ppGalNAc-T3, n = 3 ± SEM for others). (C–D) The in vitro assay was carried out in the presence of 0, 7.5, or 15 µM T3Inh-1 at the indicated concentrations of peptide or UDP-GalNAc substrate. Values are averages expressed as percent of the control reactions with no inhibitor and saturating substrates (n = 3 ± SEM). (E) Representative fluorescence spectra are shown for T3Inh-1 alone or for purified ppGalNAc-T3 in the presence of the indicated concentrations of T3Inh-1. Note dose-dependent quenching of tryptophan fluorescence indicating direct binding. (F) Fluorescence quenching was quantified at each concentration using the peak value at 324 nm (n = 3 ± SEM). Note that all graphs have error bars but some are too small to be apparent.
-
Figure 2—source data 1
Panel A: sensor signals versus T3Inh-1 concentration.
- https://doi.org/10.7554/eLife.24051.012
-
Figure 2—source data 2
Panel B: enzyme activity versus T3Inh-1 concentration.
- https://doi.org/10.7554/eLife.24051.013
-
Figure 2—source data 3
Panel C: inhibitor effect versus peptide concentration.
- https://doi.org/10.7554/eLife.24051.014
-
Figure 2—source data 4
Panel D: inhibitor effect versus UDP-GalNAc concentration.
- https://doi.org/10.7554/eLife.24051.015
-
Figure 2—source data 5
Panel E and F: Fluorescence change versus T3Inh-1 concentration.
- https://doi.org/10.7554/eLife.24051.016
Figure 3 with 1 supplement
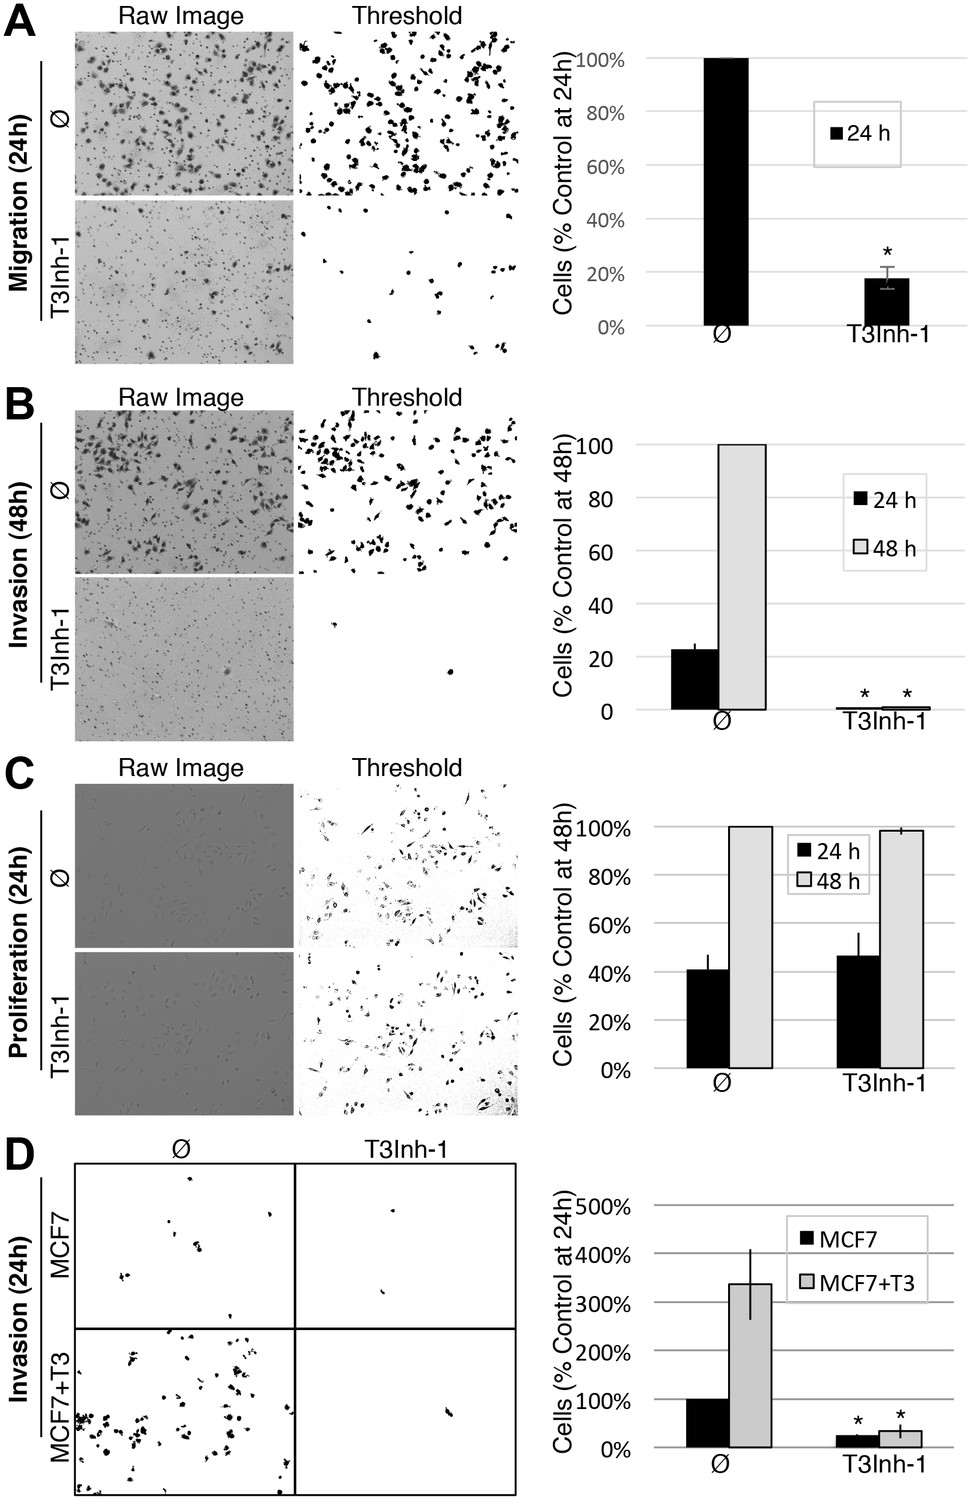
T3Inh-1 inhibits cell invasion.
(A) Cell migration through uncoated filters was determined for the MDA-MB231 breast cancer cell line grown in the absence or presence of 5 µM T3Inh-1. The raw image of the filter shows both cells and the filter holes whereas a size-cut off was used in the thresholded image to specifically visualize the cells. Results were quantified by counting cells that migrated to the underside of the filter and each experiment was normalized using the average determined for controls at 24 hr (n = 3 ± SEM). (B) Identical analysis except that the filters were pre-coated with Matrigel so that the assay measures invasion not just migration and the 48 hr control was used for normalization (n = 3 ± SEM). (C) MDA-MB231 proliferation was determined for cells grown in the presence or absence of 5 µM T3Inh-1 by cell counting at 24 or 48 hr. Representative images before and after thresholding (no size cutoff) are shown as well as quantification normalized by the value determined for untreated cells at 48 hr (n = 3 ± SEM). (D) Mock and ppGalNAc-T3 transfected MCF7 cells were plated on Matrigel-coated filters in the absence or presence of 5 µM T3Inh-1 for 24 hr. Thresholded images show cells on underside of filters. Cell counts are shown relative to untreated controls after normalization using the total number of cells (determined using parallel wells 24 hr post-plating). For all panels, asterisks denote p<0.05 (two-tailed Student’s t test) for untreated to T3Inh-1 comparison.
-
Figure 3—source data 1
Panel A: Cell counts in migration assay.
- https://doi.org/10.7554/eLife.24051.019
-
Figure 3—source data 2
Panel B: Cell counts in invasion assay.
- https://doi.org/10.7554/eLife.24051.020
-
Figure 3—source data 3
Panel C: Cell counts in proliferation assay.
- https://doi.org/10.7554/eLife.24051.021
-
Figure 3—source data 4
Panel D: Cell counts in MCF7 invasion assay.
- https://doi.org/10.7554/eLife.24051.022
Figure 3—figure supplement 1

Breast cancer survival as a function of ppGalNAc-T3 expression and ppGalNAc-T3 expression in cultured breast cancer cell lines.
(A–B) Kaplan-Meier curves compare overall survival (A) and metastasis-free survival (B) in patients with breast cancer between groups with high or low expression of ppGalNAc-T3. (C) Immunoblots of cell lysates from the indicated cell types [HEK, HEK∆T3 (edited to lack ppGalNAc-T3 expression), MDA-MB231, MCF7, and MCF7-T3 (transfected to overexpress ppGalNAc-T3)] using anti-ppGalNAc-T3 and anti-tubulin antibodies.
Figure 4 with 1 supplement

T3Inh-1 increases cleavage of FGF23.
(A) Immunoblot of media collected from cells after a 6 hr period in the presence of the indicated concentrations of T3Inh-1. HEK cells were transfected with FLAG-FGF23 and ppGalNAc-T3 or Myc-ANGPTL3 and anti-FLAG and anti-Myc antibodies were used to assay intact (*) and cleaved (<) FGF23 and ANGPTL3, respectively. The identity and origin of the unmarked band (at approximately 25kD) is unknown and its presence was variable. (B) Quantified results showing the percent ratio change of cleaved/intact FGF23 or ANGPTL3 normalized to the amount present in untreated controls (n ≥ 3 ± SEM). (C) Serum ELISA assay results showing ratio of cleaved/intact FGF23 in mouse sera collected 24 hr after either 1 or 2 (consecutive day) intraperitoneal injections of the indicated amount of T3Inh-1 (averages of 4 animals ±SEM). P-values are from two-tailed Student’s t test.
-
Figure 4—source data 1
Panel B: Cleaved/intact FGF23 and ANGPTL3 secreted at differing T3Inh-1 concentrations.
- https://doi.org/10.7554/eLife.24051.025
-
Figure 4—source data 2
Panel C: Cleaved/intact FGF23 in mouse serum after one two T3Inh-1 injections.
- https://doi.org/10.7554/eLife.24051.026
Figure 4—figure supplement 1
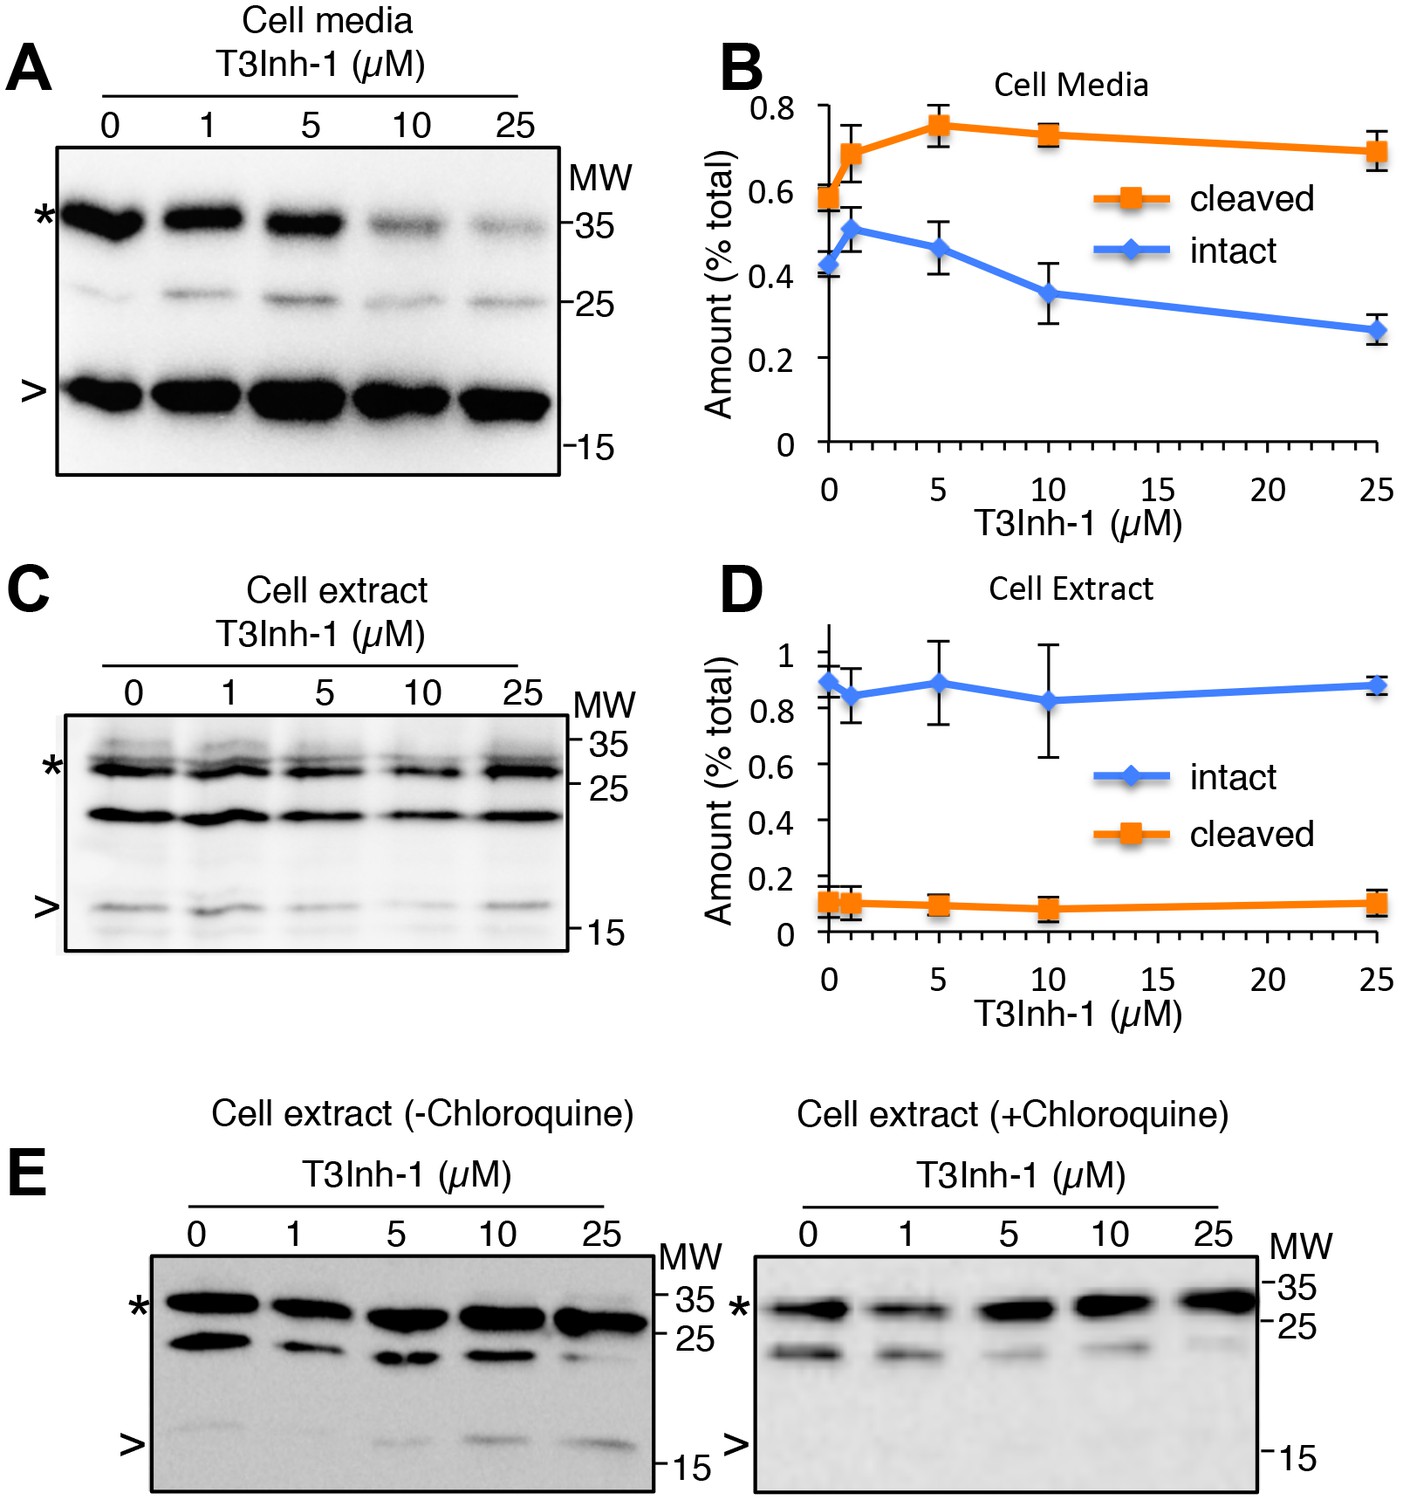
Secreted and cellular FGF23 after T3Inh-1 treatment.
(A) Shown is an additional representative blot (see Figure 4A) of recovery of intact (*) and cleaved (>) FGF23 in the media collected from cells after a 6 hr period in the presence of the indicated concentrations of T3Inh-1. Unmarked bands here and in panels C and D were considered background because they were absent for untransfected cells. (B) Quantified results for FGF23 in the media showing the relative amounts of each band (intact and cleaved) as a percent of the total (intact+cleaved for the untreated controls). Values are averages (n = 3 ± SEM). (C–D) These panels are identical to panels A and B except that cell extracts were analyzed rather than cell media. (E) Recovery of intact (*) and cleaved (>) FGF23 in HEK cell extracts from cells treated with the indicated concentrations of T3Inh-1 for 6 hr in the absence or presence of 100 μM chloroquine.
-
Figure 4—figure supplement 1—source data 1
Cleaved versus intact FGF23 secreted at differing T3Inh-1 concentrations.
- https://doi.org/10.7554/eLife.24051.028
Tables
Table 1
Inhibition by T3Inh-1 at varying substrate concentrations. Values shown were determined from the data in Figure 2 using Prism (see Materials and methods).
| Substrate | Parameter | 0 µM | 7.5 µM | 15 µM |
|---|---|---|---|---|
| Peptide (EA2) | Vmax | 100% | 82% | 36% |
| Km (µM) | 173.7 | 208.4 | 210.3 | |
| Ki (µM) | 9.9 | |||
| UDP-GalNAc | Vmax | 100% | 71% | 56% |
| Km (µM) | 74.9 | 153.4 | 448.3 | |
| Ki (µM) | 2.9 | |||
Download links
A two-part list of links to download the article, or parts of the article, in various formats.
Downloads (link to download the article as PDF)
Open citations (links to open the citations from this article in various online reference manager services)
Cite this article (links to download the citations from this article in formats compatible with various reference manager tools)
Inhibitor of ppGalNAc-T3-mediated O-glycosylation blocks cancer cell invasiveness and lowers FGF23 levels
eLife 6:e24051.
https://doi.org/10.7554/eLife.24051


