Freezing suppression by oxytocin in central amygdala allows alternate defensive behaviours and mother-pup interactions
- Champalimaud Neuroscience Programme, Portugal
- New York University School of Medicine, United States
- Nathan Kline Institute for Psychiatric Research, United States
Figures
Figure 1
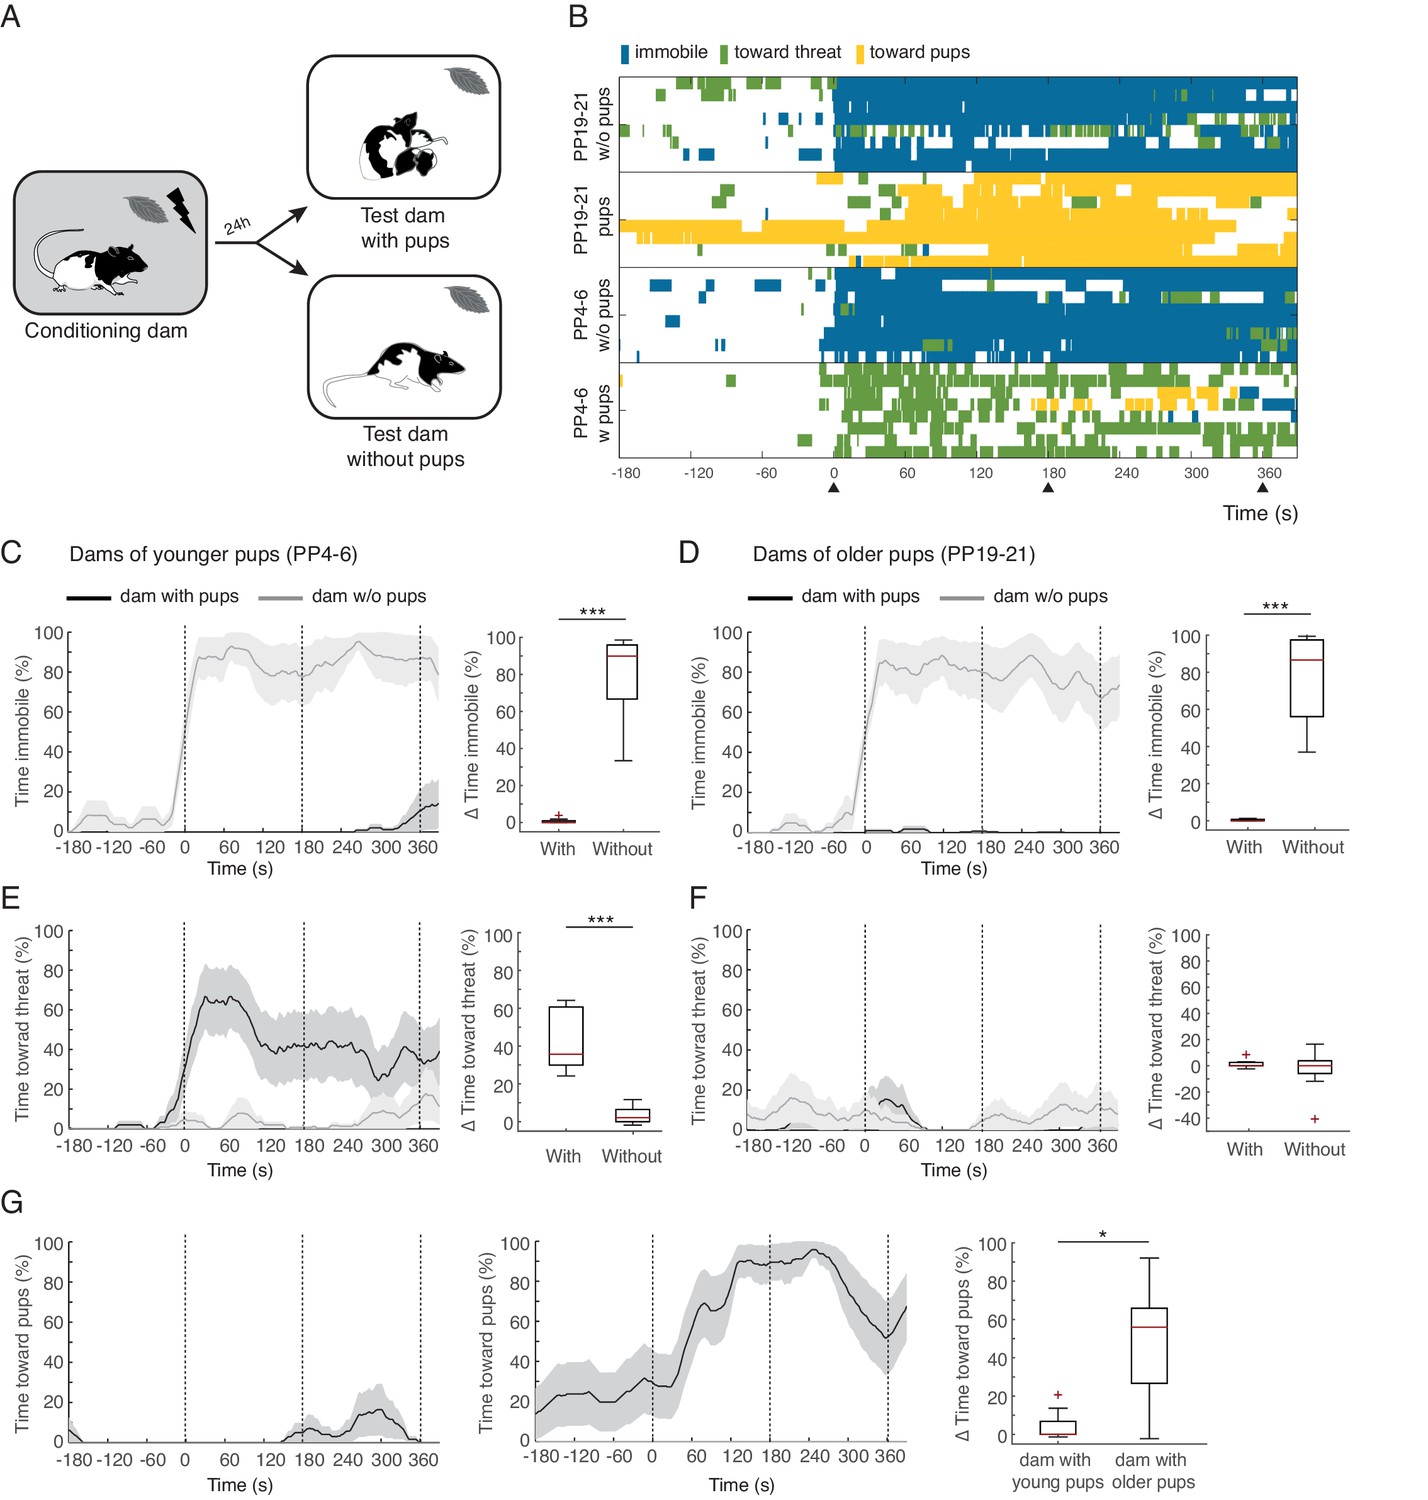
Rat dams suppress freezing when in the presence of their pups.
(A) Schematic of the experimental design. (B) Raster plot showing behaviors of dams during test to the conditioned odor. Each row corresponds to one dam. Dams are sorted by treatment, PP19-21 dams with (n = 8) and without pups (n = 8), PP4-6 dams with (n = 8) and without them (n = 8). Colors correspond to the behaviors exhibited. Black triangles indicate time of odor presentations. (C) and (D) Immobility of dams with and without pups for PP4-6 dams and PP19-21 dams, respectively. Line graph shows timecourse of immobility (average ± SEM). Vertical dashed lines indicate presentation of conditioned odor. Box plot shows change in immobility upon odor presentation (immobility after first odor – baseline). (E) and (F) same as C and D for responses targeted to the threat. G Same as C-F showing time spent in contact with the pups. Box plot here compares behavior of PP4-6 dams to PP19-21 dams. * denotes p<0.05 and ***, p<0.001.
Figure 2
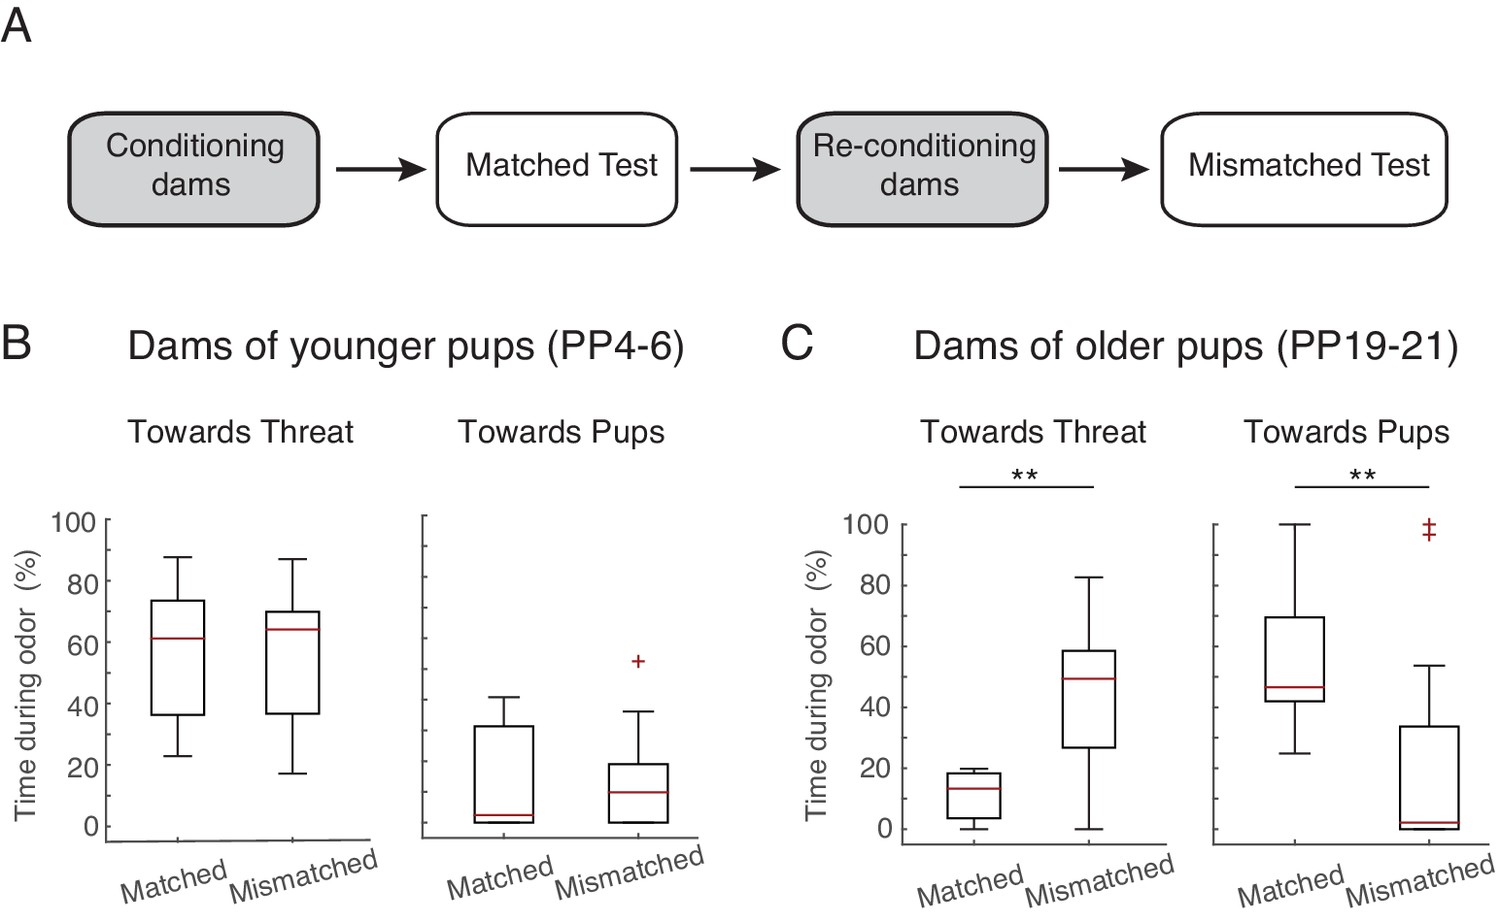
Maternal response is dependent on stage.
(A) Schematic of experimental design. Rat dams (PP4-6, n=10, PP19-21, n=12) were first exposed with their own pups (ex. PP4-6 pups), reconditioned, and then re-exposed to the threat in the presence of age mismatched pups (PP19-21 pups). (B) Box plots show time PP4-6 dams spent (after 1 st odor) behaving towards the threat (left) or pups (right) when in the presence of their own (matched, PP4-6 pups) and in the presence of PP19-21 pups (mismatched). (C) Same as in B for PP19-21 dams. ** denotes p<0.01.
Figure 3
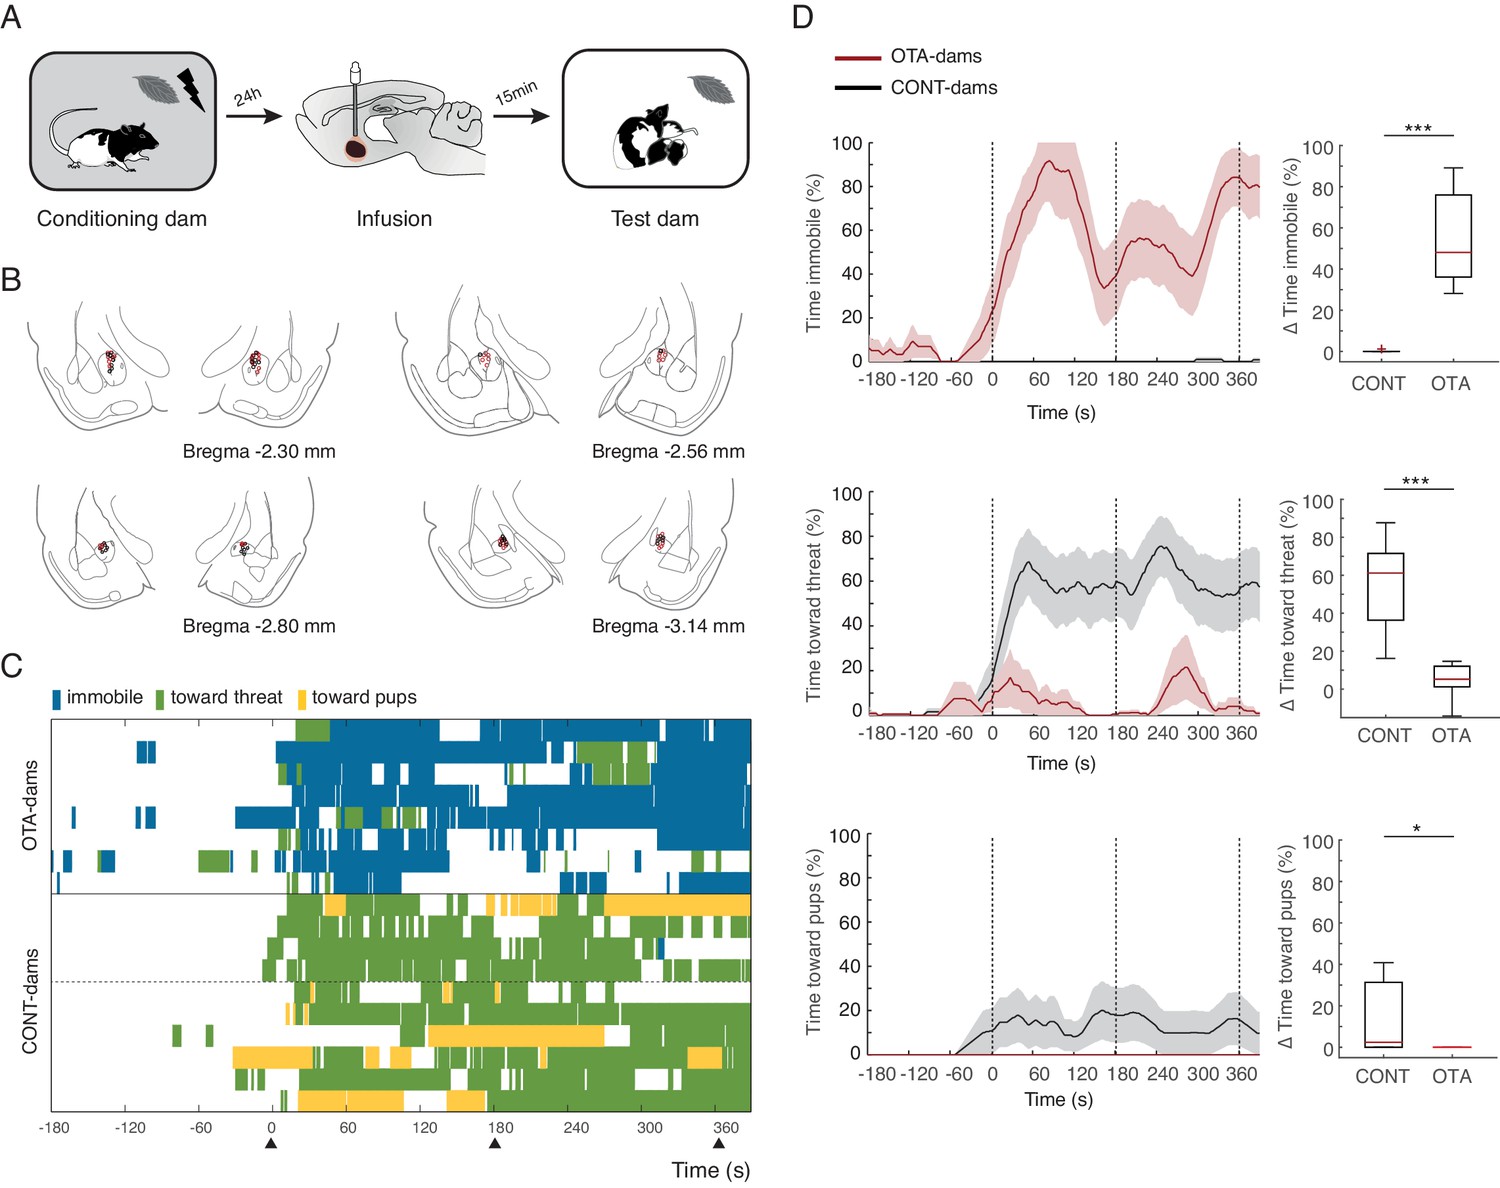
Freezing suppression by oxytocin in central amygdala in PP4-6 dams allows alternate maternal defensive behaviors and mother-pup interactions during threat.
(A) Schematic of experimental design. (B) Schematic of coronal sections (adapted from Paxino and Watson’s atlas) with empty black and red circles corresponding to CONT and OTA cannula placements, respectively. (C) Raster plot showing behaviors of PP4-6 dams during test to the conditioned odor. Each row corresponds to one dam. Dams are sorted by treatment; OXT antagonist (n = 8) or CONT (n = 10; four intact dams, above dashed line, and 6 PBS-dams, bellow dashed line). Colors correspond to behaviors exhibited. Black triangles indicate time of odor presentations. (D) Line graph shows timecourse of immobility (top), responses toward threat (middle) and toward pup (bottom) exhibited by either the OTA or CONT PP4-6 dams (average and ± SEM). Vertical dashed lines indicate presentation of conditioned odor. Box plots show change in these behaviors displayed by OTA and CONT dams upon odor exposure. * denotes p<0.05 and ***, p<0.001.
Figure 4

Freezing suppression by oxytocin in central amygdala in PP19-21 dams allows alternate maternal defensive behaviors and mother-pup interactions during threat.
(A) Schematic of experimental design. (B) Schematic of coronal sections (adapted from Paxino and Watson’s atlas) with empty black and red circles corresponding to PBS and OTA cannula placements, respectively. (C) Raster plot showing behaviors of PP19-21 dams during test to the conditioned odor. Each row corresponds to one dam. Dams are sorted by treatment; OXT antagonist (n = 7) or CONT (n = 17; 10 intact dams, above dashed line, and 10 PBS-dams, below dashed line; more dams belong to the control group because a subset was used for the transmission of fear from mother to pup experiment (Figure 5)). Colors correspond to behaviors exhibited. Black triangles indicate time of odor presentations. (D) Line graph shows timecourse of immobility (top), responses toward threat (middle) and toward pup (bottom) exhibited by PP19-21 dam that received OTA injections or CONT dams (average and ± SEM). Vertical dashed lines indicate presentation of conditioned odor. Box plots show change in these behaviors displayed by OTA and CONT dams upon odor exposure. *** denotes p<0.001.
Figure 5
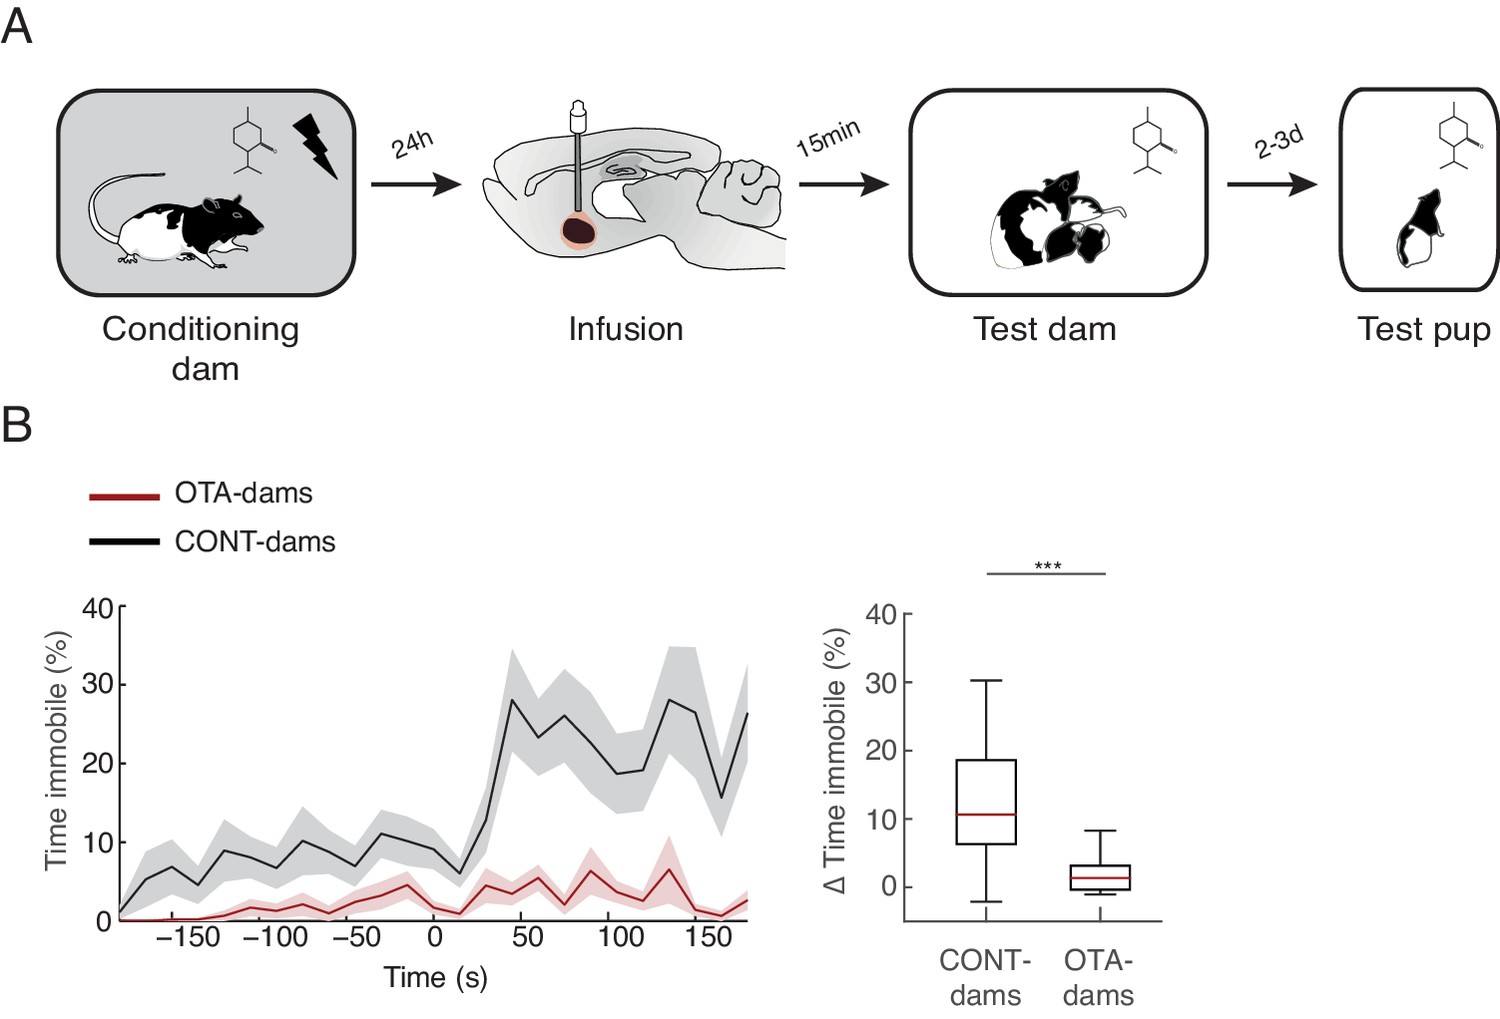
Transmission of fear from mother to pup.
(A) Schematic of the experimental design. PP19-21 pups were re-exposed to the odor alone 2–3 days after exposure with rat dam. (B) Line graph shows timecourse of immobility (average ± SEM) displayed by pups (from CONT-dams, n=21, nine from intact and 12 from vehicle infused dams; from OTA-dams, n=18) during the test to the conditioned odor. Vertical dashed lines indicate presentation of conditioned odor. Box plot shows change in immobility upon odor presentation (immobility after first odor – baseline). *** denotes p<0.001.
Videos
Video 1
Video clip taken during the test session, when conditioned dams were re-exposed to conditioned odor with and without pups (PP4-6 and PP19-21).
Video clip starts at the time of first odor delivery.
Download links
A two-part list of links to download the article, or parts of the article, in various formats.
Downloads (link to download the article as PDF)
Open citations (links to open the citations from this article in various online reference manager services)
Cite this article (links to download the citations from this article in formats compatible with various reference manager tools)
Freezing suppression by oxytocin in central amygdala allows alternate defensive behaviours and mother-pup interactions
eLife 6:e24080.
https://doi.org/10.7554/eLife.24080


