Phloem unloading in Arabidopsis roots is convective and regulated by the phloem-pole pericycle
- Washington State University, United States
- Technical University of Denmark, Denmark
- Oxford Brookes University, Headington, United Kingdom
- University of Edinburgh, United Kingdom
- University of Cambridge, United Kingdom
- University of Delaware, United States
Figures
Figure 1
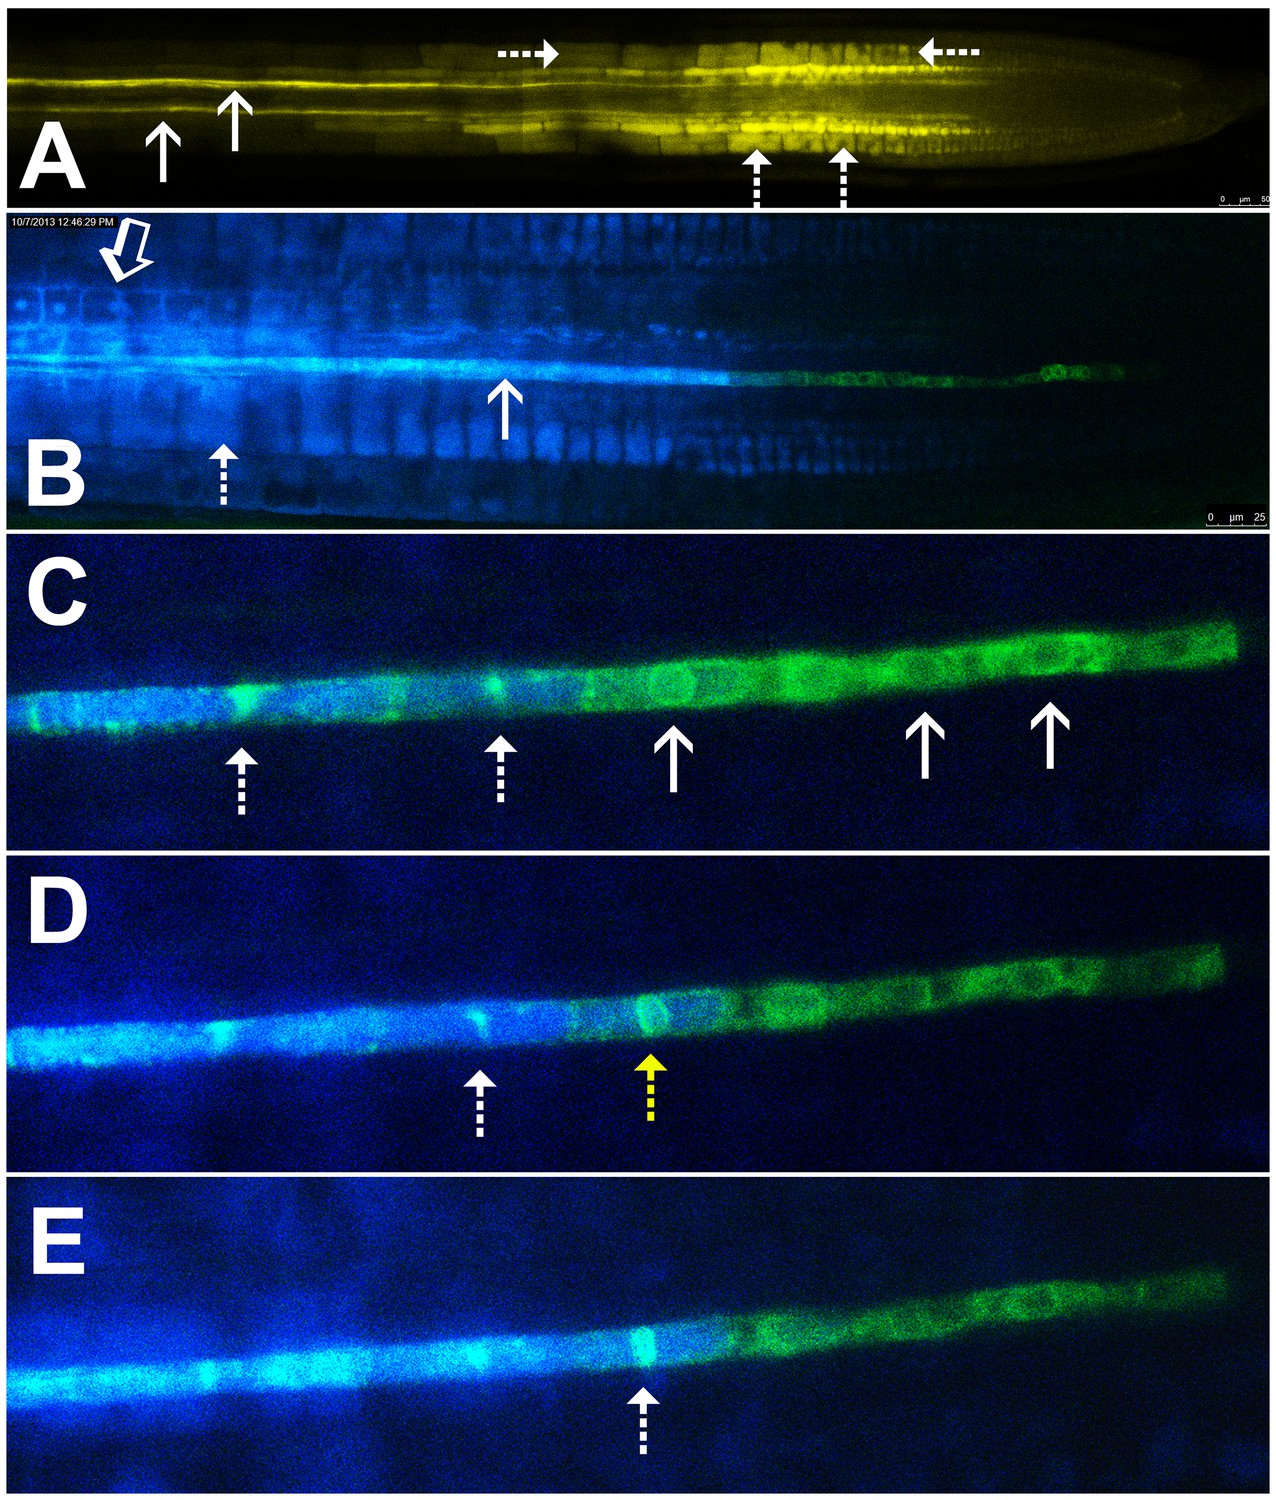
Symplastic unloading of phloem mobile probes.
(A) 2D optical section of unloading of CFDA in the root tip. The two protophloem files leading into the root tip are shown (solid arrows) and sequestration of CFDA into the vacuoles is apparent (dashed arrows). (B) Unloading of esculin (blue) in the root tip of a transgenic Arabidopsis line expressing GFP (green) targeted to the ER lumen of the PSE (pMtSEO2::GFP5-ER). Esculin escapes the protophloem file (solid arrow) into the cytoplasm of neighboring cells (open arrow). In contrast to CFDA, esculin is only sequestered in the vacuoles at high concentrations (dashed arrow). (C–E) Three frames extracted from Video 1. (C) GFP targeted to the ER lumen of PSEs demarcates the nuclear membrane of young sieve elements that have not yet been integrated into the unloading zone (solid arrows). Dashed arrows indicate two degrading nuclei in cells that are already filled with esculin (blue) (also for D and E). (D) Degradation of the nucleus (yellow arrow) coincides with the opening of the sieve-plate pores, allowing esculin (blue) to enter the cell. This defines the new PSE zero. (E) As nuclear degradation continues, the sieve element becomes an integral member of the phloem unloading zone.
Figure 2
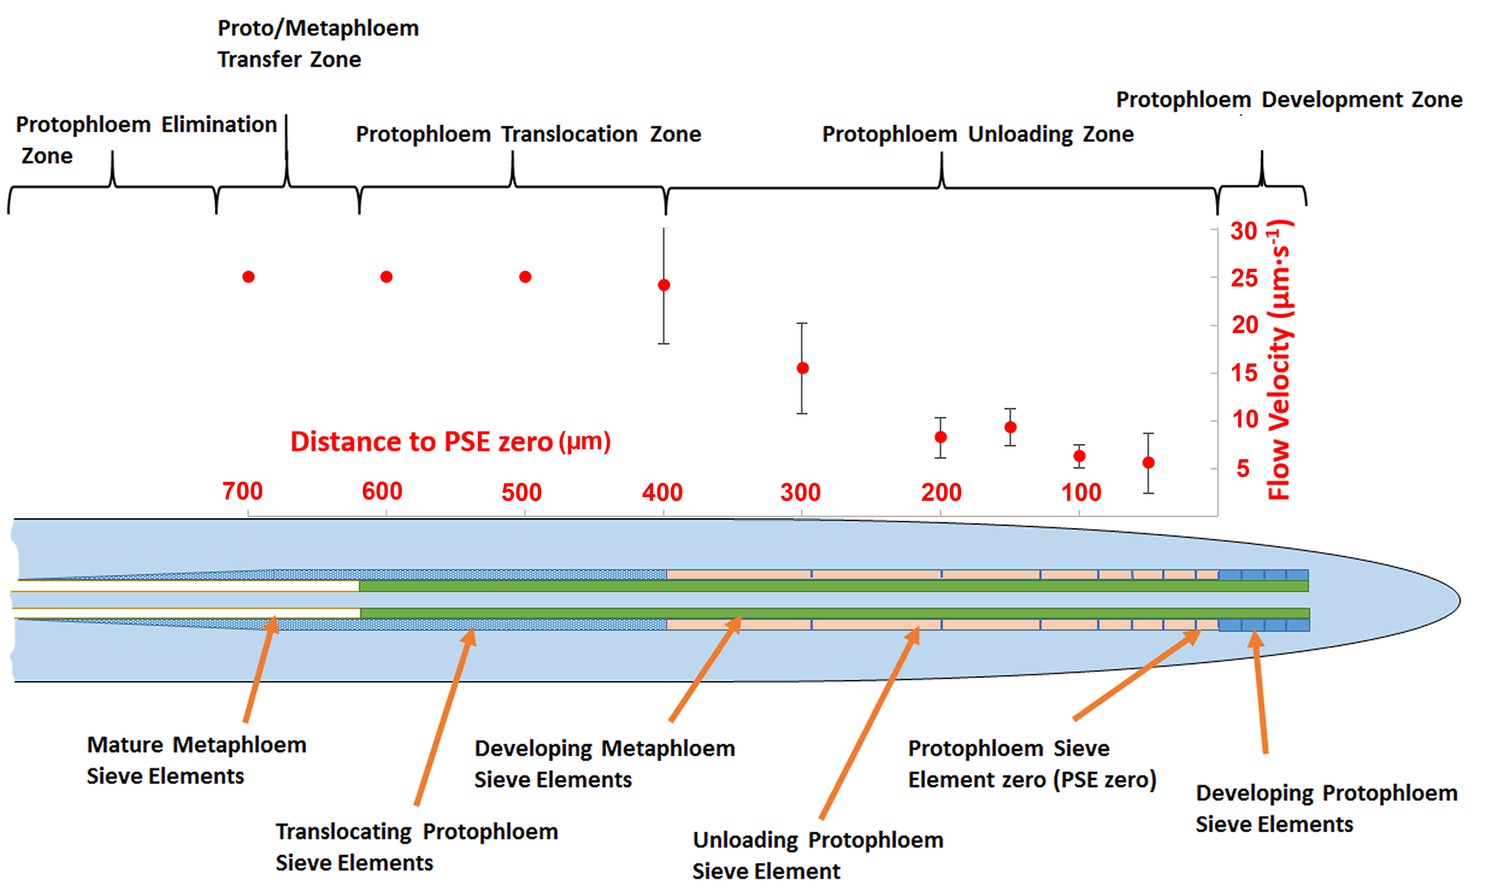
Schematic diagram illustrating the organization of phloem cells in specific zones in the root tip of Arabidopsis.
The graph represents experimentally derived velocities at defined points relative to the terminal sieve element (PSE zero) in the protophloem unloading zone. Error bars show standard deviation of the mean (n = 8).
Figure 3
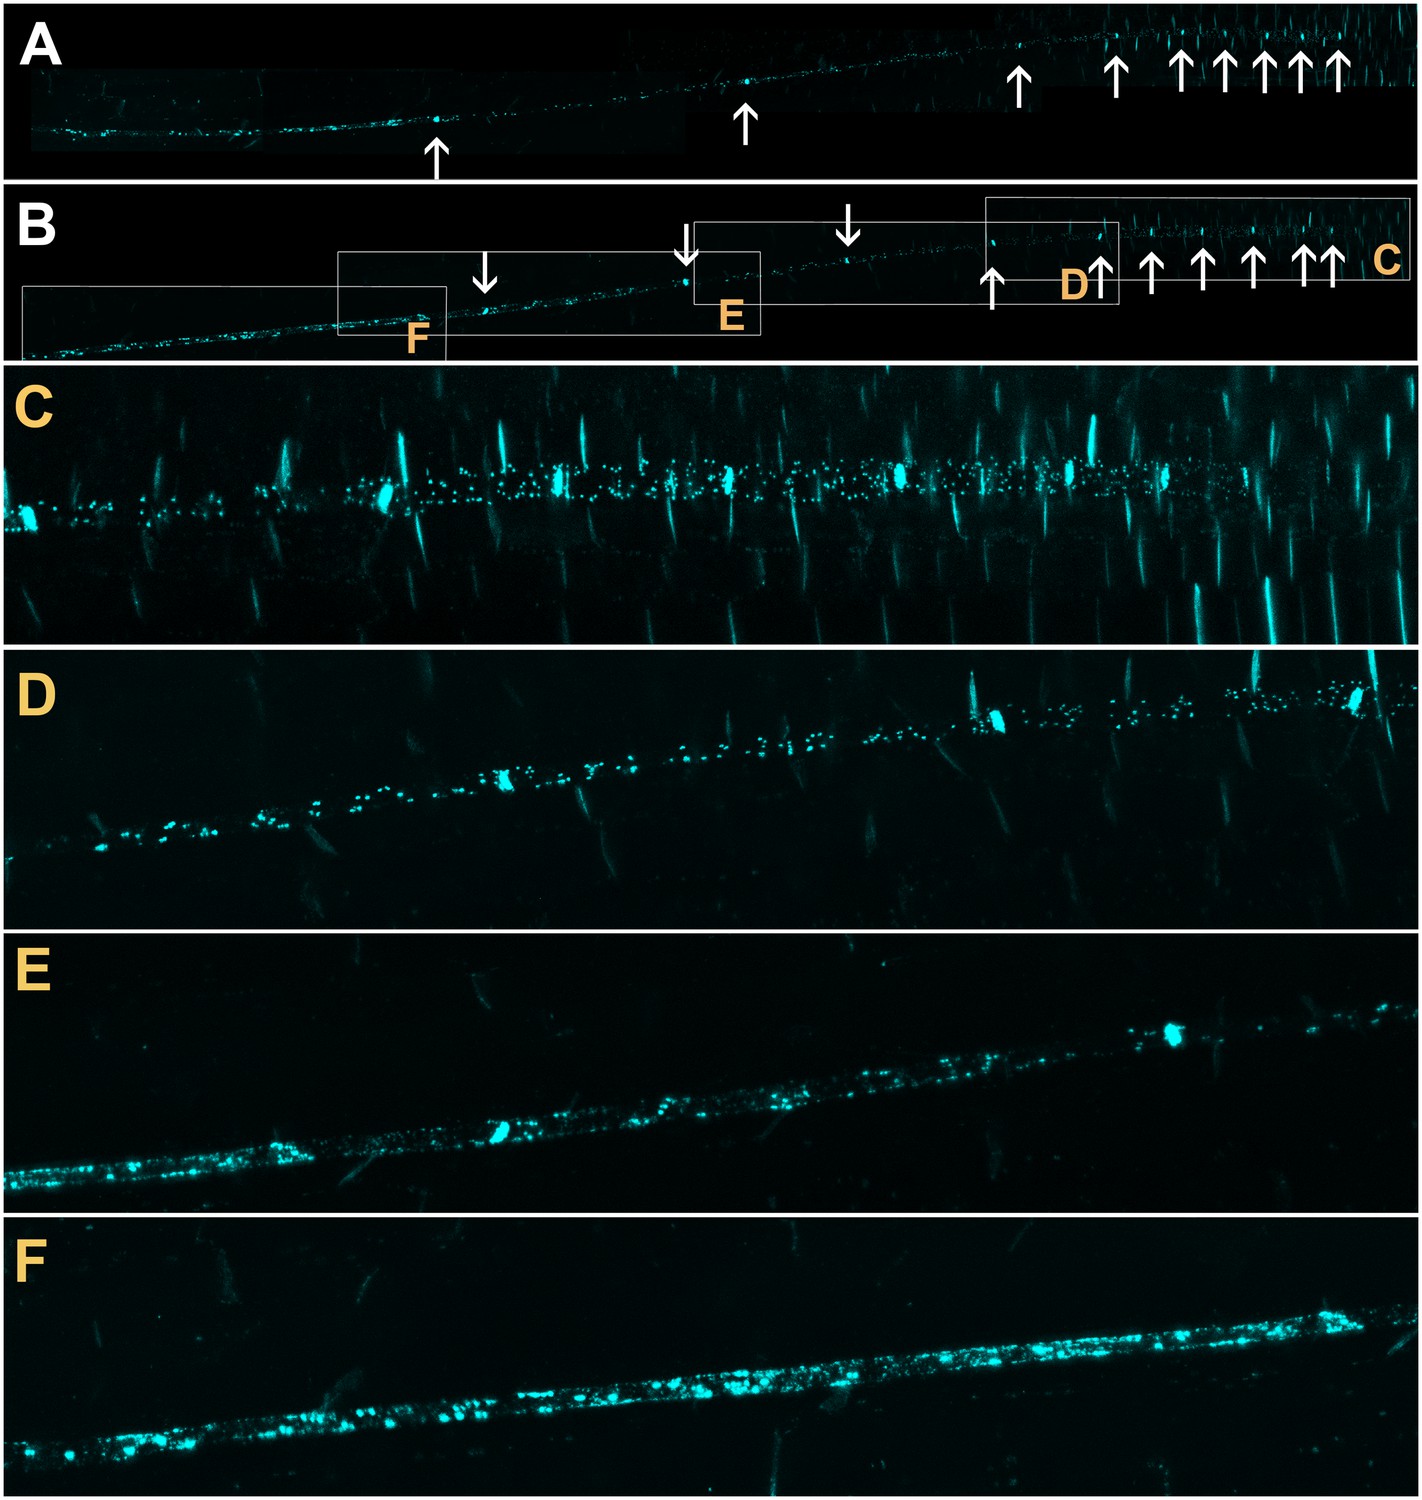
Confocal micrographs of the unloading zone in the Arabidopsis root tip stained with Sirofluor.
Low magnification images showing the relatively strong fluorescence at sieve plates (arrows). (C–F) Higher magnification images at the locations indicated by boxes in (B). Individual plasmodesmata are resolved in the unloading zone (C, D). In the translocation zone, large deposits of callose are abundant (E, F).
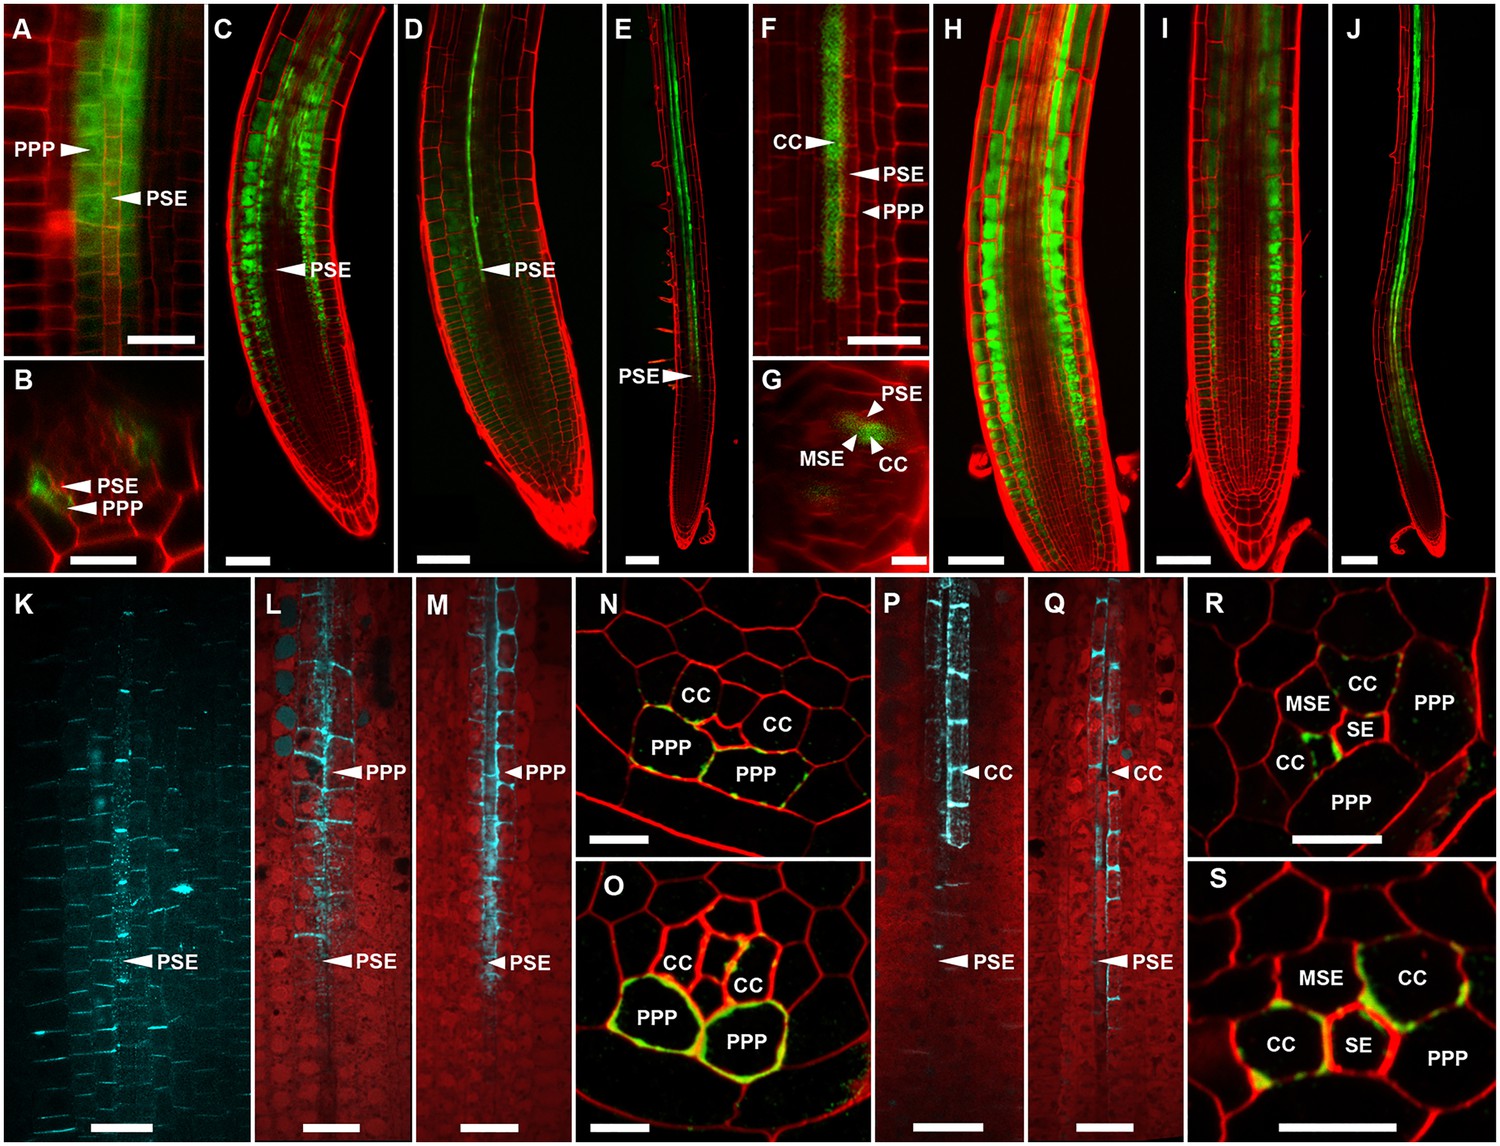
Figure 4
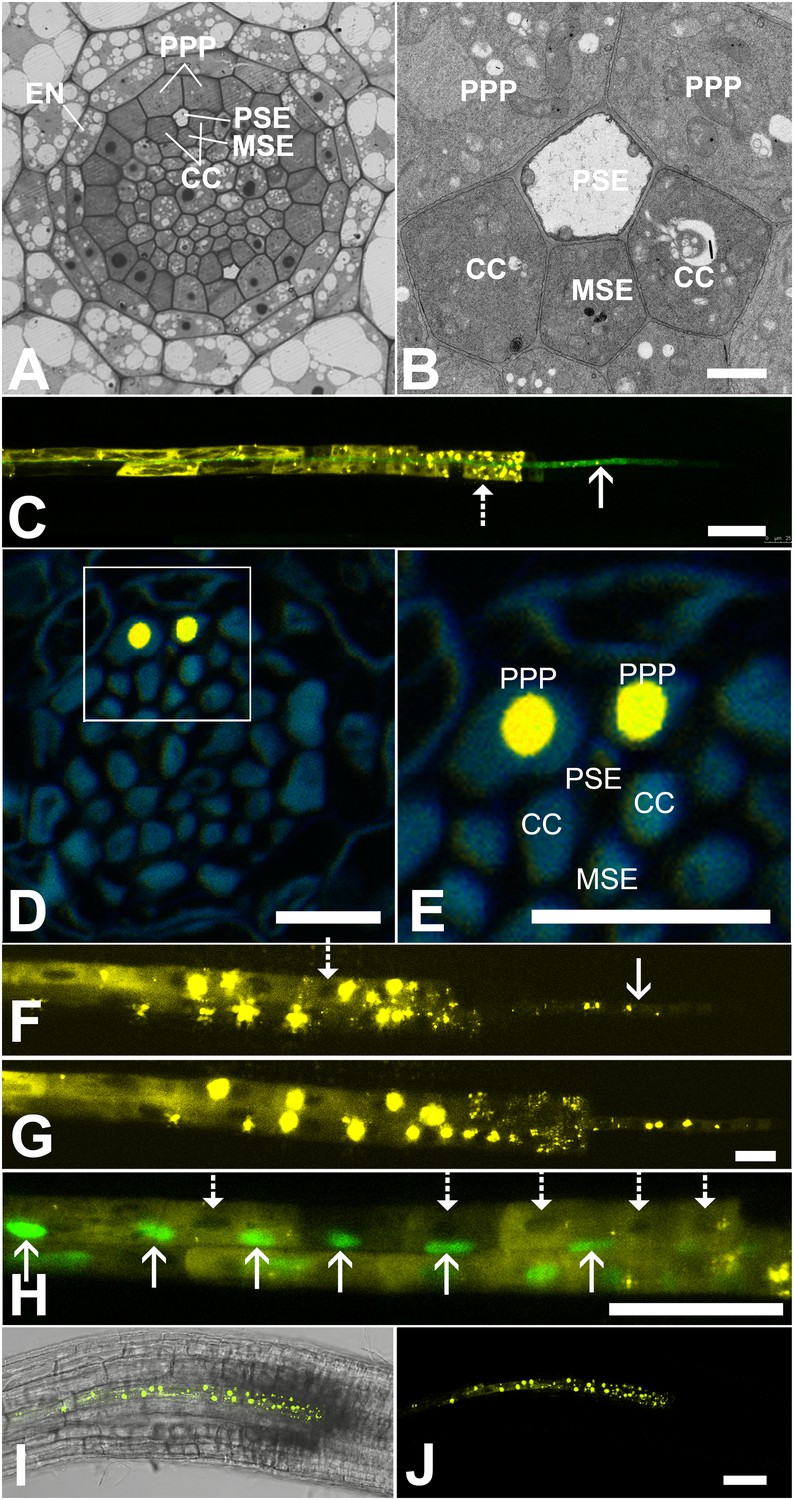
Functional organization in the root unloading zone.
(A, B) TEM images showing a cross section of an Arabidopsis root unloading zone. (A) An overview of the central cylinder with phloem pole pericycle cells (PPP), endodermis (EN), companion cells (CC), metaphloem sieve element (MSE), and protophloem sieve element (PSE). (B) TEM image of the pentagonal organization of cells surrounding the protophloem file. (C) Confocal micrograph of a transgenic Arabidopsis line expressing SEOR-YFP protein (yellow) and GFP targeted to the sieve element ER (green), both under control under a sieve element specific promoter. While GFP is restricted to the ER of the PSE (solid arrow), SEOR-YFP expressed into the cytoplasm escapes into two neighboring cell files (dashed arrow). (D, E) Root cross section of a fixed and embedded transgenic Arabidopsis plant expressing SEOR-YFP protein. The micrograph identifies the two cell files into which SEOR-YFP escapes as the PPP F, (G) Two confocal micrographs extracted from Video 2 showing SEOR-YFP protein (yellow) in the PPP and PSE. New PPP cells become fluorescent as unloading progresses. Note that small aggregates of SEOR-YFP become increasingly larger basipetal to the unloading zone. (H) Confocal micrograph of a transgenic Arabidopsis line expressing GFP (green) in the nuclei of companion cells (solid arrows) and SEOR-YFP. The nuclei in the CCs do not match the location of the nuclei in the cell files containing SEOR-YFP (dashed arrows), providing further evidence that the two files are the PPP. (I, J) Root tip of a grafted Arabidopsis plant in which the rootstock was wildtype and the scion expressed SEOR-YFP in the shoot. The root was imaged at 10 days after grafting and shows clearly that SEOR-YFP protein has moved from shoot to root, with subsequent unloading into the PPP. Scale Bars; B = 1 µm; F, G = 5 µm; C, D, E, H = 10 µm; I, J = 50 µm.
Figure 5
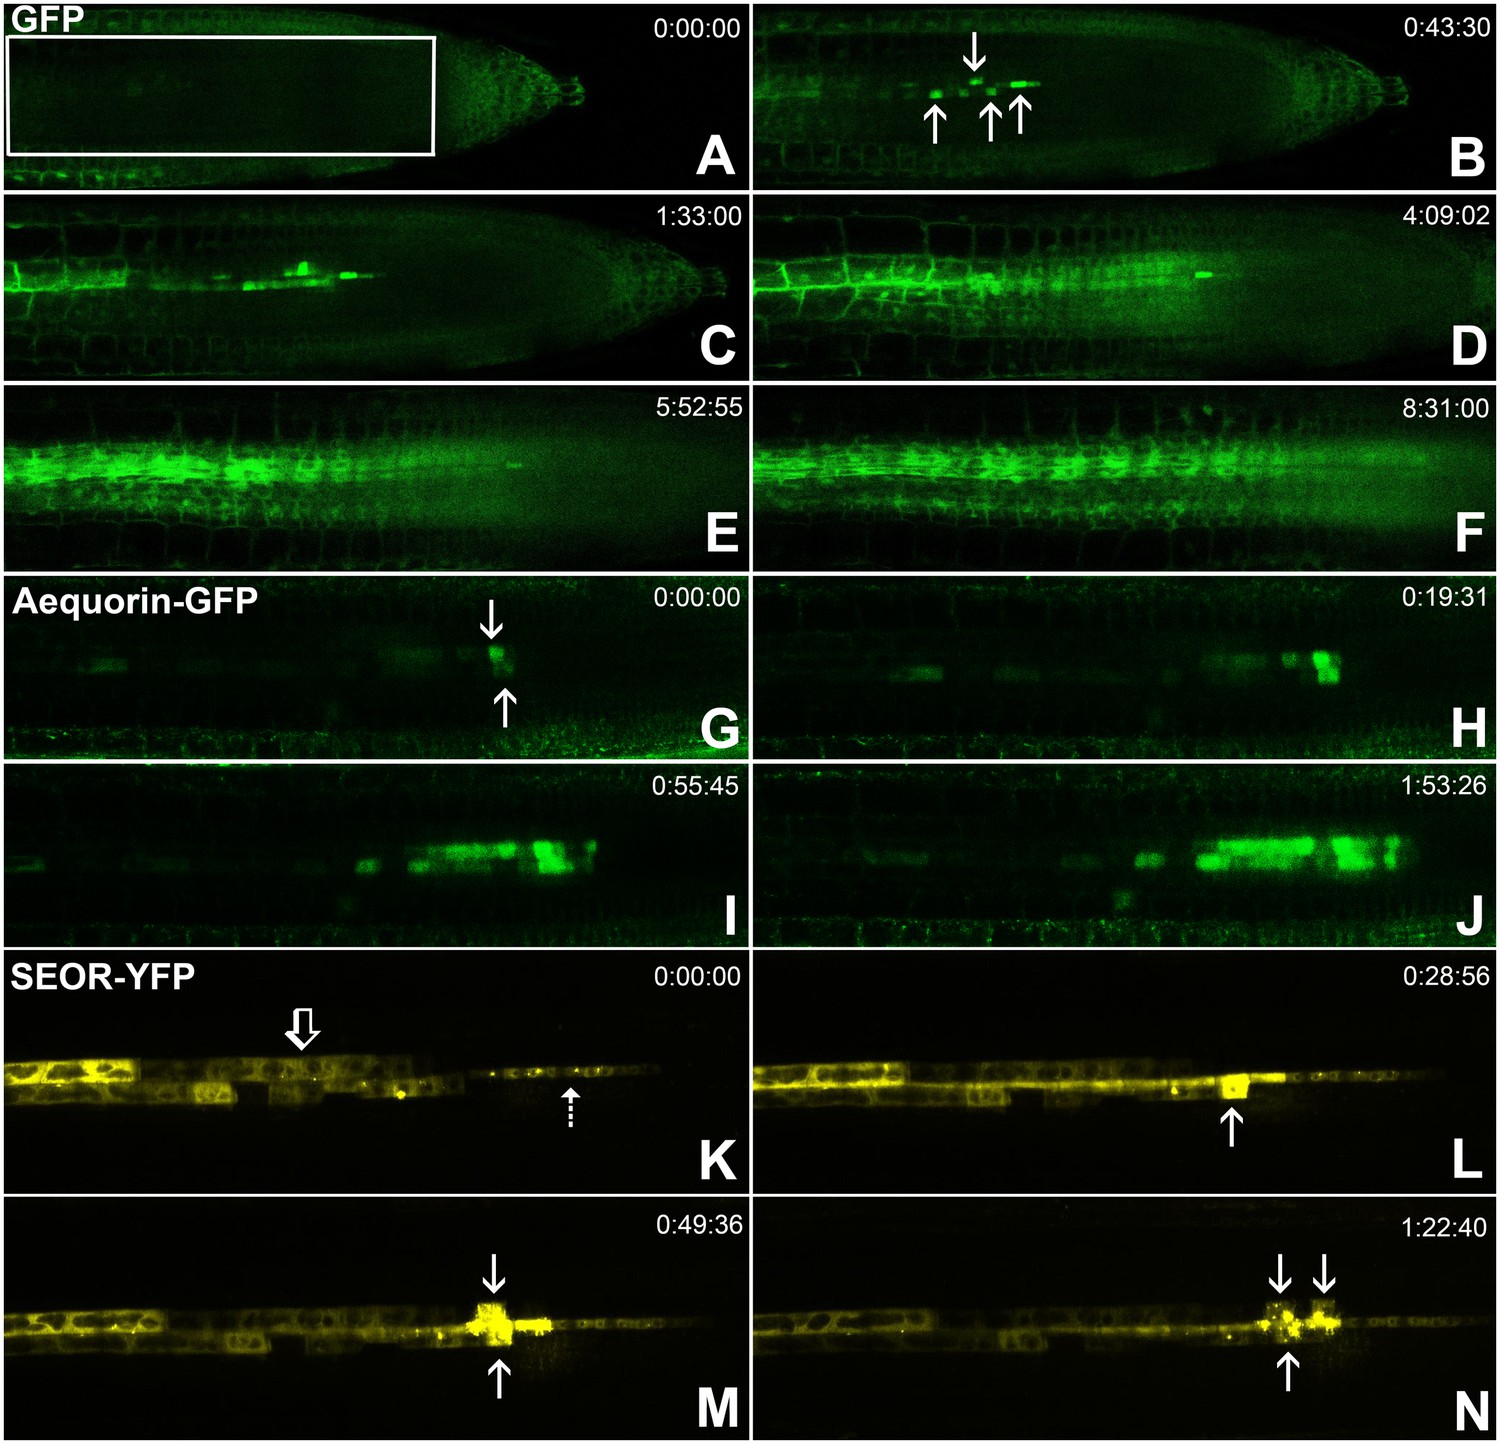
Batch unloading of proteins.
(A–F) six frames taken from Video 3. A) The unloading zone was photobleached (boxed region). Refilling of the unloading zone shows that GFP exits the PSE in discrete batches (arrows in B). Over time, all cells in the root transported GFP until an even distribution of the fluorescent protein was reinstated (C–F). (G–J) Compared to GFP (27 kDa), aequorin-GFP (48 kDa) was batch unloaded but did not move beyond the PPP. (K–N) Four frames extracted from Video 4 showing batch unloading of SEOR-YFP (112 kDa). In contrast to the CC-expressed GFP probes, SEOR-YFP was expressed in young sieve elements and entered the translocation stream when the sieve-plate pores opened. The immature PSEs are indicated (dashed arrow) and PPP cells are visible (open arrow). When SEOR-YFP aggregates arrive in the phloem unloading zone, they are batch unloaded from the terminal PSEs (solid arrows). As the root continues to extend, the aggregates enlarge and eventually disappear (see also Figure 4F,G and Videos 2 and 4), probably due to their breakdown in the older PPP cells.
Figure 6 with 1 supplement
Callose induction in the PPP, but not CCs, blocks phloem unloading.
(A) pCALS8::ER-YFP is expressed exclusively in the PPP. (B) Transverse optical section of A. (C) CF unloading in a control root expressing pCALS8::icals3m transferred to non-inducing medium. Unloading progresses as in wild-type roots. (D) CF unloading is restricted to the PSE files in pCALS8::icals3m roots at 8 hr after callose induction in the PPP. (E) As D but at 24 hr post-callose induction in the PPP. (F) psAPL promoter expression (psAPL-GFP) is restricted to CCs and MSE. (G) Transverse optical section of F. (H) CF unloading in a control root expressing psAPL::icals3m transferred to non-inducing medium. (I) CF unloading is not restricted in psAPL::icals3m roots at 8 hr after callose induction in CCs. J) As I but at 24 hr post-callose induction in CCs. (K) Sirofluor staining of a control root showing general background staining of PD around PSE files. L) Sirofluor staining of a pCALS8::icals3m root at 8 hr after callose induction in the PPP. (M) Sirofluor staining of a pCALS8::icals3m root at 24 hr after callose induction. In both L and M the roots were stained immediately after CF transport. (N) Callose immunolabelling (green) of a pCALS8::icals3m root at 8 hr after callose induction in the PPP. Cell walls are labelled red. (O) As N but at 24 hr after callose induction. (In addition to the PPP, sometimes callose staining is also observed in the CC). (P) Sirofluor staining of a psAPL::icals3m root at 8 hr after callose induction in CCs. (Q) As P but at 24 hr after callose induction. (R) Callose immunolabelling (green) of a psAPL::icals3m root at 8 hr after callose induction in CCs. (In addition to the CC, callose staining was sometimes observed in the MSE). Cell walls were counterstained with calcofluor white (labelled red). S) As R but at 24 hr after callose induction. Scale bars: N, O, R, S: 5 um. A, B, F, G, K, L, M, P, Q: 10 um. C, D, H, I, J: 50 um. E, J: 100 um. Abbreviations as in Figure 4.
Figure 6—figure supplement 1
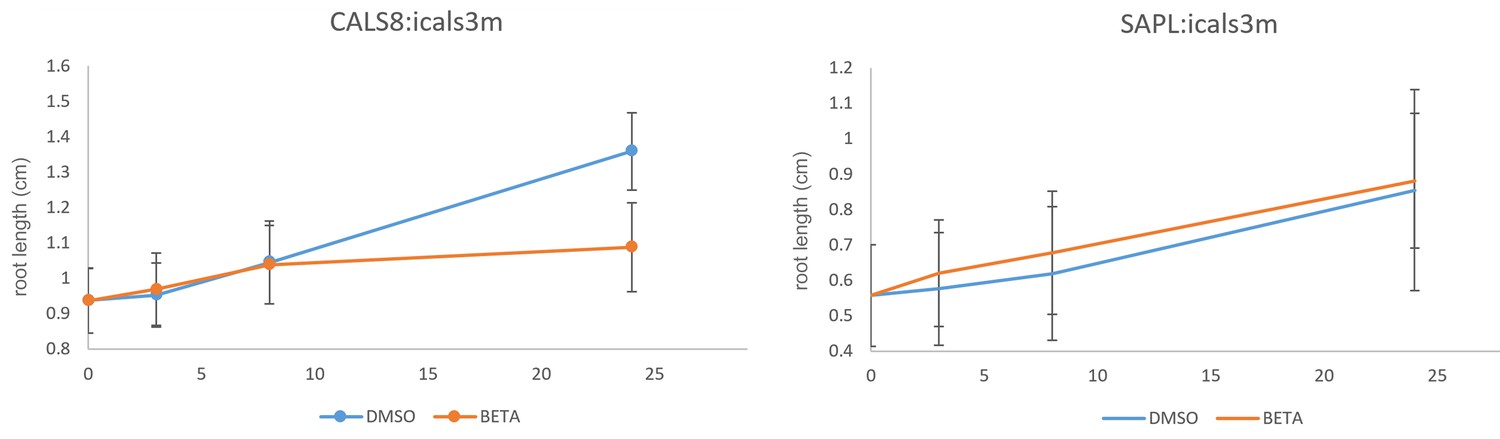
Growth of pCALS8::icals3m and psAPL::icals3m seedlings on 5 uM beta estradiol relative to uninduced controls (mock DMSO).
Seedlings were transferred to inducing or non-inducing media at 4 days post germination. For pCALS8::icals3m each time point is the average of 82 independent measurements. For psAPL::icals3m each time point is the average of 67 independent measurements. Bars show standard error of the mean.
Figure 7
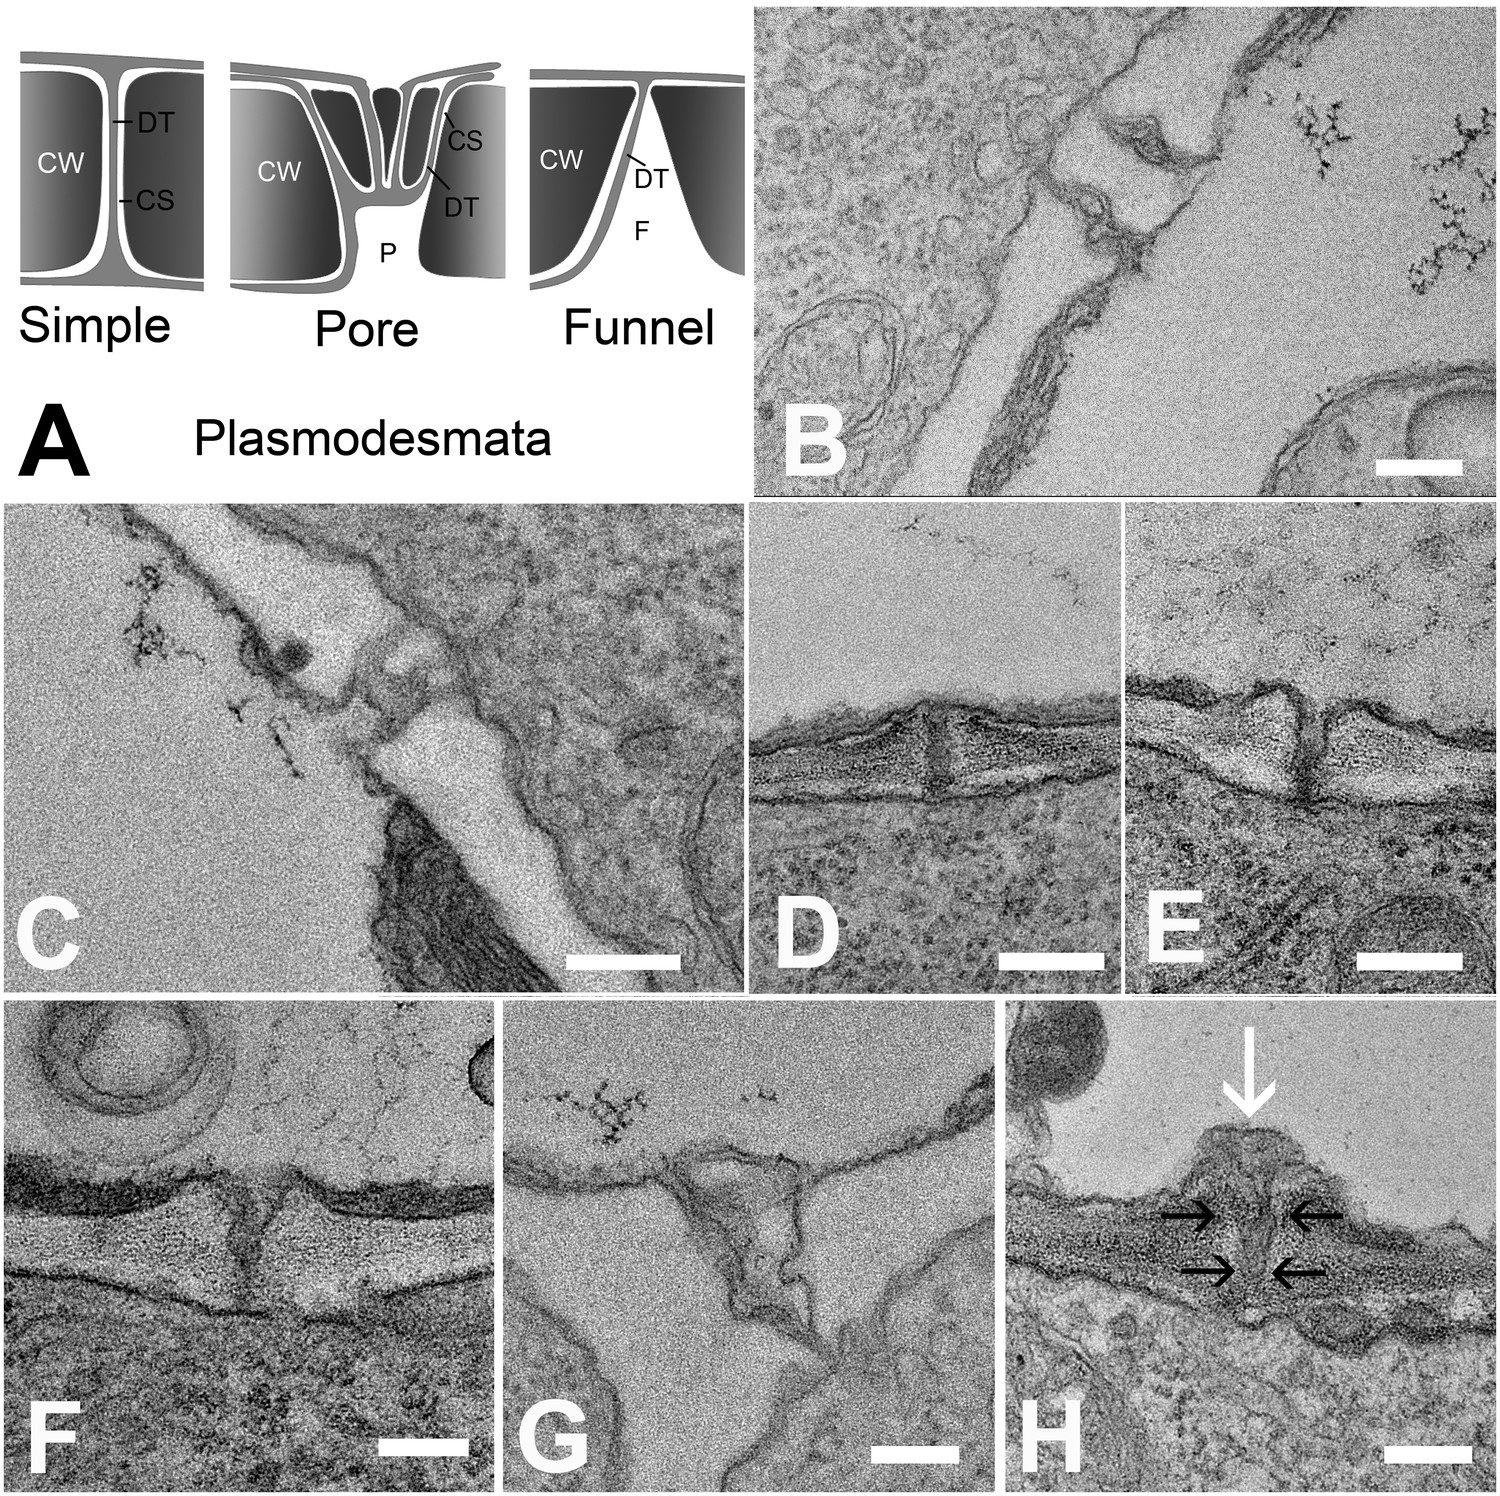
Types of plasmodesmata connecting different cell interfaces.
(A) Schematic diagrams of the different plasmodesmata connecting protophloem sieve elements to surrounding cell types. (B) Image of the PSE-MSE interface showing a cell wall with two simple plasmodesmata. (C) A pore-plasmodesma in the cell wall between PSE and CC. (D–I) Plasmodesmata connecting PSE with PPP. (D) Simple plasmodesmata, found rarely. (E–H) Funnel plasmodesmata. These showed a wide opening on the PSE entrance tapering towards the PPP. (H) Electron-dense components (white arrow) of unknown composition were often observed within funnel plasmodesmata (black arrows). DT = desmotubule, CW = cell wall, P = pore, F = funnel, CS = cytoplasmic sleeve. Scale bars: B, C, G, H = 200 nm; D, E, F = 500 nm.
Figure 8
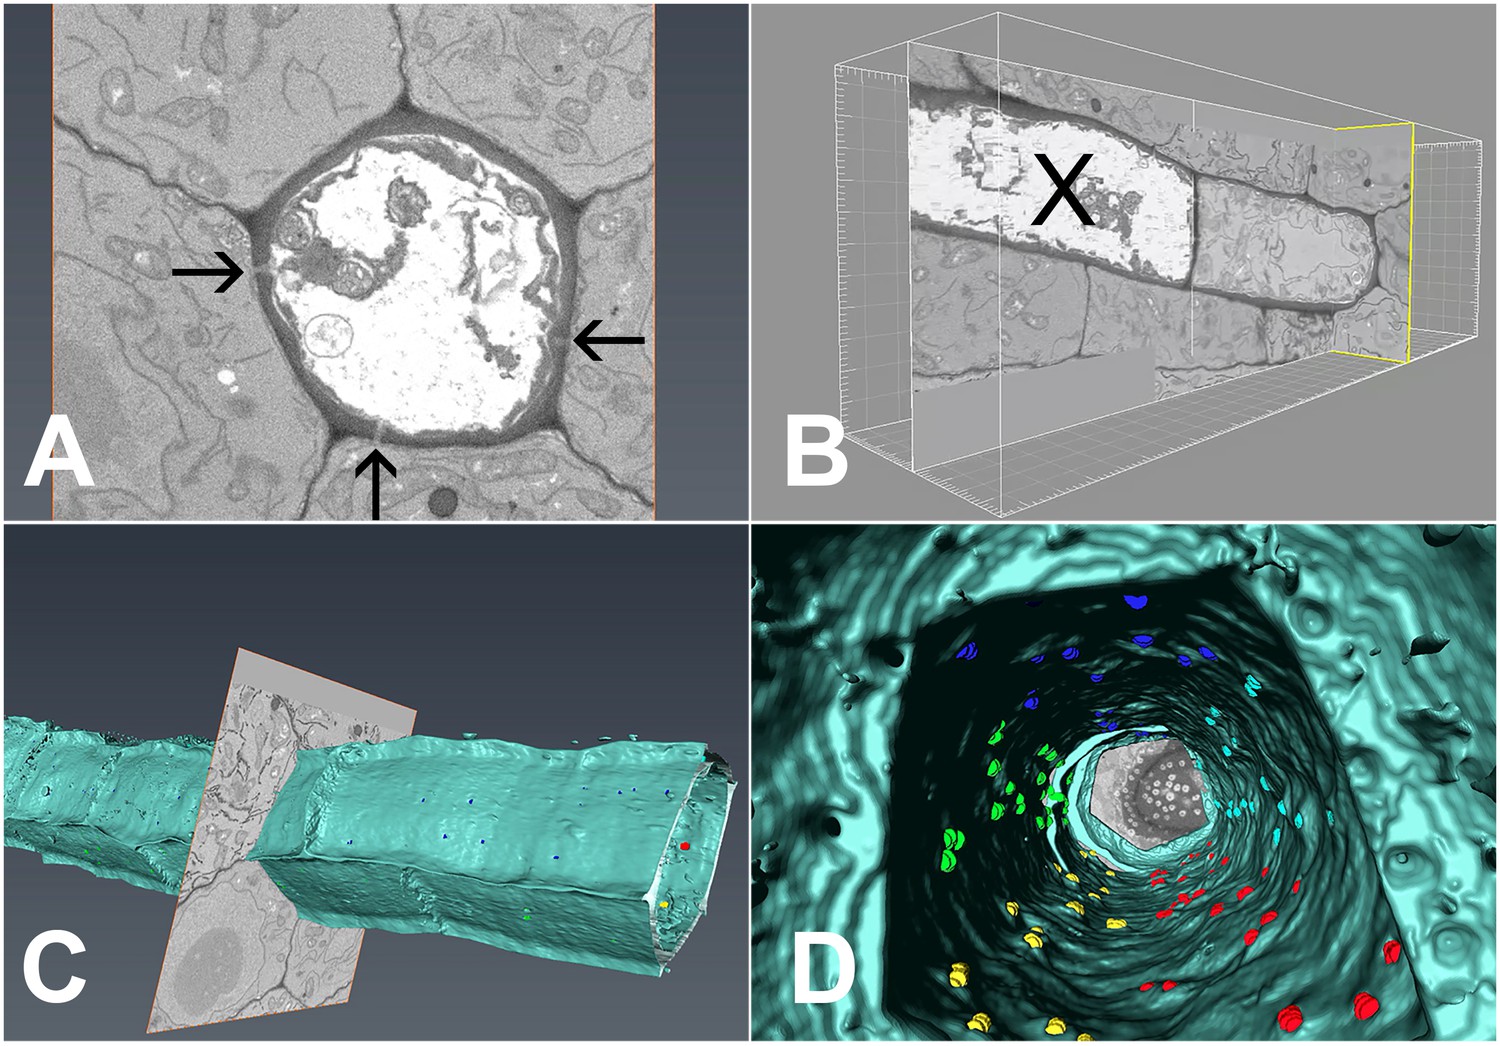
3D overview of protophloem sieve elements in the root tip obtained by serial block-face scanning electron microscopy.
(A) Cross-section of one phloem pole in the unloading zone. PD are indicated by darts. (B) Longitudinal section of the protophloem unloading zone. PSE zero (X) is connected to a neighboring immature protophloem sieve element. (C, D) 3D longitudinal view of the protophloem unloading zone. Serial sections were used to reconstruct the unloading zone and quantify PD connections from PSEs to adjacent cells. (C) shows PD on the outer face of the PSE. (D) is derived from Video 4 and shows the PD on the inner faces of the PSE. In the images, PD are color coded (blue/cyan PSE-PPP, red/green PSE-CC, and yellow PSE-MSE).
Figure 9
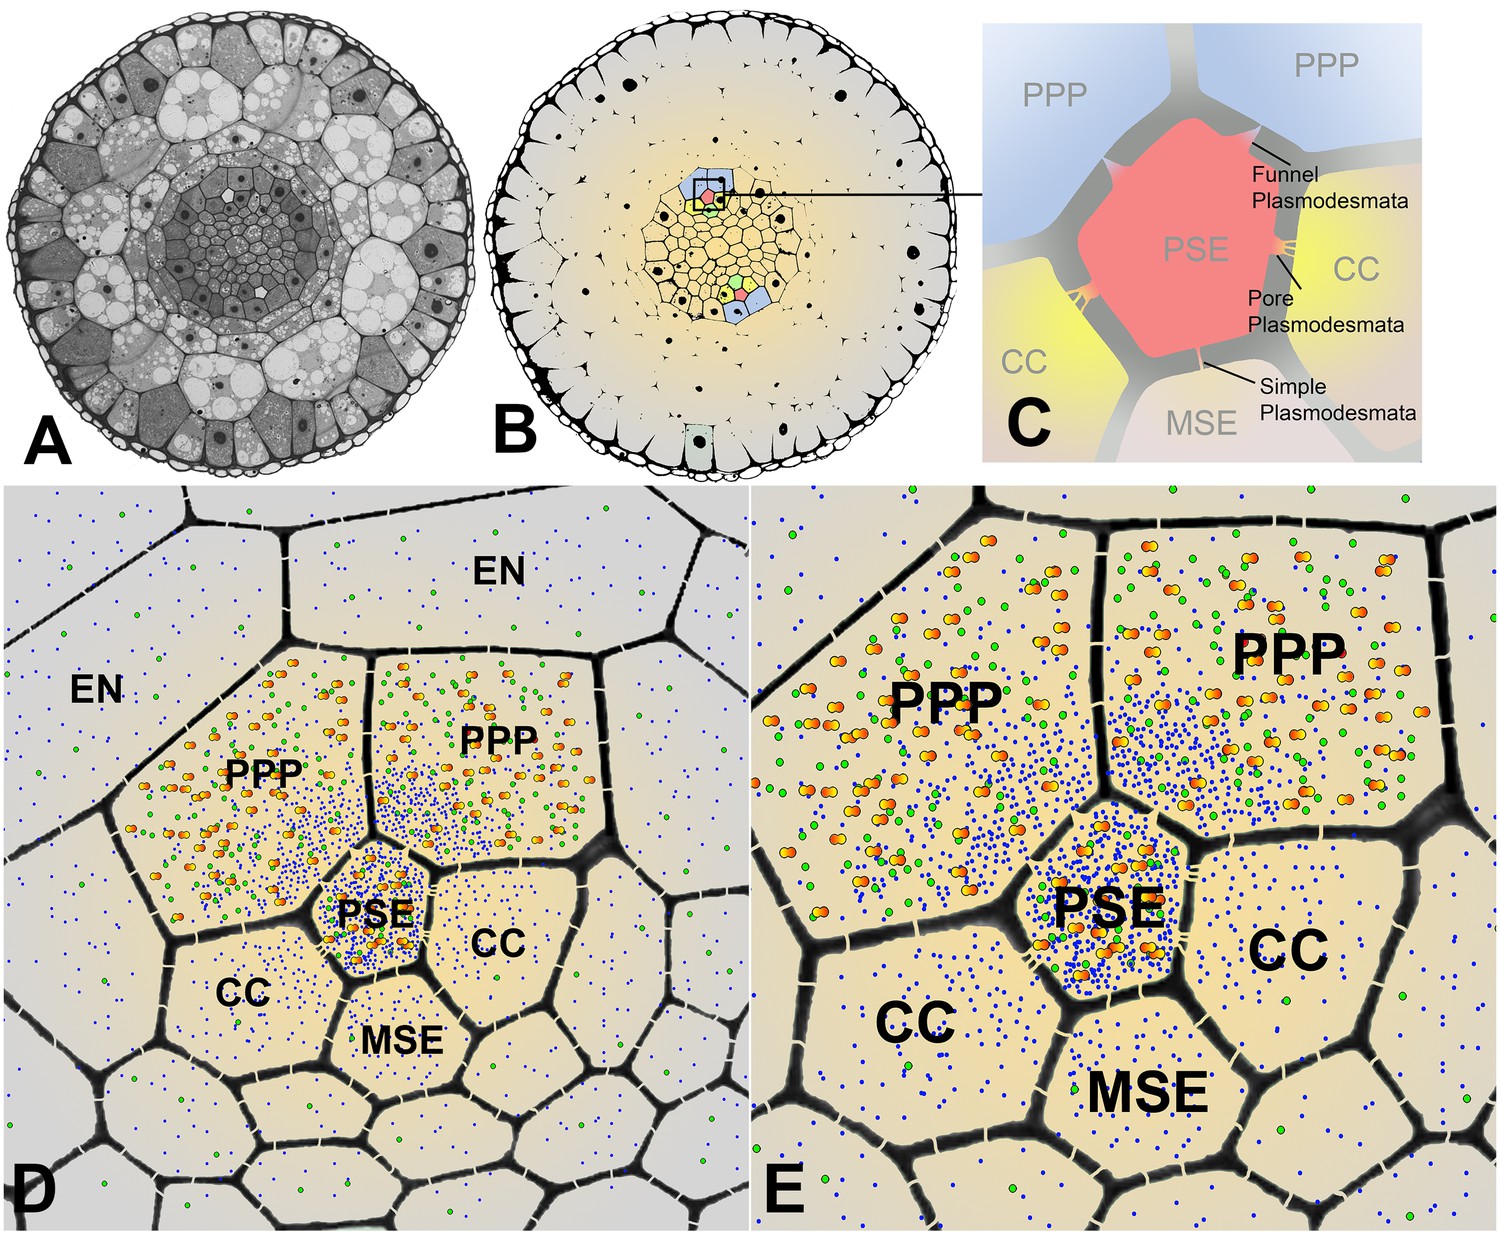
Cross sectional overviews of the Arabidopsis roots showing PD connections and size-dependent phloem unloading of solutes and macromolecules.
(A) Standard light micrograph showing a cross section of the Arabidopsis root. (B) A false colored cross section of the Arabidopsis root highlighting the two phloem poles in the unloading zone. (C) Diagram of the cells in the phloem pole and the types of PD that connect the PSEs to each adjacent cell. PPP cells are connected to the PSE by funnel PD, CCs are connected by pore-PD, and MSEs are connected by simple PD. (D and E) Diagram showing the location of various solutes and macromolecules depending on molecular mass. Once unloaded via the PPP, sucrose (blue dots) and GFP (green dots) are able subsequently to enter all cell types via PD. However, larger macromolecules such as SEOR-YFP (yellow/orange dots) are unloaded only into PPP cells. EN = endodermis.
Appendix 1—figure 1
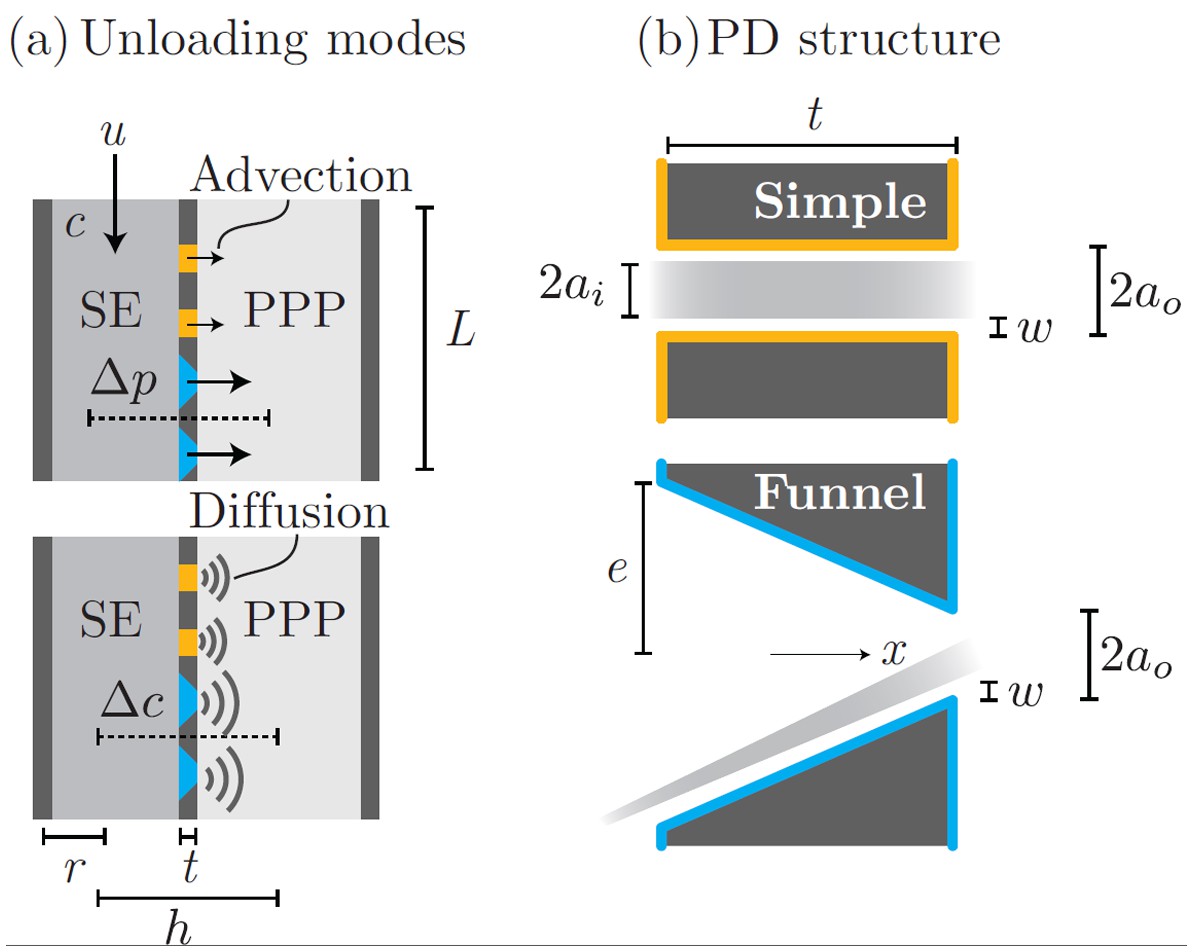
Phloem unloading model.
Parameters used in calculations for advective and diffusive modes (a): bulk flow and diffusion through PD types (b): simple and funnel. See Table 1 for parameter descriptions and values.
Videos
Video 1
Visualization of the development of PSE zero.
An Arabidopsis line with GFP tagged ER (green) in the protophloem sieve elements is loaded with Esculin (blue). When the nucleus in the sieve element degrades, sieve plate pores open and the blue Esculin enters the cell. This integrates the cell into the unloading zone and defines a new PSE zero.
Video 2
YFP tagged SEOR-protein in the PSE and two neighboring PPP cell files.
During root growth, new PPP cells are integrated into the unloading domain as indicated by tagged protein entering the cells, presumably due to the opening of connecting plasmodesmata.
Video 3
Time-lapse movie of batch unloading of free GFP (27 kDa).
In situ time lapse movie of a transgenic line constantly supplying GFP into SEs via leakage from CCs where GFP is expressed under control of the SUC2 promoter. After photobleaching of GFP in the unloading zone, refilling reveals that GFP is unloading in batches into individual cells from where it diffuses into the post unloading zone.
Video 4
Batch unloading of YFP tagged SEOR protein (112 kDa).
SEOR-YFP protein is expressed in young sieve elements and remains as aggregates in the sieve elements after degradation of the nucleus. The time-lapse movie shows batch unloading of this large protein into the PPP.
Video 5
3D volume reconstruction of serial block face data.
The movie shows the volume reconstruction of the PSE file with highlighted cell walls. Color coding reveals the location of plasmodesmata connecting the PSE to the neighboring cell types.
Tables
Table 1
Base parameters used to model phloem unloading.
| Assuming transport through simple PD at PSE/PPP interface | Transport through PD at PSE/PPP interface | |
|---|---|---|
| Length of unloading zone | 350 µm | 350 µm |
| Desmotubule Diameter | 15 nm | 15 nm |
| Cytoplasmic Sleeve Diameter | 2.8 nm | 2.8 nm |
| Cell Wall Thickness | 500 nm | 500 nm |
| Phloem Sap Osmotic Potential | 500 mM | 500 mM |
| Funnel opening towards PSE | – | 150 nm |
| # of PD available for Unloading | 240 simple PD | 24 simple PD, 216 funnel PD |
| Total Sap Volume | 230 fl/s | 230 fl/s |
| Required Pressure Differential | 8.14 MPa | 0.05–0.2 MPa |
Appendix 1—table 1
Parameters used in unloading transport calculations.
| Parameter | Symbol | Value |
|---|---|---|
| Sap flow speed | ||
| Sieve element radius | ||
| Length of unloading zone | ||
| Desmotubule radius | ||
| Cytoplasmic sleeve width | ||
| PD outer radius | ||
| PD funnel radius | ||
| Cell wall thickness/PD length | ||
| Phloem sap osmotic potential | ||
| Phloem sap viscosity | ||
| Phloem sap density | ||
| Diffusivity of sucrose | ||
| Cell membrane permeability (see Table 3.1 of Kramer and Boyer [1995]) | ||
| Number of PD | ||
| – Bulk flow through simple PD | ||
| – Bulk flow through funnel PD at PSE/PPP-interface | ||
| – Diffusive unloading through simple PD | ||
| – Diffusive unloading through funnel PD |
Download links
A two-part list of links to download the article, or parts of the article, in various formats.
Downloads (link to download the article as PDF)
Open citations (links to open the citations from this article in various online reference manager services)
Cite this article (links to download the citations from this article in formats compatible with various reference manager tools)
Phloem unloading in Arabidopsis roots is convective and regulated by the phloem-pole pericycle
eLife 6:e24125.
https://doi.org/10.7554/eLife.24125


