The AMPA receptor-associated protein Shisa7 regulates hippocampal synaptic function and contextual memory
- Remco V Klaassen

- Marta Ruiperez-Alonso
- Azra Elia Zamri
- Jasper Stroeder
- Priyanka Rao-Ruiz
- Johannes C Lodder
- Rolinka J van der Loo
- Huib D Mansvelder
- August B Smit
- Sabine Spijker
- VU University, The Netherlands
- Sylics (Synaptologics BV), The Netherlands
- Vrije Universiteit Amsterdam, The Netherlands
- Université de Bordeaux, Interdisciplinary Institute for Neuroscience, UMR 5297, France
Figures
Figure 1 with 3 supplements

Shisa7 is a type-I transmembrane protein interacting with AMPA-type receptors.
(a) Shisa7 is closely related to the AMPAR auxiliary subunit Shisa6 and Shisa9, bearing a signal peptide (SP; 22 amino acids), an extracellular domain with conserved cysteine-rich motif, a single transmembrane region (TM), and an intracellular domain with a type II PDZ-ligand motif (EVTV). Exon4 (Ex) is an alternative-splice region in Shisa7 and Shisa9, whereas this is Exon3 in Shisa6. The predicted molecular weight of the two mature Shisa7 protein variants is ~56 and ~54 kDa, and that of Shisa6 ~59 and~55 kDa (Klaassen et al., 2016). (b) Shisa7 is highly enriched in the cortex, olfactory bulb and hippocampus, and absent in cerebellum, as measured in crude synaptic membrane fractions. Despite the presence of both transcript variants (see Figure 1—figure supplement 1), the indicated protein band (~68 kDa; arrow head) is dominant in the hippocampus. Lower panel depicts the loading control, that is, total crude synaptic membrane protein. (c) Immunohistochemistry of primary Shisa7 KO hippocampal neurons (DIV14) after viral overexpression of Flag-Shisa7 shows Shisa7 expression (green) in endogenous Homer1-positive puncta (red). The lower panels show a zoom-in (white box in upper panel). The overlay of the two channels is shown, scale bars are indicated. (d) Biochemical fractionation (homogenate (H), crude synaptic membranes (P2; with and without microsomes (M)), synaptosomes (SS), synaptic membranes (SM) and postsynaptic density fraction (PSD; Triton X-100 insoluble fraction) of mature mouse hippocampus reveals an enrichment of Shisa7 in the PSD together with GluA2, GluN2A, PSD-95, and this pattern is distinct from the presynaptic marker Synaptophysin (Syp). (e) Precipitation of Flag-Shisa7 (~60 kDa) from HEK293 cells using a Flag antibody shows that upon co-expression it binds directly to homomeric GluA1, GluA2 and GluA3 receptors, whereas having minimal affinity for GluK2. For complete blots, in addition to those with higher exposure, see Figure 1—figure supplement 3. The input controls represent 2% of the total lysate.
-
Figure 1—source data 1
Sequence of DNA primers.
Primers were used for PCR experiments to detect the presence or absence of exon 4 in Shisa7, as well as for real-time PCR. The forward and reverse primers, as well as the size of the amplicon generated, are indicated.
- https://doi.org/10.7554/eLife.24192.006
Figure 1—figure supplement 1
Shisa7 gene expression.
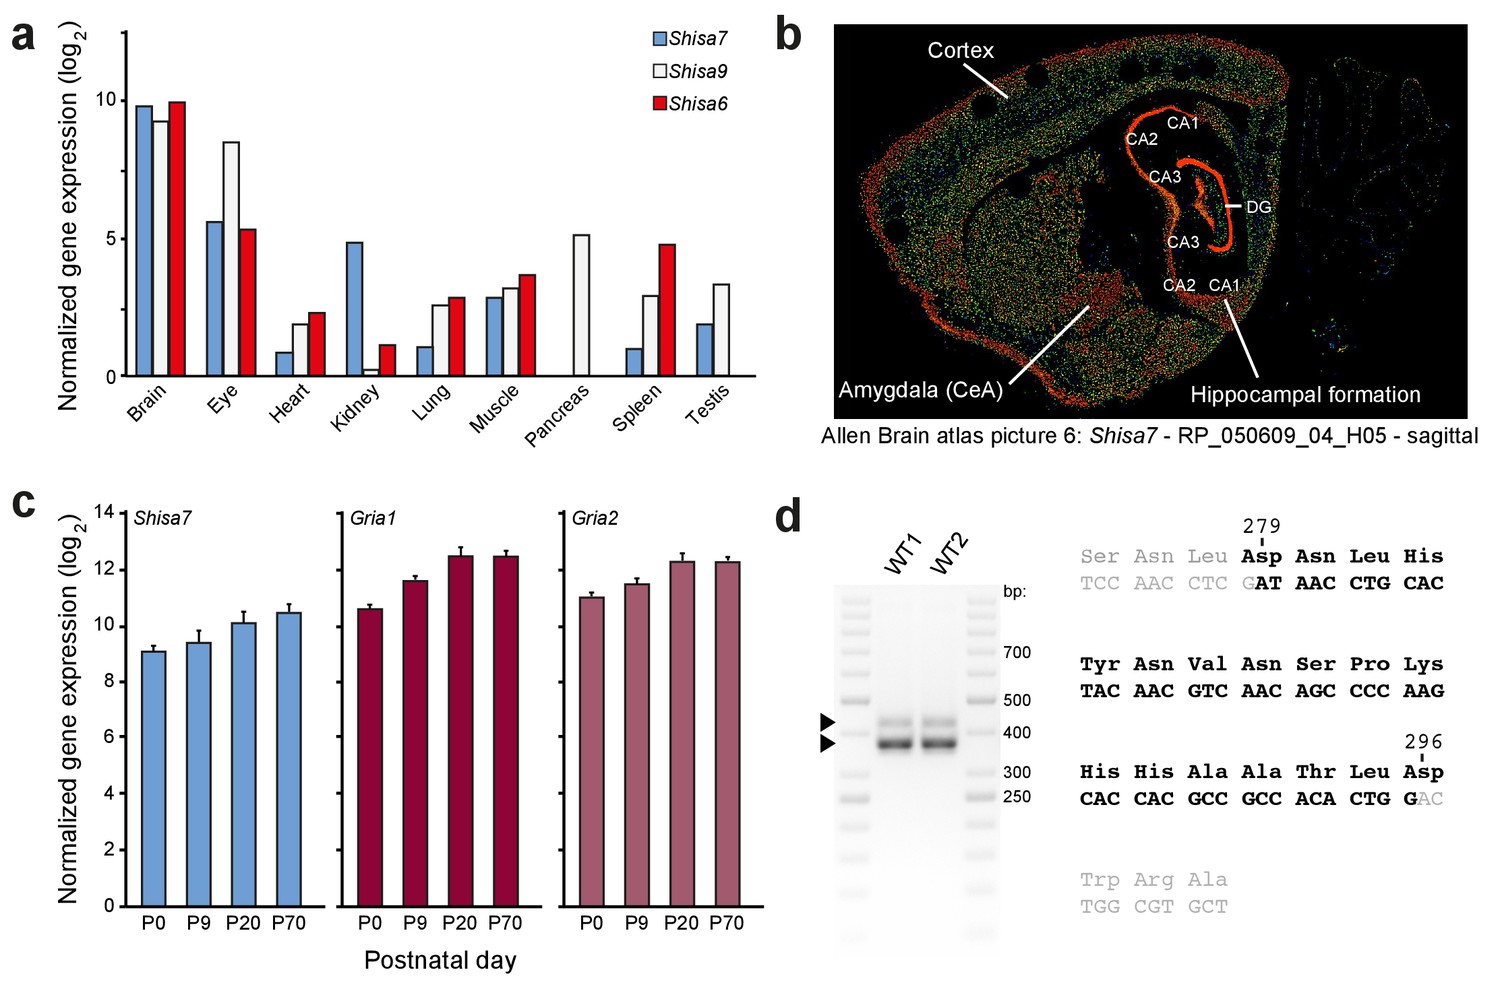
(a) Quantitative PCR shows that the Shisa7 gene expression is specifically enriched within the brain (note the log2-scale), and is virtually absent in the pancreas (pooled from three adult mice). For comparison, gene expression of Shisa9 and Shisa6 was taken along. Primers are indicated in Figure 1—source data 1. (b) Representative example of Shisa7 in situ hybridization signal (picture 6, probe RP_050609_04_H05) from the Allen Brain Atlas (Nesvizhskii et al., 2003; Lein et al., 2007; Wenger and Coon, 2013) showing Shisa7 expression in the entire forebrain, with high expression in the hippocampus, and no expression in the cerebellum. Specific brain regions are indicated. (c) Hippocampal gene expression of Shisa7 and AMPAR subunits Gria1 and Gria2 increases during postnatal development and stabilizes after ~3 weeks, as measured by quantitative PCR (n = 3 independent biological samples, pooled from two mice). (d) RT-PCR on cDNA generated from hippocampal RNA using primers flanking exon 4 of Shisa7 (Figure 1—source data 1). Using this RT-PCR on WT mice in duplicate, we observed two bands (425, 375 nts) corresponding to the two Shisa7 transcripts, of which the exon 4-less transcript showed highest expression. Sequence analysis of these PCR products confirmed the presence of exon 4 (black letters) between exons 3 and 5 (gray letters) in the Shisa7 sequence. The amino acid sequence is indicated above the nucleotide sequence. Importantly, the Shisa7 tryptic peptides NLYNTMKPSNLDNHYNVNSPK (derived from exon 3 and 4) was identified using mass spectrometric analysis of native hippocampal Shisa7 complexes (Table 1).
Figure 1—figure supplement 2
Generation of Shisa7 KO mice and antibody testing.
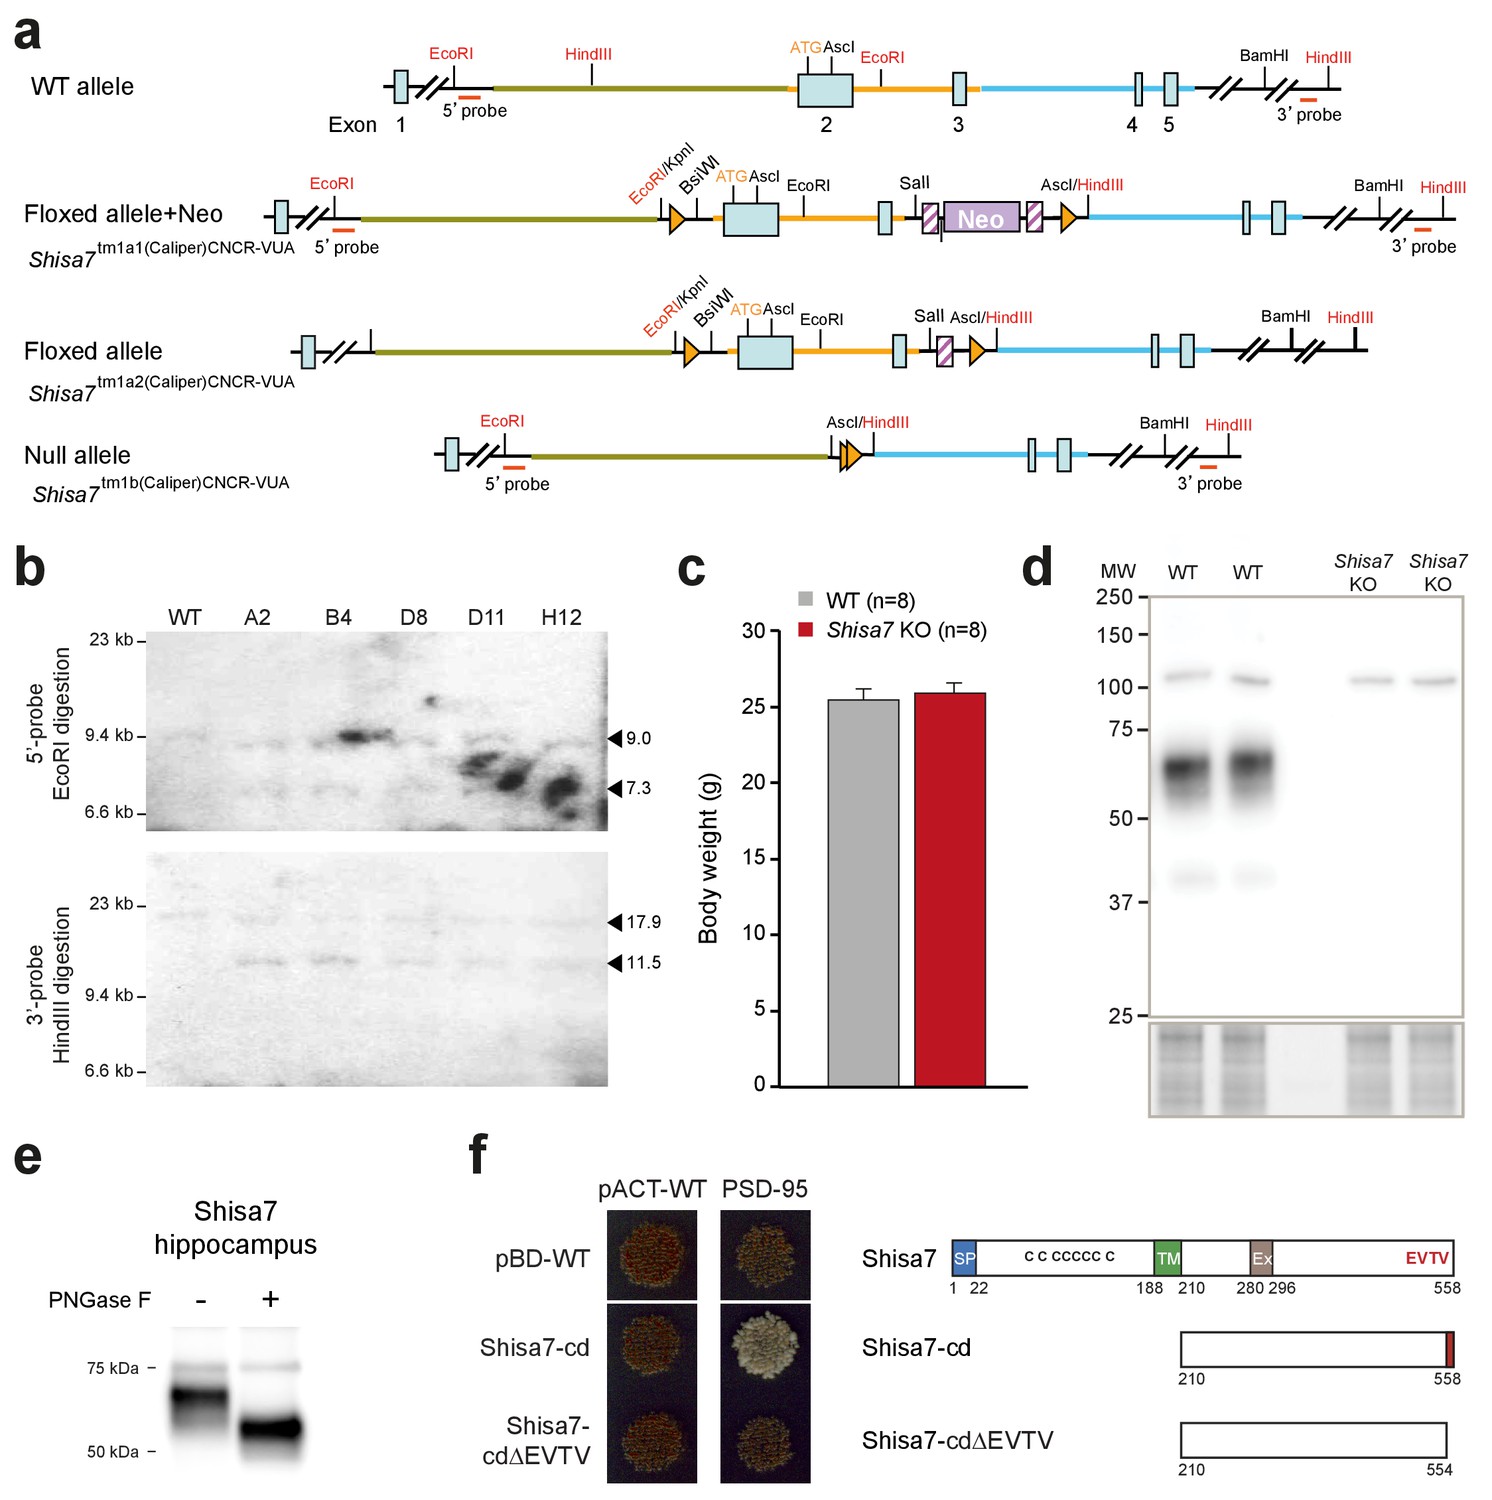
(a) Representation of Shisa7-null mouse generation: The Shisa7 locus around exon 1, encoding the N-terminal part of the Shisa7 protein including the start-site (ATG), with essential restriction sites (red), the 5’-end PCR primer combination and the 3’-probe (and size of fragment) used for Southern blotting, are shown (top) for the Shisa7tm1a1(Caliper)CNCR-VUA mouse line, containing the NEO cassette, the LoxP and FRT sites. The mouse line with the Neo cassette deleted (Shisa7tm1a2(Caliper)CNCR-VUA) and the line with the null-allele (Shisa7tm1b(Caliper)CNCR-VUA; hereafter named Shisa7 KO) are indicated. (b) Correct homologous recombination in ES clones (Shisa7tm1a1(Caliper)CNCR-VUA) was checked by PCR (not shown), and by Southern blot analysis for the 5’- and 3’-end after EcoRI and HindIII digestion, respectively. The 5’-probe (upper panel) generated a 9.0 kB fragment in WT and mutants, and a 7.3 kB fragment in mutants (indicated by triangles). The 3’-probe (lower panel) generated a 17.9 kB fragment in WT and mutants, and a 11.5 kB fragment in mutants (indicated by triangles). (c) Gene deletion of Shisa7 did not affect growth, as indicated by similar body weight at an age of 10–12 weeks (unpaired t-test, p=0.565). (d) The in-house raised Shisa7 antibody was specific as immunoblotting detected Shisa7 in the range of 60–70 kDa in hippocampal crude synaptic membrane fractions, and this band was absent in samples from Shisa7 KO animals. Depending on the sample preparation, non-specific bands of 55 (see Figure 1), 75 and 110 kDa were observed. (e) The observed molecular weight of hippocampal Shisa7 under reduced and denatured (SDS-PAGE) conditions (~68 kDa) was higher than expected based on theoretical protein size alone (predicted mature molecular weight of 56.4 and 54.4 kDa), potentially due to protein glycosylation. Treatment with PNGase-F reduced the observed molecular weight substantially to a single band of ~56 kDa, confirming the presence of N-linked glycans on native Shisa7 (for complete blots, see Figure 1—figure supplement 3). (f) Direct two-hybrid assay of the C-terminal part of Shisa7 (amino acids 210–558; Shisa7-cd), or with a deletion of the last four amino acids (Shisa7-cd∆EVTV; right panel), with the first two PDZ domains of PSD-95. Empty vectors (pBD-WT, pACT-WT) were used as controls. Strong cell growth (left panel) was observed for the Shisa7-cd + PSD-95 condition, indicating a direct interaction. Conditions without successful bait-prey (protein-protein) interaction yielded non-growing yeast cells (red color).
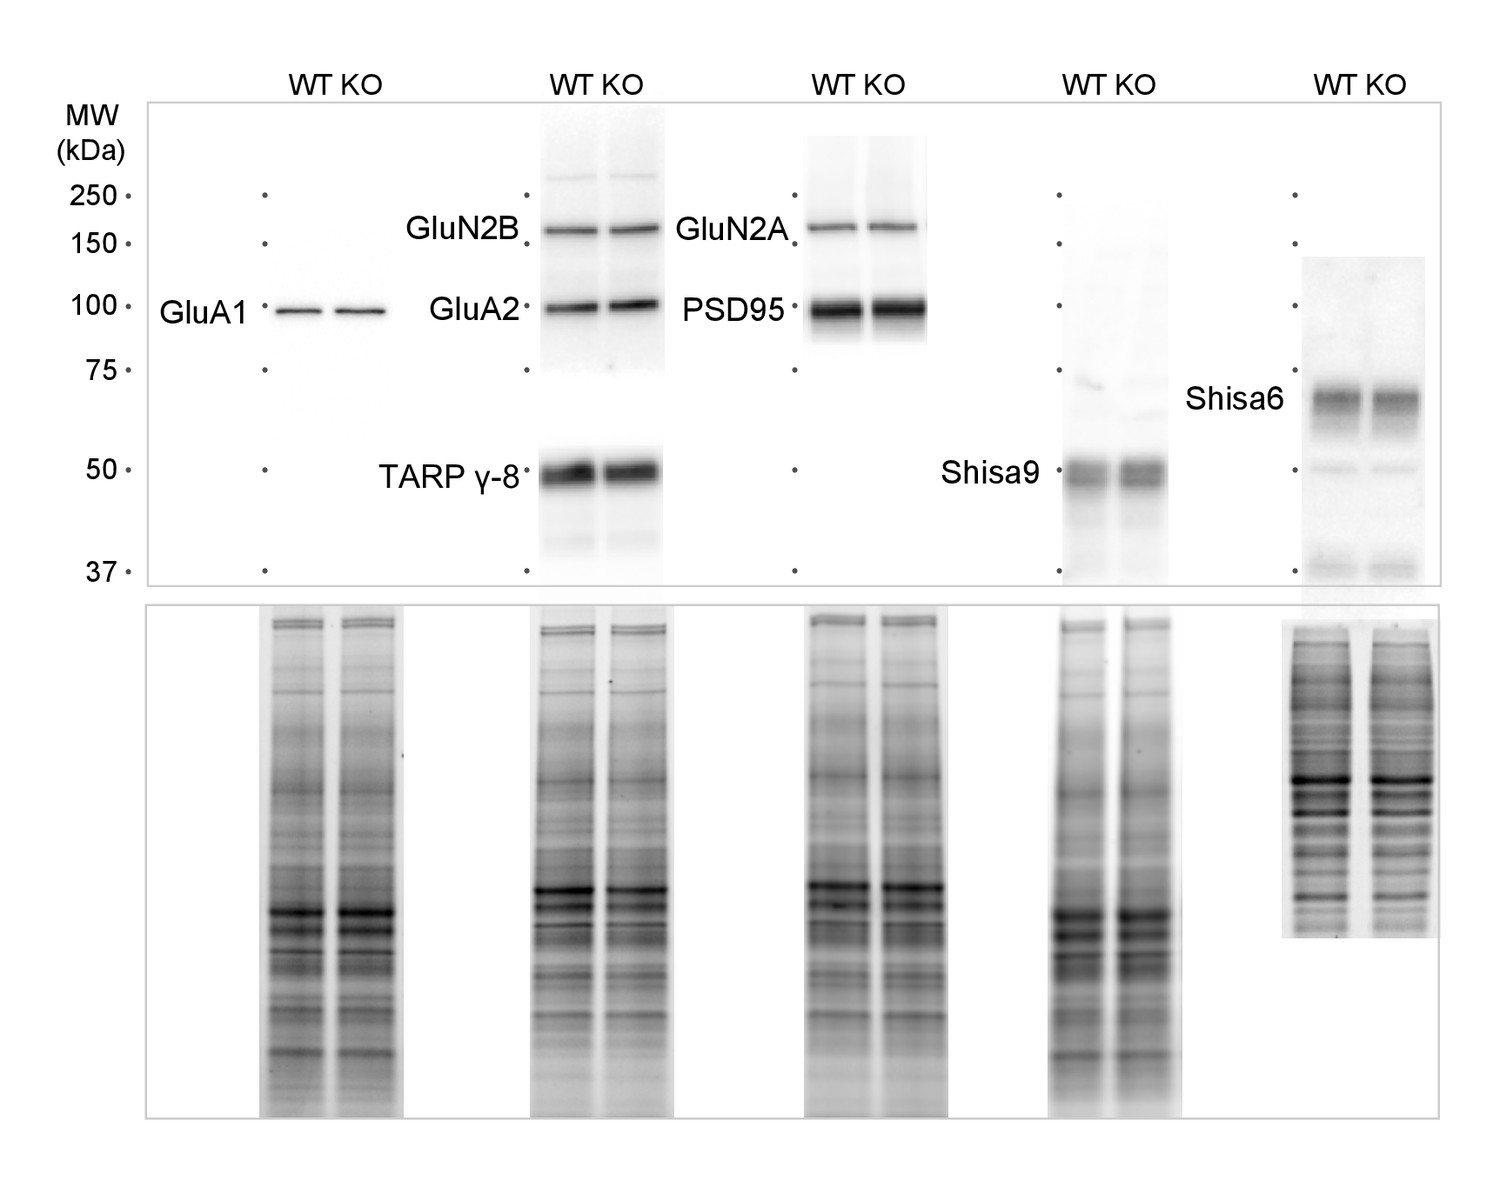
Figure 1—figure supplement 3
Whole immunoblot compilation.
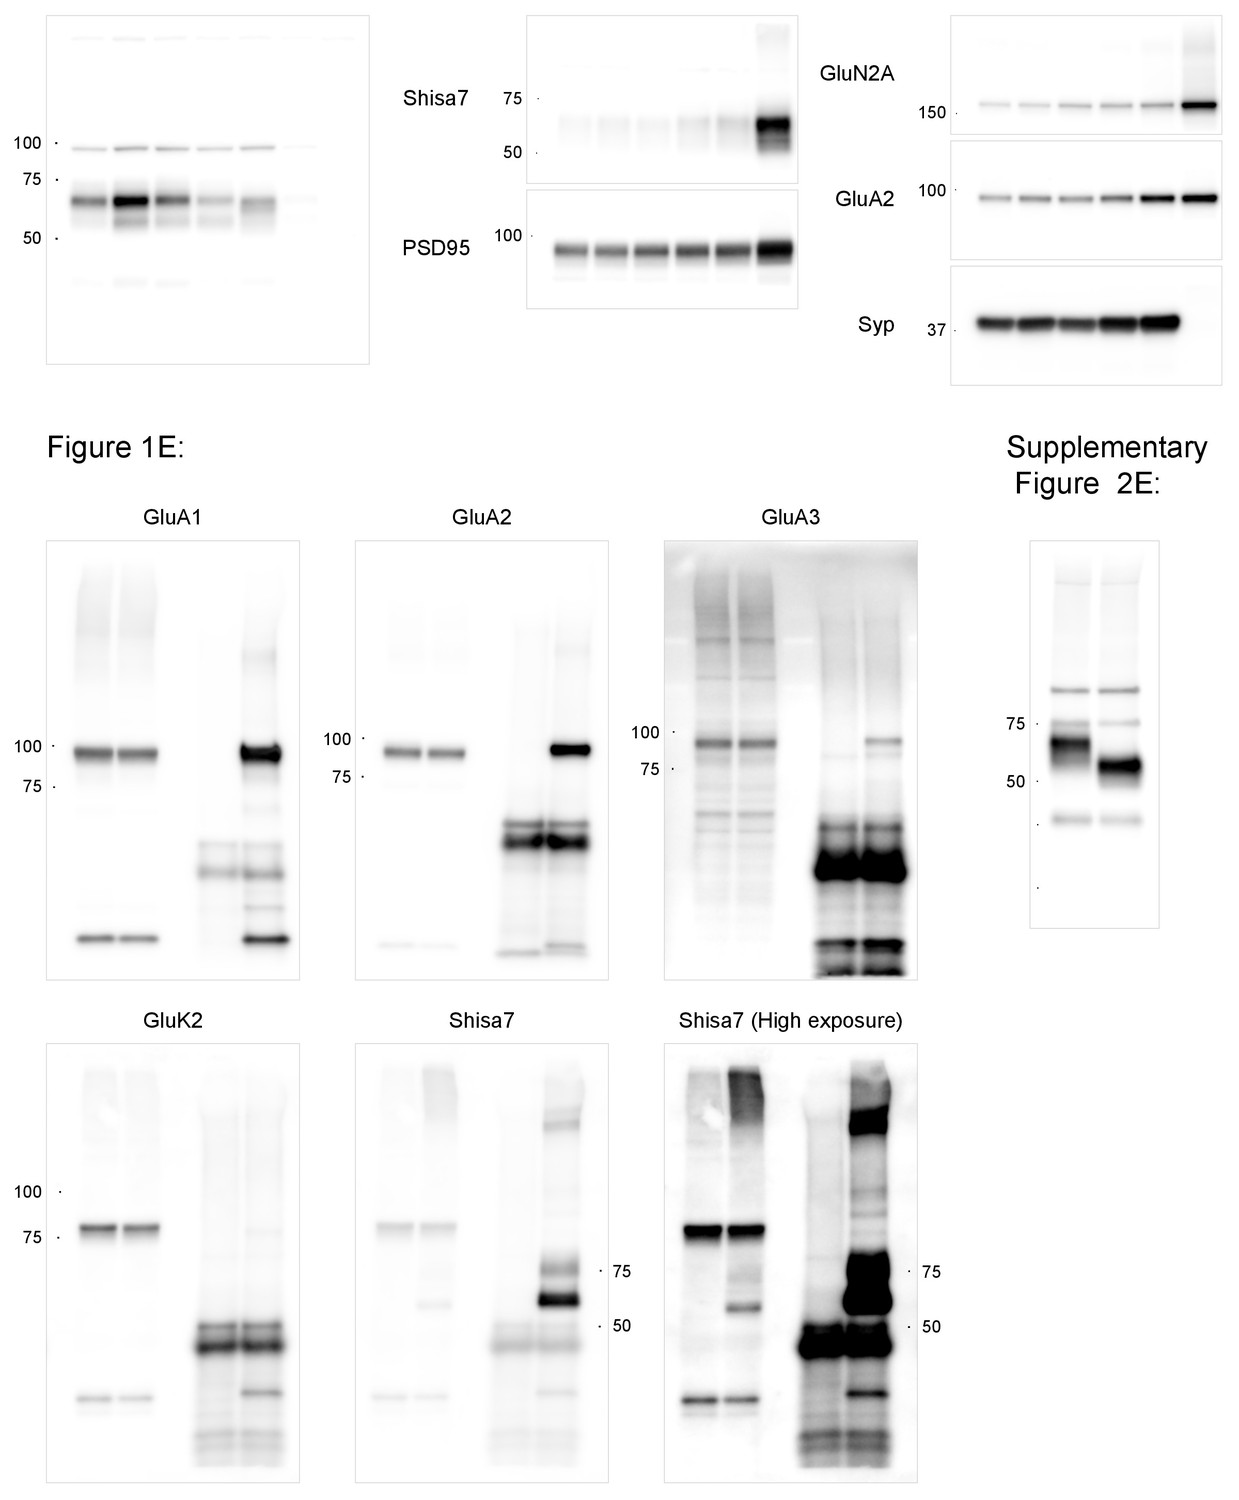
Whole immunoblots are presented from which sections are included in Figure 1b–e, and Figure 1—figure supplement 2e. Numbers represent apparent molecular weights in kDa. Black dots indicate the center of marker bands for the indicated molecular weights.
Figure 2 with 1 supplement
Shisa7 effects on AMPAR desensitization rate and recovery from desensitization.
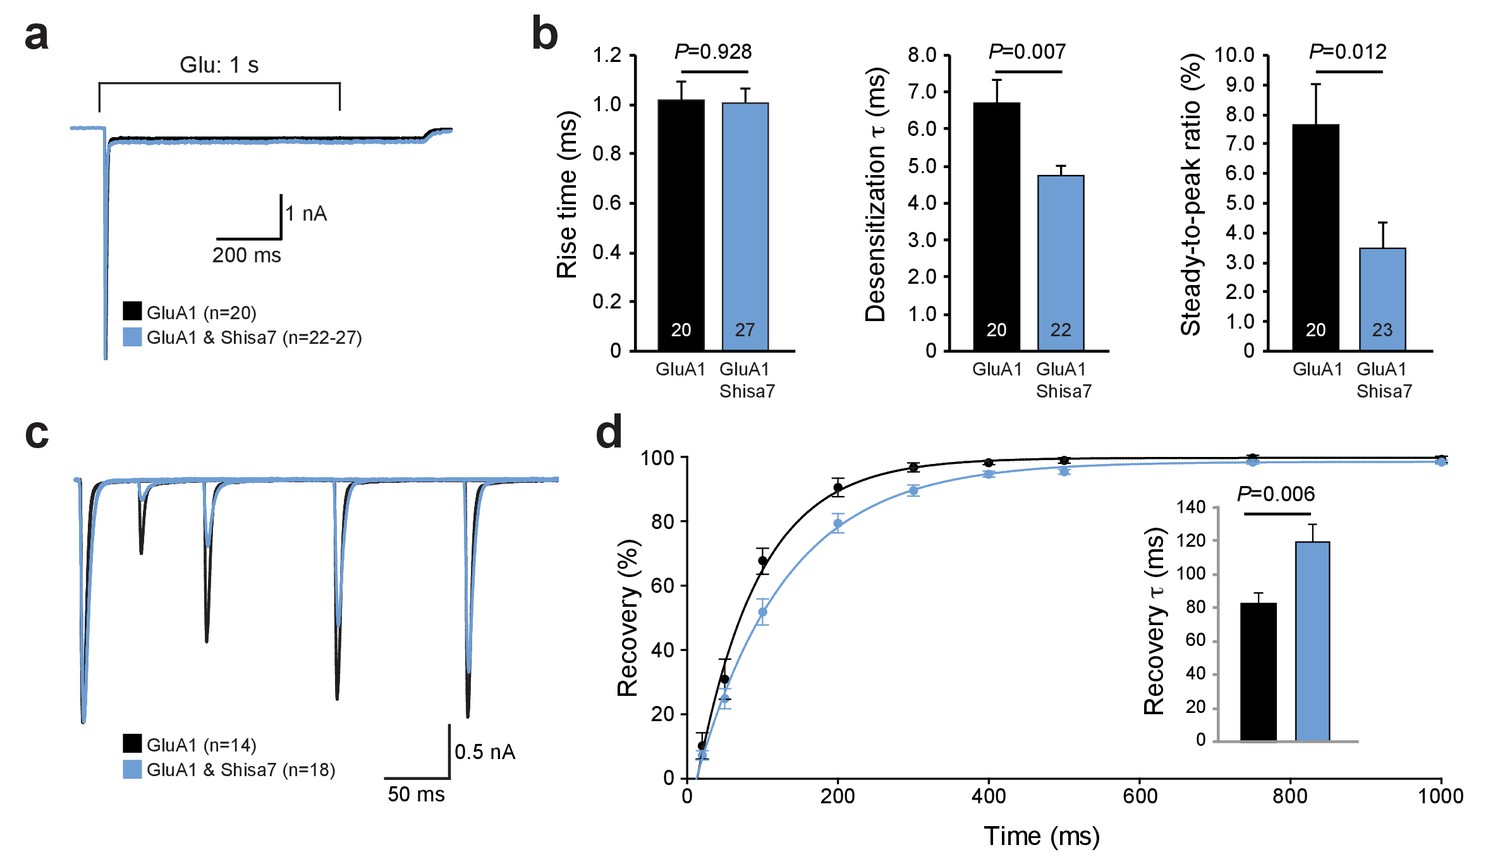
(a) Peak-scaled example trace of whole-cell recordings from HEK293 cells expressing a homomeric GluA1-containing AMPAR channel in the absence (black) or presence (blue) of Shisa7. Currents were evoked by direct application of 1 mM glutamate during 1 s. (b) Bar graphs (mean ±SEM) summarize changes in rise time (t45 = 0.091; p=0.928), desensitization time constant (t25.38 = 2.922; p=0.007) and steady-state AMPAR-mediated currents (t41 = 2.638; p=0.012). (c) Example trace of repeated 1 ms glutamate application from HEK293 cells expressing a homomeric GluA1-containing AMPAR channel in the absence (black) or presence (blue) of Shisa7. (d) Recovery of desensitization (two 1 ms glutamate application with inter-pulse interval of 20, 50, 100, 200, 300, 400, 500, 750, and 1000 ms) from HEK293 cells expressing a homomeric AMPAR channel in the absence (black) or presence (blue) of Shisa7. Inset shows a significant increase in τrecovery in the presence of Shisa7(t23.35 = −3.022; p=0.006).
Figure 2—figure supplement 1
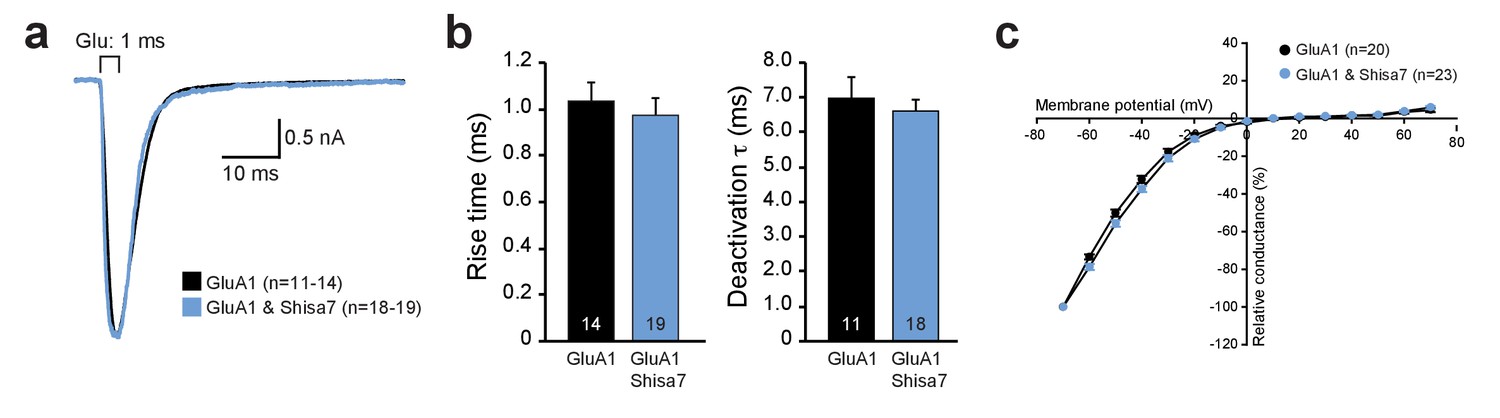
Shisa7 does not alter AMPAR kinetics in vitro or alter membrane properties in vivo.
(a) Peak-scaled example traces of whole-cell recording from HEK293 cells expressing homomeric GluA1-containing AMPAR channels in the absence (black) or presence (blue) of Shisa7. Currents were evoked by direct application of 1 mM glutamate during 1 ms. (b) Bar graphs (mean ±SEM) summarize changes in rise time (p=0.593), and deactivation time (p=0.561) of AMPAR currents mediated by heteromeric AMPARs in HEK293 cells in the presence and absence of Shisa7. (c) IV-curve of homomeric GluA1-containing AMPARs expressed in HEK293 cells in the presence and absence of Shisa7 shows that Shisa7 does not alter rectification of GluA2-lacking AMPARs.
Figure 3 with 1 supplement
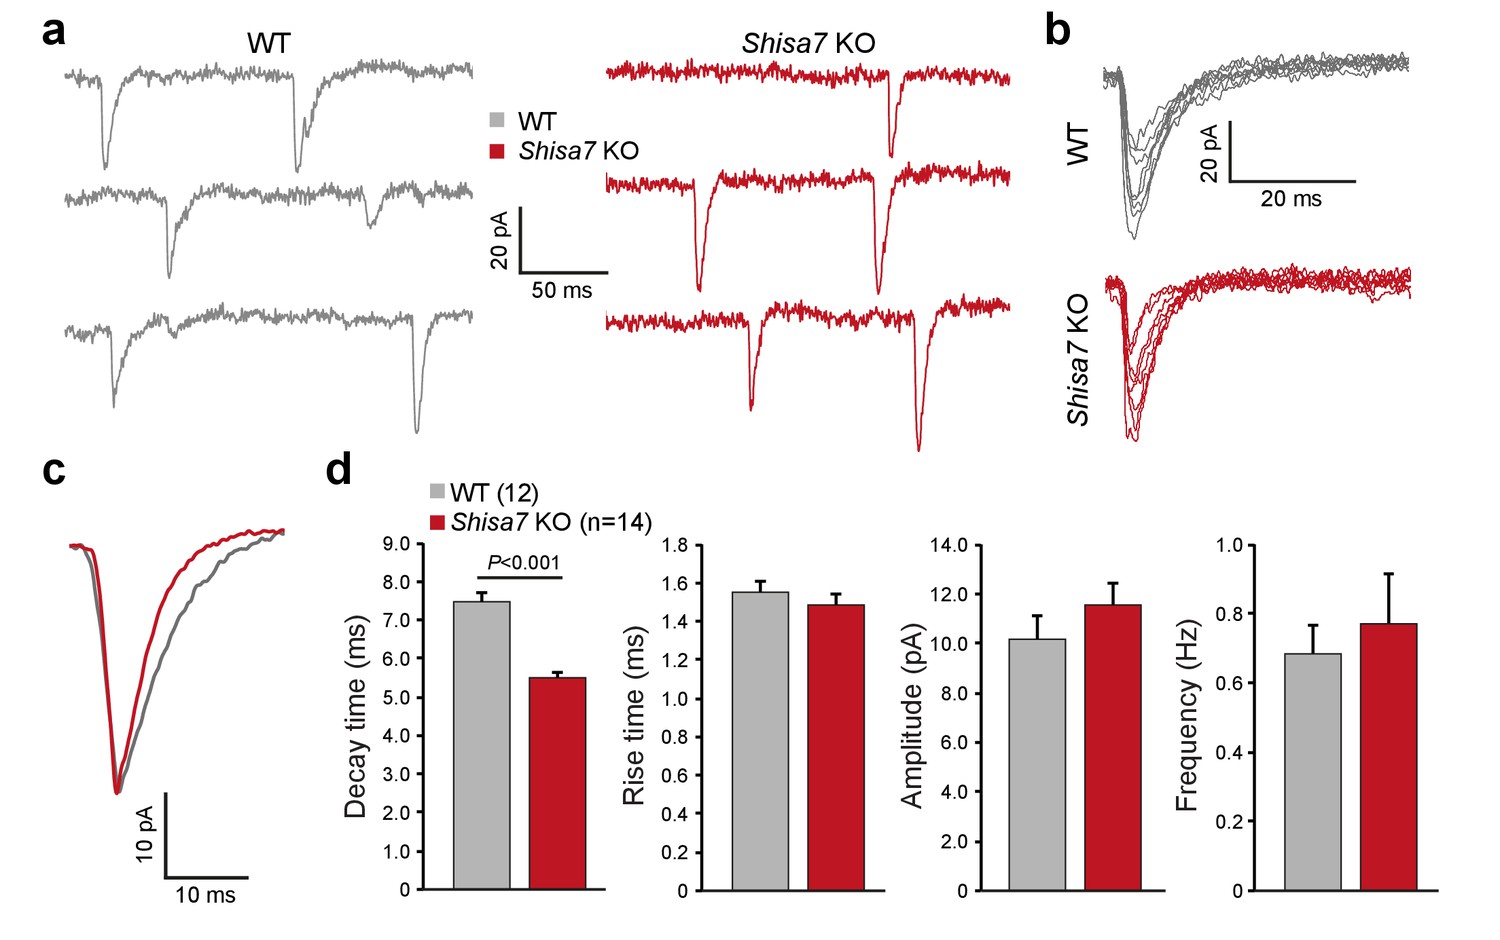
Shisa7 prolongs synaptic AMPAR currents.
(a) Example traces of mEPSC recordings from CA1 pyramidal cells of Shisa7 KO animals and WT littermates. (b,c) Superimposed spontaneous synaptic currents (b), and average synaptic currents (c) of Shisa7 KO animals and WT littermates. (d) Bar graphs (mean ±SEM) of Shisa7 KO (n = 14 cells from six animals) and WTs (n = 12 cells from six animals) show decreased decay time of mEPSCs (WT: 7.48 ± 0.22; Shisa7 KO: 5.50 ± 0.17; p<0.001). Rise time, amplitude and frequency were not significantly affected (p=0.462, p=0.165, p=0.992, respectively).
Figure 3—figure supplement 1
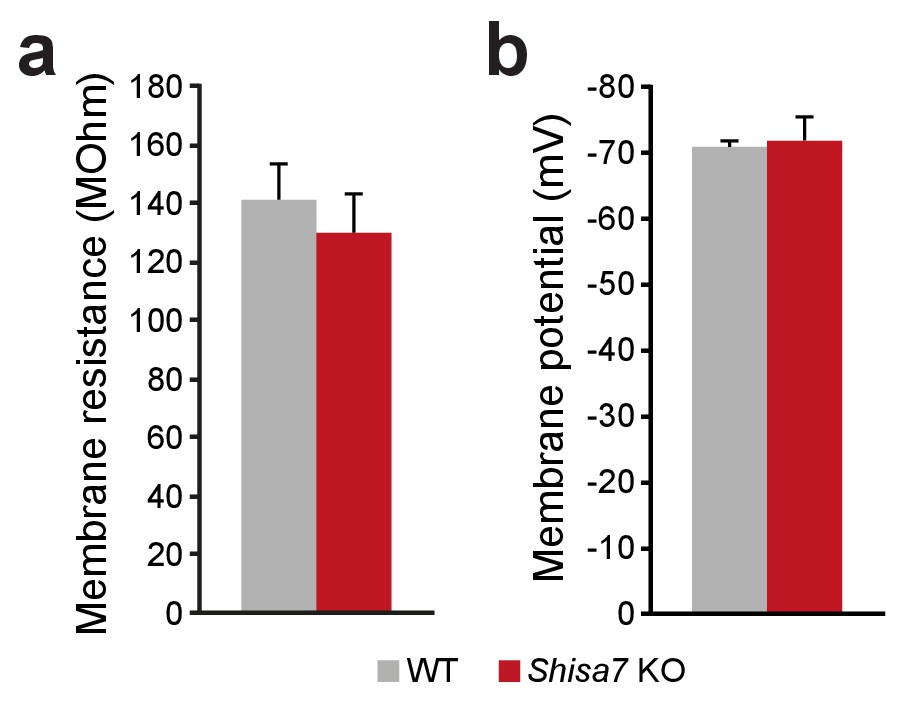
Shisa7 does not alter membrane properties in vivo.
(a,b) Recorded pyramidal cells in the CA1 hippocampal region showed comparable membrane properties for Shisa7 KO and WT mice; membrane resistance (a) and resting membrane potential (b).
Figure 4 with 2 supplements
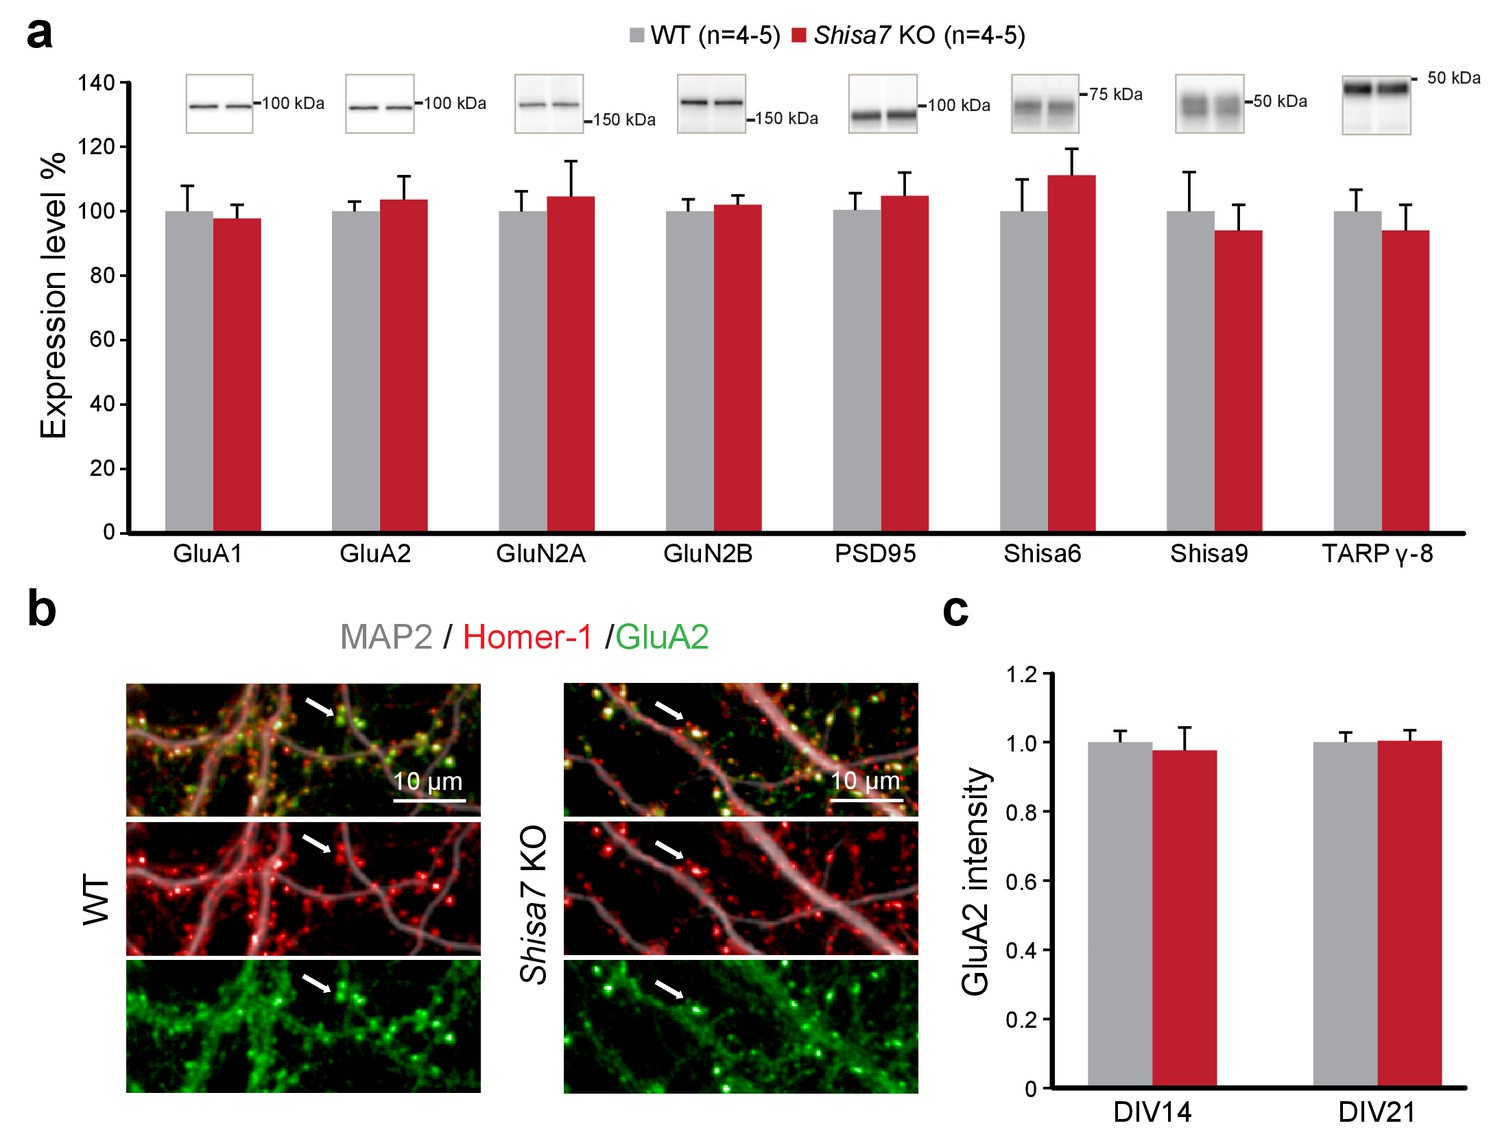
Deletion of Shisa7 maintains glutamatergic synapses under basal conditions.
(a) Immunoblots of hippocampal synaptic membrane fractions from WT and Shisa7 KO mice (n = 4–5 each) do not reveal differences in abundance of AMPAR (MWU tests, GluA1, p=0.421; GluA2, p=1.000), NMDAR (GluN2a, p=0.841; GluN2b, p=0.841), PSD-95 (p=0.841), TARP (γ−8, p=0.841), Shisa9 (p=0.421) or Shisa6 (p=0.310), when expressed as fold change over WT samples. The signal was normalized to the total protein content. (b,c) To assess the quality of the glutamatergic synapse, the intensity of the AMPAR GluA2 subunit was measured (example b; c; n = 10 wells, with five wells from two independent cultures). There was no genotype difference observed (DIV14, p=0.759; DIV21, p=0.919). Scale bars are indicated (b). For total protein loading used for normalization, see Figure 4—figure supplement 2.
Figure 4—figure supplement 1
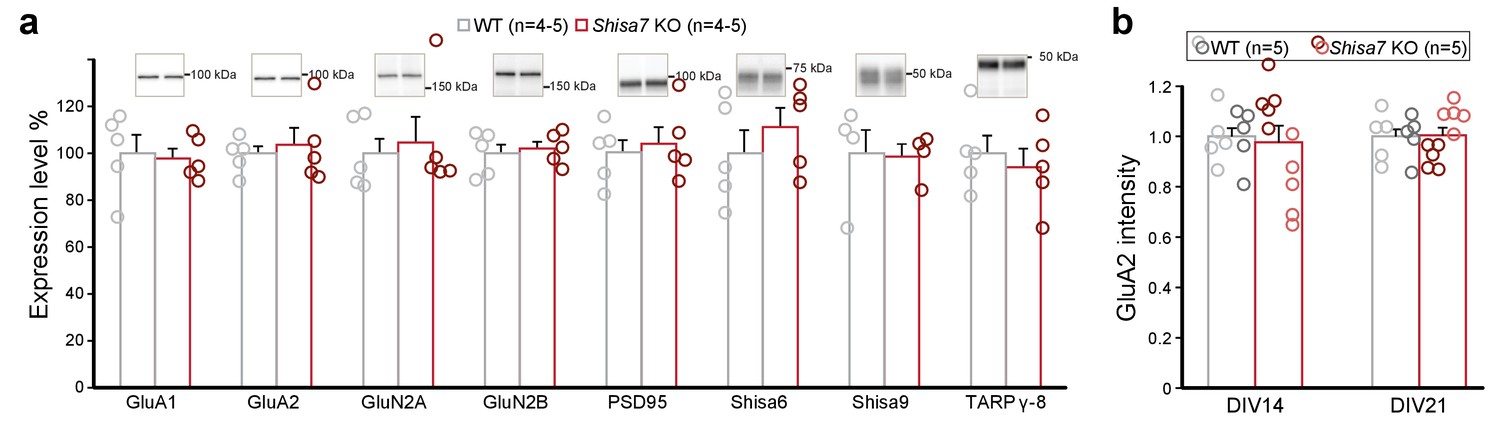
Data as presented in Figure 4, but now with individual data points for WT (gray) and Shisa7 KO (red).
(a) Immunoblots of hippocampal synaptic membrane fractions from WT and Shisa7 KO mice (n = 4–5 each) do not reveal differences in abundance of AMPAR, NMDAR, PSD-95, TARP γ−8, Shisa9 or Shisa6, when expressed as fold change over WT samples. The signal was normalized to the total protein content. (b) To assess the quality of the glutamatergic synapse, the intensity of the AMPAR GluA2 subunit was measured (n = 10 wells, with five wells from two independent cultures). Albeit that there was variation between cultures leading to a small increase or a decrease by genotype per plate, in neither comparison (culture) the factor genotype reached the set significance (t-test; DIV141, p=0.057; DIV142, p=0.054; DIV211, p=0.156; DIV212, p=0.101).
Figure 4—figure supplement 2
For immunoblots presented in Figure 4, we performed normalization of loading differences based on trichloroethanol-assisted total protein staining of the gel.
The representative protein bands and corresponding loading controls are shown.
Figure 5 with 1 supplement
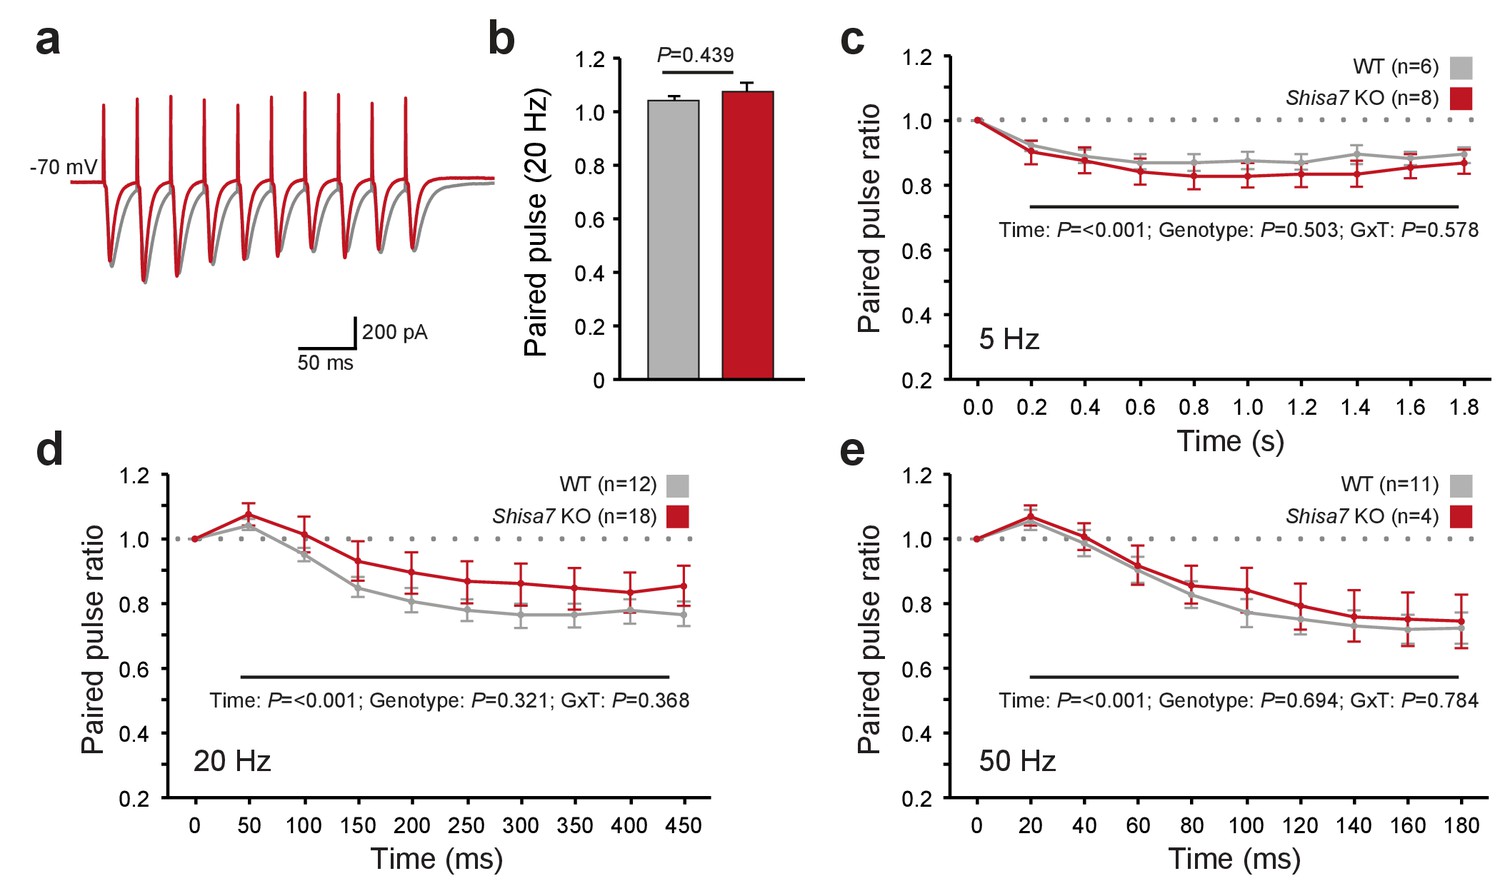
Shisa7 has no effect on short-term plasticity.
(a) Superimposed example traces of whole-cell recordings voltage clamped at –70 mV from CA1 pyramidal neurons of Shisa7 KO animals (red) and WT littermates (grey) in response to 50 Hz stimulation of synaptic inputs from Schaffer collateral fibers. (b) Paired pulse ratio is not affected in Shisa7 KO animals, as exemplified by the 20 Hz data (WT: 1.04 ± 0.02; Shisa7 KO: 1.07 ± 0.03; p=0.439). (c–e) Pulse ratios of electrically-evoked EPSCs from CA1 pyramidal neurons (at –70 mV) of Shisa7 KO animals and WT littermates at 5 Hz (c), 20 Hz (d) and 50 Hz (e). At 5, 20 and 50 Hz, a clear desensitization was observed (factorial repeated measure ANOVA, time: F(2.97,35.65) = 18.21, p<0.001; F(1.55,43.39) = 35.55, p<0.001; F(1.69,21.93) = 35.529, p<0.001, respectively). At none of these frequencies there was a genotype effect or genotype x time interaction (all p>0.3). Cell numbers (n) used are indicated.
Figure 5—figure supplement 1
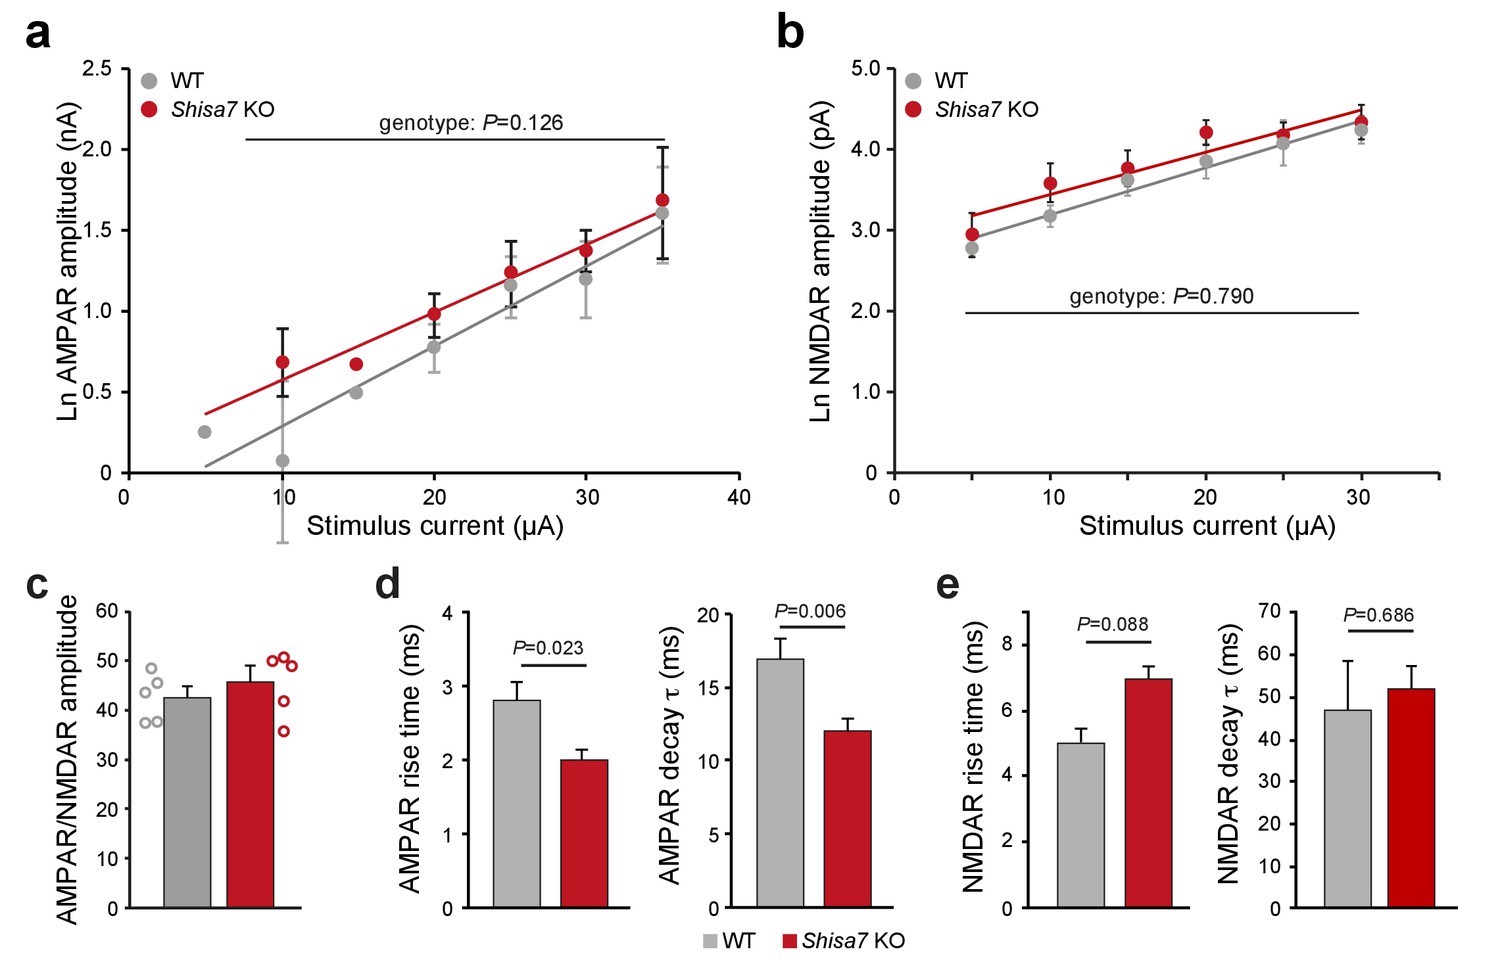
Similar AMPAR and NMDAR amplitudes in Shisa7 KO mice.
(a,b) Correlation analysis of stimulus current injected vs. EPSP amplitude (Ln-transformed data) for AMPAR (a; nA) and NMDAR (b; pA) obtained showed no difference for genotype (a, WT n = 56 data points; Shisa7 KO n = 99 data points; (b) WT n = 23 data points; Shisa7 KO n = 33 data points) by linear regression. (c) The averaged ratio of the median amplitude of AMPAR eEPSCs and the median amplitude of NMDAR eEPSCs at each stimulation current was similar in Shisa7 KO and WT slices. Individual ratios are shown. (d,e) Shisa7 KO animals show a faster rise time (WT: 2.80 ± 0.26 ms; Shisa7 KO: 2.00 ± 0.13 ms; unpaired t-test p=0.032) and a faster deactivation time (WT: 16.9 ± 1.4 ms; Shisa7 KO: 12.0 ± 0.9 ms; unpaired t-test p=0.006) for AMPAR eEPSCs (d). There was no significant genotype difference for rise time (WT: 5.0 ± 0.45 ms; Shisa7 KO: 7.0 ± 0.40 ms; unpaired t-test p=0.088) or deactivation time (WT: 46.9 ± 11.8 ms; Shisa7 KO: 51.9.0 ± 5.6 ms; unpaired t-test p=0.686) (e).
Figure 6 with 2 supplements
Deletion of Shisa7 slows down initiation and decreases maintenance of LTP.
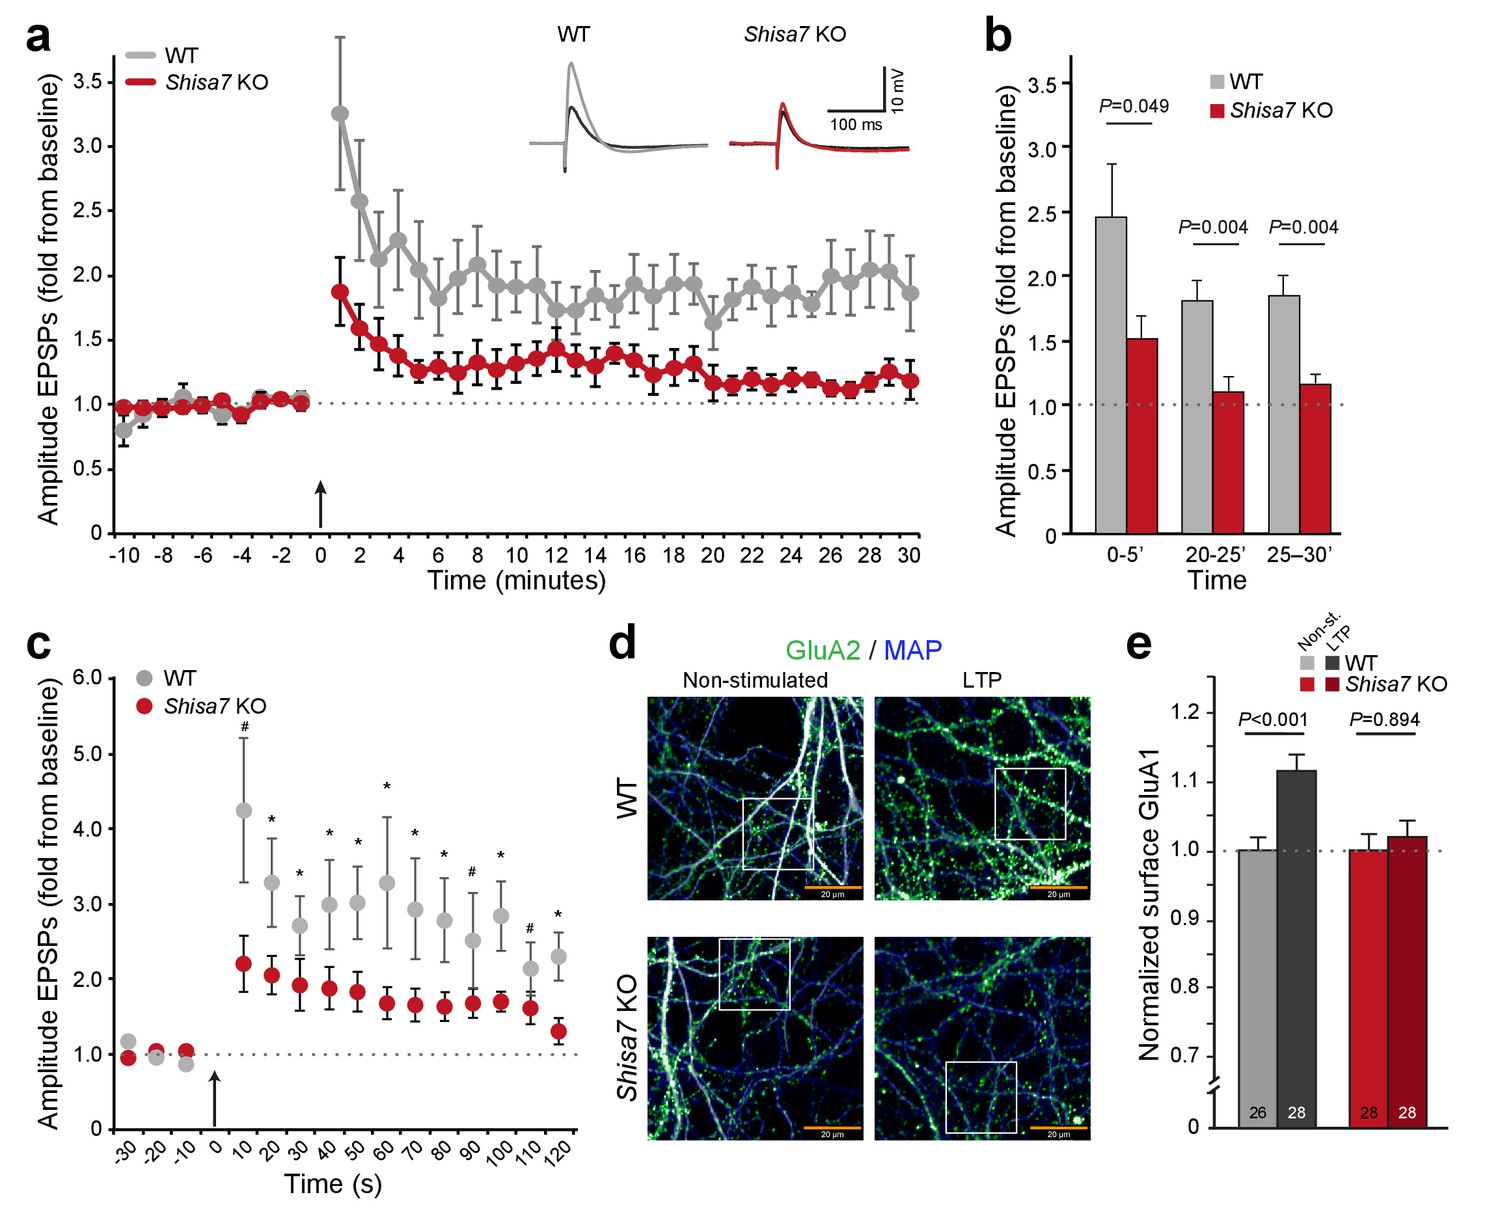
(a) Normalized EPSP amplitude over the time course of the LTP experiments shows a clear genotype effect (WT, n = 5 slices, n = 5 mice; Shisa7 KO, n = 6 slices, n = 6 mice). The arrow indicates the theta burst stimulation. Inset: Example of LTP effect on WT (left) and the Shisa7 KO (right) showing the EPSP shape during baseline (black) and after LTP induction (gray, red; last 10 minutes). (b) Normalized EPSP amplitude binned during 5 minute intervals early after LTP induction (0–5’) and in the maintenance phase (20–25’, 25–30’) shows a significant genotype effect. Individual data are shown in Figure 6—figure supplement 2. (c) Zoom-in of the first 2 minute after theta burst application (arrow) for normalized EPSP amplitude showed an immediate genotype effect (unpaired t-tests, *p<0.05; #p<0.1). Dotted lines show base-line EPSP amplitude. (d) Example of GluA1 surface staining (green; MAP, blue) of hippocampal neurons (WT, Shisa7 KO) after glycine-induced chemical LTP vs. non-stimulated (scale bar 20 µm). Insets are shown in Figure 6—figure supplement 2. (e) Quantification of number of surface GluA1 spots normalized to dendritic length from two independent experiments (n = 26–28 wells per group, based on average of 15–40 pictures per well) showed a significant effect of LTP in WT but not in Shisa7 KO neurons. Individual data are shown in Figure 6—figure supplement 2.
Figure 6—figure supplement 1
Deletion of Shisa7 slows down initiation and decreases maintenance of LTP.
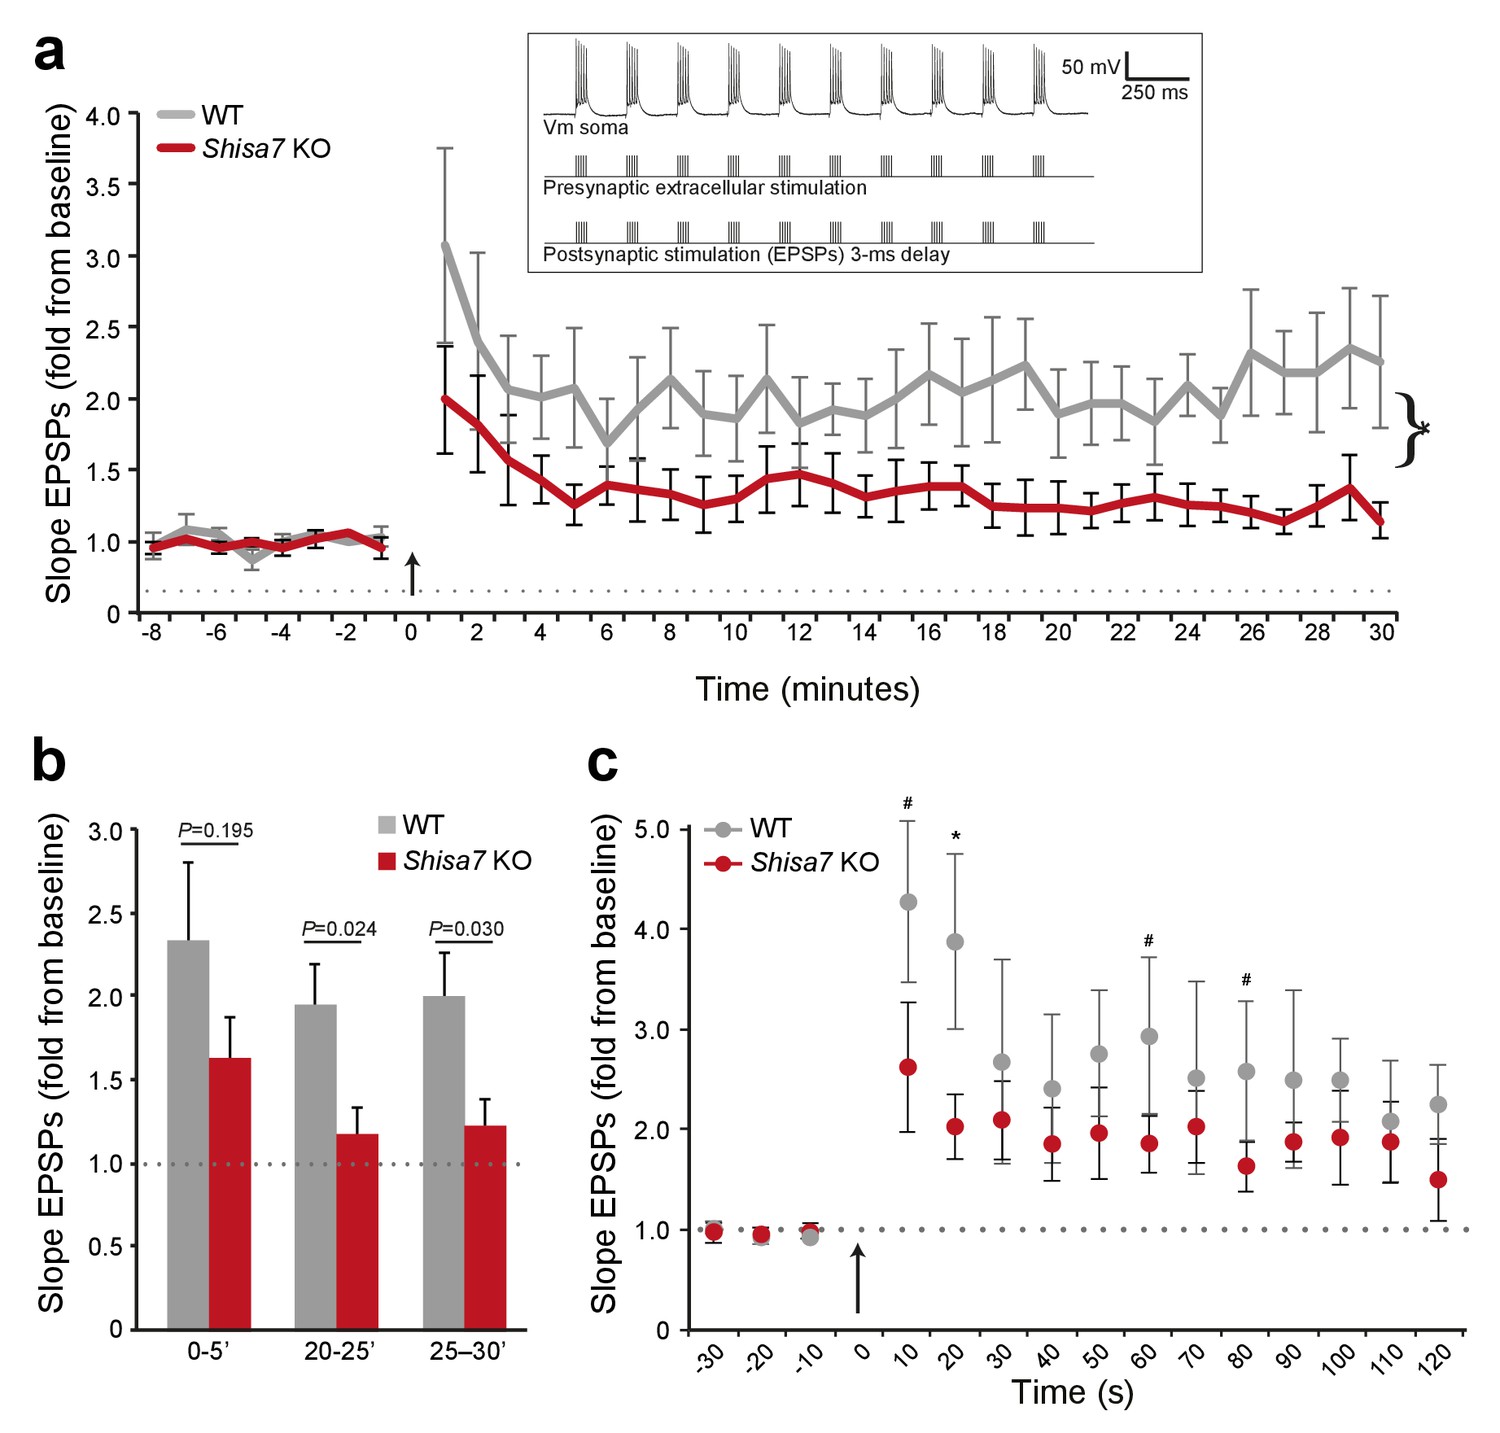
(a) Normalized EPSP slope over the time course of the LTP experiments shows a clear genotype effect, with a reduction in Shisa7 KO, similar as observed for amplitude (cf. Figure 5)(WT, n = 5 slices, n = 5 mice; Shisa7 KO, n = 6 slices, n = 6 mice). The arrow indicates the theta burst stimulation. Inset: schematic of LTP induction protocol, with vertical bar representing extracellular current injections (action potential (AP) generation) and synaptic stimulation (EPSPs with a 3 ms delay) for 1 out of 3 theta bursts given. (b) Quantification of the normalized EPSP slope binned during 5 minute intervals early after LTP induction (0–5’) and in the maintenance phase (20–25’, 25–30’), showed a significant genotype effect only in the latter time points. (c) A zoom-in of the first 2 minutes after theta burst application (arrow) showed a trend for a genotype effect for normalized EPSP slope at this short time interval (unpaired t-tests, *p<0.05; #p<0.1).
Figure 6—figure supplement 2
Deletion of Shisa7 slows down initiation and decreases maintenance of LTP by affecting AMPAR recruitment.
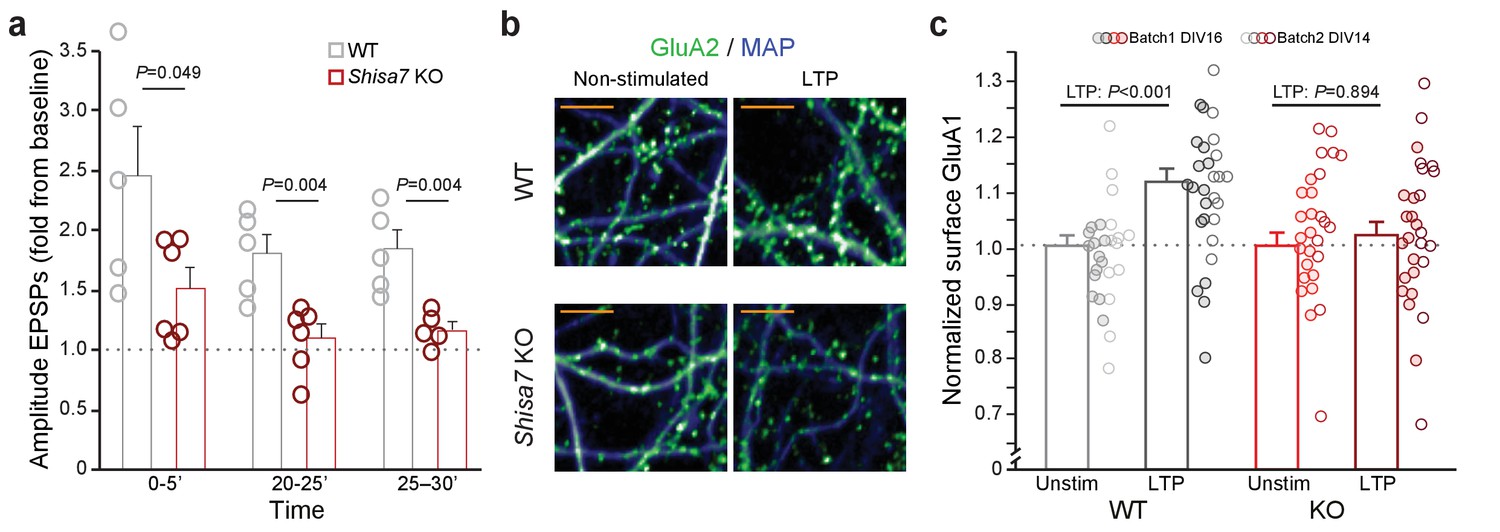
(a) Normalized EPSP amplitude (WT, n = 5 slices, n = 5 mice; Shisa7 KO, n = 6 slices, n = 6 mice mind that the last data point contains n = 5) binned during 5 minute intervals early after LTP induction (0–5’) and in the maintenance phase (20–25’, 25–30’) shows a significant genotype effect with individual data points indicated. (b) Enlarged examples of GluA1 surface staining (green; MAP, blue) from hippocampal neurons (WT, Shisa7 KO) after glycine-induced chemical LTP vs. non-stimulated as represented in Figure 6d (scale bar: 10 µm). (c) Normalized surface GluA1 boutons per µm dendrite after chemical LTP shows a significant genotype effect with individual data points indicated for data resulting from two independent experiments (batch 1, DIV16; batch 2, DIV14).
Figure 7 with 2 supplements
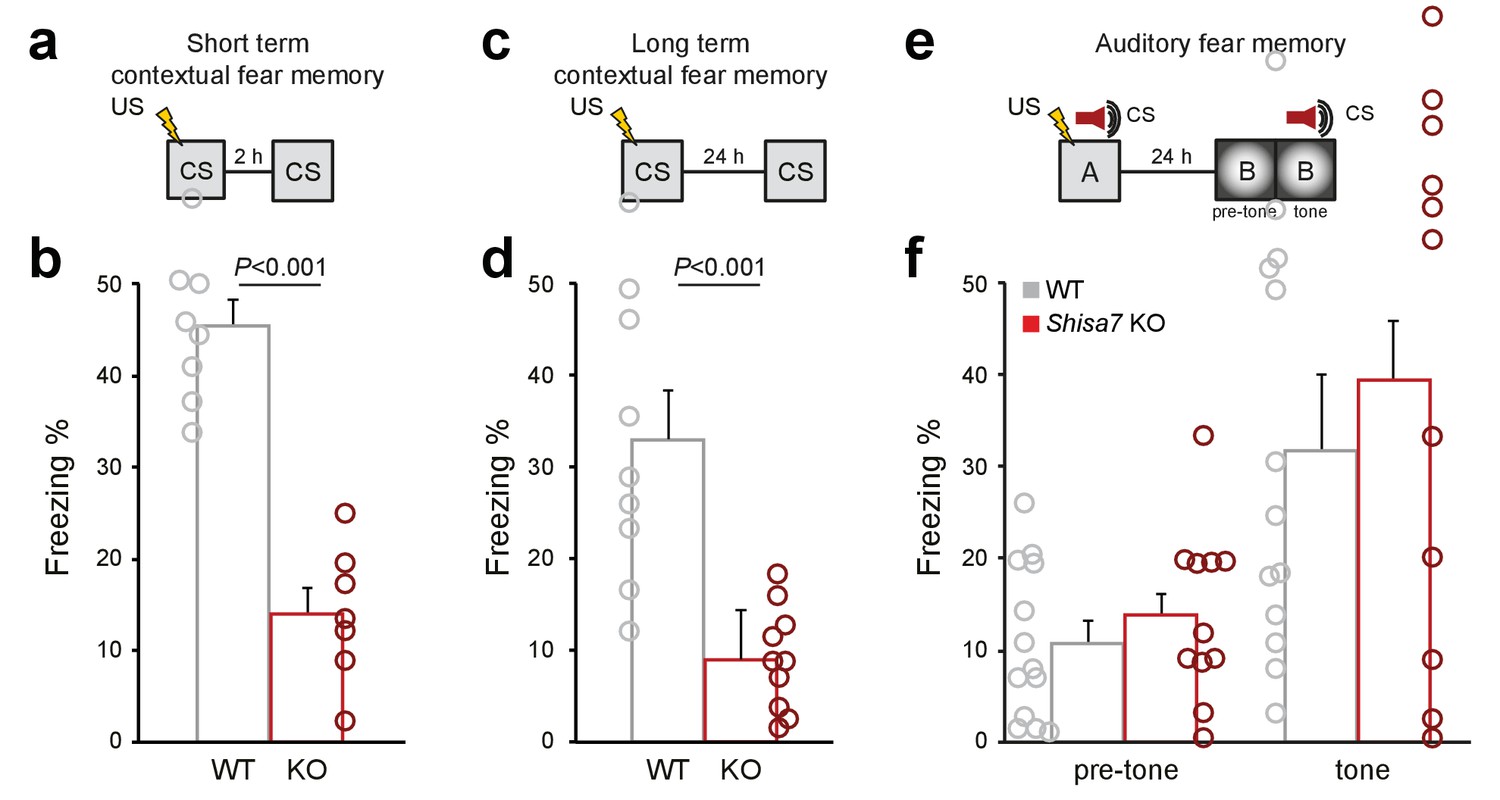
Deletion of Shisa7 specifically affects contextual fear memory.
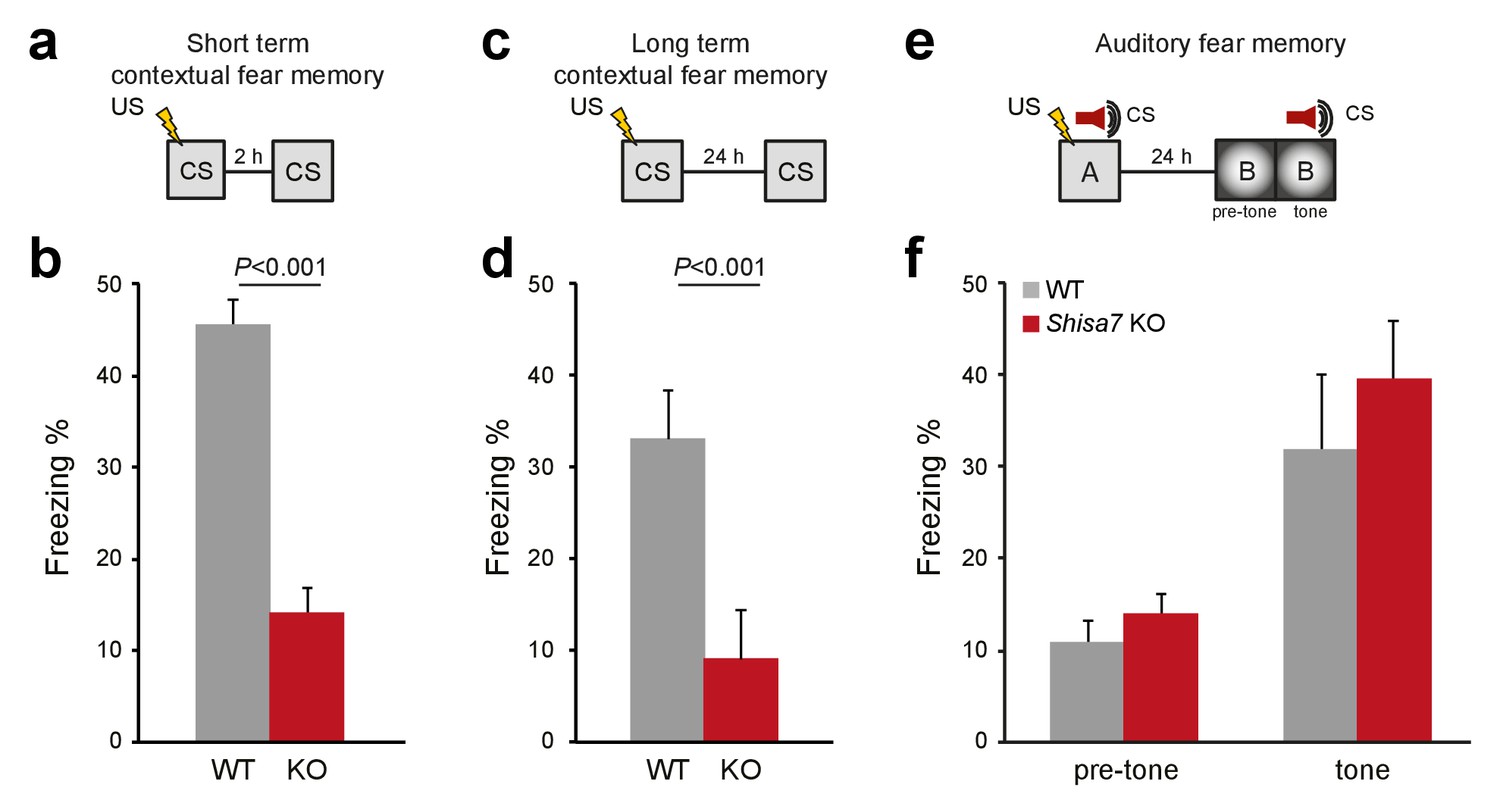
(a,c) Experimental set-up of measuring contextual fear conditioning memory (a,c), in which mice received a foot shock (US) in a specific environment (CS), and freezing was assessed upon re-exposure to the CS 2 hr, or 24 hr later to measure short term and long term contextual fear memory, respectively. (b,d) For Shisa7 KO mice, both a short term fear memory deficit (nWT = 8, nKO = 7; unpaired t-test, p<0.001; (b), as well as a long term fear memory deficit (nWT = 9 nKO = 10; Mann-Whitney U-test, p=0.001; (d) were observed. (e) Experimental set-up of measuring auditory fear conditioning memory, in which a 30 s tone co-terminated with a foot shock and memory was tested 24 hr after conditioning in a novel environment to measure generalization of fear (pre-tone), and the auditory fear memory in response to cue presentation (tone). (f) Auditory fear memory was not affected by genotype (nWT = 13, nKO = 12; ANOVA, F(1,23)=0.733 p=0.401). Individual data is shown in Figure 7—figure supplement 1.
Figure 7—figure supplement 1
Deletion of Shisa7 specifically affects contextual fear memory.
In addition to the set-ups (a,c,e) and average freezing data of Figure 7, the individual data are shown for short term fear memory (nWT = 8, nKO = 7; b), long term fear memory (nWT = 9 nKO = 10; d), as well as long-term auditory fear memory (nWT = 13, nKO = 12).
Figure 7—figure supplement 2
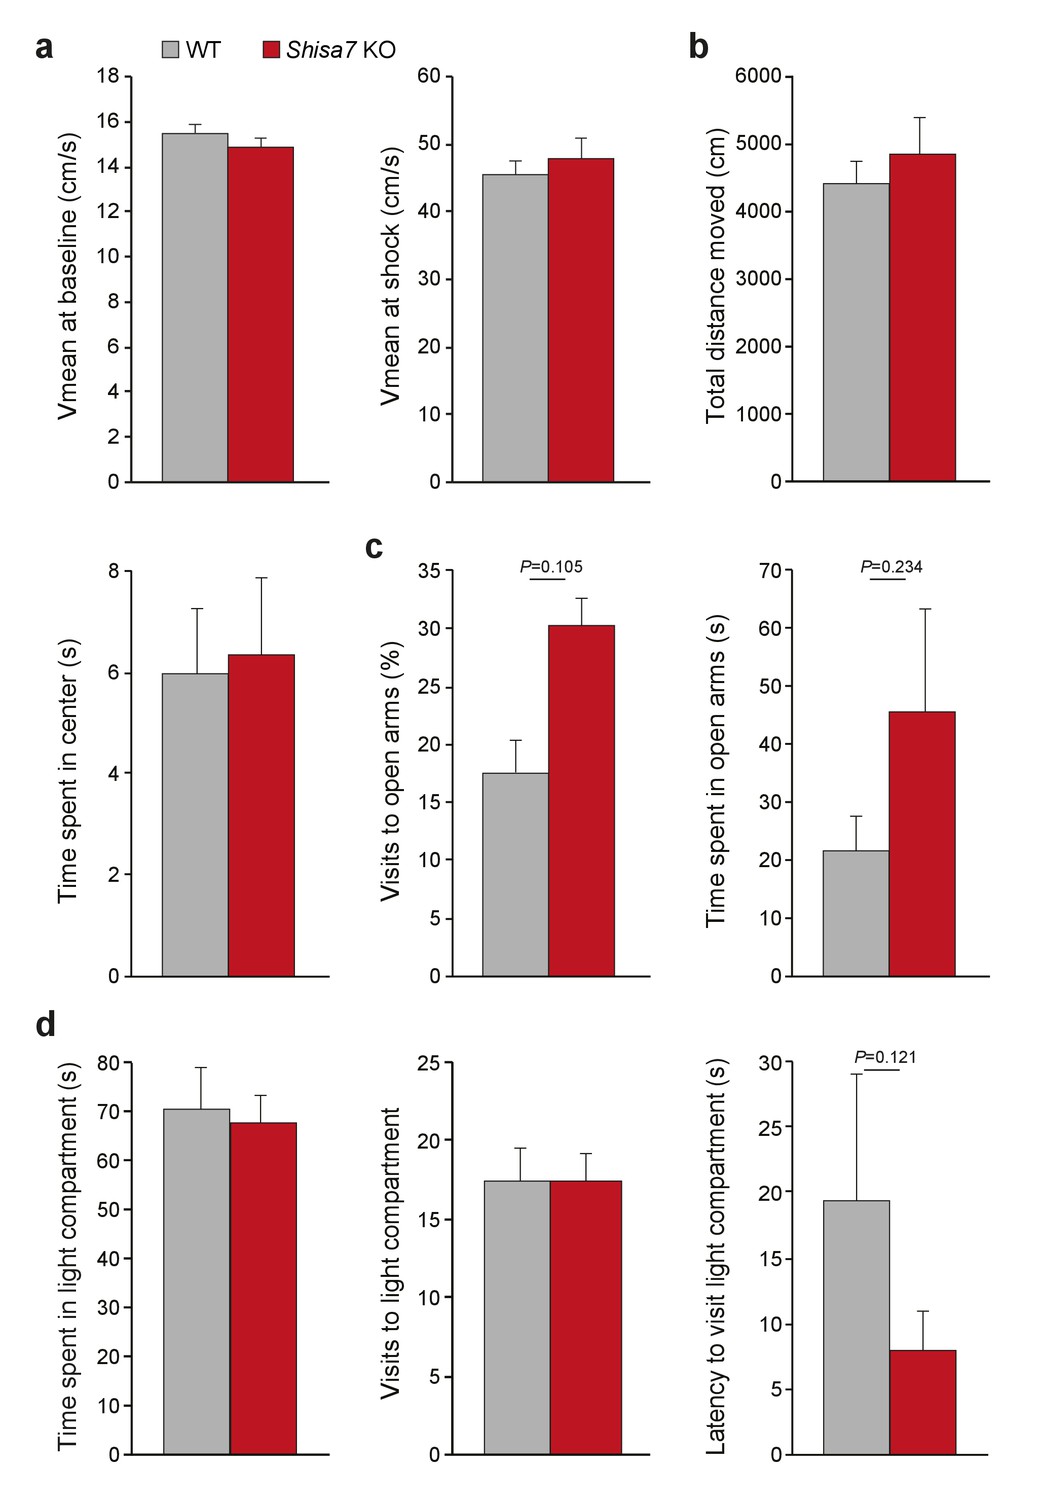
Shisa7 KO mice display no abnormalities in shock sensation, locomotor activity or anxiety-related behavior.
(a) Mean velocity in the 3 minutes prior to shock (left), or during the 2 s 0.7 mA shock (right) was not different between Shisa7 KO (n = 10) and WT littermates (n = 9), indicating no effect on basal locomotor activity (unpaired t-test p=0.245) or the perception of the shock (unpaired t-test p=0.573). (b–d) A set of anxiety tests (open field, elevated plus maze (EPM), and dark-light box (DL-box)) was carried out sequentially in a batch of Shisa7 KO (n = 8) and WT littermates (n = 8) (cf. Supplementary Figure 2). (b) Open field exploratory behavior (total distance moved) or the anxiety-related component (time spent in the center) was not different between genotypes (MWU tests, p=0.798; p=0.878, respectively). (c) EPM anxiety parameters were similar for Shisa7 and WT mice for the percentage of visits to the open arms (MWU test, p=0.105), and time spent in the open arms (MWU test, p=0.234). Only in this test, one Shisa7 KO mouse was identified as outlier, and when removed this made the difference even smaller (p=0.189, p=0.397). (d) None of the anxiety-motivational parameters measured in the DL-box showed a genotype difference, with time spent in the light compartment, visits to the light compartment and latency to visit to the light compartment being non-significant (MWU tests, p=1.000; p=1.000; p=0.121, respectively). Only for latency, one WT mouse was identified as outlier, and when removed this made the difference even smaller (p=0.209).
Figure 8
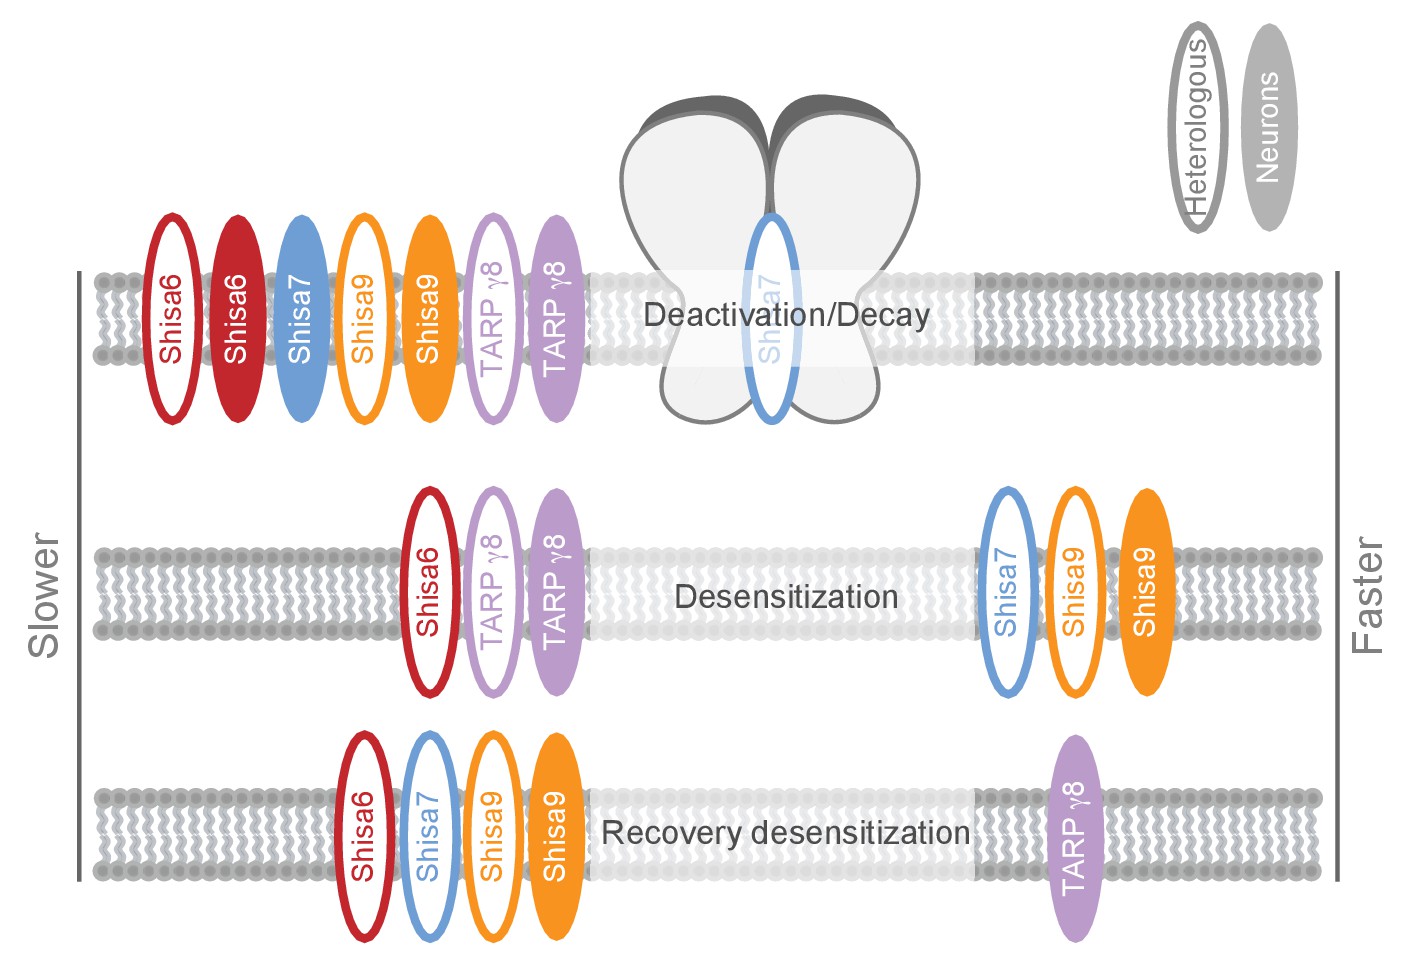
Schematic representation of effects on AMPA type glutamate receptors by Shisa family members and TARP γ−8.
The effect is depicted for different AMPAR kinetic parameters measured in heterologous expression systems (HEK293 cells or oocytes; open ovals), or ex vivo in hippocampal slices (filled ovals). Additional modulatory properties and references are given in Supplementary file 1.
Tables
Table 1
Shisa7 is a native interactor of hippocampal AMPARs.
Shisa7 complexes were immunoprecipitated from the hippocampi of Shisa7 WT and KO animals (DDM-extracted crude synaptic membranes; n = 3 IPs per genotype) and subjected to mass spectrometric analysis. The following protein categories are highlighted: Shisa7 (dark blue), AMPAR subunits (light blue), established non-PDZ AMPAR-interacting proteins (Schwenk et al., 2012) (dark yellow), PDZ domain-containing interactors (light yellow). Percent coverage, percent of the database protein sequence covered by all matching peptides. Green background highlights values of statistical significance upon performing a Student’s t-test with permutation-based FDR analysis (S0 = 1, FDR = 0.01 (dark green) or FDR = 0.05 (light green)). Note the identification of a peptide specific for exon 4 containing Shisa7 (NLYNTMKPSNLDwNLHYNVNSPK; diamond indicates exon3-exon4 boundary). The full list of identified protein groups is reported in Table 1—source data 1, and the statistical analysis is provided in Table 1—source data 2, which includes a volcano-plot of differentially IP-ed proteins.
| Gene name | Uniprot recommendedprotein name(s) | Uniprot ID | PDZ-domains | Number of unique peptides | LFQ intensity | Average KO LFQ intensity | Average WT LFQ intensity | Average KO/WT LFQ intensity | Average WT/KO LFQ intensity | T-test significant FDR0.01 = ++ DR0.05 = + | T-test q-value | Percent cover-age | ||||||||||
|---|---|---|---|---|---|---|---|---|---|---|---|---|---|---|---|---|---|---|---|---|---|---|
| KO1 | KO2 | KO3 | WT1 | WT2 | WT3 | KO1 | KO2 | KO3 | WT1 | WT2 | WT3 | |||||||||||
| Shisa7 | Protein Shisa-7 | Q8C3Q5 | 0 | 1 | 1 | 2 | 17 | 18 | 16 | 865 | 873 | 1750 | 319820 | 305190 | 346730 | 1163 | 323913 | 0.4% | 278.58 | ++ | 0.0000 | 39.2 |
| Protein Shisa-7:Exon4-specificpeptideNLYNTMKPSNLDNLHYNVNSPK | - | - | 0 | 0 | 0 | 1 | 0 | 0 | - | - | - | - | - | - | - | - | - | - | - | - | - | |
| Gria1 | Glutamatereceptor 1 | P23818 | 0 | 0 | 0 | 0 | 10 | 12 | 12 | 5921 | 0 | 3217 | 17828 | 52304 | 54212 | 4569 | 41448 | 11.0% | 9.07 | ++ | 0.0000 | 22.8 |
| Gria2 | Glutamatereceptor 2 | P23819 | 0 | 2 | 1 | 0 | 17 | 17 | 17 | 2743 | 0 | 0 | 104860 | 101430 | 93097 | 2743 | 99796 | 2.7% | 36.39 | ++ | 0.0000 | 36.4 |
| Gria3 | Glutamatereceptor 3 | Q9Z2W9 | 0 | 0 | 0 | 0 | 4 | 4 | 5 | 0 | 0 | 0 | 6529 | 7068 | 10102 | 0 | 7900 | 0.0% | NaN | ++ | 0.0000 | 17.7 |
| Cacng8 | Voltage-dependentcalciumchannelgamma-8subunit;TARPgamma-8 | Q8VHW2 | 0 | 2 | 2 | 1 | 2 | 1 | 5 | 4023 | 0 | 0 | 0 | 0 | 3962 | 4023 | 3962 | 101.5% | 0.98 | - | N/A | 30.5 |
| Olfm1 | Noelin | O88998 | 0 | 1 | 1 | 0 | 0 | 2 | 2 | 0 | 1076 | 0 | 0 | 1004 | 779 | 1076 | 892 | 120.6% | 0.83 | - | N/A | 7.0 |
| Prrt1 | Proline-richtransmem-braneprotein 1;SynDIG4 | O35449 | 0 | 0 | 0 | 0 | 1 | 1 | 0 | 0 | 0 | 0 | 969 | 0 | 0 | 0 | 969 | 0.0% | NaN | - | N/A | 7.2 |
| Prrt2 | Proline-richtransmem-braneprotein 2 | E9PUL5 | 0 | 0 | 1 | 0 | 1 | 1 | 1 | 0 | 333 | 0 | 318 | 0 | 202 | 333 | 260 | 127.9% | 0.78 | - | N/A | 3.8 |
| Rap2b | Ras-relatedproteinRap-2b | P61226 | 0 | 0 | 1 | 1 | 1 | 0 | 0 | 0 | 0 | 2588 | 0 | 0 | 0 | 2588 | 0 | NaN | 0.00 | - | N/A | 12.0 |
| Shisa6 | Proteinshisa-6homolog | Q3UH99 | 0 | 1 | 0 | 0 | 3 | 3 | 1 | 0 | 0 | 0 | 2666 | 3580 | 2136 | 0 | 2794 | 0.0% | NaN | + | 0.0306 | 9.9 |
| Dlg1 | Disks largehomolog 1;SAP97 | Q811D0 | 3 | 0 | 1 | 1 | 3 | 0 | 0 | 0 | 0 | 0 | 2126 | 0 | 0 | 0 | 2126 | 0.0% | NaN | - | N/A | 4.4 |
| Dlg3 | Disks largehomolog 3;SAP102 | P70175 | 3 | 0 | 0 | 0 | 0 | 2 | 2 | 0 | 0 | 0 | 0 | 2441 | 0 | 0 | 2441 | 0.0% | NaN | - | N/A | 4.8 |
| Dlg4 | Disks largehomolog 4;PSD95 | Q62108 | 3 | 0 | 0 | 0 | 9 | 8 | 7 | 0 | 0 | 0 | 11835 | 13410 | 9284 | 0 | 11510 | 0.0% | NaN | ++ | 0.0000 | 21.7 |
| Magi2 | Membrane-associatedguanylatekinase,WW and PDZdomain-containingprotein 2 | Q9WVQ1 | 6 | 0 | 0 | 0 | 1 | 1 | 0 | 0 | 0 | 0 | 0 | 1558 | 0 | 0 | 1558 | 0.0% | NaN | - | N/A | 1.6 |
-
Table 1—source data 1
Maxquant analysis of hippocampal Shisa7 immunoprecipitation experiments, as detailed in the Materials and methods section.
The Maxquant ‘proteinGroups.txt’ output file was supplemented with ‘LFQ intensity _ Average KO’, ‘LFQ intensity _ Average WT’, and the ‘KO/WT’ and ‘WT/KO’ ratios thereof.
- https://doi.org/10.7554/eLife.24192.008
-
Table 1—source data 2
Statistical analysis of hippocampal Shisa7 immunoprecipitation data, as detailed in the Materials and methods section.
Tab 1: In summary, the Maxquant ‘proteinGroups.txt’ output file was imported into Perseus, and processed in the following manner: (1) Removal of ‘Reverse’, ‘Potential contaminant’, and ‘Only identified by site’ protein groups; (2) Log(2) transformation of all LFQ intensity values; (3) Removal of protein groups with less than three valid ‘Log(2) LFQ intensity’ values in either the WT or KO groups; (4) Imputation of missing values (8.6% of the population) from a normal distribution (width 0.3, down shift 1.8, whole matrix); (5) Performing a Student's t-test followed by permutation-based FDR analysis (S0 = 1, FDR = 0.01, 2500 permutations). Tab 2: Visualization of the data by means of Histogram and Vulcanoplot is presented in the additional sheets. Tab 3: Distribution of LFQ intensities after replacing missing values from a normal distribution. The imputed value distribution is depicted in red.
- https://doi.org/10.7554/eLife.24192.009
Additional files
-
Supplementary file 1
The functional contribution of Shisa family members (Shisa9, Shisa6, Shisa7) and TARP γ−8 on AMPAR complexes are listed for the respective in vitro, ex/in vivo methods used.
In vitro data on TARP γ−8 are from Milstein et al. (2007). The Shisa9 and TARP γ−8 ex/in vivo data originate from Khodosevich et al. (2014), in which experiments were performed using WT, KO and overexpression conditions in the DG, which is regionally more appropriate for Shisa9 than overexpression in CA1 (von Engelhardt et al., 2010), and from the CA1 for TARP γ−8 KO (Rouach et al., 2005). The Shisa6 ex/in vivo data stem from WT vs. KO comparisons in CA1 pyramidal cells activated by (electrically-evoked) CA3 input (Schaffer collaterals (Klaassen et al., 2016)), similar as used for Shisa7 (bold). NA: Not applicable, not measured.
- https://doi.org/10.7554/eLife.24192.026
-
Transparent reporting form
- https://doi.org/10.7554/eLife.24192.027
Download links
A two-part list of links to download the article, or parts of the article, in various formats.
Downloads (link to download the article as PDF)
Open citations (links to open the citations from this article in various online reference manager services)
Cite this article (links to download the citations from this article in formats compatible with various reference manager tools)
The AMPA receptor-associated protein Shisa7 regulates hippocampal synaptic function and contextual memory
eLife 6:e24192.
https://doi.org/10.7554/eLife.24192


