Control of lipid domain organization by a biomimetic contractile actomyosin cortex
- Max-Planck Institute of Biochemistry, Germany
- Ludwig-Maximilans-University, Germany
Figures
Figure 1
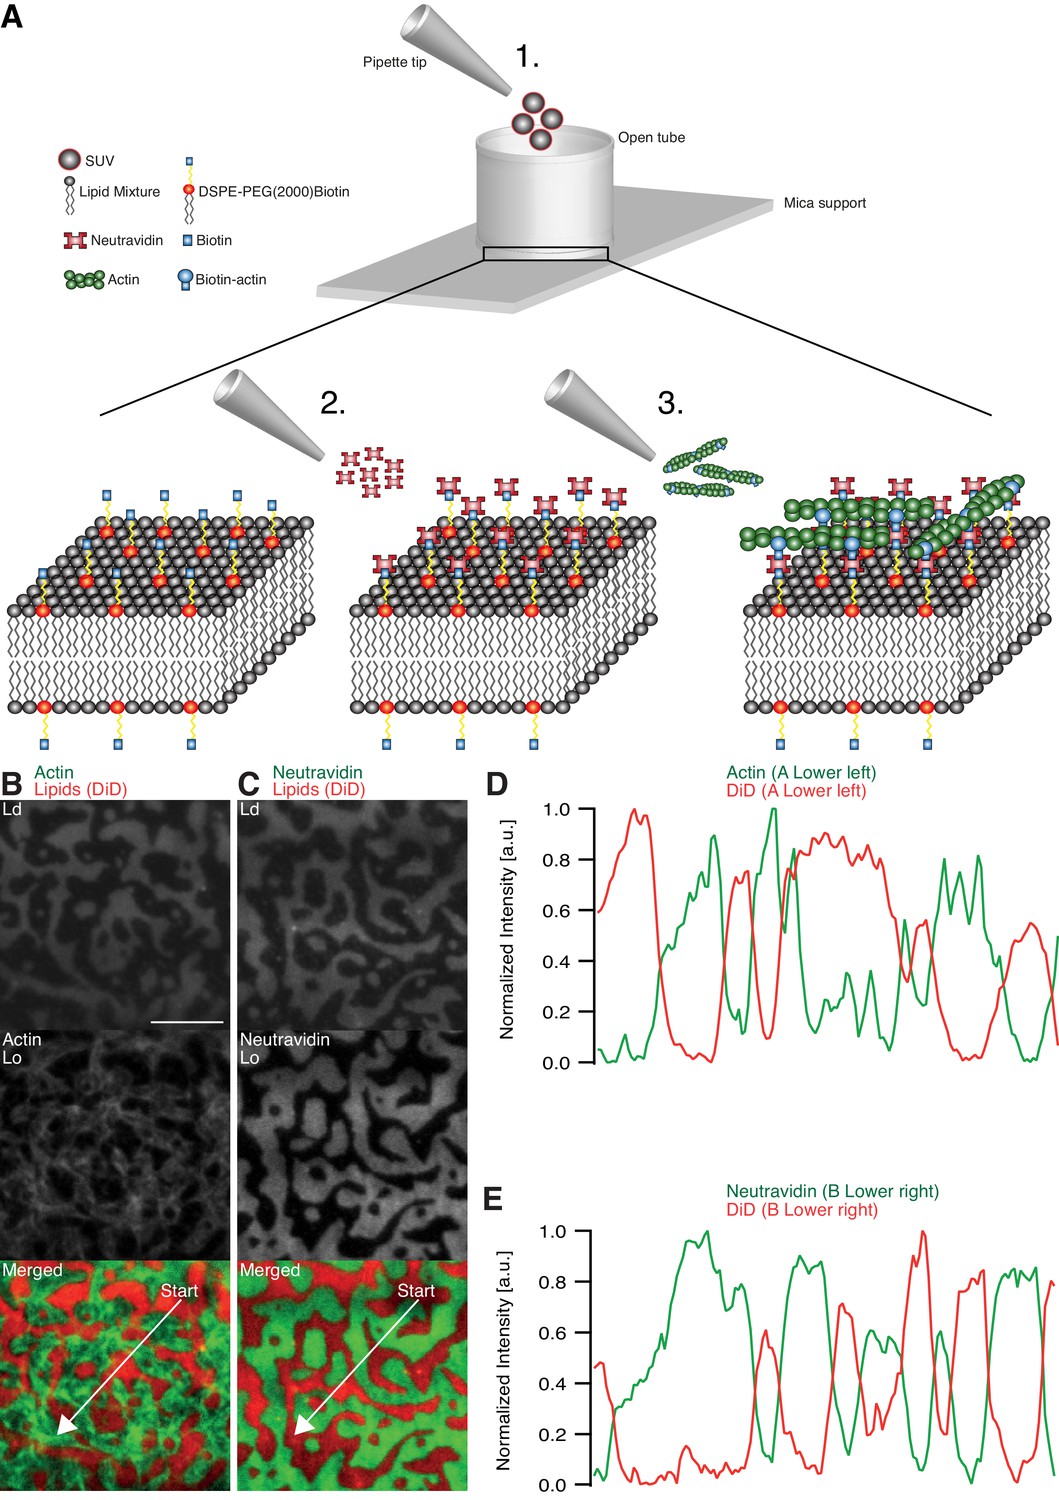
Minimal actin cortex on supported phase-separated lipid membranes.
(A) Illustration depicting the preparation of the SLB and the coupling of actin filaments to the membrane (adapted from [Vogel et al., 2013a]). (B) Since DiD is known to partition specifically to the Ld phase (1:2:1 DOPC:DPPC:Cholesterol), the fluorescence signal of Alexa-488-phalloidin-labeled actin filaments showed that DSPE-PEG(2000)-Biotin partitioned into the Lo phase. (C) Likewise, Oregon-Green-labeled neutravidin colocalized with the Lo phase. (D and E) Line profiles of the normalized fluorescence signal of the actin cortex, DiD and neutravidin as was measured along the superimposed arrows in (B) and (C). Scale bar, 10 µm.
Figure 2
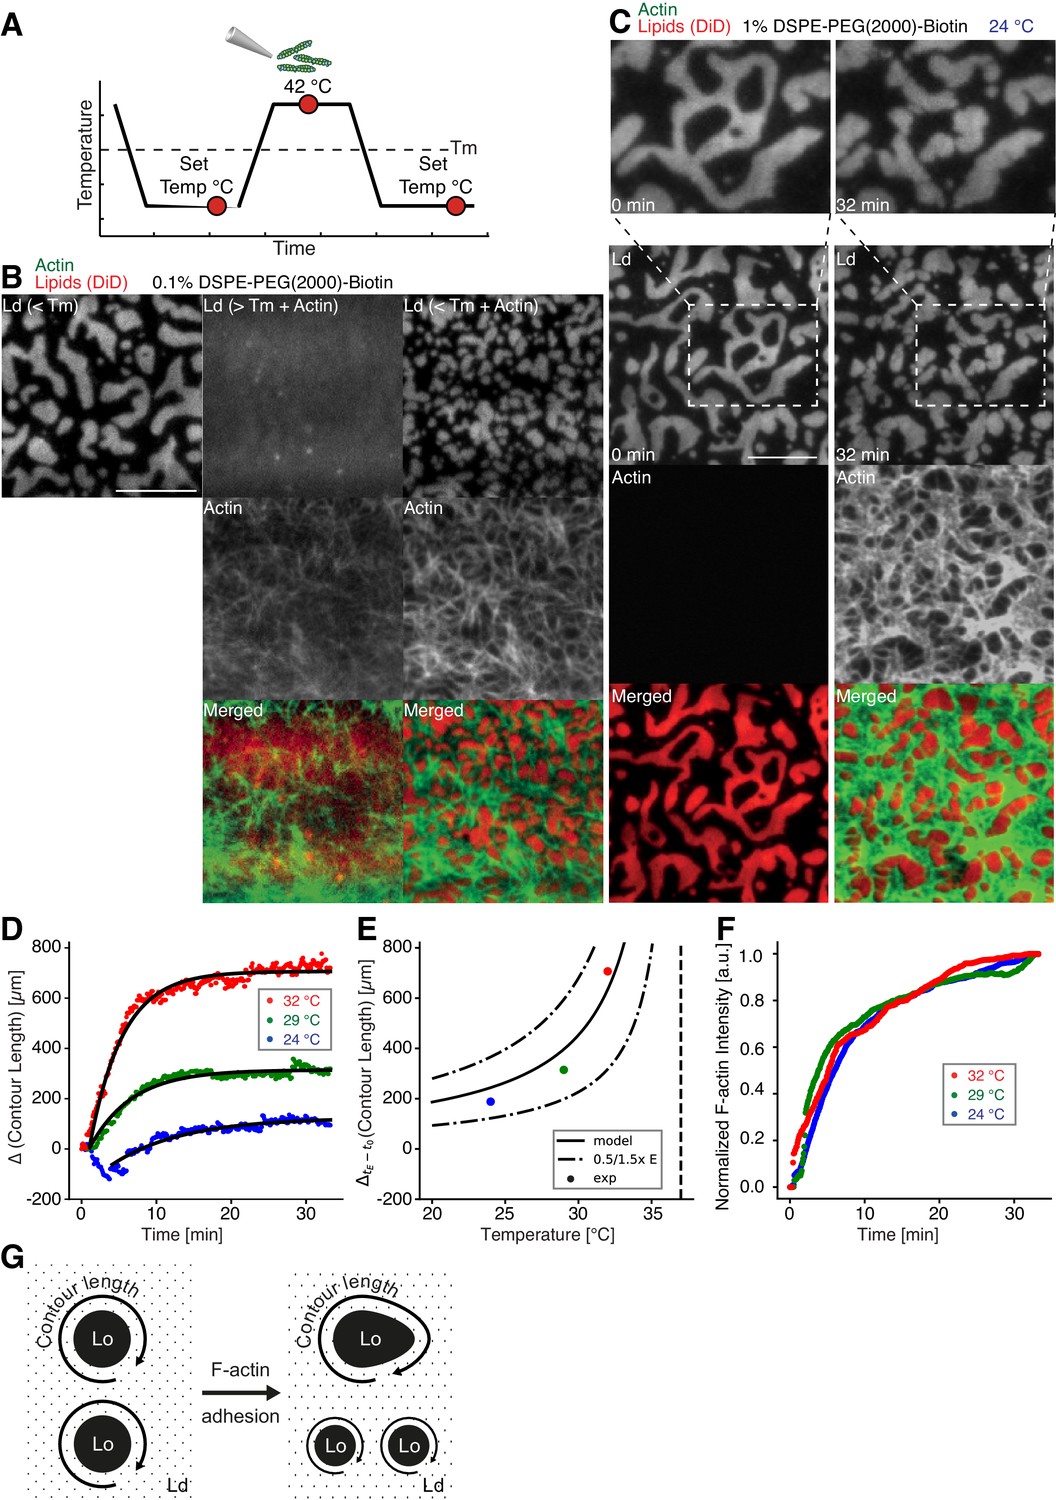
Impact of actin filaments on the lateral organization of phase-separated membranes.
(A) Scheme of a phase separation experiment with and without MAC is shown with circles indicating time points when fluorescent images were acquired. (B) Size distribution of lipid domains changed in the presence of a MAC while undergoing phase separation. TIRF images of a medium-dense MAC with DiD-labeled Ld phase (1:2:1 DOPC:DPPC:Cholesterol) are shown below Tm (30°C) (left column), above Tm (42°C) in the presence of bound Alexa-488-phalloidin-labeled actin filaments (middle column) and below Tm (30°C) in the presence of bound actin (right column). The final size of Ld domains decreased through the presence of actin filaments. (C) Change in contour length through the binding of actin filaments to the already phase-separated membrane at various temperatures below Tm. A high-density MAC with a DiD-labeled Ld phase before (0 min) and after the addition (32 min) of actin filaments at 24°C is shown. (D) Contour length of Ld domains upon F-actin adhesion with time and mono-exponential decay fits at 24°C (blue dots), 29°C (green dots) and 32°C (red dots). (Note that the observed local dip in contour length between 2 and 5 min at 24°C is because of a focal misalignment and blurring of the images after the addition of actin filaments). (E) Final change in contour length for the different temperatures. With a constant lateral pressure, the linearly decreasing line tension with temperature leads to an increase in final contour length according to Equation (1). Dashed vertical line indicates Tm of 37°C. (F) The binding kinetics of actin filaments was tracked with the normalized fluorescence signal over time at 24°C (blue dots), 29°C (green dots) and 32°C (red dots). (G) Illustrative sketch for the change in contour length before and after F-actin adhesion. Scale bars, 10 µm.
Figure 3

Actomyosin contraction governs lateral membrane organization for various lipid compositions.
(A) TIRFM time-lapse images of a contracting MAC with Alexa-488-phalloidin labeled actin filaments and DiD-labeled Ld domains of a 1:2:1 DOPC:DPPC:Cholesterol mixture. Scale bar, 10 µm. (B) For the 1:2:1 DOPC:DPPC:Cholesterol mixture the area of the Lo phase was found to remain constant while the number of Ld domains increased with time through splitting. (C) Distance to neighboring actomyosin clusters for the lipid composition of 1:2:1 DOPC:DPPC:Cholesterol. (D) Representative example (1:2:1 DOPC:DPPC:Cholesterol mixture) showing movement (white asterisks) and deformation (inward ingression, yellow arrows) of a phase boundary upon actomyosin contraction and its splitting into two separated domains (yellow arrowheads). Scale bar, 10 µm. (E) For a lipid composition of 3:3:1 DOPC:PSM:Cholesterol, the area of the Lo phase remained again constant and the number of Lo domains decreased. (F) Pulling of a Lo domain (white asterisk) for a lipid composition of 3:3:1 DOPC:PSM:Cholesterol by actomyosin led to fusion (yellow arrowheads) and relaxation into a larger neighboring domain. Scale bar, 2.5 µm. (G) Time-lapse montage of the actomyosin contraction on a 3:3:1 DOPC:PSM:Cholesterol phase-separated membrane. Small Lo domains are moved and fused to produce larger domains. Scale bar, 5 µm.
Figure 4

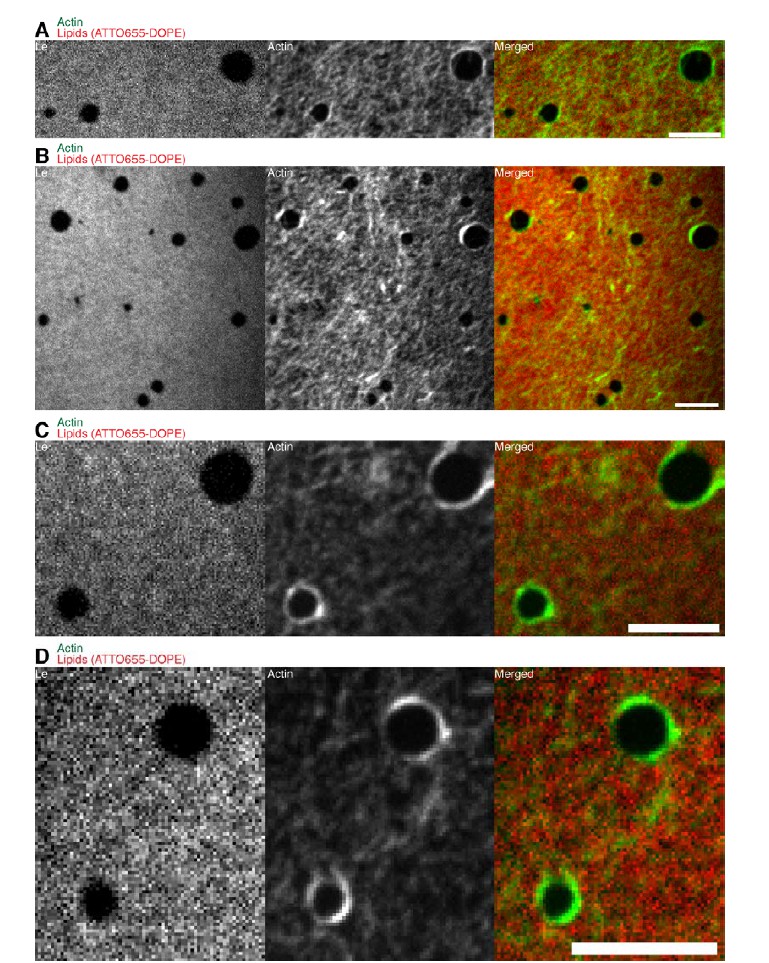
Lipid monolayer domain shape changes and fusion events induced by actomyosin contractions.
(A) Confocal spinning disk microscope images of Alexa-488-phalloidin-labeled actin filaments coupled to a ATTO655-DOPE-labeled lipid monolayer (3:3:1 DOPC:PSM:Cholesterol) in the absence of myofilaments. Actin filaments close to the phase boundaries of lipid monolayer domains align to their circular shape. (B–D) Spinning Disk microscope time-lapse images of Alexa-488-phalloidin-labeled actin filaments coupled to ATTO655-DOPE-labeled lipid monolayers during myofilament induced contractions of actin filaments. Actomyosin contractions lead to shape changes and fusion events (yellow arrows and arrowheads) of the lipid monolayer Lc domains. (E) Scheme of a microscopic model. Scale bars, 10 µm.
Scheme 1
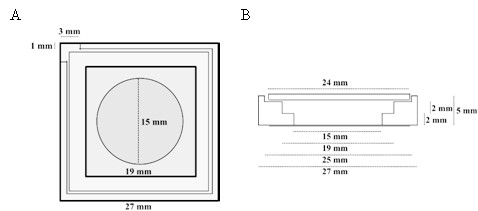
Top (A) and lateral (B) schematic view of the PTFE chamber (adapted from [Chwastek and Schwille, 2013]).
https://doi.org/10.7554/eLife.24350.014
Author response image 1
Confocal Spinning Disk images of the additional lipid monolayer mixture (1:2:1 DOPC:DPPC:Cholesterol).
Actin filaments close to the phase boundaries align to the circular shape of the liquid condensed (ordered) Lc domains because the line tension energy dominates over the actin filament wetting energy at the phase boundary. The same behavior was observed for the 3:3:1 DOPC:PSM:Cholesterol lipid mixture (Figure 4A). Scale bars, 10 µm.
Videos
Video 1
Myosin-induced actin rearrangements in a minimal actin cortex (MAC) combined with a supported phase-separated lipid bilayer.
MAC with a supported phase-separated membrane (1:2:1 DOPC:DPPC:Cholesterol) containing Alexa-488-phalloidin-labeled actin filaments (green) exhibits dynamic rearrangements of actin filaments after the addition of myofilaments in the presence of ATP and eventually forms actomyosin clusters. The phase-separated membrane containing DiD-labeled Ld domains (red) is shown in the upper channel. The middle channel shows Alexa-488-phalloidin-labeled actin filaments (green) that bind to the Lo domains. The lower channel shows the merge of both channels. TIRFM image sequence was acquired at 5 s. time intervals and contains 200 frames. The video is displayed at 15 frames per second (fps). Total time: 16.6 min. Scale bar, 10 µm. (Compressed JPG avi; 10.2 MB).
Video 2
Shape changes, rearrangements and fusion events of Ld domains during actomyosin contraction.
The phase-separated membrane (1:2:1 DOPC:DPPC:Cholesterol) containing DiD labeled Ld domains (red) is shown in the left channel. The middle channel shows Alexa-488-phalloidin labeled actin filaments that bind to the Lo domains. The right channel shows the merge of both channels. TIRFM image sequence was acquired at 5 s. time intervals and contains 124 frames. The video is displayed at 15 frames per second (fps). Total time: 10.3 min. Scale bar, 10 µm. (Compressed JPG avi; 0.8 MB).
Video 3
Splitting, shape changes and deformations of Ld domains during actomyosin contraction.
The phase-separated membrane (1:2:1 DOPC:DPPC:Cholesterol) containing DiD labeled Ld domains (red) is shown in the left channel. The middle channel shows Alexa-488-phalloidin-labeled actin filaments that bind to the Lo domains. The right channel shows the merge of both channels. TIRFM image sequence was acquired at 5 s. time intervals and contains 200 frames. The video is displayed at 15 frames per second (fps). Total time: 16.6 min. Scale bar, 10 µm. (Compressed JPG avi; 0.8 MB).
Video 4
Ld domain movement, splitting and ingression during actomyosin contraction.
The phase-separated membrane (1:2:1 DOPC:DPPC:Cholesterol) containing DiD-labeled Ld domains (red) is shown in the left channel. The middle channel shows Alexa-488-phalloidin-labeled actin filaments that bind to the Lo domains. The right channel shows the merge of both channels. TIRFM image sequence was acquired at 5 s. time intervals and contains 200 frames. The video is displayed at 15 frames per second (fps). Total time: 16.6 min. Scale bar, 5 µm. Corresponds to Figure 3D. (Compressed JPG avi; 0.4 MB).
Video 5
Shape changes, rearrangements and fusion events of Lo domains during actomyosin contraction.
The phase-separated and DiD labeled (red) membrane (3:3:1 DOPC:PSM:Cholesterol) containing Lo domains (dark) is shown in the upper channel. The middle channel shows Alexa-488-phalloidin-labeled actin filaments (green) that bind to the Lo domains. The lower channel shows the merge of both channels. TIRFM image sequence was acquired at 5 s. time intervals and contains 500 frames. The video is displayed at 15 frames per second (fps). Total time: 41.6 min. Scale bar, 10 µm. (Compressed JPG avi; 28 MB).
Video 6
Fusion event of a Lo domain during actomyosin contraction.
A small Lo domain is stretched by actin filaments thereby pulling the domain toward a larger domain leading eventually to fusion of both Lo domains. The phase-separated and DiD-labeled (red) membrane (3:3:1 DOPC:PSM:Cholesterol) containing Lo domains (dark) is shown in the left channel. The middle channel shows Alexa-488-phalloidin-labeled actin filaments (green) that bind to the Lo domains. The right channel shows the merge of both channels. TIRFM image sequence was acquired at 5 s. time intervals and contains 337 frames. The video is displayed at 120 frames per second (fps). Total time: 28 min. Scale bar, 2.5 µm. Corresponds to Figure 3F. (Compressed JPG avi; 0.4 MB).
Video 7
Disappearance of small Lo domains during actomyosin contraction.
Small Lo domains often vanish during actomyosin contractions. The phase-separated and DiD-labeled (red) membrane (3:3:1 DOPC:PSM:Cholesterol) containing Lo domains (dark) is shown in the left channel. The middle channel shows Alexa-488-phalloidin-labeled actin filaments (green) that bind to the Lo domains. The right channel shows the merge of both channels. TIRFM image sequence was acquired at 5 s. time intervals and contains 493 frames. The video is displayed at 120 frames per second (fps). Total time: 41 min. Scale bar, 5 µm. Corresponds to Figure 3G. (Compressed JPG avi; 4.1 MB).
Video 8
Shape changes and fusion events during actomyosin contraction of Lc domains in a MAC combined with a phase-separated lipid monolayer.
Myofilaments in the presence of ATP led to the contraction of the actin layers and to shape changes and fusion events of the Lc domains. The phase-separated lipid monolayer (3:3:1 DOPC:PSM:Cholesterol) containing the ATTO655-DOPE-labeled Le phase (red) is shown in the left channel. The middle channel shows Alexa-488-phalloidin-labeled actin filaments that bind to the Le phase. The right channel shows the merge of both channels. Confocal Spinning Disk image sequence was acquired at 20 s. time intervals and contains 64 frames. The video is displayed at 15 frames per second (fps). Total time: 21 min. Scale bar, 10 µm. Corresponds to Figure 4C. (Compressed JPG avi; 1.7 MB).
Download links
A two-part list of links to download the article, or parts of the article, in various formats.
Downloads (link to download the article as PDF)
Open citations (links to open the citations from this article in various online reference manager services)
Cite this article (links to download the citations from this article in formats compatible with various reference manager tools)
Control of lipid domain organization by a biomimetic contractile actomyosin cortex
eLife 6:e24350.
https://doi.org/10.7554/eLife.24350


