Emergence of visually-evoked reward expectation signals in dopamine neurons via the superior colliculus in V1 lesioned monkeys
- National Institute for Physiological Sciences, Japan
- SOKENDAI, Japan
- Graduate School of Medicine Kyoto University, Japan
- University of Sheffield, United Kingdom
Figures
Figure 1 with 2 supplements
Pavlovian conditioning in V1 lesioned monkeys.
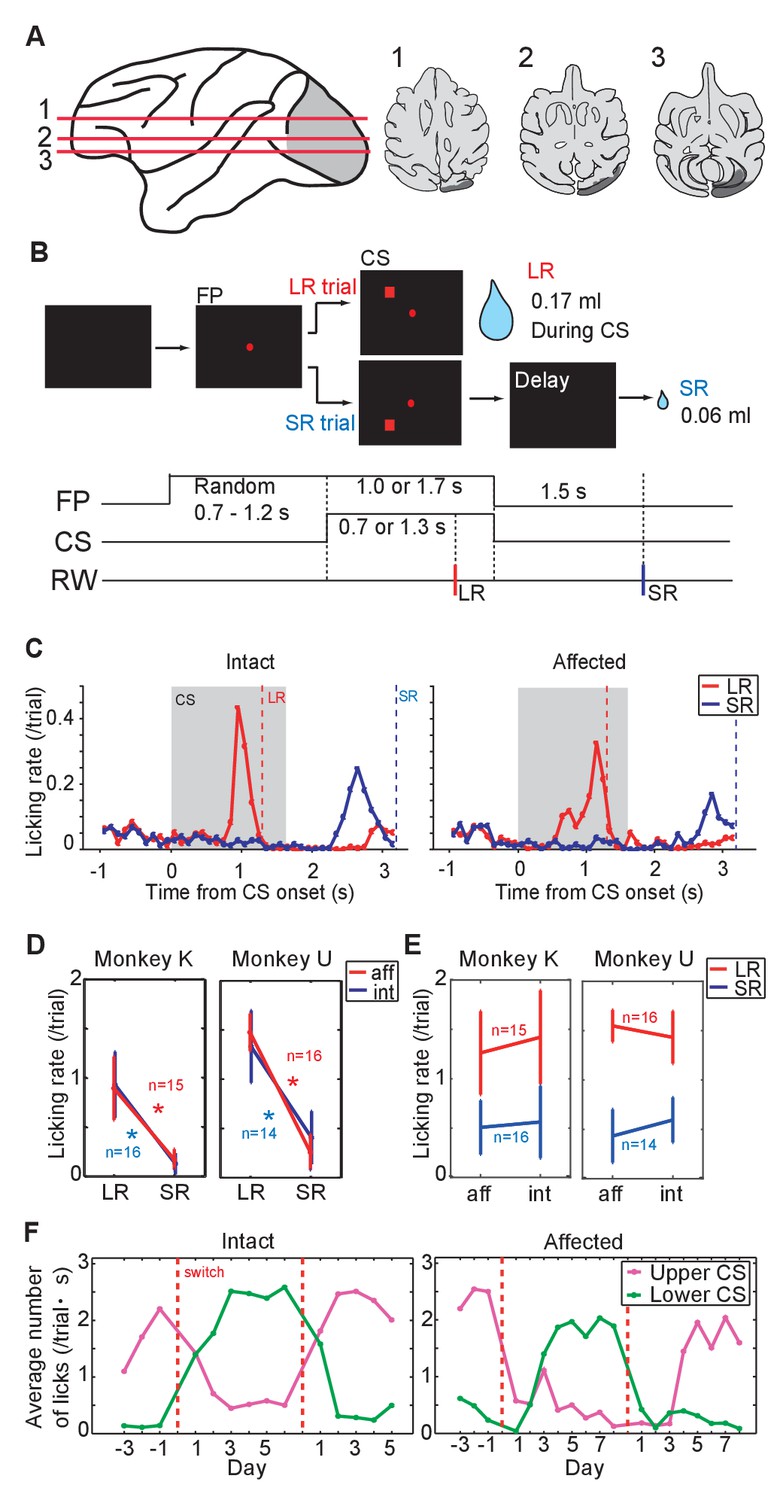
(A) Left: lesion area (depicted in gray) on the whole brain image. Red lines (1 - 3) indicate dorso-ventral levels of horizontal slices shown on the right. Right: lesion area in monkey K (depicted in gray) is overlaid as black areas on axial slices traced from MR images. (B) Design of Pavlovian conditioning task in this study. Monkeys were required to fixate a central fixation point (FP) until CS offset. LR (large reward) and SR (small reward) trials were given at random order. In this task, LR was delivered during CS presentation, and SR was delivered after 1.5 s from CS offset. Abbreviations; RW (reward). (C) Licking rates aligned at the CS onset (monkey K). CSs were presented to intact visual field (left panel) and to lesion-affected visual field (right panel). Red and blue lines indicate licking rates during LR and SR trials, respectively. Gray hatched area indicates CS presentation period. Red and blue vertical dashed lines indicate time of reward delivery in the LR and SR trials, respectively. (D) Licking rates during CS presentation were compared between LR and SR trials in monkey K (left) and U (right). The CSs were presented either to the intact (int, blue lines) or lesion-affected (aff, red lines) hemifield. * = significant difference (monkey K: p=6.1 × 10⁻⁵ (aff), p=4.3 × 10⁻⁴ (int), monkey U: p=4.3 × 10⁻⁴ (aff), p=1.2 × 10⁻⁴ (int), Wilcoxon signed-ranks test, α <0.05). (E) Licking rates during CS presentation were compared between CS presented to lesion-affected and that to intact visual field in monkey K (left) and U (right). There was no significant difference in the licking rates both in LR and SR trials. monkey K: p=0.33 (LR), p=0.63 (SL), monkey U: p=0.16 (LR), p=0.084 (SL), two sample t-test with Welch’s correction, α <0.05). (F) Reversal learning; the effect of switching the CS assignment on licking rates in the intact and affected fields in monkey K. Licking rates during CS presentation to upper (magenta) or lower (green) visual field were plotted for individual days. CS positions were switched on the day indicated by the vertical red dashed lines.
Figure 1—figure supplement 1
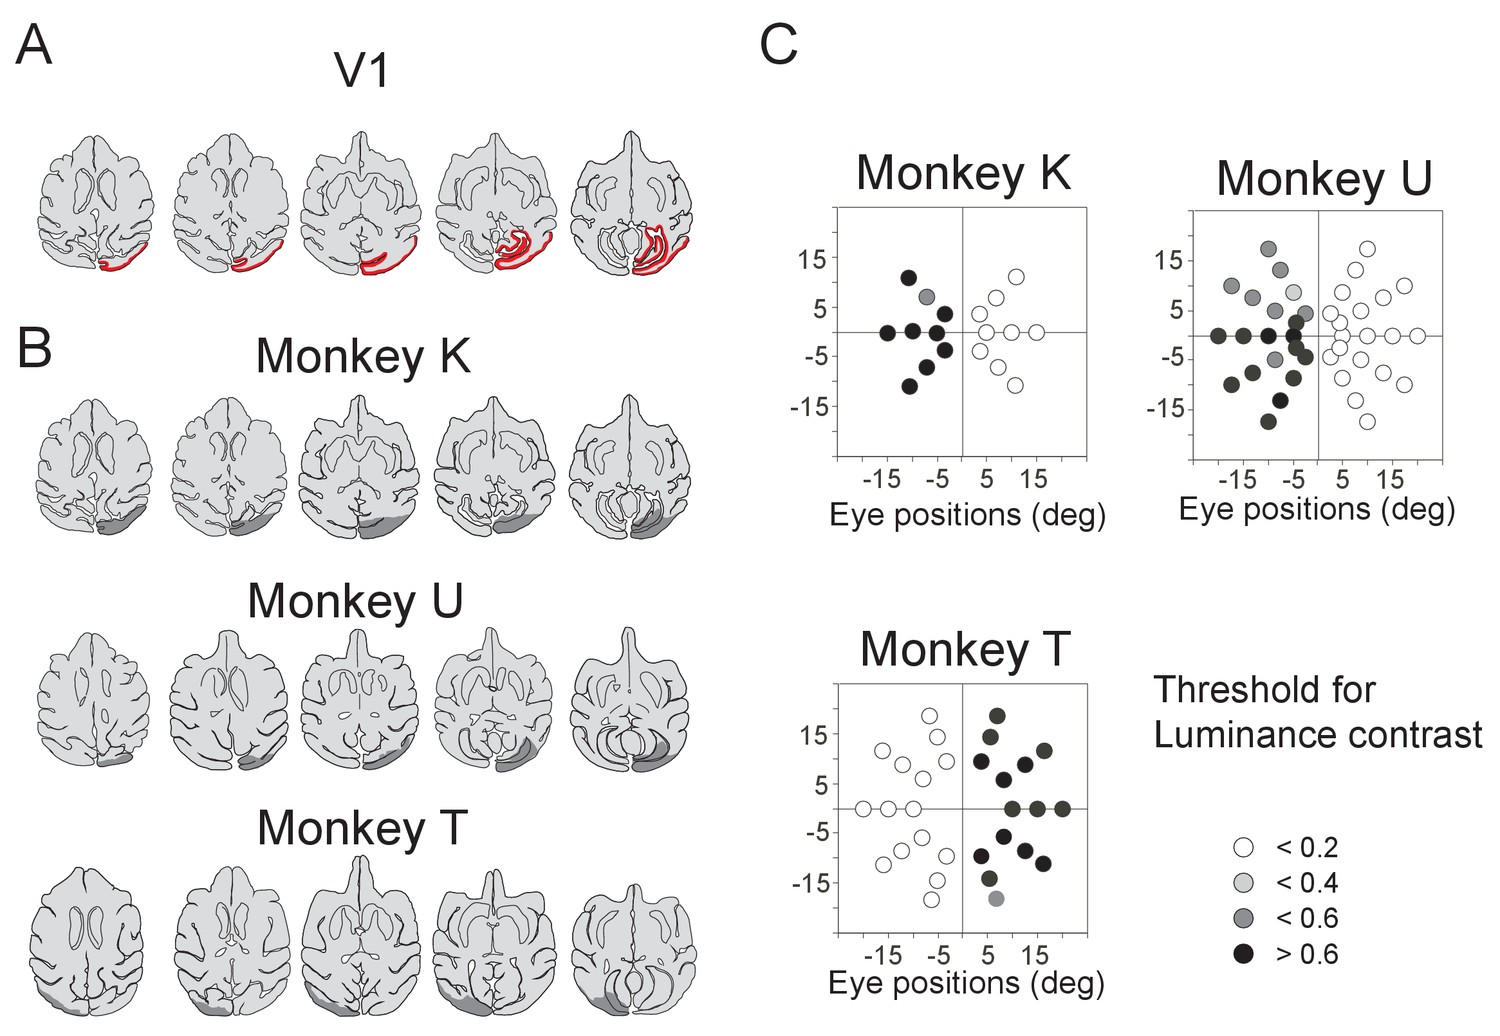
Unilateral V1 lesion.
(A) Locations of the V1 are shown as red area on the horizontal section traces of monkey K. (B) Traces of horizontal sections of the three monkeys' brain from their MR images. Their lesion areas are indicated by gray areas on the traces. Right V1 was lesioned in monkey K and U, whereas left V1 was lesioned in monkey T. (C) Deficit maps for the three monkeys (K, U and T). Thresholds for detecting luminance contrast (Michelson contrast) are plotted over the whole visual field in each monkey with unilateral V1 lesion. The thresholds at individual target positions are displayed with a gray scale. Their sensitivity to luminance contrast was clearly reduced in the lesion-affected visual field.
Figure 1—figure supplement 2
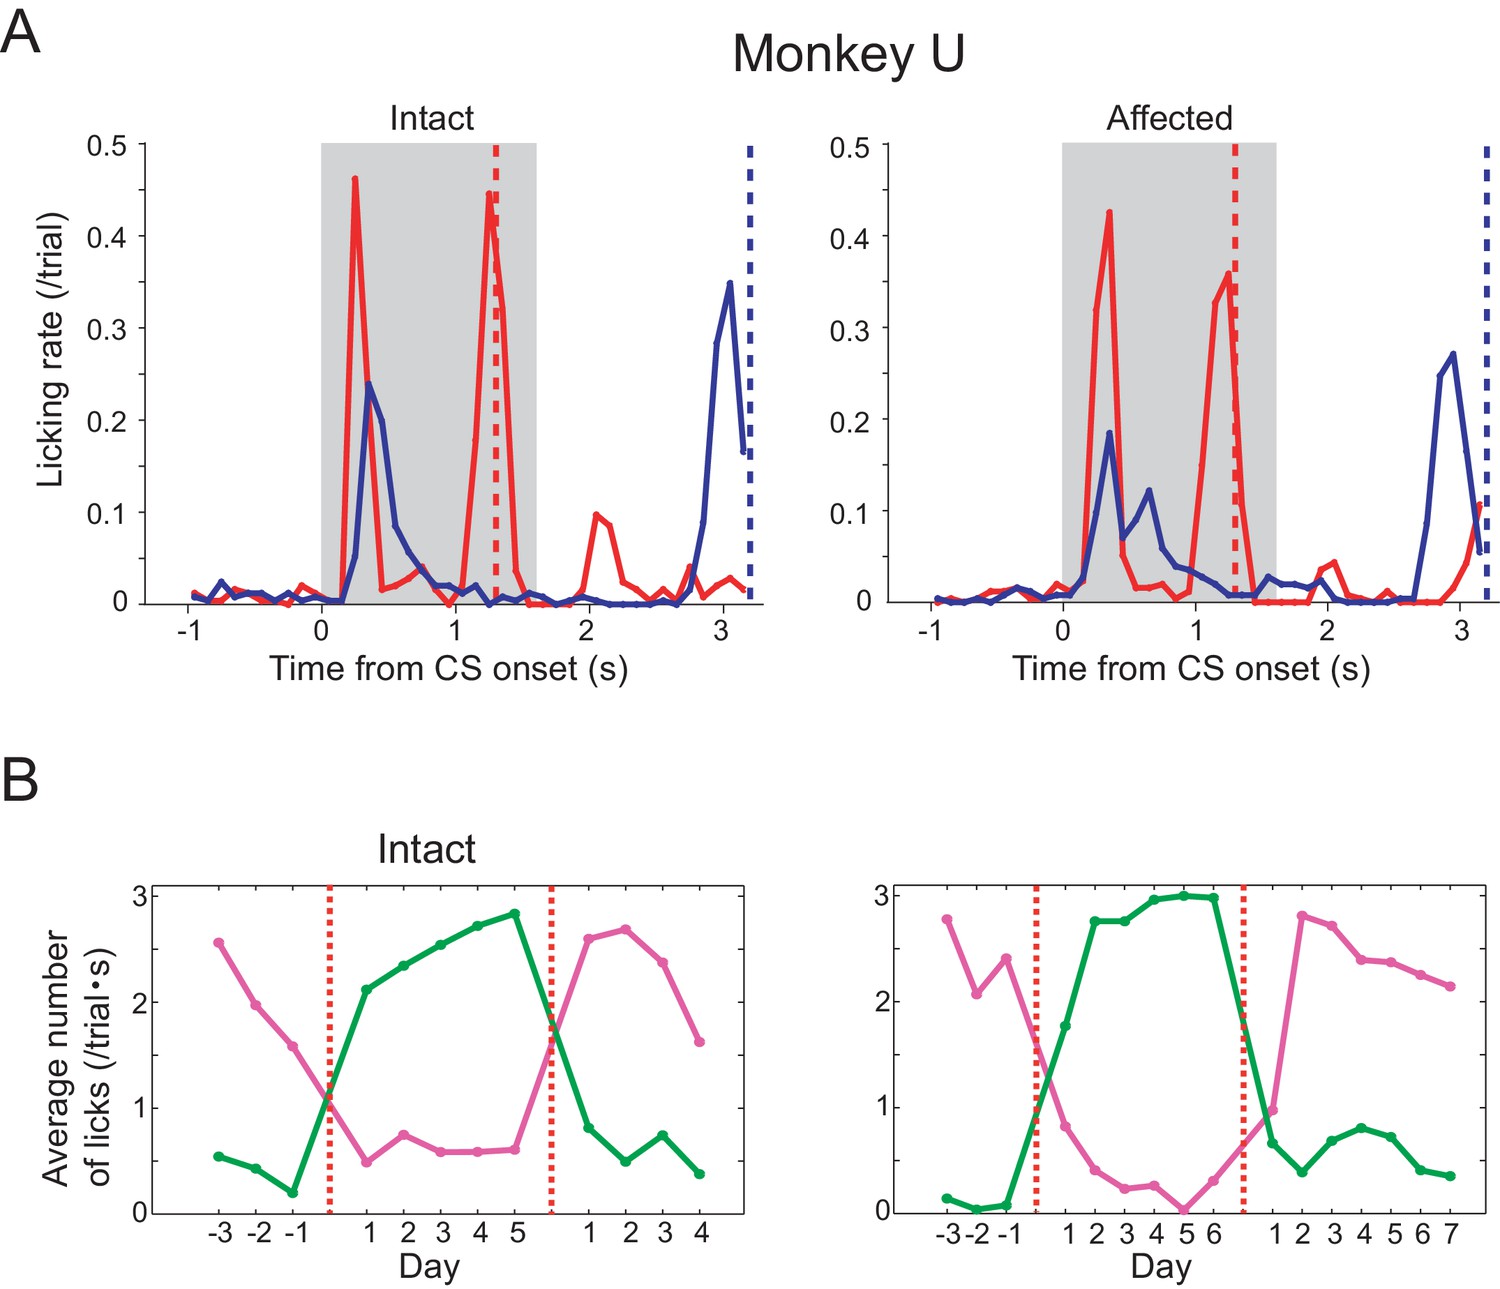
Pavlovian conditioning in monkey U.
Monkey U also provided a confirmatory dataset in the Pavlovian conditioning task. Arrangement of these figures was the same as Figure 1C and F. (A) Licking rates aligned at the CS onset (monkey U). CSs were presented to intact visual field (left panel) and to lesion-affected visual field (right panel). Red and blue lines indicate licking rates during LR and SR trials, respectively. Gray hatched area indicates CS presentation period. Red and blue vertical dashed lines indicate time of reward delivery in the LR and SR trials, respectively. (B) Reversal learning; the effect of switching the CS assignment on licking rates in the intact and affected fields in monkey U. Licking rates during CS presentation to upper (magenta) or lower (green) visual field were plotted for individual days. CS positions were switched on the day indicated by the vertical red dashed lines.
Figure 2 with 1 supplement
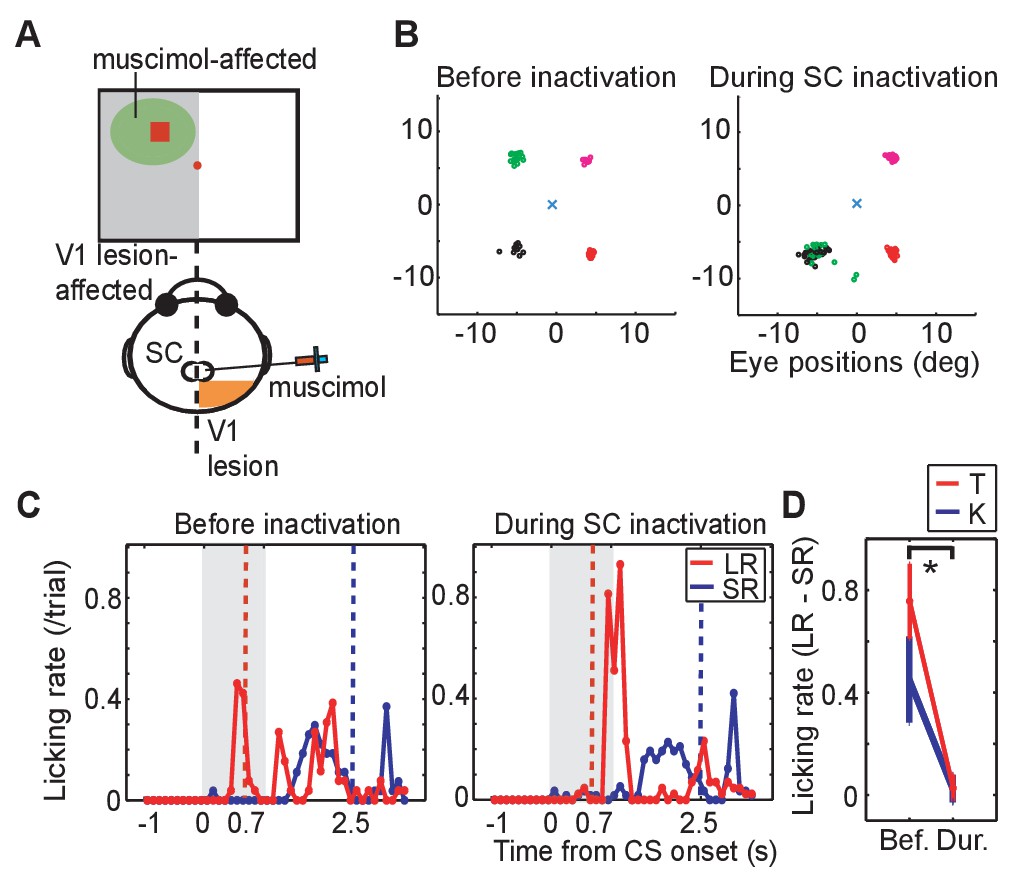
Effect of SC inactivation on conditioned behaviors.
(A) A scheme of the SC inactivation experiments. Muscimol was injected into the point on the ipsi-lesional SC map representing the location of LR-CS in the visual field. (B) End points of saccadic eye movements before and after the SC inactivation (left and right panel). The position of central fixation point is indicated by a blue cross. Circles indicate end points of visually guided saccades, and their colors indicate location of saccadic targets in individual quadrants. Impairment of saccades toward the upper-left target (green) indicates that muscimol effectively suppressed the neuronal activity at the injection site. (C) Licking rates in a daily session before (left panel) and after SC inactivation (right panel) in monkey T. The licking rates are plotted in the same manner as Figure 1C. Red and blue lines indicate the licking rates during the LR and SR trials, respectively. Gray hatched area indicates the CS presentation period. (D) Licking rate during 0.7 s from the CS onset in the SR trials are subtracted from licking rate in LR trials in monkey K (blue line, N = 9) and T (red line, N = 4). The vertical lines indicate the SEM. Bef.: before inactivation, Dur: during inactivation. (p=2.4 × 10⁻⁴, Wilcoxon signed-ranks test, α <0.05).
Figure 2—figure supplement 1
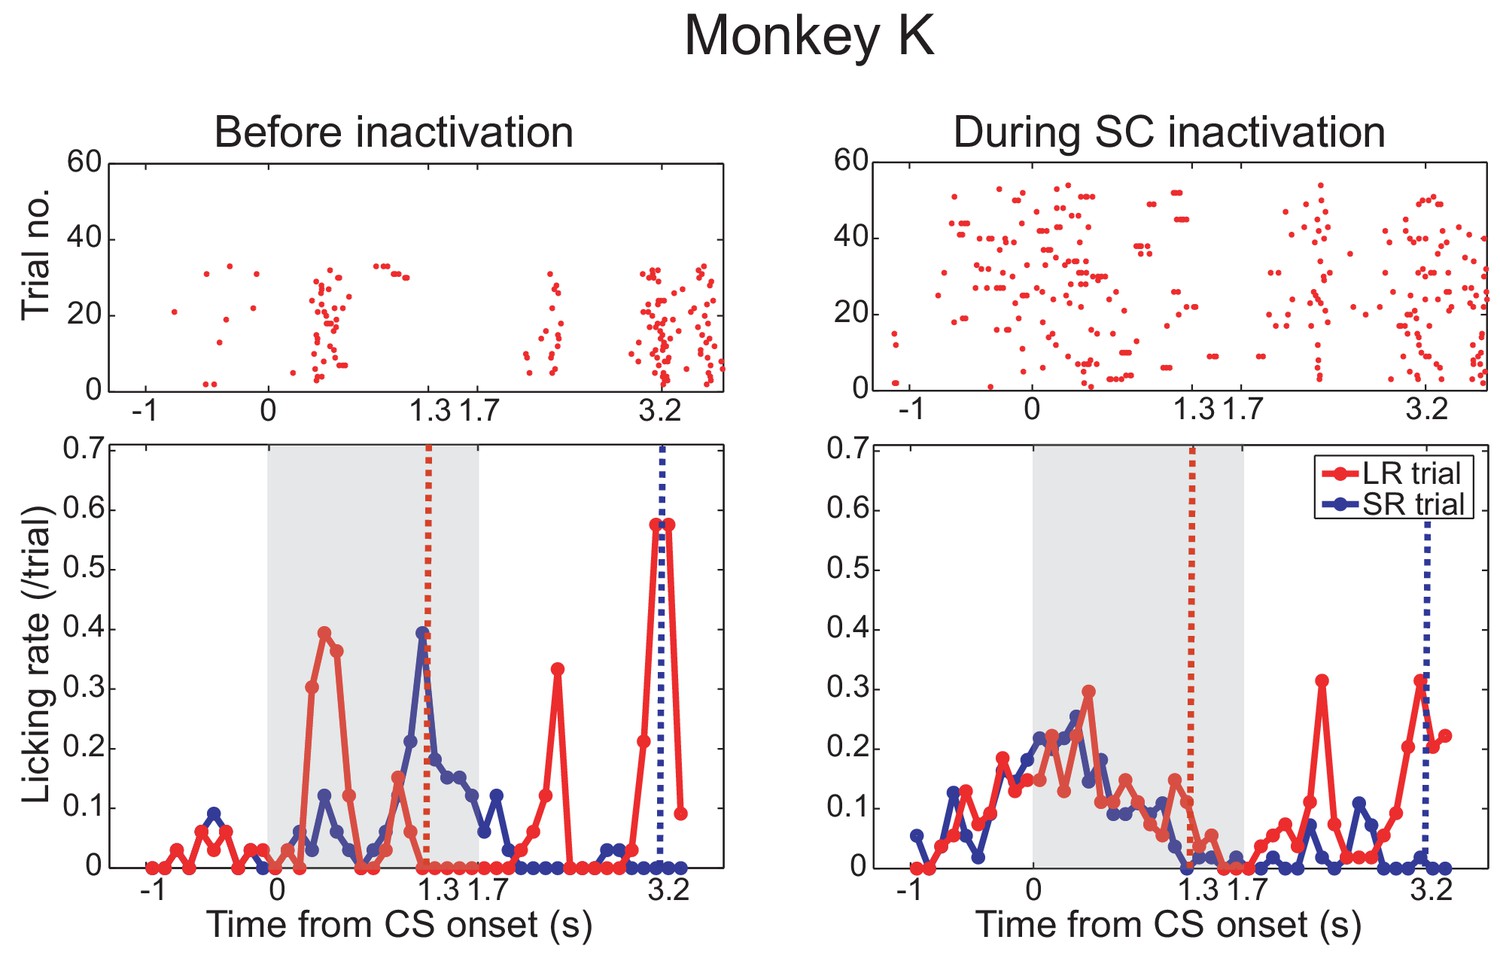
Effect of SC inactivation on conditioned behavior in monkey K.
Licking rates in a daily session before (left panel) and after SC inactivation (right panel) in monkey K. Monkey K also provided a confirmatory dataset in the Pavlovian conditioning task before (left panel) and during (right panel) the SC inactivation. Arrangement of these figures was the same as Figure 2C. Red and blue lines indicate the licking rates during the LR and SR trials, respectively. Gray hatched area indicates the CS presentation period.
Figure 3 with 1 supplement

DA neuron responses during Pavlovian conditioning task.
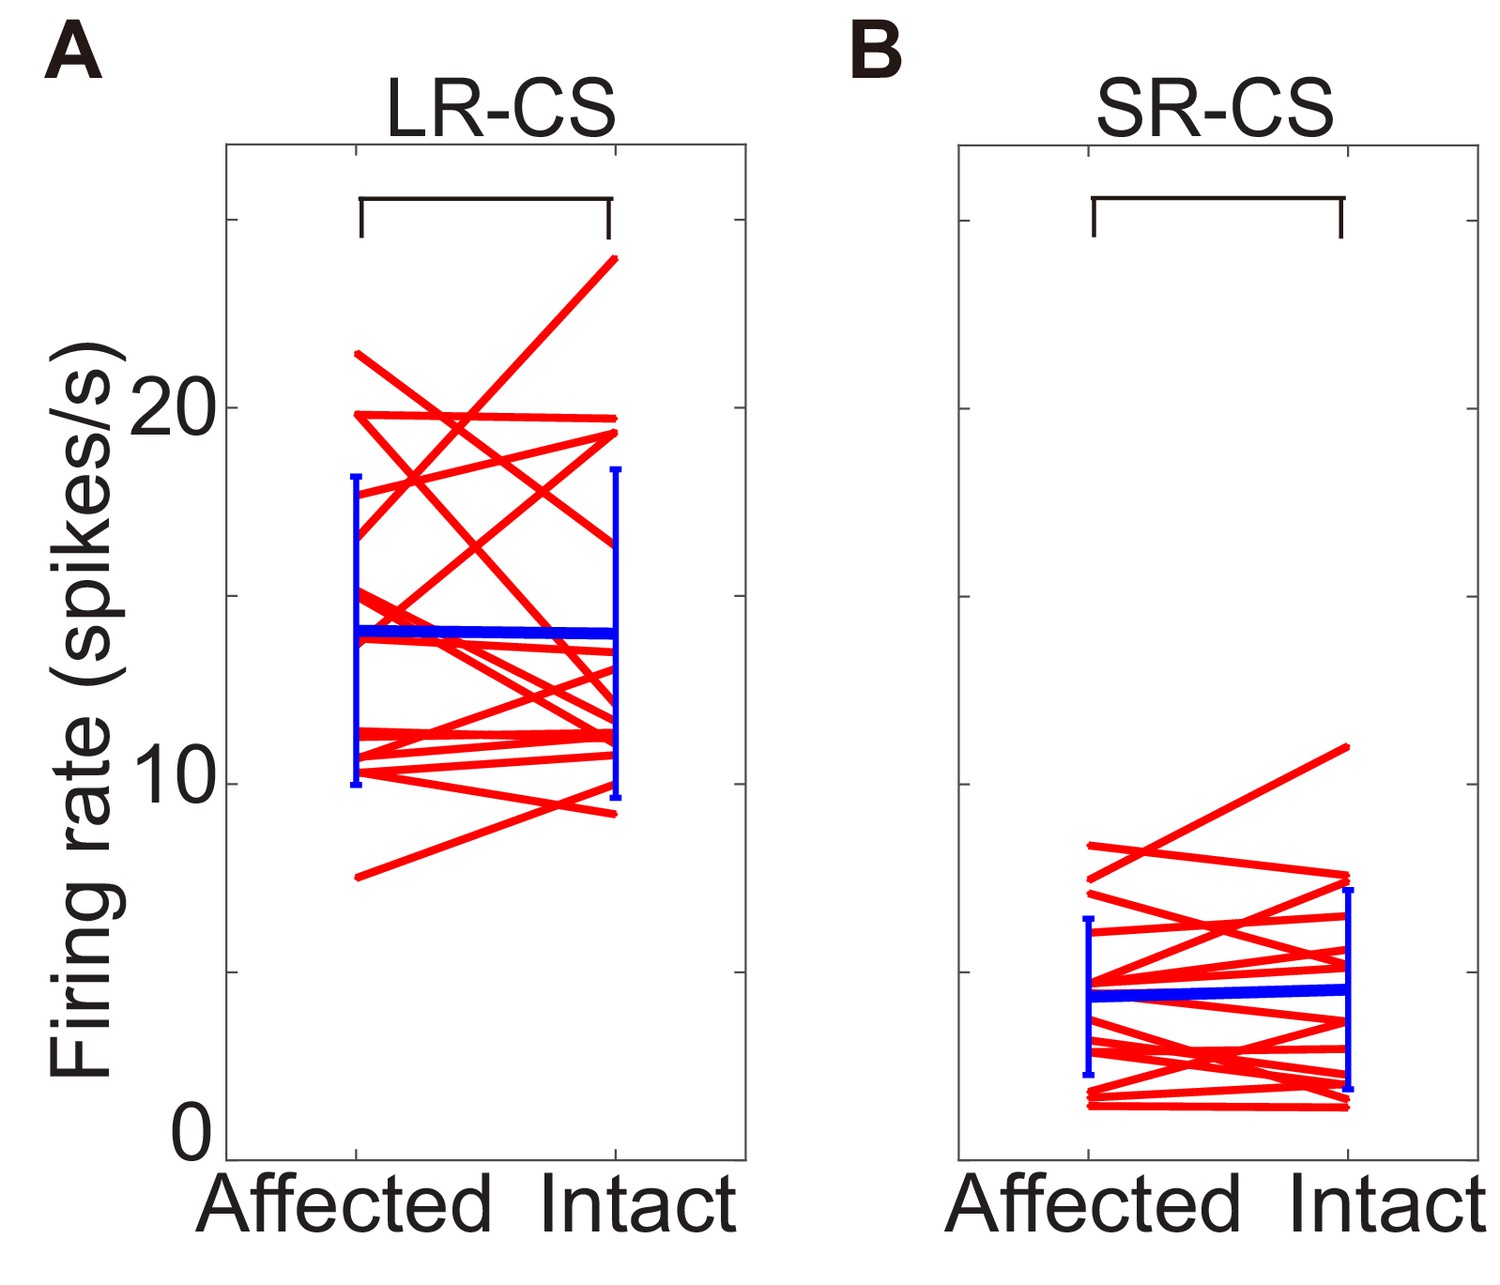
(A) Schematic drawing of the experimental design for recording DA neuron activity in the monkey with unilateral V1 lesion. (B) Averaged spike waveforms of a presumed DA neuron in SNc and a non-DA neuron in the SNr. Amplitude of these spikes are normalized. Spike width was defined as the time between the first negative peak and second positive peak. (C) Histogram of the spike width. Red bars indicate the DA neurons and blue bars indicates the SNr neurons. (D) Left; a low magnification view of the SNc and surrounding structures stained with anti-TH immunohistochemistry. Scale bar = 5.0 mm. Right; a high magnification view of the area indicated by a blue square. Red arrows indicate locations of electrolytic markings. Scale bar = 2.0 mm. (E) Time course of the Pavlovian conditioning task (the same as Figure 1B). (F) A typical DA neuron activity in V1 lesioned monkeys. Raster plots of a DA neuron from LR (red) and SR (blue) trials were sorted and shown on the top, receptively. The first trial was plotted at the bottom of the raster plot and the last trial was plotted at the top. Red and blue lines indicate average firing rates during LR and SR trials, respectively. These plots were aligned at the FP onset, CS onset, and RW delivery (left, middle and right panels, respectively). (G) Responses of all recorded DA neurons to FP, CS and RW (left, middle and right panels) are superimposed. A thick red line in each panel is the averaged firing rate of DA neurons in LR trials, and a thick blue line is the averaged firing rate in SR trials. Thin lines behind the averaged lines are the averaged responses of individual neurons in LR trials (red) and in SR trials (blue), respectively. (H) Firing rates of individual DA neurons within the time windows (100–300 ms from FP and CS or 150–350 ms from RW; left, middle and right panels). Blue lines indicate the average of all the neurons and SD of the firing rate in LR trials and in SR trials. * = significant difference (N = 24, p=0.82 (FP), p=1.1 × 10⁻⁷ (CS), p=0.27 (RW), Wilcoxon signed-ranks test, α <0.05). (I) The yellow background in the figures shows the period during which the responses to LR-CS and SR-CS were significantly different more than 15 ms (N = 24 in affected, N = 16 in intact, two-sided sign test, α <0.05). The two panels show averaged DA responses to CSs presented to the lesion-affected visual field (upper panel), and to the visual field (lower panel). Arrows under each figure indicate the earliest points where the LR and SR responses can be reliably discriminated for more than 50 ms (122 ms in the lesion-affected visual field, and 112 ms in intact visual field).
Figure 3—figure supplement 1
Comparing DA responses to CSs in lesion-affected and intact visual field.
These figures show firing rate of DA response to CS presented into lesion-affected and into intact visual field. Responses to LR-CS were compaired in A, and to SR-CS were in B. Time windows size to calicurate the firing rate was 100–300 ms from CS onset. In both cases, there are no significant difference (N = 16, p=0.958 (LR-CS), p=0.796 (SR-CS), one sample t-test, α <0.05).
Figure 4 with 2 supplements
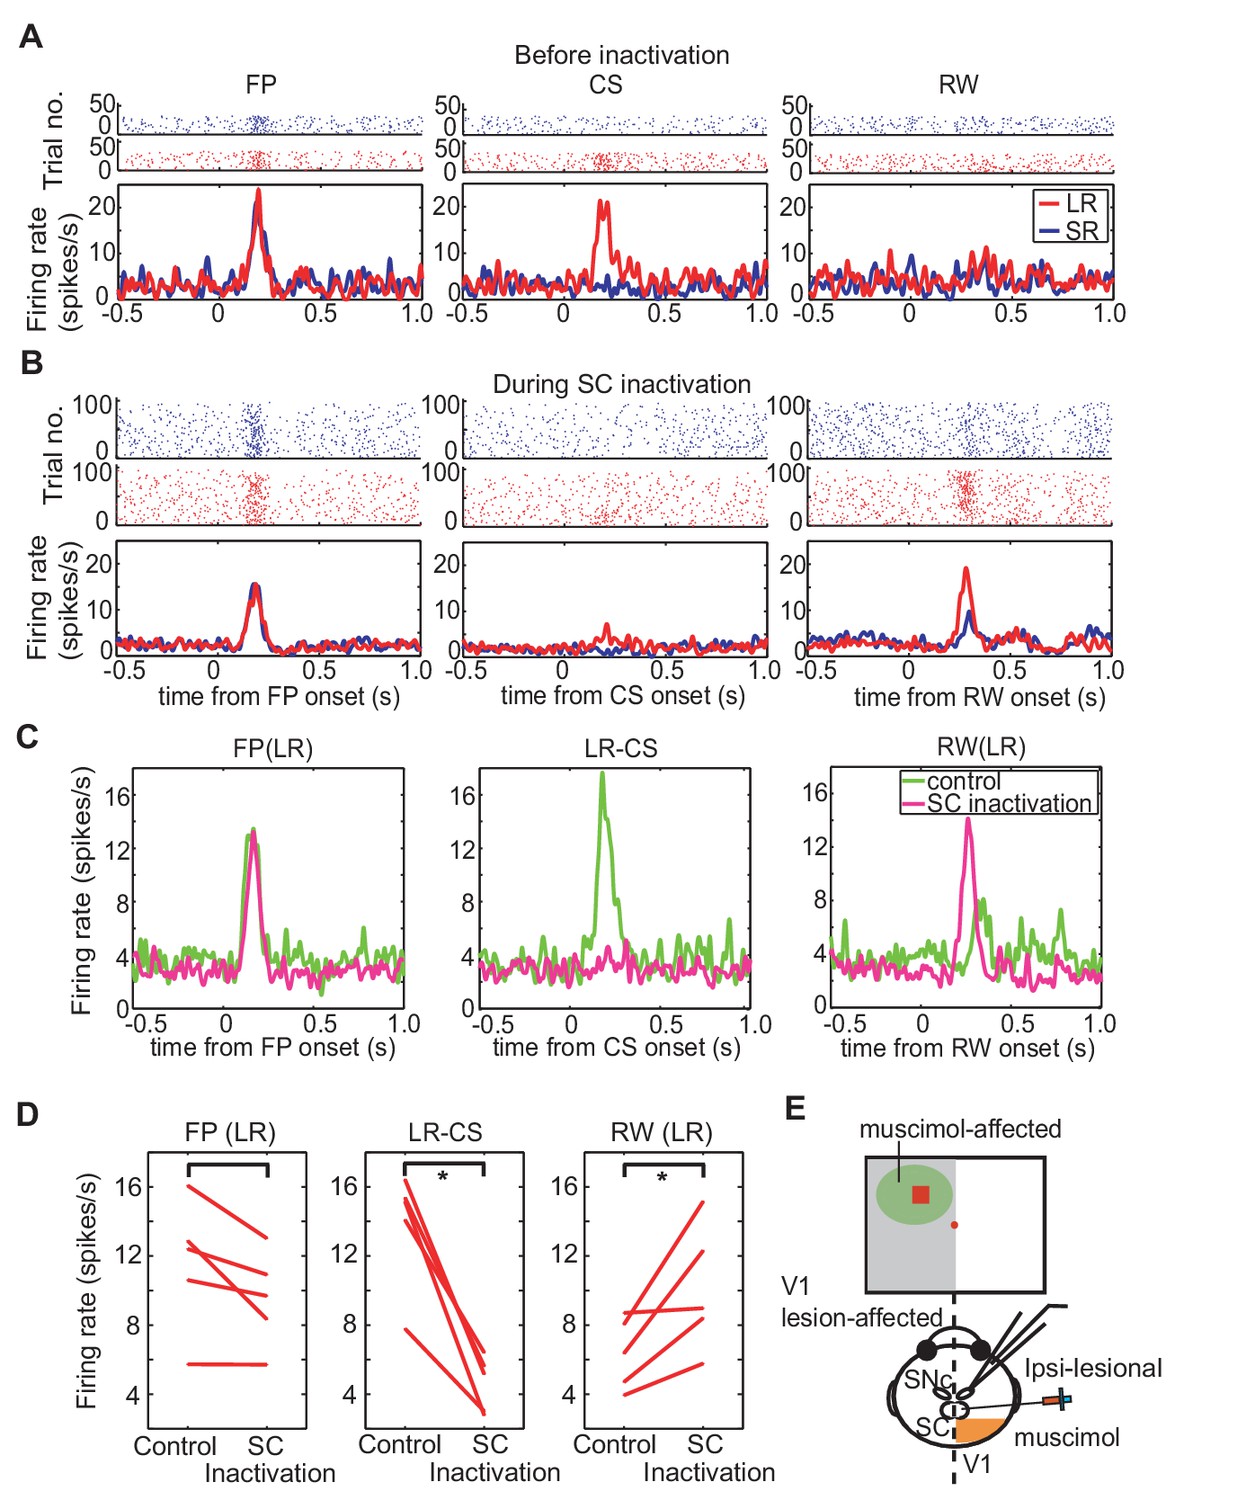
Effect of SC inactivation on cue-responses in DA neurons.
(A) Activity of DA neurons before SC inactivation. Raster plots and firing rates plotted in the same manner as Figure 3F. These plots were aligned at FP onset, at CS onset, and at RW delivery (left, middle and right panels, respectively). (B) Activity of DA neurons during SC inactivation After the SC inactivation, the responses to the FP were unchanged (left), those to the LR-CS (middle) disappeared and those to RW (right) increased. (C) Population average of DA neuron responses (N = 5) in LR trials before (green) and during SC inactivation (magenta). These activities were aligned at FP onset, at CS onset and at RW delivery, respectively (left, middle and right panels). (D) Firing rates of DA neurons in LR trials within different time windows (100–300 ms from FP and CS or 150–350 ms from RW; left, middle and right panels, respectively) before and during SC inactivation. These time windows are the same as those in Figure 3H. * = significant difference (N = 5, p=0.067 (FP), p=0.0025 (CS), p=0.043 (RW), one sample t-test, α <0.05). (E) A schematic drawing of the experimental setup for the DA neuron recording and SC inactivation. Ipsi-lesional SC was inactivated. The neural activity was recorded from the ipsi-lesional SNc.
Figure 4—figure supplement 1
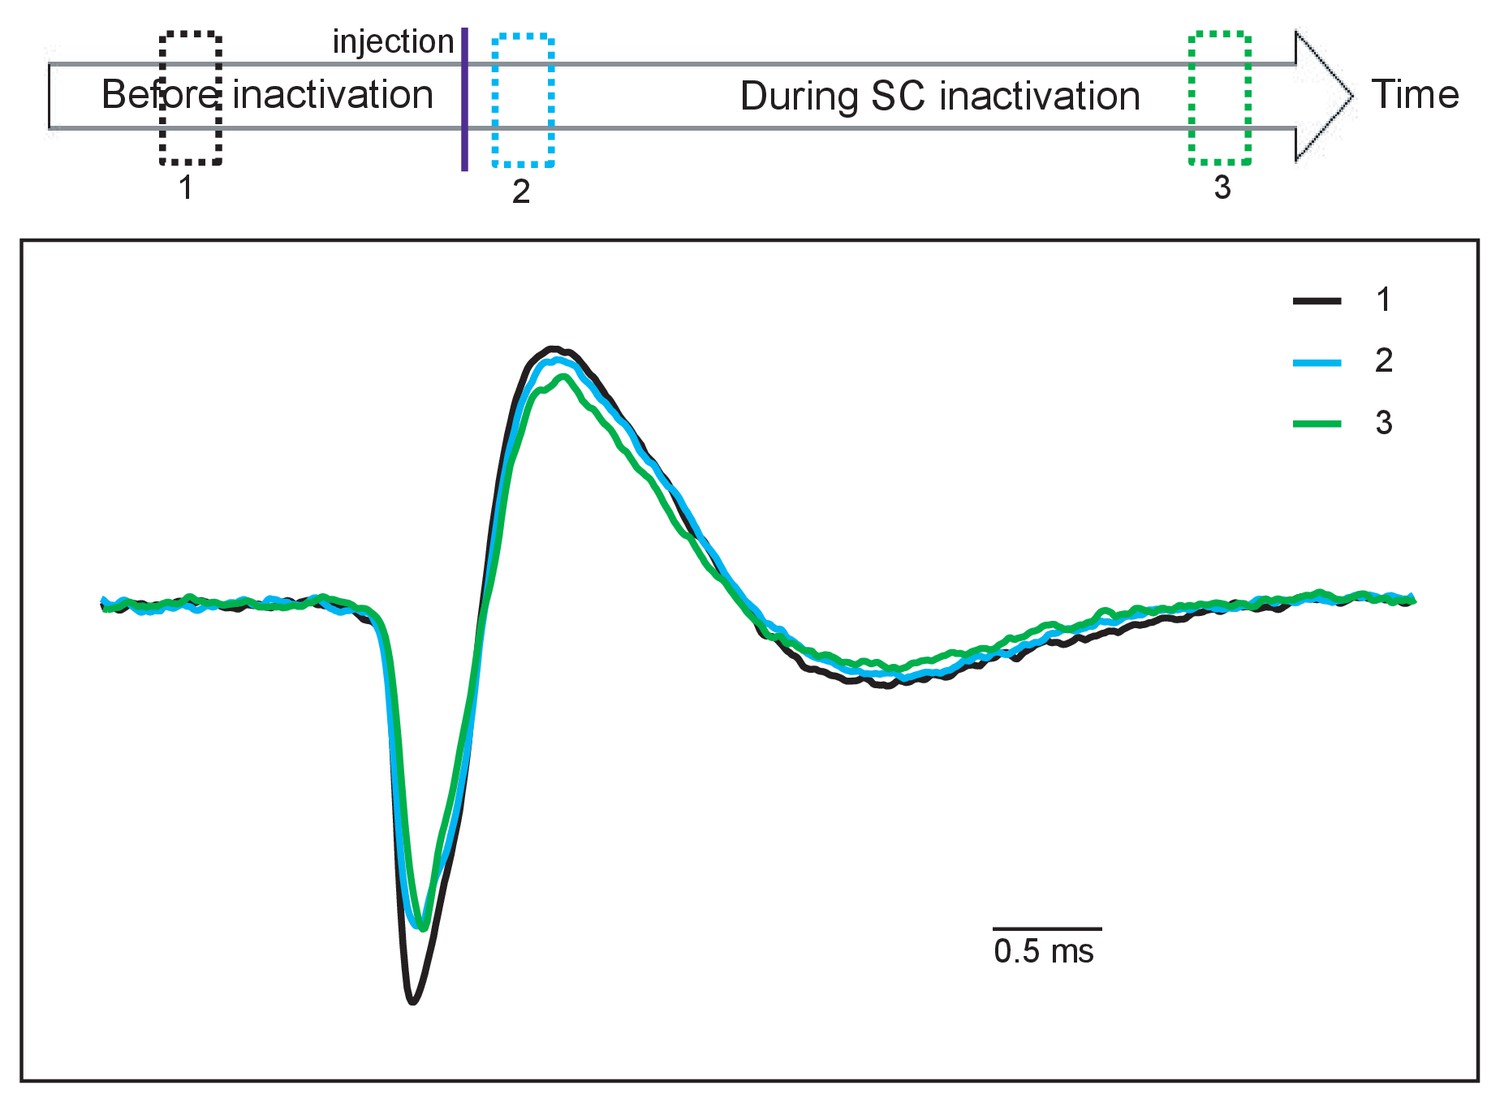
Spike waveforms of a DA neuron during a daily session.
Comparing the spike waveform of a presumed DA neuron (1) before (black), and (2) soon after muscimol injection (blue) and (3) at the end of recording (green). Averaged spike waveforms obtained from individual time periods indicated by the three dotted squares with corresponding colors on the top. The spike waveforms did not appear to significantly change through the recording session.
Figure 4—figure supplement 2
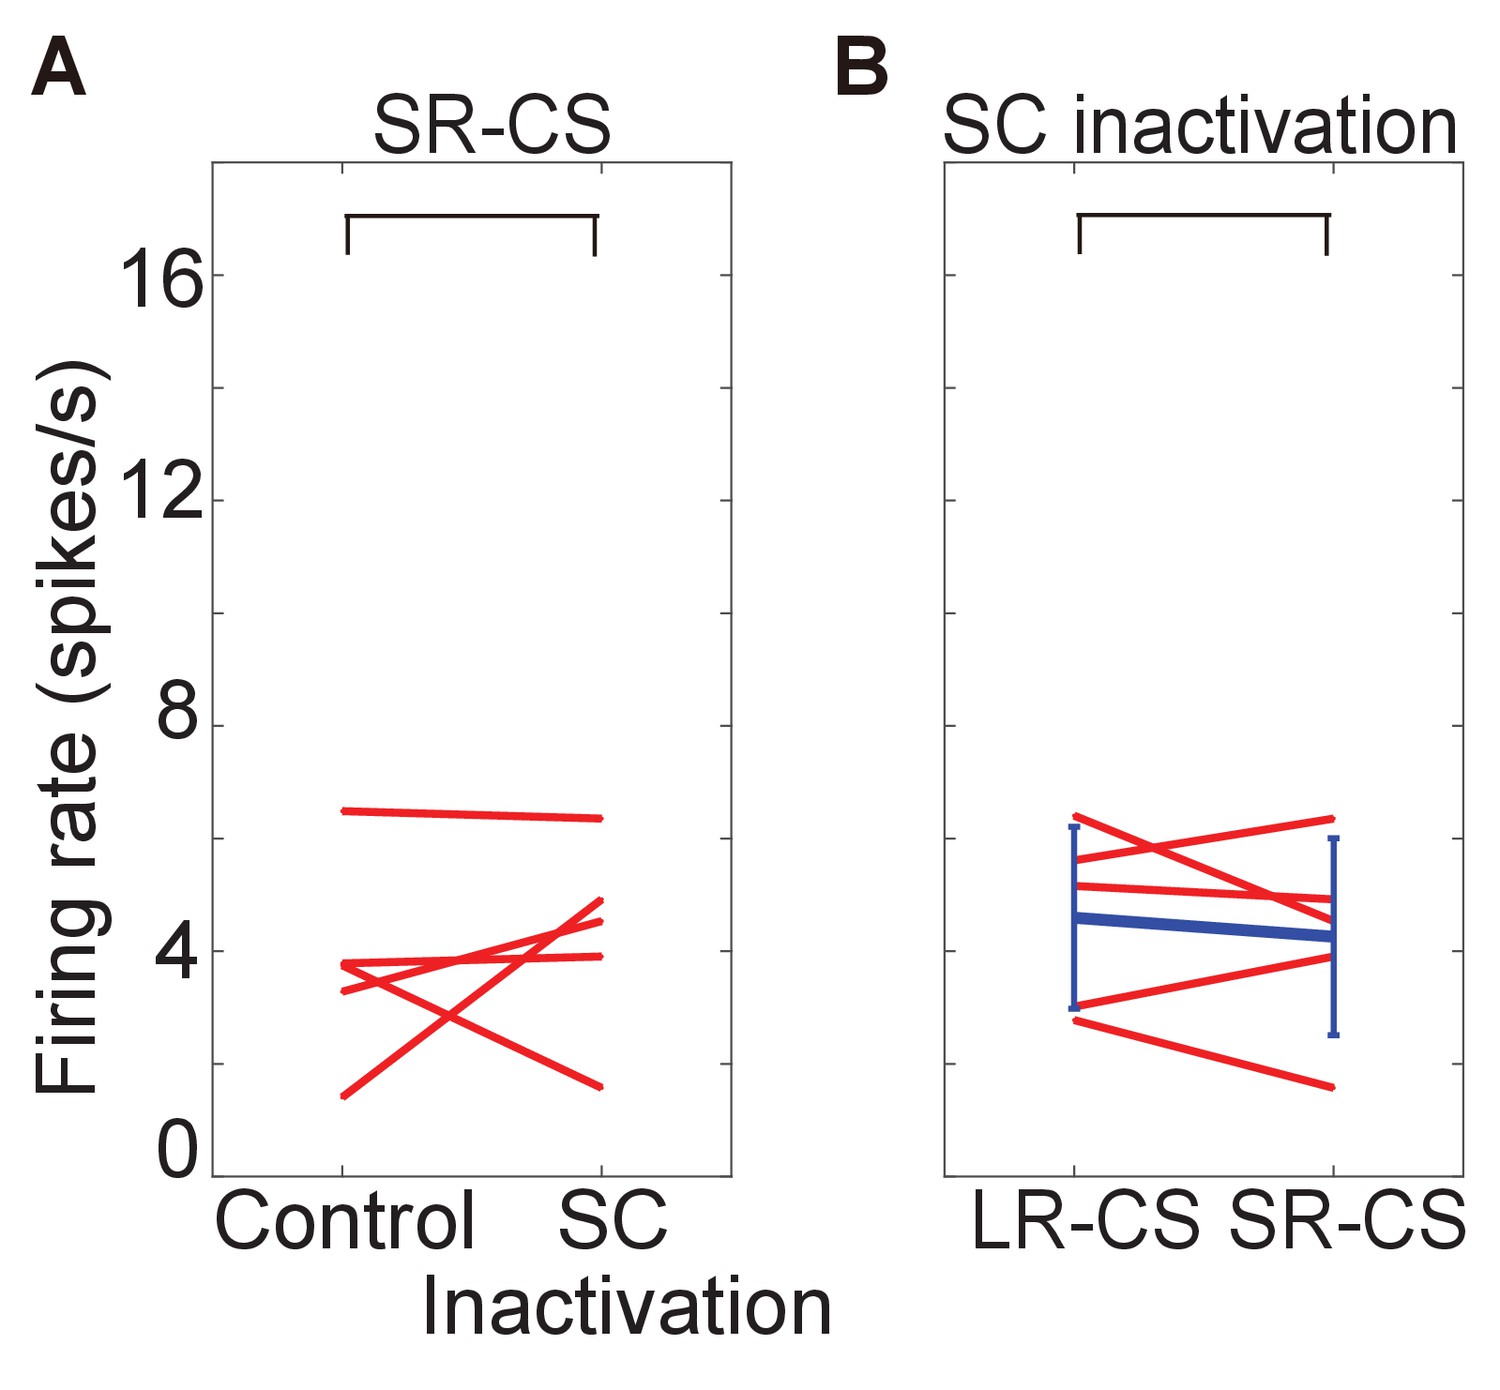
firing rate of responses to SR-CS.
These figures show firing rate of response to SR-CS before and after muscimol injection (A) and difference of firing rate between responses to LR-CS and to SR-CS during the SC inactivation (time windows: 100–300 ms from CS onset). In both cases, there are no significant difference (N = 5, p=0.608 (SR-CS), p=0.625 (SC inactivation), one sample t-test, α <0.05).
Download links
A two-part list of links to download the article, or parts of the article, in various formats.
Downloads (link to download the article as PDF)
Open citations (links to open the citations from this article in various online reference manager services)
Cite this article (links to download the citations from this article in formats compatible with various reference manager tools)
Emergence of visually-evoked reward expectation signals in dopamine neurons via the superior colliculus in V1 lesioned monkeys
eLife 6:e24459.
https://doi.org/10.7554/eLife.24459


