Proteomic mapping of cytosol-facing outer mitochondrial and ER membranes in living human cells by proximity biotinylation
- Massachusetts Institute of Technology, United States
- Broad Institute of MIT and Harvard, United States
- Howard Hughes Medical Institute, Massachusetts General Hospital, Harvard Medical School, United States
Figures
Figure 1 with 1 supplement
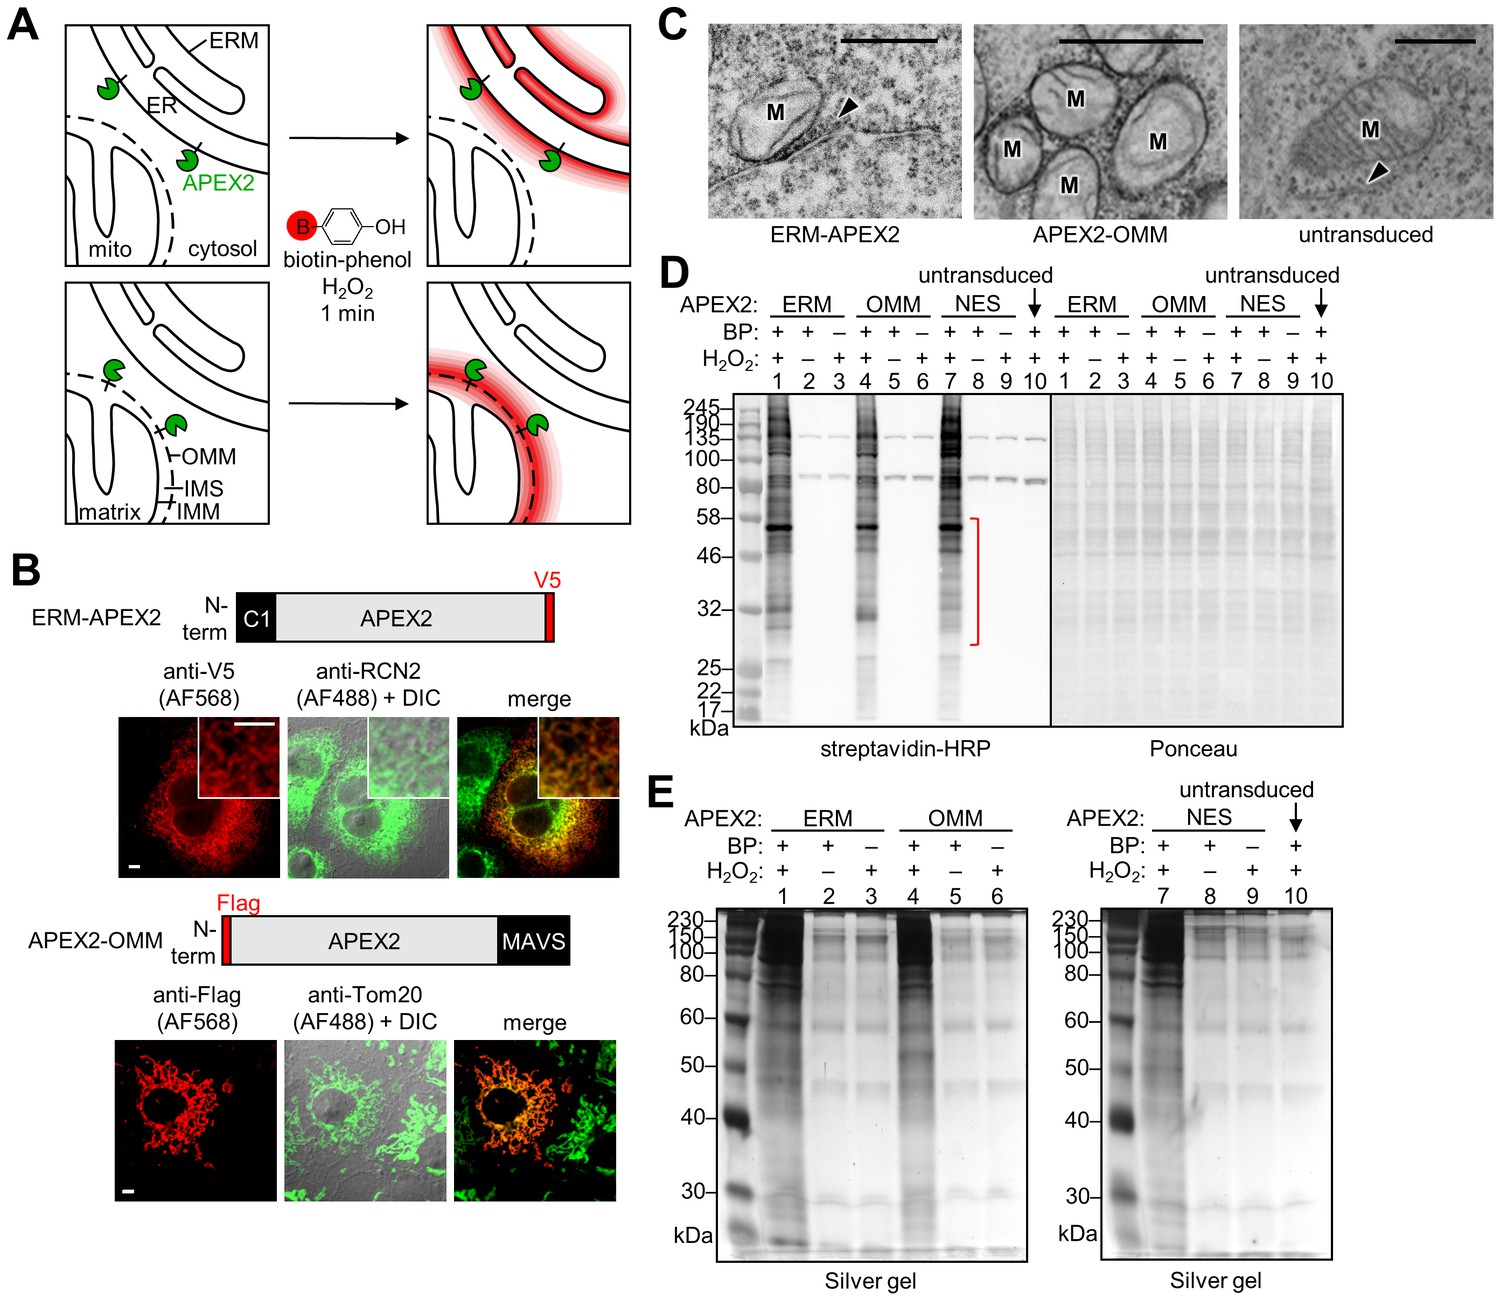
APEX2 proteomic labeling scheme and characterization of APEX2 fusion constructs on the ER and outer mitochondrial membranes.
(A) Scheme of APEX2-catalyzed biotinylation at the endoplasmic reticulum membrane (ERM, top) and outer mitochondrial membrane (OMM, bottom). APEX2 (green) was targeted to the ERM facing the cytosol, via fusion to the N-terminal 27 amino acids of the ER-resident protein P450 oxidase 2C1 and to the OMM via fusion to the C-terminal 31 amino acids of mitochondrial antiviral-signaling protein MAVS. Live cells were pre-incubated with biotin-phenol (red B = biotin) for 30 min, and hydrogen peroxide (H2O2) was added to initiate the biotinylation reaction for 1 min. Cells were quenched and then lysed, and the biotinylated proteins were enriched with streptavidin beads and analyzed by mass spectrometry. IMS, intermembrane space. IMM, inner mitochondrial membrane. (B) Confocal fluorescence imaging of ERM-APEX2 and APEX2-OMM fusion constructs. Constructs were introduced into COS-7 cells using lentivirus. Two days after transduction, the cells were fixed and stained with anti-V5 to detect ERM-APEX2 (Alexa Fluor 568 (AF568) readout), or anti-Flag to detect APEX2-OMM (AF568 readout). Anti-RCN2 was used to visualize the ER, or anti-Tom20 to visualize mitochondria (AF488 readout). Fluorescence channels are not normalized. Scale bars, 5 µm. The insets show a zoomed in portion of the cell. DIC, differential interference contrast. (C) Electron microscopy (EM) characterization of ERM-APEX2 and APEX2-OMM localization. ERM-APEX2 and APEX2-OMM genes were introduced into human embryonic kidney (HEK) 293T cells using lentivirus. Cells were fixed and overlaid with a solution of diaminobenzidine and H2O2. APEX2 catalyzes the localized polymerization of diaminobenzidine, which then reacts with osmium to provide contrast for EM (Lam et al., 2015; Martell et al., 2012). Dark regions indicate APEX2 activity. ER indicated by arrowheads. M, mitochondria. Untransduced HEK cell shown for comparison. Scale bars, 500 nm. The untransduced and APEX2-OMM images in this figure overlap with data shown in Supplementary Figure 7 of Lam et al. (2015). (D) Analysis of ERM-APEX2 and APEX2-OMM-catalyzed biotinylation by streptavidin blot. HEK 293T cells stably expressing ERM-APEX2, APEX2-OMM, APEX2-NES (NES = nuclear export sequence), or no APEX2 construct (lane 10) were labeled live as in (A). Whole cell lysates were separated by gel electrophoresis and blotted with streptavidin-horseradish peroxidase (streptavidin-HRP) on the left, or stained with Ponceau on the right. BP, biotin-phenol. The red bracket indicates a molecular weight range where the banding patterns produced by these APEX2 constructs differ notably. (E) Analysis of streptavidin-enriched biotinylated proteomes by silver stain. ERM-APEX2, APEX2-OMM, and APEX2-NES stable cells were labeled live as in (A), lysed, and incubated with streptavidin beads to enrich for biotinylated proteins. Eluted proteins were separated by gel electrophoresis and visualized by silver stain.
Figure 1—figure supplement 1
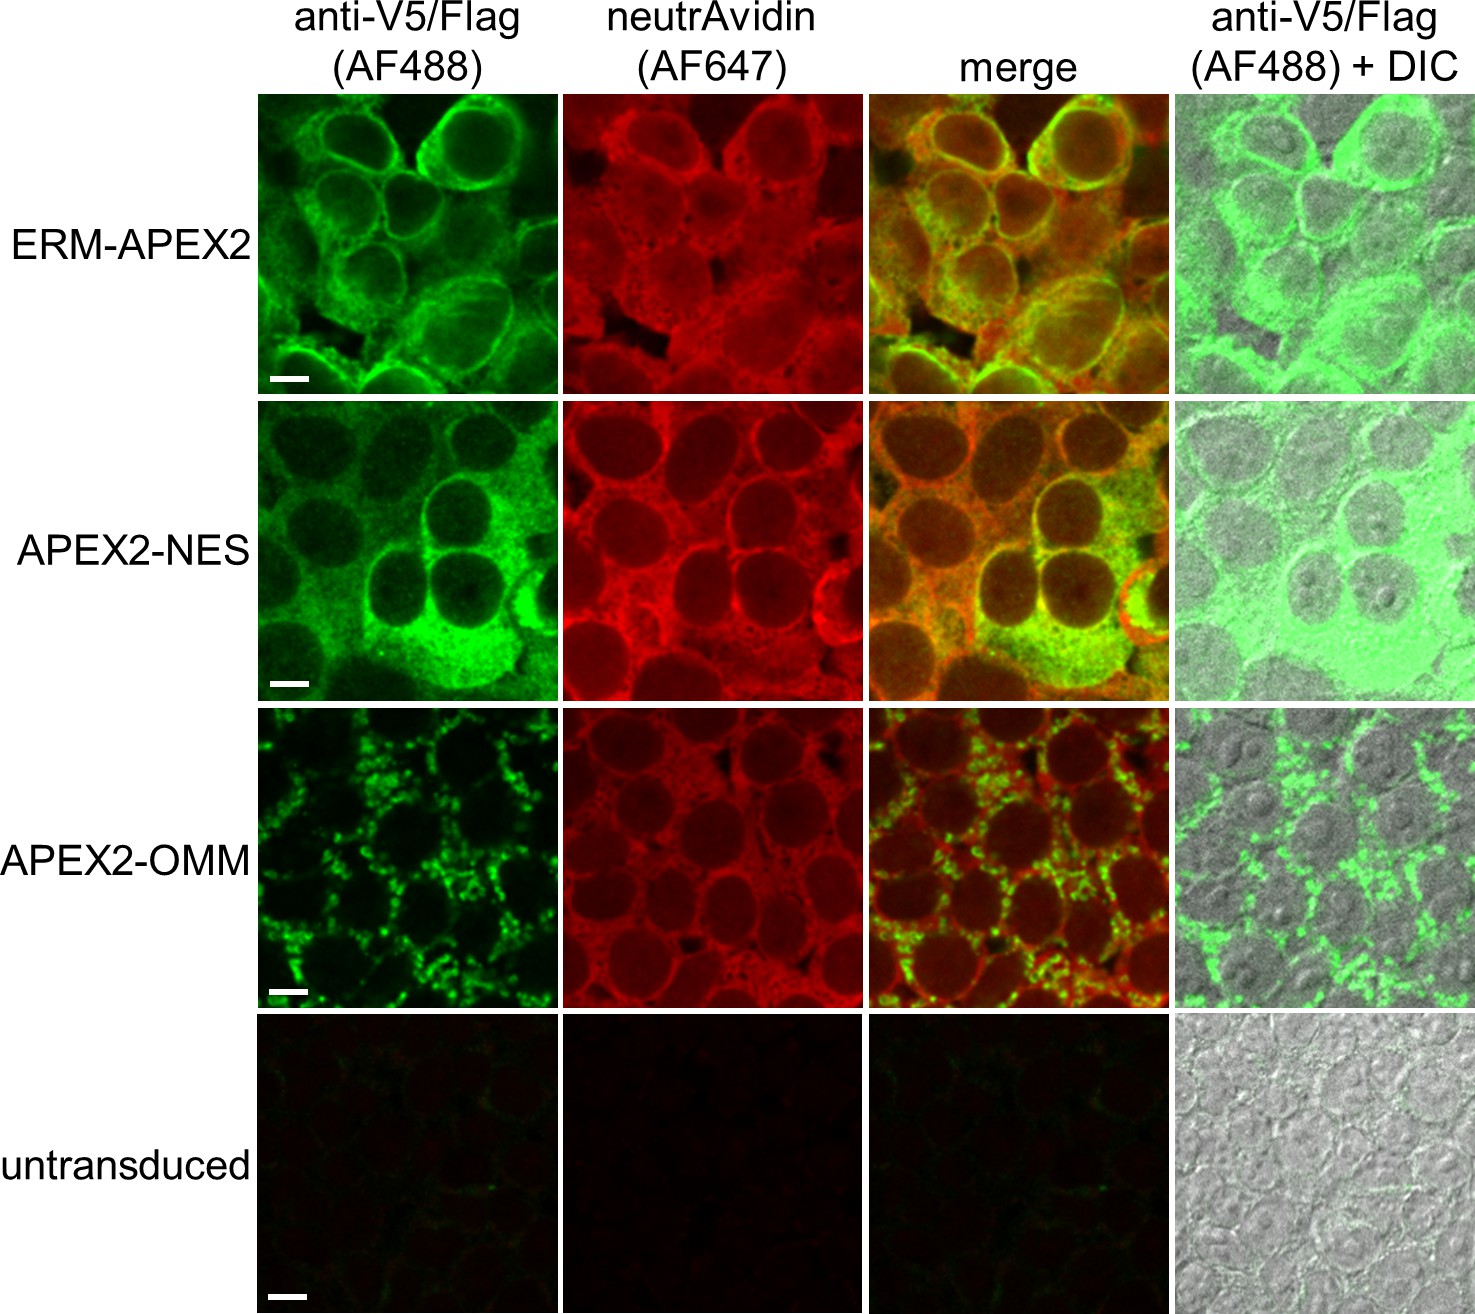
Characterization of ERM-APEX2 and APEX2-OMM-catalyzed biotinylation by imaging.
HEK 293T cells stably expressing ERM-APEX2, APEX2-OMM, or a cytosolic APEX2 construct (APEX2-NES, NES = nuclear export sequence) were labeled live as in Figure 1A. The cells were then fixed and stained with neutrAvidin-AF647 conjugate to detect biotinylated proteins and with either anti-V5 to detect ERM-APEX2 or anti-Flag to detect APEX2-OMM and APEX2-NES. The anti-V5/anti-Flag channel is not normalized across image sets. DIC, differential interference contrast. Scale bars, 10 µm.
Figure 2 with 1 supplement

OMM and ERM SILAC proteomic experiments in HEK 293T cells.
(A) Design of two 3-state SILAC (Stable Isotope Labeling by Amino acids in in Cell culture) experiments. HEK 293T cells stably expressing APEX2-OMM or ERM-APEX2 were cultured in media containing heavy (H) isotopes of arginine and lysine. APEX2-NES stable cells were cultured in media with medium (M) isotopes of arginine and lysine, and negative control cells where either expression of APEX2 was omitted or ERM-APEX2 or APEX2-OMM stable cells were not treated with H2O2 were cultured in light (L) media. All dishes were then identically treated with biotin-phenol and H2O2 except for the negative controls mentioned before. The cells were separately lysed, and the three lysates in each replicate were combined 1:1:1 by protein mass. The mixture was then enriched using streptavidin beads and analyzed by mass spectrometry. (B) Scatter plot showing log2(H/M) versus log2(H/L) for Replicate 1 for the OMM proteomic experiment (left) and the ERM proteomic experiment (right). For each of the 5296 proteins detected in Replicate 1 of the OMM proteomic experiment, the log2(H/M) value was plotted against the log2(H/L) value. Known OMM proteins (members of our OMM true positive list, Supplementary file 2a) are shown in green; proteins without prior mitochondrial annotation according to MitoCarta (Pagliarini et al., 2008), Gene Ontology Cell Component (GOCC) (Ashburner et al., 2000) annotation, or the APEX-mapped mitochondrial matrix (Rhee et al., 2013) or mitochondrial intermembrane space (IMS) (Hung et al., 2014) proteomes are shown in red; all other proteins are shown in black. SILAC ratio cut-offs used to filter the OMM mass spectrometric data and obtain the final OMM proteome are shown by the dashed lines. On the right, a similar analysis was conducted for the 4799 proteins detected in Replicate 1 of the ERM proteomic experiment. Known ERM proteins (from our ERM true positive list, Supplementary file 2b) are shown in green; proteins with cytosolic annotation are shown in red; all others are shown in black. (C) Characterization of the specificity of the OMM and ERM proteomes. The first two columns show the percentage of proteins in the entire human proteome and our OMM proteome with prior mitochondrial annotation according to MitoCarta (Pagliarini et al., 2008), GOCC (Ashburner et al., 2000), and our APEX-mapped mitochondrial matrix (Rhee et al., 2013) and mitochondrial IMS (Hung et al., 2014) proteomes. The next two columns show the breakdown of proteins with GOCC sub-mitochondrial annotation available (mitochondrial matrix, IMM, IMS, or OMM). If a protein had more than one sub-mitochondrial annotation, we assigned it to one of the four categories in this priority: OMM>IMS>IMM>matrix. Columns 5 and 6 show the percentage of proteins with secretory pathway annotation according to GOCC (Ashburner et al., 2000) or Phobius (Käll et al., 2004, Käll et al., 2007) in the entire human proteome and our ERM proteome, respectively. The last two columns show the breakdown of proteins with GOCC sub-secretory annotation available. Protein assignments were based on the following priority: endoplasmic reticulum>Golgi apparatus>plasma membrane. (D) Fluorescence imaging of endogenous C2CD3, a mitochondrial orphan, in COS-7 cells. COS-7 cells were transfected with mitochondrially-targeted blue fluorescent protein (mito-BFP) and mCherry-KDEL (not shown). The cells were fixed and stained with an antibody against endogenous C2CD3. Scale bar, 10 µm.
Figure 2—figure supplement 1
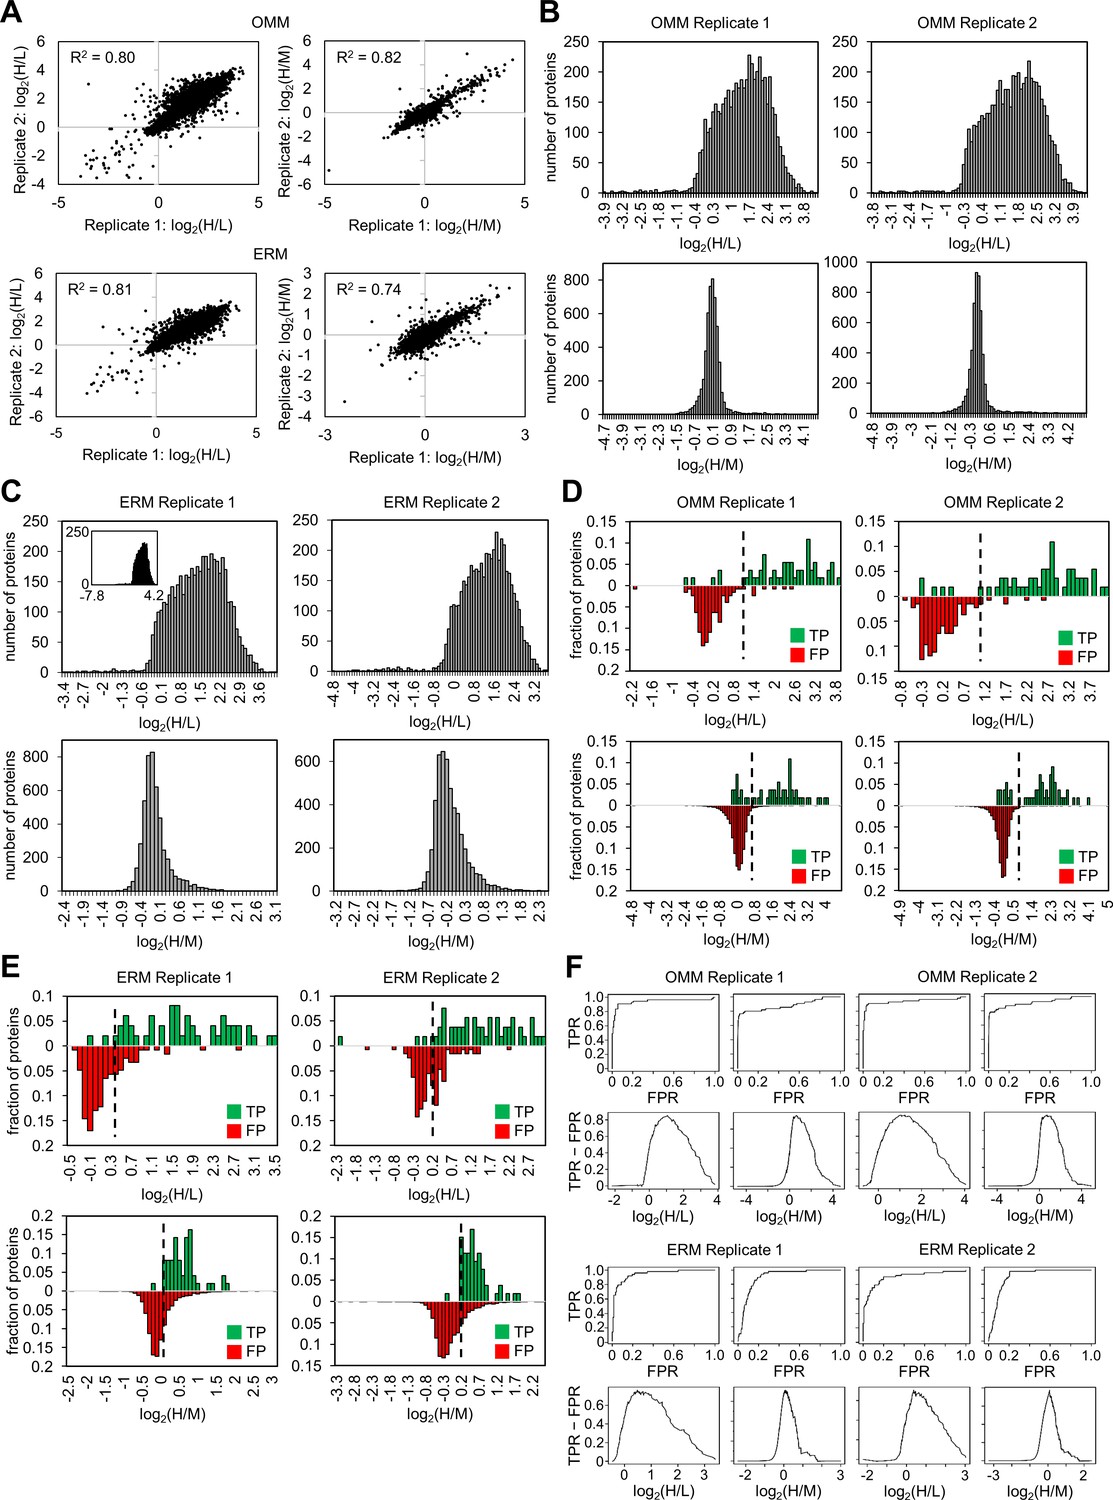
Analysis of the OMM and ERM proteomic data to obtain the final proteomes.
(A) Quantitative correlation between the proteomic experiments. For the OMM proteomic experiment (top row) and the ERM proteomic experiment (bottom row), the log2(H/L) value for a protein from Replicate 2 is plotted against the log2(H/L) value from Replicate 1 (left). The graphs on the right show the same analysis for the log2(H/M) values. (B) Histograms of log2(H/L) and log2(H/M) values for replicates 1 and 2 of the OMM proteomic experiment. Bin size = 0.1. (C) Histograms of log2(H/L) and log2(H/M) values for replicates 1 and 2 of the ERM proteomic experiment. Bin size = 0.1. A zoomed in view of the log2(H/L) distribution is shown for Replicate 1; the complete data are shown in the inset. (D) True positive (TP) and false positive (FP) analysis of the OMM proteomic experiment. The purpose of the log2(H/L) ratio is to separate biotinylated proteins from non-specific streptavidin bead binders. In the log2(H/L) histograms for both replicates (top), the distribution of the true positives, known OMM proteins, is plotted in green, and the distribution of false positives, soluble mitochondrial matrix proteins, is plotted in red. The purpose of the log2(H/M) ratio is to separate OMM proteins from non-mitochondrial proteins. In the log2(H/M) histograms for both replicates (bottom), the distribution of true positives, which are again known OMM proteins, is plotted in green, and the distribution of false positives, proteins without prior mitochondrial annotation, is plotted in red. The dashed lines indicate the SILAC ratio cut-offs calculated in (F). (E) TP and FP analysis of the ERM proteomic experiment. Analysis for the log2(H/L) histogram was similar to that in (D), where the true positives are known ERM proteins (green), and the false positives are soluble mitochondrial matrix proteins (red). Analysis for the log2(H/M) histogram was also similar, where the true positives are known ERM proteins (proteins in Supplementary file 2b, green), and the false positives are all proteins not on the ERM true positive proteins list (red). The dashed lines indicate the SILAC ratio cut-offs calculated in (F). (F) Receiver operating characteristic and true positive rate - false positive rate analysis to determine cut-offs. For each replicate of the OMM proteomic experiments (top two rows) and the ERM proteomic experiments (bottom two rows), the experiment quality was assessed by plotting receiver operating characteristic (ROC) curves, shown in rows 1 and 3. Proteins were ranked in descending order of SILAC ratio of interest. The true positive rate (TPR) and the false positive rate (FPR) were calculated at every possible cut-off. TPR is defined as the fraction of detected true positives above the cut-off. FPR is defined as the fraction of detected false positives above the cut-off. The true positive and false positive proteins for each ratio and for each experiment were the same as in (D) and (E). The graphs in rows 2 and 4 depict the difference between the TPR and FPR at every SILAC ratio cut-off. In each case, the SILAC ratio where the difference between TPR and FPR was maximal was chosen to be the cut-off.
Figure 3 with 1 supplement
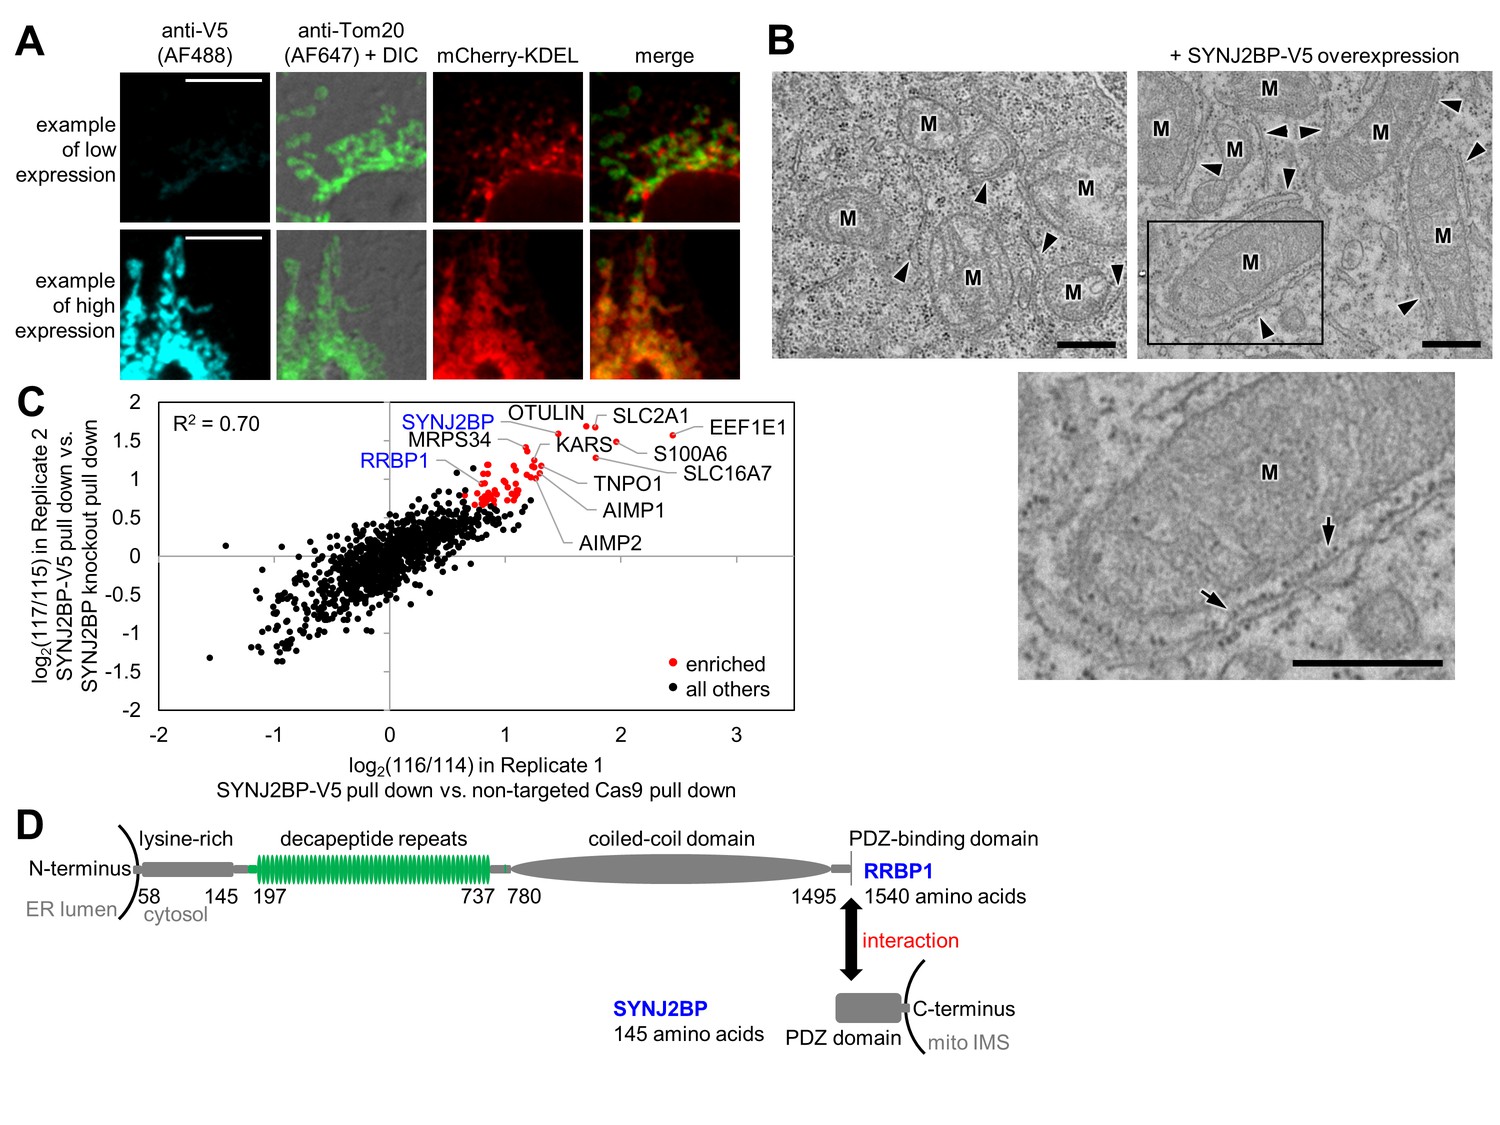
Identification of SYNJ2BP and RRBP1 as a potential mitochondria-ER tethering complex.
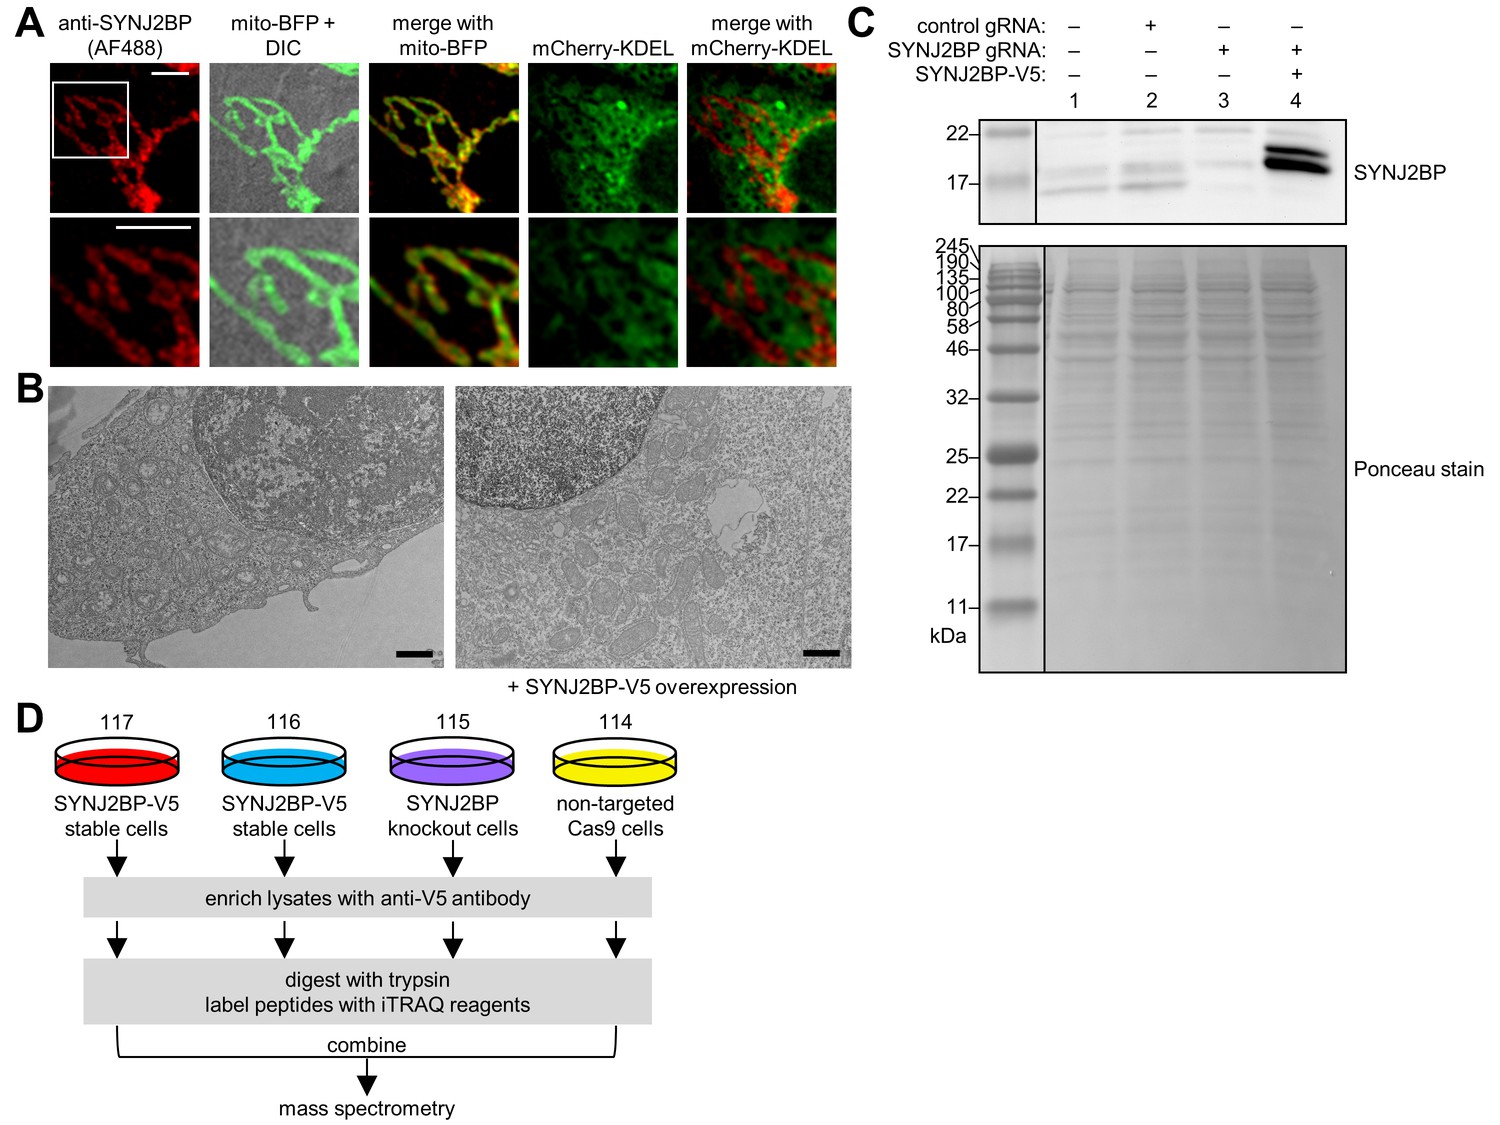
(A) SYNJ2BP overexpression assay in COS-7 cells. COS-7 cells were transfected with SYNJ2BP-V5 and mCherry-KDEL (an ER marker) using Lipofectamine 2000. ~26 hr later, cells were fixed and stained with anti-V5 to detect SYNJ2BP and anti-Tom20 to visualize mitochondria. Based on anti-V5 signal intensity, cells with high or low SYNJ2BP expression were identified and imaged within the heterogeneous population. Scale bars, 10 µm. (B) EM characterization of HEK 293T cells overexpressing SYNJ2BP-V5. HEK 293T were transfected with 1 µg V5-APEX2-NLS (NLS = nuclear localization signal) alone, left, or with 2 µg SYNJ2BP-V5 and 1 µg V5-APEX2-NLS, using Lipofectamine 2000. The cells were fixed, stained with DAB and osmium, and then processed for EM. Micrographs are shown for cells with positive nuclear staining, indicating transfection (see zoomed out views in Figure 3—figure supplement 1B). ‘M’, mitochondria. Arrowheads point to ER. Bottom image shows zoom of the boxed region. Arrows point to ribosomes. Scale bars, 500 nm. (C) Correlation between replicates of the SYNJ2BP-V5 immunoprecipitation-mass spectrometry (IP-MS) experiment. To identify binding partners of SYNJ2BP, a population of HeLa cells stably expressing SYNJ2BP-V5 with endogenous SYNJ2BP knocked out was generated. SYNJ2BP-V5 was enriched from whole cell lysates using anti-V5 antibody coupled to protein G beads. The scatter plot shows the correlation between two independent IP-MS replicate experiments. Proteins deemed significantly enriched (by a moderated t-test; p-value<0.02) are colored in red and all others in black. (D) Structural domains of SYNJ2BP and RRBP1. For RRBP1 (top), regions in green vary among isoforms; isoforms vary in the number of decapeptide repeats (up to 54 repeats) and in the presence or absence of three amino acids after the decapeptide repeat region. The C-terminus of RRBP1 contains a consensus PDZ-binding domain (S/T-X-Φ-COOH, where X is any amino acid and Φ is a hydrophobic amino acid, usually V/I/L; TSV in RRBP1). SYNJ2BP is a tail-anchored OMM protein with a cytosolic PDZ domain.
Figure 3—figure supplement 1
Characterization of SYNJ2BP and identification of RRBP1 as a binding partner.
(A) Fluorescence microscopy of endogenous SYNJ2BP. COS-7 cells were transfected with mito-BFP and mCherry-KDEL, mitochondrial and ER markers, respectively. The cells were then fixed and stained with an antibody against endogenous SYNJ2BP and imaged by confocal microscopy. Bottom row shows zoom of boxed region. Scale bars, 5 µm. (B) Zoomed-out views of the EM micrographs in Figure 3B. The dark stain in the nucleus (from APEX2-NLS) indicates that these cells were transfected. Scale bars, 1 µm. (C) Characterization of the lines used for SYNJ2BP IP-MS. Whole cell lysates from wild type HeLa cells (lane 1), HeLa cell populations stably expressing Cas9 and a control guide RNA (gRNA) that does not target anything in the genome (lane 2), cells stably expressing Cas9 and a gRNA against SYNJ2BP (lane 3), and cells stably expressing Cas9, a gRNA against SYNJ2BP, and SYNJ2BP-V5 (lane 4) were separated on a gel and analyzed by anti-SYNJ2BP western blot. Ponceau stain of the same blot is shown below. (D) SYNJ2BP IP-MS scheme to identify binding partners. 117 and 116 are two cultures of HeLa cells stably overexpressing SYNJ2BP-V5 with endogenous SYNJ2BP knocked out. 115 and 114 are negative control cultures with endogenous SYNJ2BP knocked out, or nothing knocked out respectively. The cultures were separately lysed, and separately enriched with anti-V5 antibody. The enriched material was digested on-bead with trypsin, and the peptides were labeled with iTRAQ (isobaric Tags for Relative and Absolute Quantification) reagents (114–117, as indicated). The labeled peptides from each of the four samples were combined and analyzed by mass spectrometry.
Figure 4 with 3 supplements
Characterization of the SYNJ2BP-RRBP1 interaction.
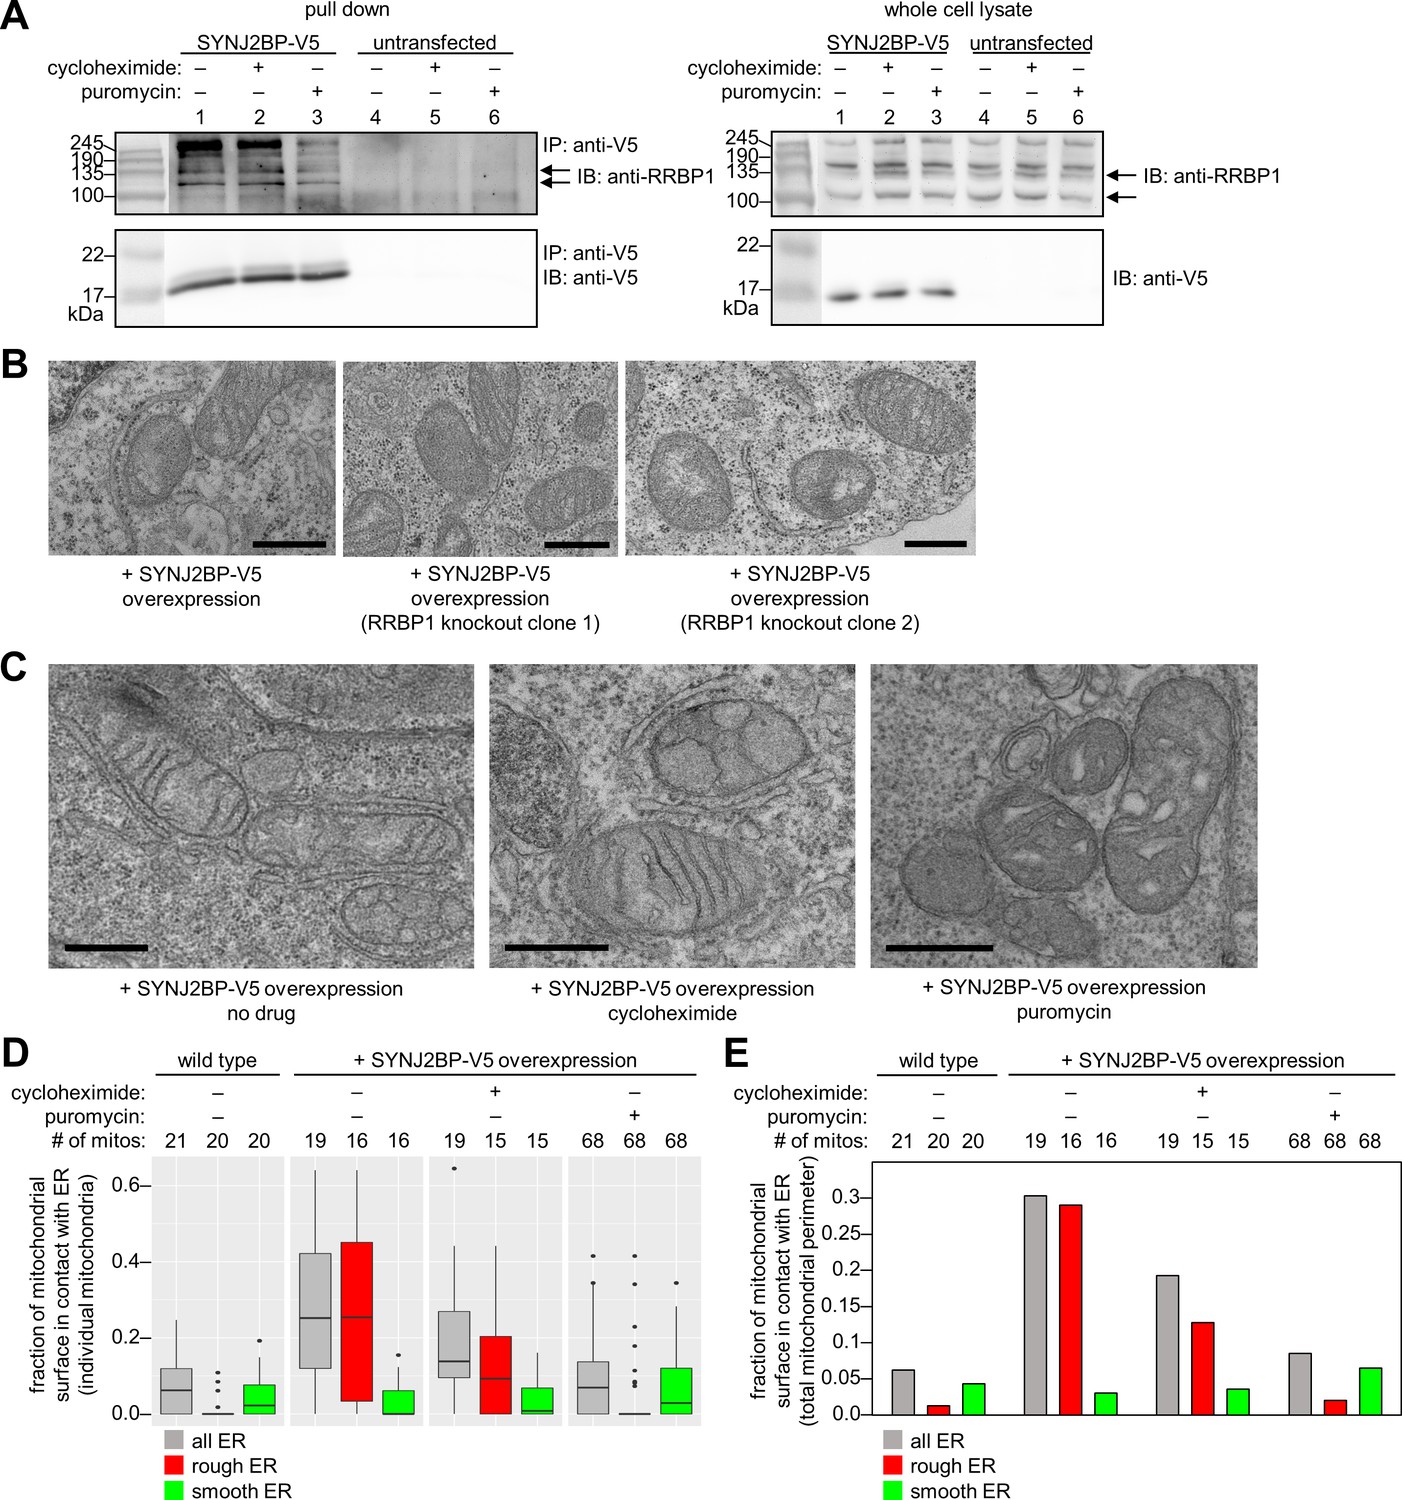
(A) Pull down of SYNJ2BP-V5 from cells treated with protein translation inhibitors. HEK 293T cells expressing SYNJ2BP-V5 (Lipofectamine 2000 transfection) were treated with 200 µM cycloheximide or puromycin for 2 hr before cell lysis. Lysates were enriched with anti-V5 coated beads and blotted for endogenous RRBP1 (top) and SYNJ2BP-V5 (bottom), left. Lanes 4–6 show untransfected controls. Right, gels show same analysis of whole cell lysates prior to anti-V5 enrichment. Black arrows indicate RRBP1 bands. (B) EM of HEK 293T cells overexpressing SYNJ2BP-V5 in the presence versus absence of RRBP1 knockout (KO). SYNJ2BP-V5 and Flag-APEX2-NLS (a nuclear marker) were transfected into wild-type cells, left, and two different RRBP1 KO clonal cell lines, middle and right. After 24 hr, the cells were fixed, stained with DAB and osmium, and processed for EM. Micrographs are shown for cells with positive nuclear stain (indicating transfection). Additional fields of view in Figure 4—figure supplement 1B. Scale bars, 500 nm. (C) EM of HEK 293T cells overexpressing SYNJ2BP-V5 and treated with protein translation inhibitors as in (A). The cells were fixed and stained as in (B). Scale bars, 500 nm. Additional EM fields of view in Figure 4—figure supplement 2A. (D) Quantitation of EM images in (C) and Figure 4—figure supplement 2A. Box plots showing the percent of mitochondrial surface in contact (<80 nm) with the ER. Untransfected cells also analyzed for comparison (left). (E) Same as D, but a single percentage is shown for each condition that reflects the total length of mitochondrial perimeter in contact with ER (total, rough, or smooth), divided by the total length of mitochondrial perimeter measured across ≥6 fields of view per condition (15–68 total mitochondria per condition).
-
Figure 4—source data 1
Spreadsheet containing the mitochondrial perimeter length, type of ER in contact with each mitochondrion, mitochondrion-ER contact length, and average distance between the mitochondrion and the ER for each mitochondrion analyzed in Figure 4D and E.
- https://doi.org/10.7554/eLife.24463.011
Figure 4—figure supplement 1
Additional characterization of the SYNJ2BP-RRBP1 complex and of RRBP1.
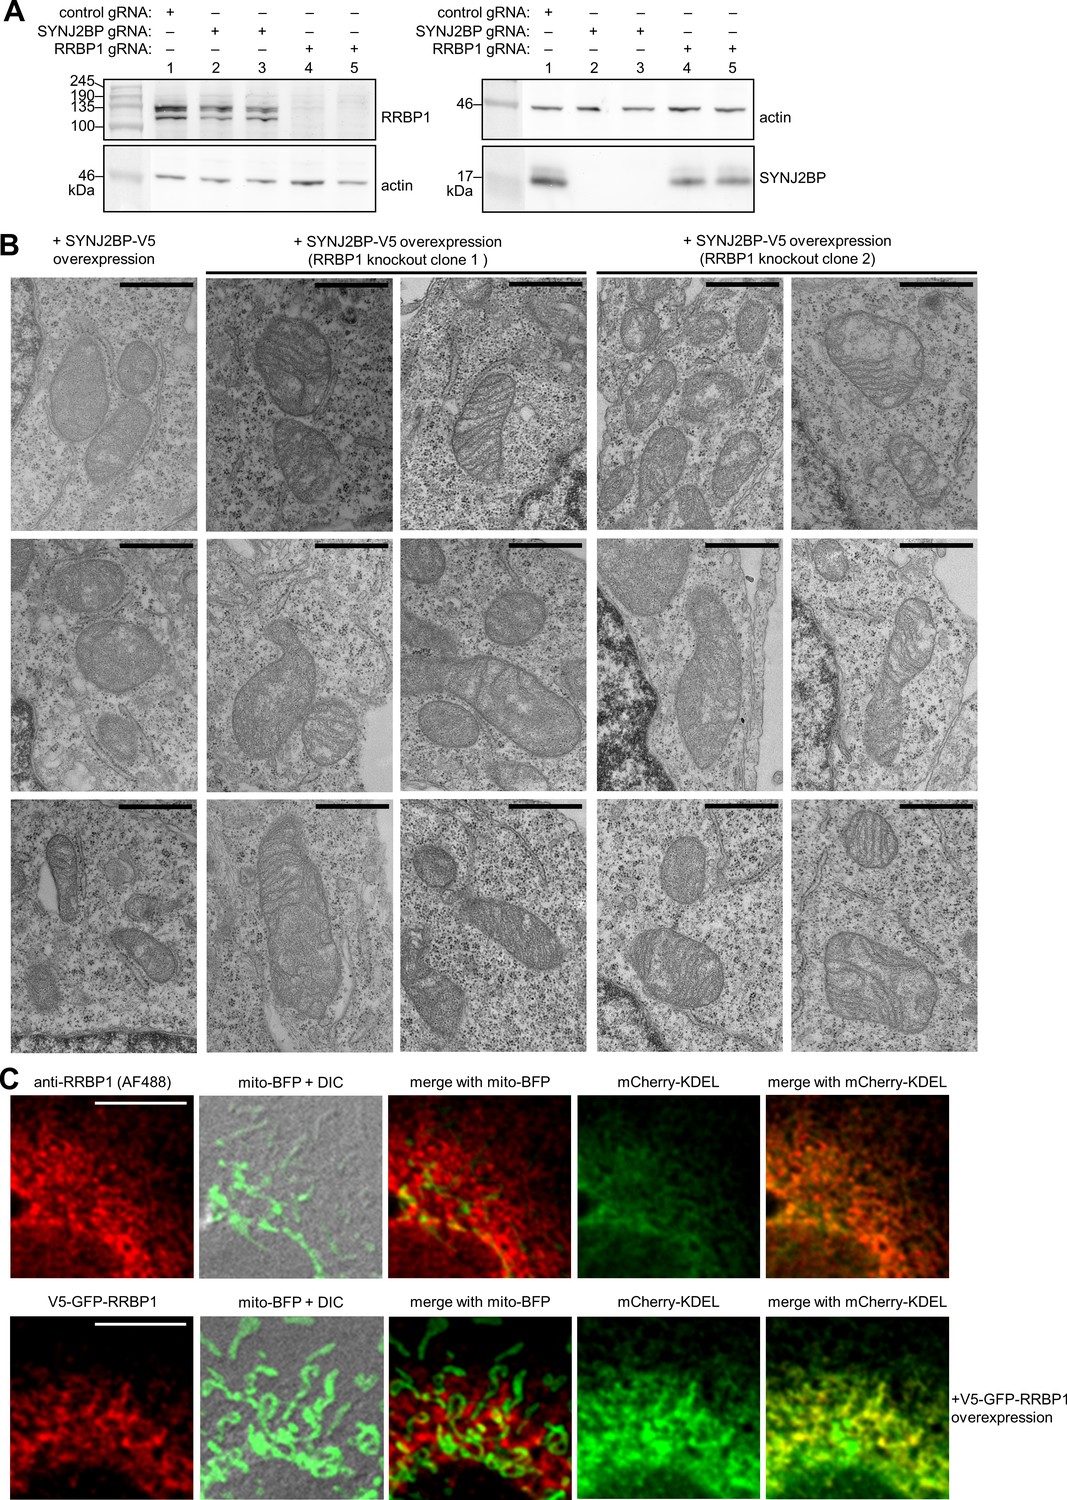
(A) Characterization of RRBP1 and SYNJBP knockout cells. Whole cell lysate from clonal HEK 293 T cells expressing Cas9 and either a control gRNA, one of two different gRNAs against SYNJ2BP, and one of two different gRNAs against RRBP1 were separated on a gel and analyzed by western blotting with an anti-RRBP1 or anti-SYNJ2BP antibody. Blotting with an anti-actin antibody as a loading control is also shown. (B) Additional electron microscopy images of the samples from Figure 4B. Scale bars, 500 nm. (C) Fluorescence imaging of endogenous and overexpressed RRBP1. To analyze the localization of endogenous RRBP1 (top row), COS-7 cells were transfected with mito-BFP and mCherry-KDEL. The cells were fixed and stained with an antibody against RRBP1, and the sample was imaged by confocal microscopy. To analyze the localization of overexpressed RRBP1 (bottom row), COS-7 cells were transfected with a V5- and GFP-tagged RRBP1, mito-BFP, and mCherry-KDEL. The cells were fixed and imaged by confocal microscopy. Scale bars, 10 µm.
Figure 4—figure supplement 2
Effect of protein translation inhibitors on mitochondria-ER contacts.
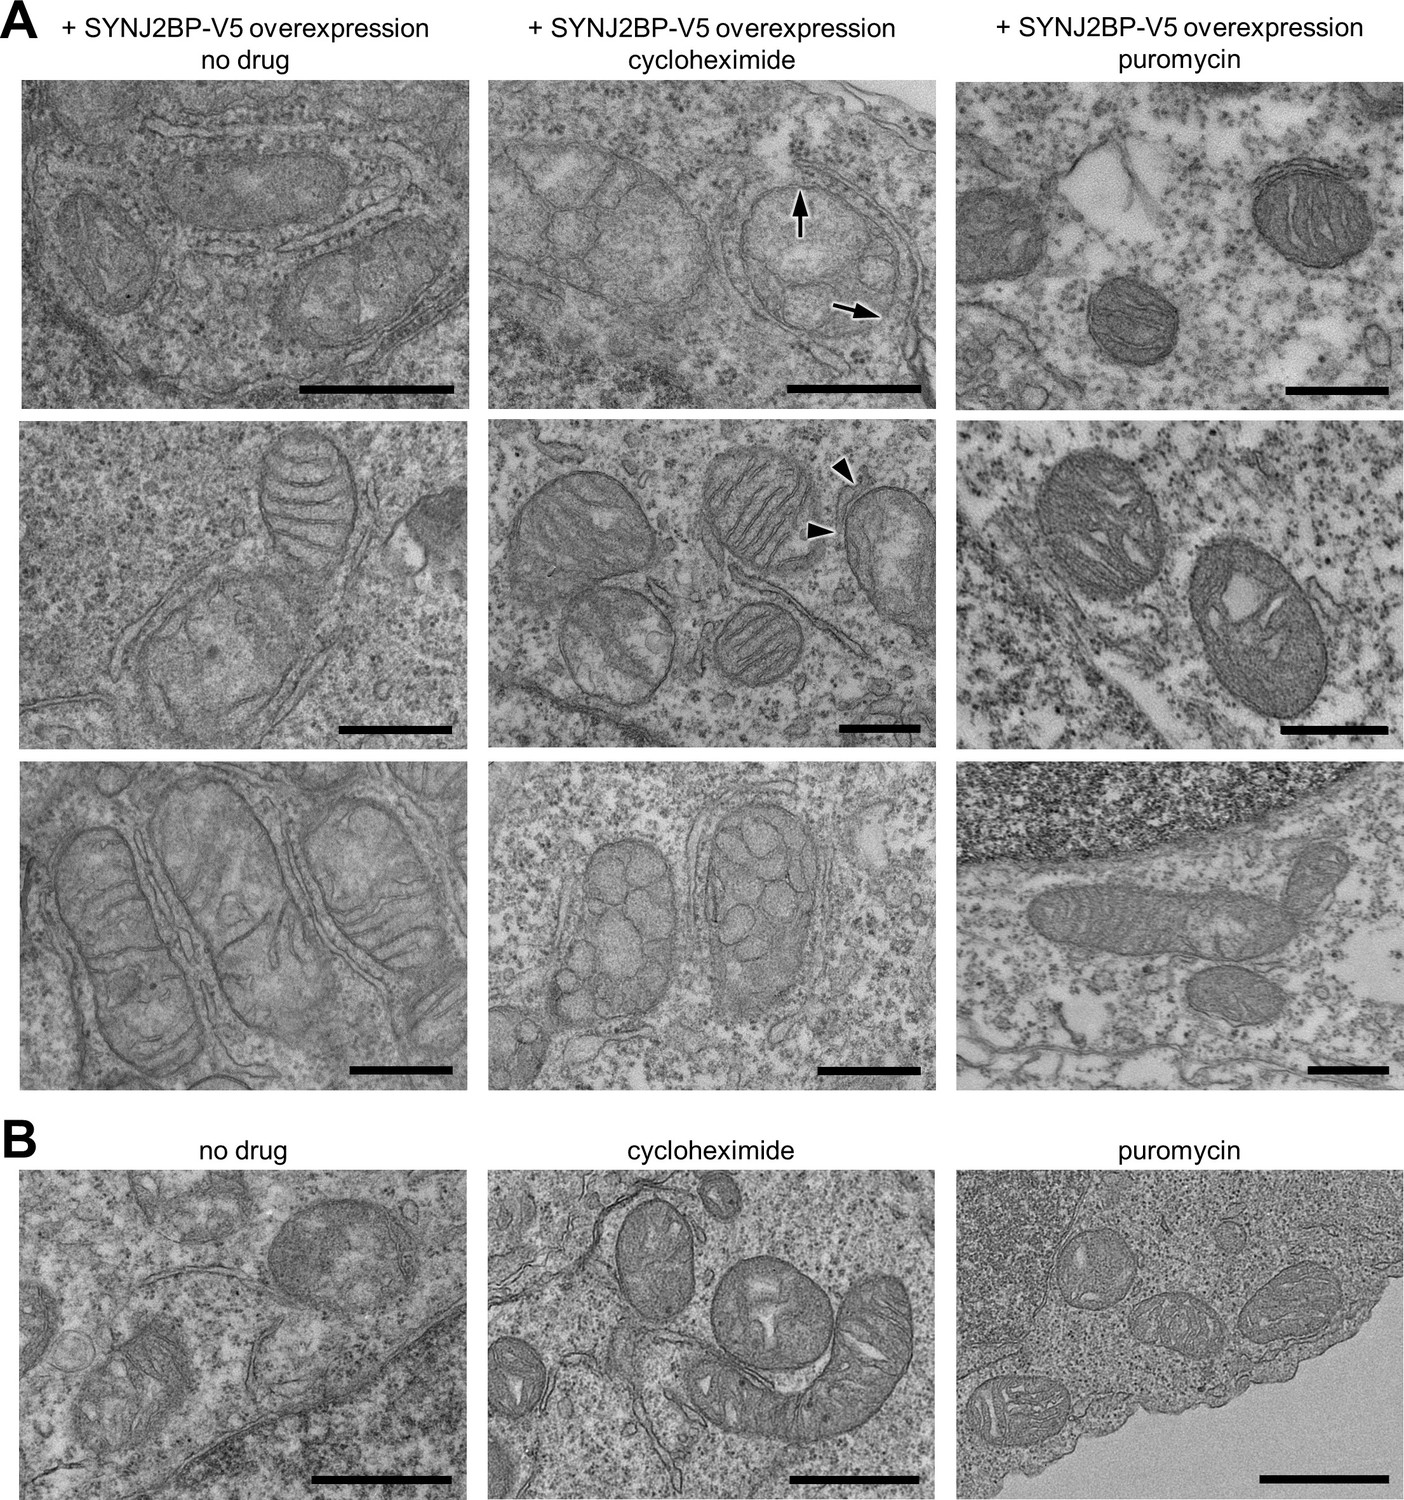
(A) Additional electron microscopy images of the samples from Figure 4C. Arrows denote the start and end of a mitochondria-rough ER contact. Arrowheads denote the start and end of a mitochondria-smooth ER contact. Scale bars, 500 nm. (B) EM of wild-type cells treated with protein translation inhibitors. Wild-type HEK 293T cells were transfected with V5-APEX2-NLS and treated with cycloheximide, puromycin, or no drug and then fixed and processed for EM as in Figure 4C. Scale bars, 800 nm.
Figure 4—figure supplement 3

Functional characterization of SYNJ2BP and RRBP1 knockout (KO) cells.
(A) Morphology of the mitochondria and ER in SYNJ2BP KO cells by fluorescence microscopy. HeLa cells stably expressing Cas9 were separately transfected with two different gRNAs targeting SYNJ2BP. An untransfected sample was processed in parallel as a negative control. Five days after transfection, cells were incubated for 30 min with MitoTracker Deep Red, fixed, and stained with antibodies against SYNJ2BP and an ER marker, protein disulfide isomerase (PDI). Samples were imaged by confocal microscopy. Scale bars, 10 µm. (B) Morphology of the mitochondria and ER in RRBP1 KO cells by fluorescence microscopy. Selected populations of HeLa cells stably expressing Cas9 and a non-targeted gRNA or one of two different RRBP1 gRNAs were transfected with mCherry-KDEL, a fluorescent ER marker. About 24 hr after transfection, the cells were incubated for 30 min with MitoTracker Deep Red, fixed, stained anti-RRBP1 antibody, and imaged by confocal microscopy. The MitoTracker Deep Red channel is not normalized. Scale bars, 10 µm. (C) Growth curves of HEK 293T SYNJ2BP and RRBP1 KO cell lines. Clonal cell lines of HEK293T with knockouts of SYNJ2BP, RRBP1, or a non-targeted gRNA control were plated in triplicate in matched 96-well plates. At each time point, a plate was removed and processed with the Cell-Titer Glo assay (Promega) to quantify viable cells. Signal from each cell line was normalized to the initial signal at the time of plating. Error bars, one sample standard deviation. (D) Relative cell viability of SYNJ2BP and RRBP1 KO lines cultured in glucose- or galactose-containing media. Cell lines from (C) were plated in triplicate in a 96-well plates. After 24 hr, the media was exchanged into either glucose-containing or galactose-containing media and the cells were cultured for another 72 hr before analysis by Cell-Titer Glo to quantify viable cells. Shown are the normalized signals of viability in glucose relative to viability in galactose. Error bars, one sample standard deviation. (E) Protein synthesis in SYNJ2BP or RRBP1 KO lines. For each clonal HEK 293T cell line expressing a non-targeted gRNA or with knockouts of SYNJ2BP or RRBP1, 10,000 cells were plated in a 96-well plate in triplicate. Two days later, the protein synthesis was measured using the Click-iT assay (Thermo Fisher Scientific). After fixation, all samples were stained with Hoechst 33342 dye to estimate cell numbers and AF488 alkyne to detect L-azidohomoalanine incorporation. Error bars, one sample standard deviation.
Additional files
-
Supplementary file 1
OMM and ERM proteomes.
(a) OMM proteome: 137 proteins enriched by APEX2-OMM after filtering by the log2(H/L) and log2(H/M) SILAC ratios as described in Methods. (b) ERM proteome: 634 proteins enriched by ERM-APEX2 after filtering by the log2(H/L) and log2(H/M) SILAC ratios as described in Methods. Gray shading denotes parent and isoform-specific entries deriving from the same gene. (c) Mitochondrial orphans: List of 22 proteins from the OMM proteome (Supplementary file 1a) without prior mitochondrial annotation as defined in Methods. (d) Secretory pathway orphans: List of 72 proteins from the ERM proteome (Supplementary file 1b) without prior secretory annotation as defined in Methods. Gray shading denotes parent and isoform-specific entries deriving from the same gene. (e) OMMxERM cross list: List of 68 proteins that appear in both the OMM and ERM proteomes. Proteins are ranked by log2(H/M) from Replicate 1 of the OMM proteomic experiment. (f) Proteins comparably labeled by APEX2-OMM and APEX2-NES: List of proteins from the OMM proteomic experiment that pass the log2(H/L) cut-offs but do not pass the log2(H/M) cut-offs. These proteins are strongly biotinylated by both APEX2-OMM and APEX2-NES and could be mitochondria/cytosol dual-localized proteins. (g) Proteins comparably labeled by ERM-APEX2 and APEX2-NES: List of proteins from the ERM proteomic experiment that pass the log2(H/L) cut-offs but do not pass the log2(H/M) cut-offs. These proteins are strongly biotinylated by both ERM-APEX2 and APEX2-NES and could be ERM/cytosol dual-localized proteins. (h) OMM proteomic data: Complete OMM proteomic data. All proteins with two or more quantified, unique peptides in either replicate are shown. (i) ERM proteomic data: Complete ERM proteomic data. All proteins with two or more quantified, unique peptides in either replicate are shown. (j) Column definitions: Definitions of the column headings for Supplementary files 1a–1i.
- https://doi.org/10.7554/eLife.24463.013
-
Supplementary file 2
Analysis of specificity and depth of coverage.
(a) OMM true positive list: 79 established OMM-localized proteins used for calculation of OMM proteome coverage. Literature citation is provided for each entry. (b) ERM true positive list: 90 established ERM-localized proteins used for calculation of ERM proteome coverage. Literature citation is provided for each entry. (c) Sub-mitochondrial analysis: The sub-annotation of the set of proteins from the human proteome containing GO terms GO:0005741 for OMM, GO:0005758 for IMS, GO:0005743 for IMM, and GO:0005759 for mitochondrial matrix. Any protein with more than one sub-mitochondrial annotation was assigned to one compartment only according to this priority: OMM>IMS>IMM>mitochondrial matrix. Proteins detected in the OMM proteome are indicated in column I. (d) Sub-secretory analysis: The sub-annotation of the set of proteins from the human proteome containing GO terms GO:0005783 for endoplasmic reticulum, GO:0005794 for Golgi apparatus, and GO:0005886 for plasma membrane. Any protein with more than one sub-secretory annotation was assigned to one compartment only according to this priority: endoplasmic reticulum>Golgi apparatus>plasma membrane. Proteins detected in the ERM proteome are indicated in column H. (e) Soluble ER proteins: A list consisting of 132 proteins to check if ERM-APEX2 enriched any soluble ER lumen proteins. To generate this list, we searched for human proteins annotated with the GO term GO:0005788 for ‘endoplasmic reticulum lumen’ that also lack predicted transmembrane domains according to TMHMM and UniProt. Our ERM proteome contains 13 proteins, which are indicated in column E. (f) Cytosolic proteins: The set of proteins from the human proteome annotated with the GO term GO:0005829 for ‘cytosol’ that lack annotated or predicted transmembrane domains according to UniProt or TMHMM. Proteins detected in the ERM proteome are indicated in column E. (g) Column definitions: Definitions of the column headings for Supplementary files 2a–2f.
- https://doi.org/10.7554/eLife.24463.014
-
Supplementary file 3
Identification of SYNJ2BP binding partners.
(a) SYNJ2BP-V5 IP-MS: Enriched proteins identified by mass spectrometry following immunoprecipitation of SYNJ2BP-V5 expressed in HeLa cells. The 56 listed proteins had two or more quantified, unique peptides; two or more 116/114 and 117/115 iTRAQ ratios; and Benjamini-Hochberg adjusted p-values<0.02 (moderated t-test). In addition, both the log2(116/114) and log2(117/115) values were >0. The 116/114 ratio reflects enrichment in the experimental sample compared to a negative control expressing a gRNA that does not target anything in the mammalian genome. The 117/115 ratio reflects enrichment in the experimental sample compared to a negative control in which endogenous SYNJBP was knocked down, and SYNJ2BP-V5 was not expressed. (b) SYNJ2BP-V5 IP-MS data: Complete SYNJ2BP-V5 IP-MS data. All proteins with two or more quantified, unique peptides and two or more 116/114 and 117/115 iTRAQ ratios are shown. (c) Column definitions: Definitions of the column headings for Supplementary files 3a–3b.
- https://doi.org/10.7554/eLife.24463.015
Download links
A two-part list of links to download the article, or parts of the article, in various formats.
Downloads (link to download the article as PDF)
Open citations (links to open the citations from this article in various online reference manager services)
Cite this article (links to download the citations from this article in formats compatible with various reference manager tools)
Proteomic mapping of cytosol-facing outer mitochondrial and ER membranes in living human cells by proximity biotinylation
eLife 6:e24463.
https://doi.org/10.7554/eLife.24463


