Inhibition of DYRK1A disrupts neural lineage specificationin human pluripotent stem cells
- University of Melbourne, Australia
- University of Queensland, Australia
- Monash University, Australia
- The Royal Children’s Hospital, Australia
- Florey Neuroscience and Mental Health Institute, Australia
Figures
Figure 1 with 1 supplement
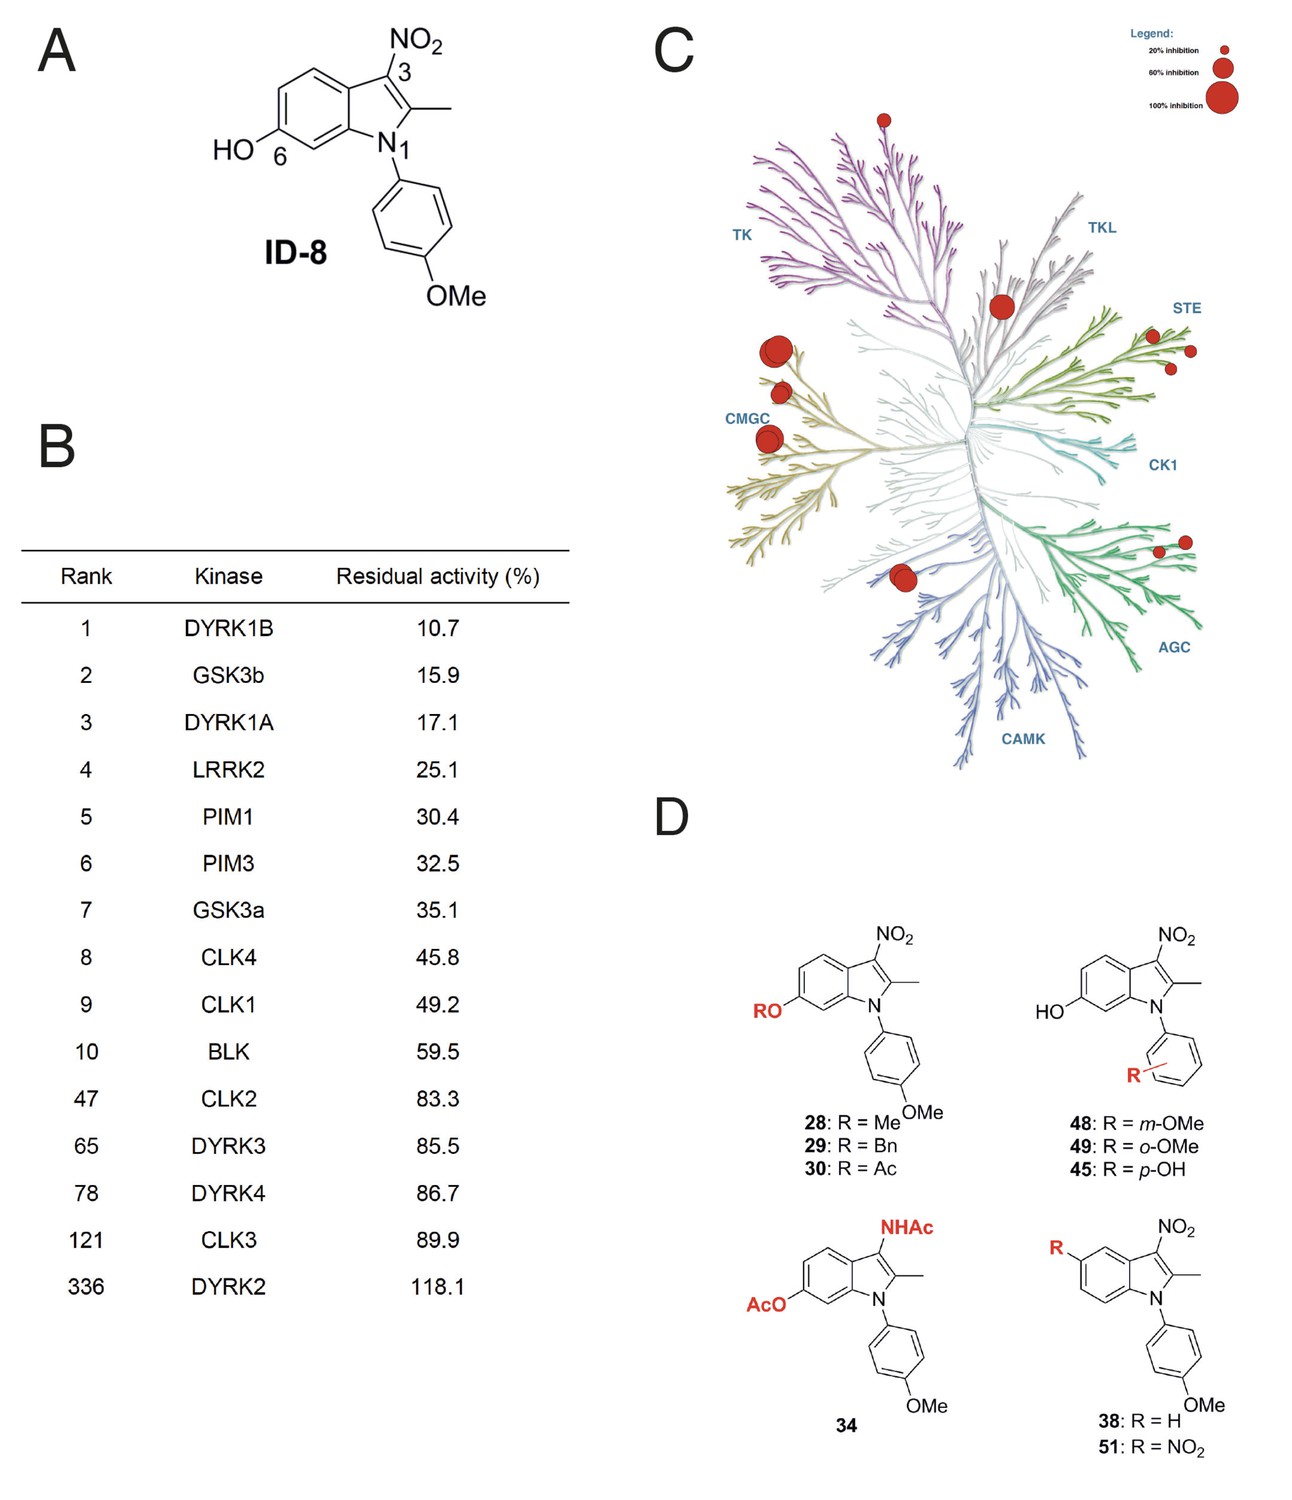
Protein kinase inhibition by ID-8.
(A) ID-8 structure. (B) top kinase targets of ID-8 by degree of inhibition at 10 μm, and inhibition of other CMGC group members. (C) kinome tree illustrating the extent of protein kinase inhibition in six families of protein kinases. Illustration reproduced courtesy of Cell Signalling Technology, Inc. (www.cellsignal.com). (D) Structures of indole compounds related to ID-8.
Figure 1—figure supplement 1
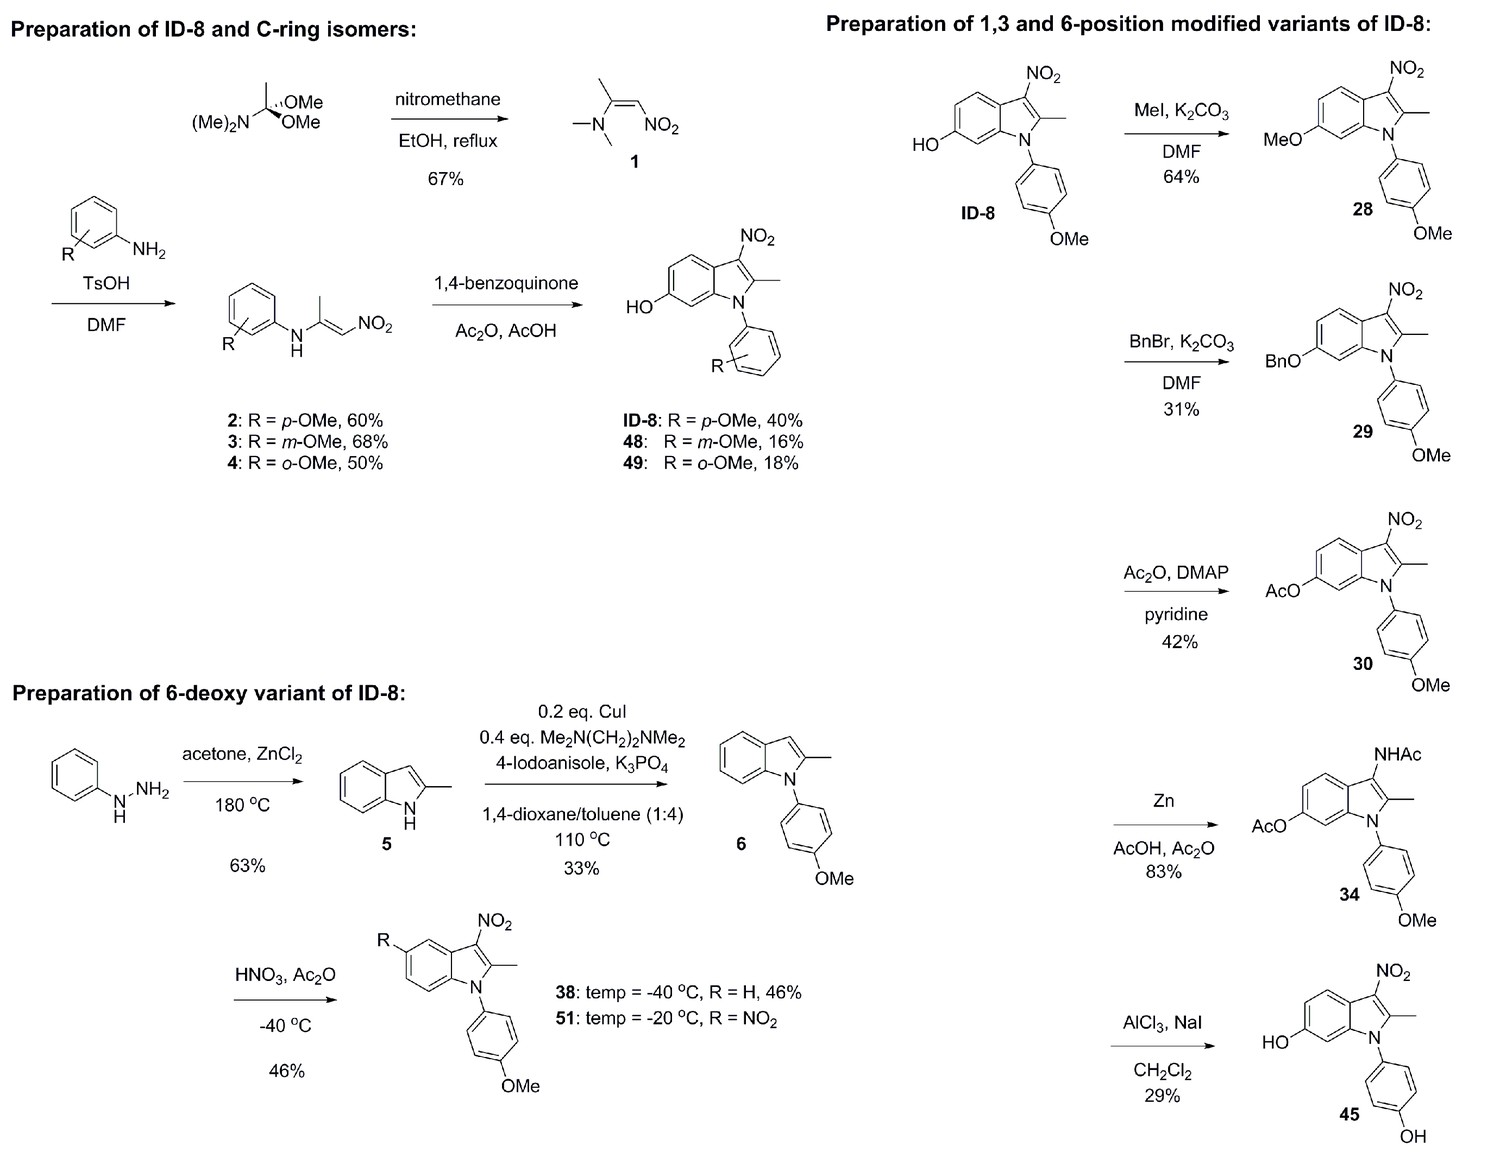
Schematic illustration of chemical syntheses of ID-8 analogues.
https://doi.org/10.7554/eLife.24502.003
Figure 2 with 2 supplements
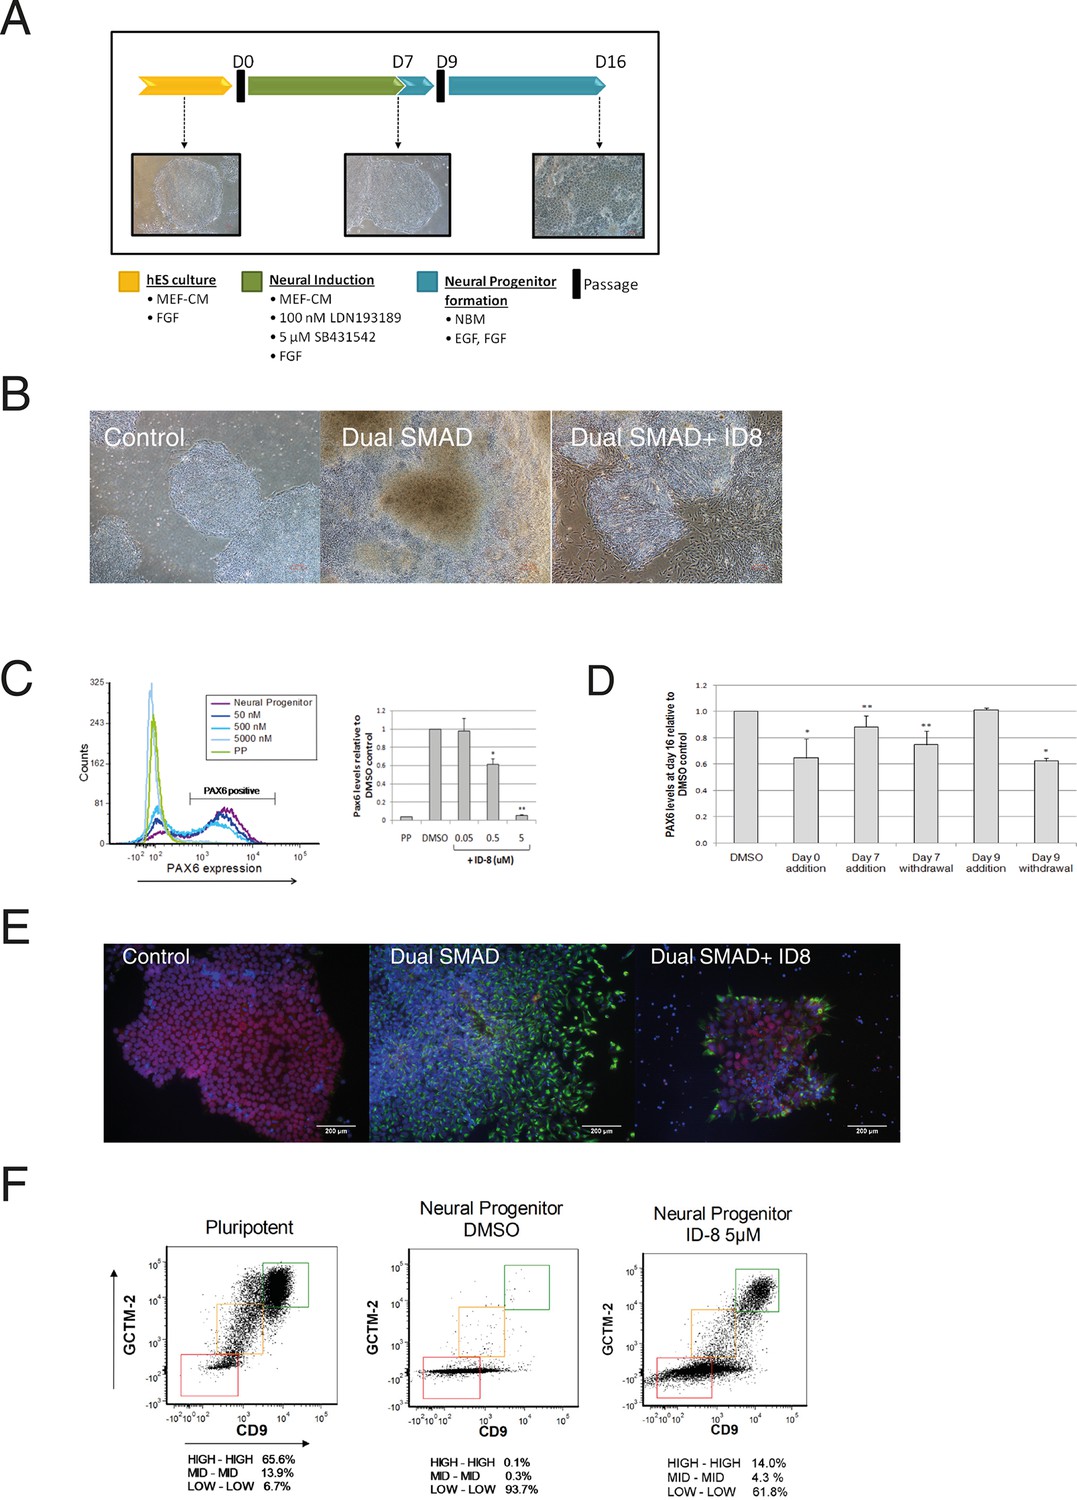
Inhibition of neural specification of hESC by ID-8.
(A) design of time course experiments. Dual SMAD inhibitor induction was carried out from Day 0–7 and cells were assayed for PAX6 expression on Day 16; ID-8 was added from Day 0–16, Day 0–7, Day 0–9, or Day 9–16. (B) phase contrast micrographs showing morphology of control hESC, neural progenitors induced by dual SMAD inhibition, and neural progenitors incubated with 0.5 µM ID-8 throughout the neural induction protocol, on Day 16. (C) dose response study of the inhibition of induction of PAX 6 positive cells by ID-8 showing flow cytometry profile (left panel) and percentage of PAX6 positive cells (right panel). Error bars, SD; *p<0.05, **p<0.0.01. (D) effect of timing of ID-8 exposure at 0.5 µM on inhibition of PAX6 induction. Error bars, SD; **p<0.05, *p<0.0.01. (E) indirect immunofluorescence analysis of NESTIN (green) and POU5F1 expression (red) in control hESC, neural progenitors, and cultures subjected to neural induction in the presence of 5.0 µM ID-8. Nuclear counterstain, dark blue. (F) flow cytometry profiles showing expression of stem cell surface molecules GCMT-2 and CD9 in control cells, neural progenitors and cultures subjected to neural induction in the presence of 5.0 µM ID-8. A-D, studies carried out with HES3 (PAX6mCherry) cell line; E-F, WA09 hESC.
Figure 2—figure supplement 1
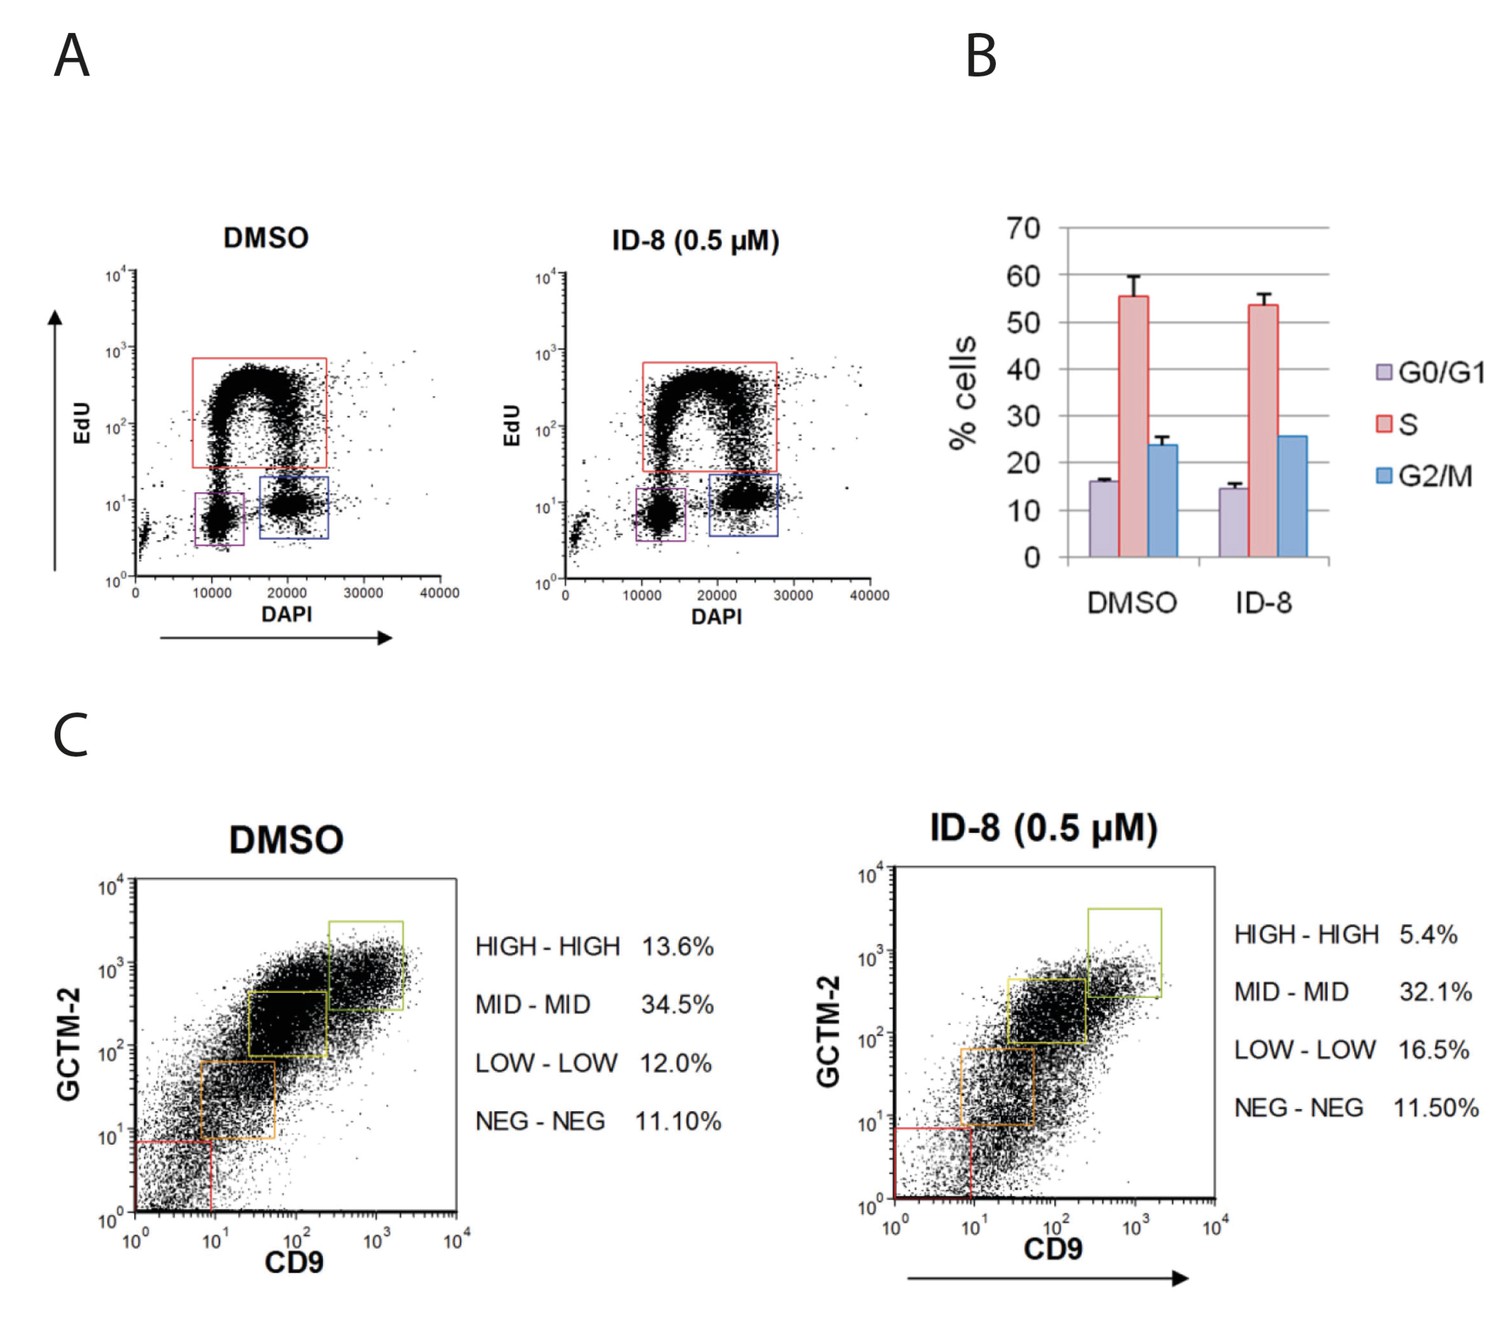
ID-8 treatment does not interfere with hESC proliferation or alter expression of stem cell markers under conditions that promote self-renewal.
(A) flow cytometry profiles of control and ID-8 treated cells following incubation with a pulse of Edu. (B) proportion of cells in GO/G1, S, and G2/M phases in control or ID-8 treated cultures; (C) ID-8 treatment does not alter proportion of cells bearing hESC stem cell surface markers. Dual label flow cytometry profiles for stem cell antigens GCTM-2 and CD9 in control and. ID-8 treated cells.
Figure 2—figure supplement 2
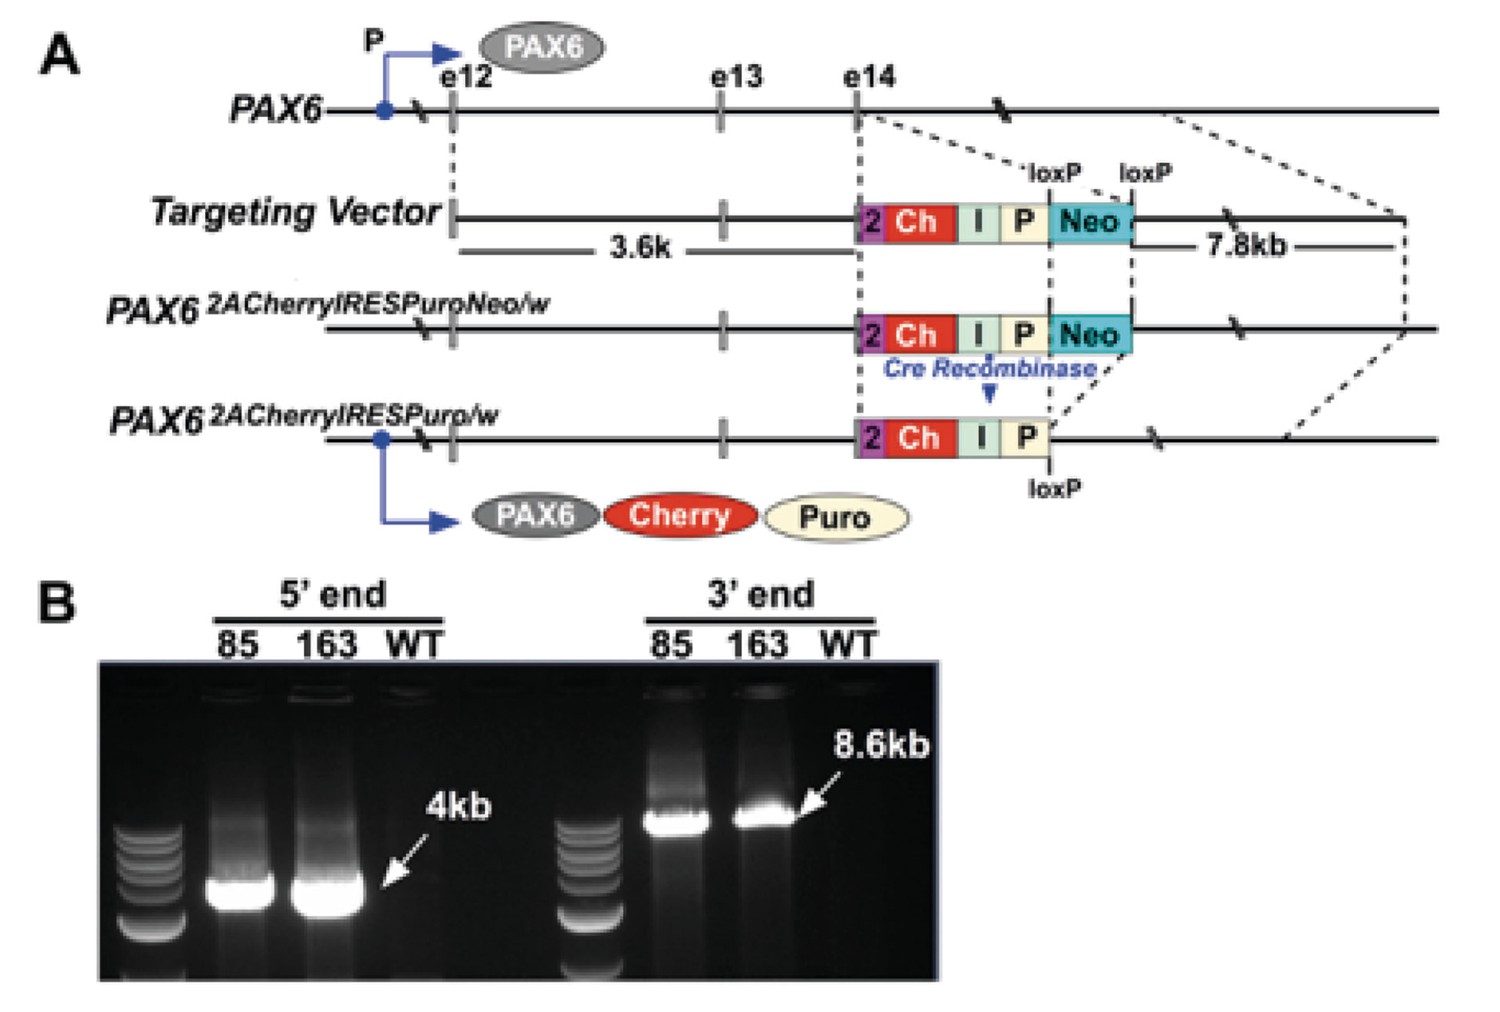
Targeting of the PAX6 gene with an mCherry-Ires-Puro reporter cassette.
(A) Structure of the PAX6 targeting vector. The upper line shows the endogenous PAX6 gene with exons (and exon number, e12, e13, e14) indicated by grey boxes. The second line shows the targeting vector with its constituent components, from left to right, the 5’ homology arm, a T2A sequence (2), mCherry (Ch), IRES (I), puromycin resistance gene (P), a loxP flanked PGKNeo cassette (Neo) and the 3’ homology arm. The third line shows the structure of the modified PAX6 locus following integration of the targeting vector. The forth line shows the modified PAX6 locus following cre-recombinase mediated removal of the PGKNeo selection cassette. The protein products predicted to be translated from this locus, PAX6, mCherry and Puromycin resistance, are shown underneath. (B) PCR analysis confirming correct integration of the targeting vector in two independent clones (85, 163). Note these PCR products of the correct size were not generated when wild type (wt) was used as a template.
Figure 3
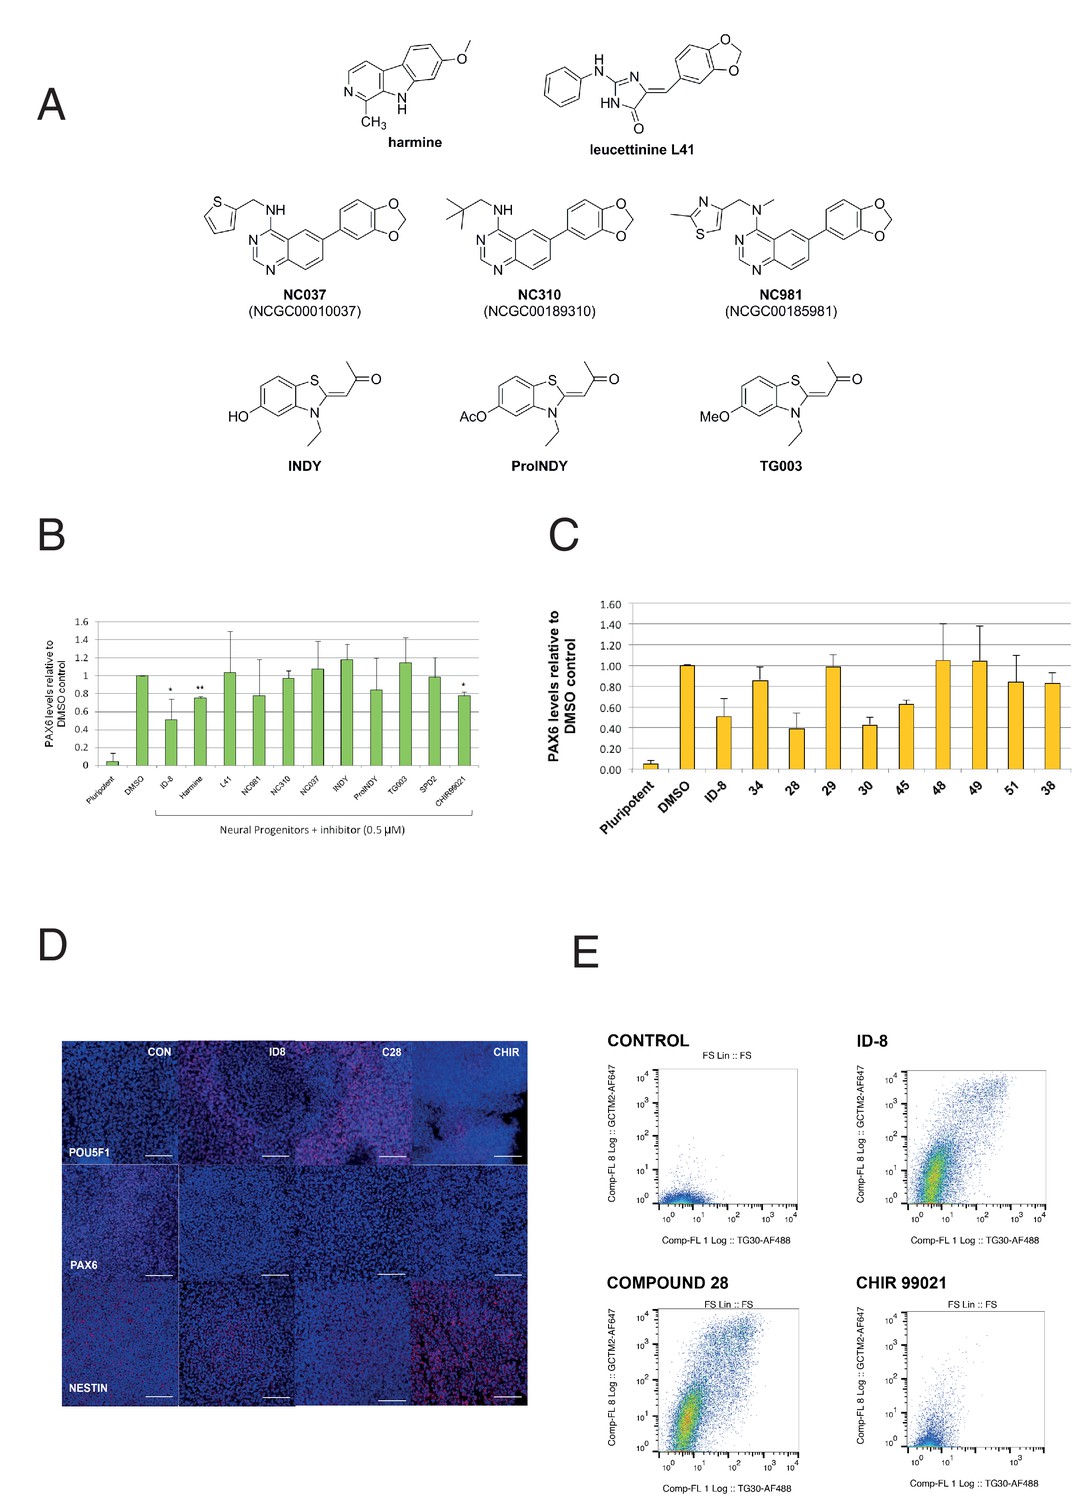
Effect of known DYRK1A and GSK3ß inhibitors and ID-8 analogues on induction of PAX6 positive cells by dual SMAD inhibition.
(A) structures of known DYRK1A inhibitors studied. (B) percentage of PAX6 positive cells present at Day 16 in cultures of pluripotent cells, cultures of neural progenitors induced by dual SMAD inhibition (DMSO), and cultures subjected to neural induction in the presence of DYRK1A inhibitors at a dose of 0.5 µM. Error bars, SD; **p<0.05, *p<0.0.01. (C) percentage of PAX6 positive cells present at Day 16 in cultures of pluripotent cells, cultures of neural progenitors induced by dual SMAD inhibition (DMSO), or cultures subjected to neural induction in the presence of ID-8 analogues. All compounds were tested at 0.5 µM. Error bars, SD; **p<0.05, *p<0.0.01. (D) indirect immunofluorescence micrographs showing stem cell cultures subjected to dual SMAD inhibition alone or in combination with 5.0 µM ID-8, 5.0 µM compound 28, or 3.0 µM CHIR 99021 and stained with antibodies to POU5F1, PAX6 or NESTIN (all red) and DAPI nuclear counterstain (dark blue). (E) flow cytometry analyses of stem cell surface marker (GCTM-2 antigen and TG30 anti-CD9 antibody) expression in cultures subjected to dual SMAD inhibition alone or in combination with 5.0 µM ID-8, 5.0 µM compound 28, or 3.0 µM CHIR 99021. B and C, studies carried out with HES3 (PAX6mCherry) cell line; D-E, WA09.
Figure 4 with 1 supplement
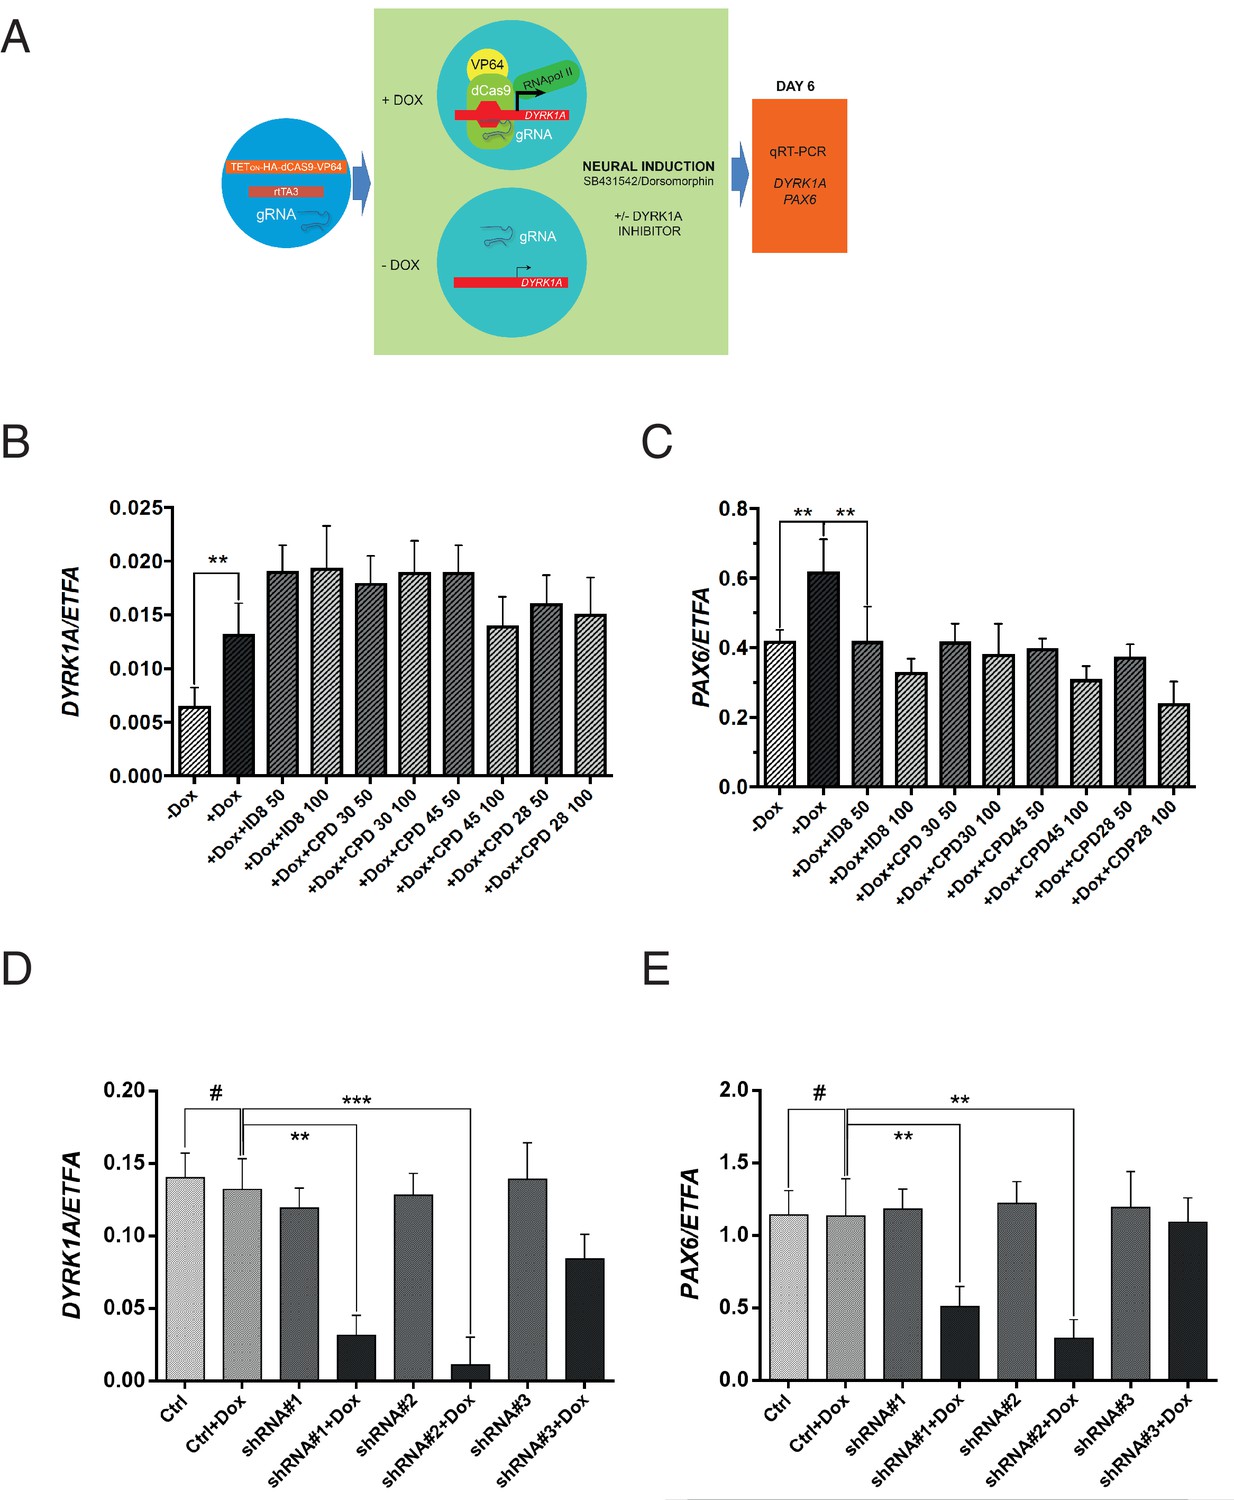
Effects of CRISPR activation and inducible knockdown of DYRK1A on PAX6 expression during neural specification by dual SMAD induction.
(A) design of experiment to induce DYRK1A; (B) DYRK1A transcript levels following CRISPR activation in control cells or in presence of ID-8, or compounds 28, 30, or 45. Error bars, SD; **p<0.05. (C) PAX6 transcripts following DYRK1A activation in control cells or cells treated with inhibitors at 50 or 100 nM. Error bars, SD; **p<0.05; all compounds produced significant reductions at all doses at p<0.05. (D) inducible shRNA knockdown of DYRK1A in WA09 hPSC. (E) effect of DYRK1A knockdown on PAX6 transcript levels following dual SMAD induction of neural specification. Result of triplicate experiments shown, mean ±SEM, **p<0.01, ***p<0.001. Studies in A and B were carried out with derivatives of hESC line WA09, those in C and D utilised derivatives of Genea022.
Figure 4—figure supplement 1
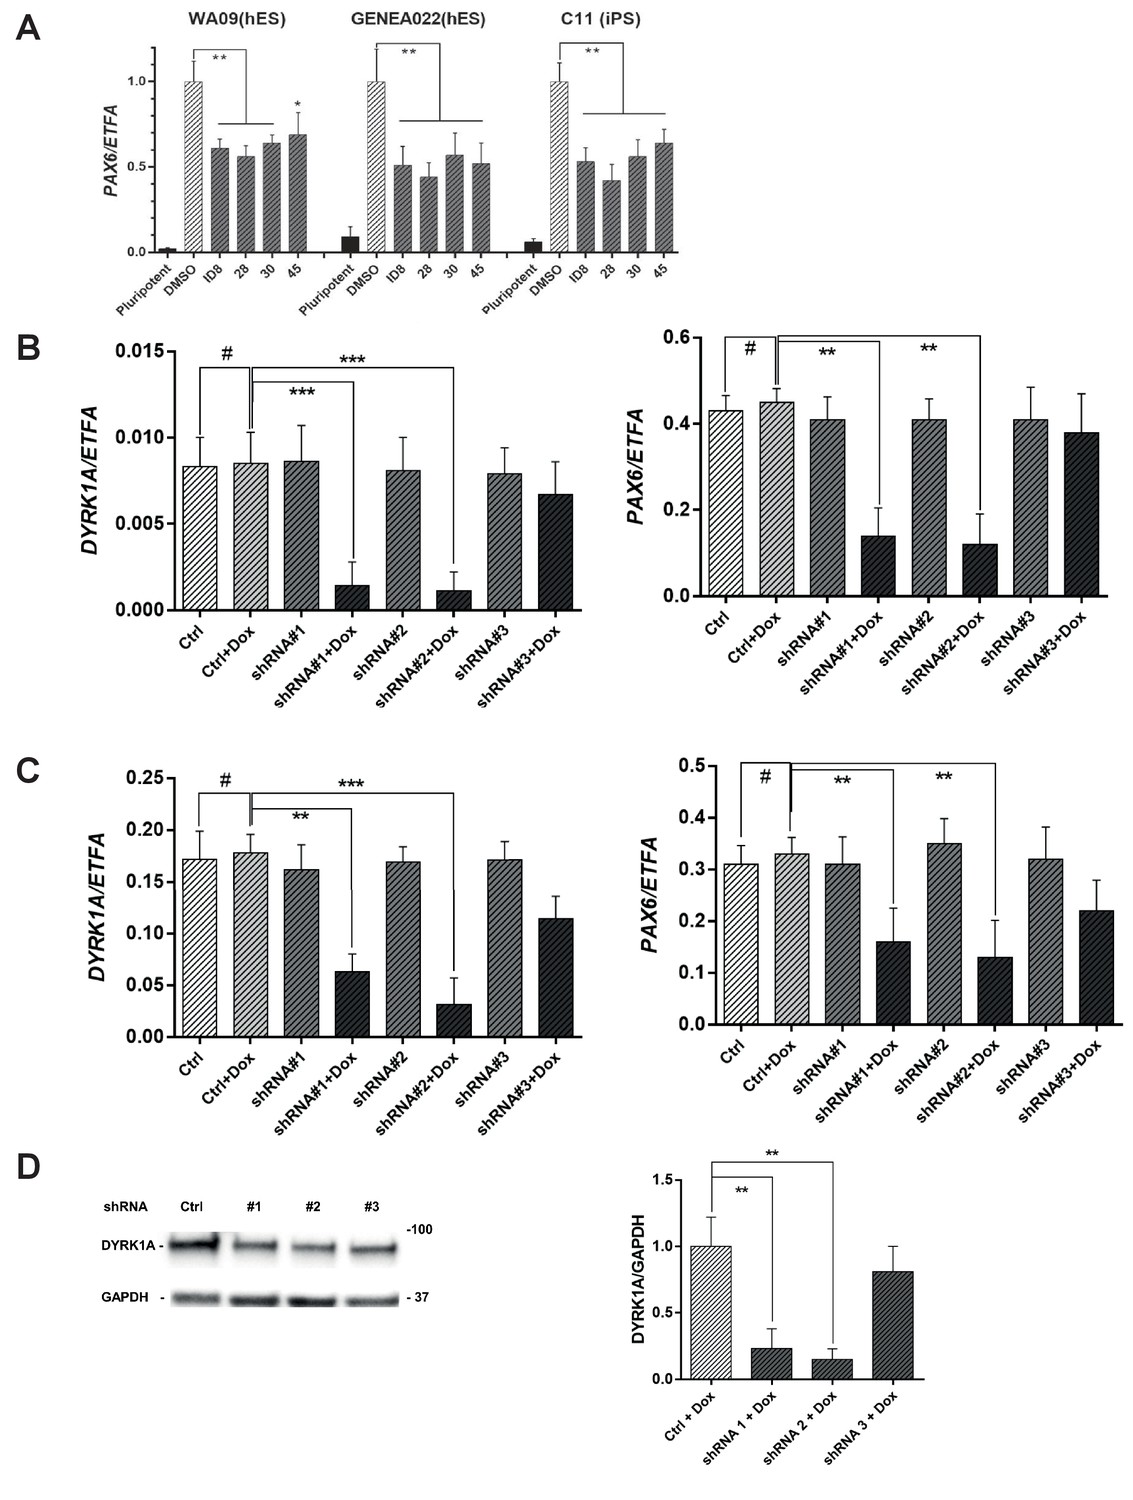
Inhibition of PAX6 induction after dual SMAD inhibitor treatment by DYRK1A inhibitors or inducible DYRK1A shRNA in hESC and hiPSC cell lines.
(A) effect of DYRK1A inhibitors on induction of PAX6 expression following dual SMAD induction of neural specification in WA09, GENEA022, and C11 pluripotent stem cells. (B) effect of DYRK1A shRNA treatment on DYRK1A and PAX6 mRNA levels in GENEA022 hESC line; (C) effect of DYRK1A shRNA treatment on DYRK1A and PAX6 mRNA levels in C11 hiPSC line; (D) effect of DYRK1A knockdown on DYRK1A protein levels relative to that of GAPDH showing immunoblot (left) and results of densitometry analysis (right). A, B, and C show transcript levels relative to those of EFTA. *p<0.05; **p<0.01, ***p<0.001, using an unpaired two-tailed t-test with Welch’s correction.
Figure 5 with 1 supplement
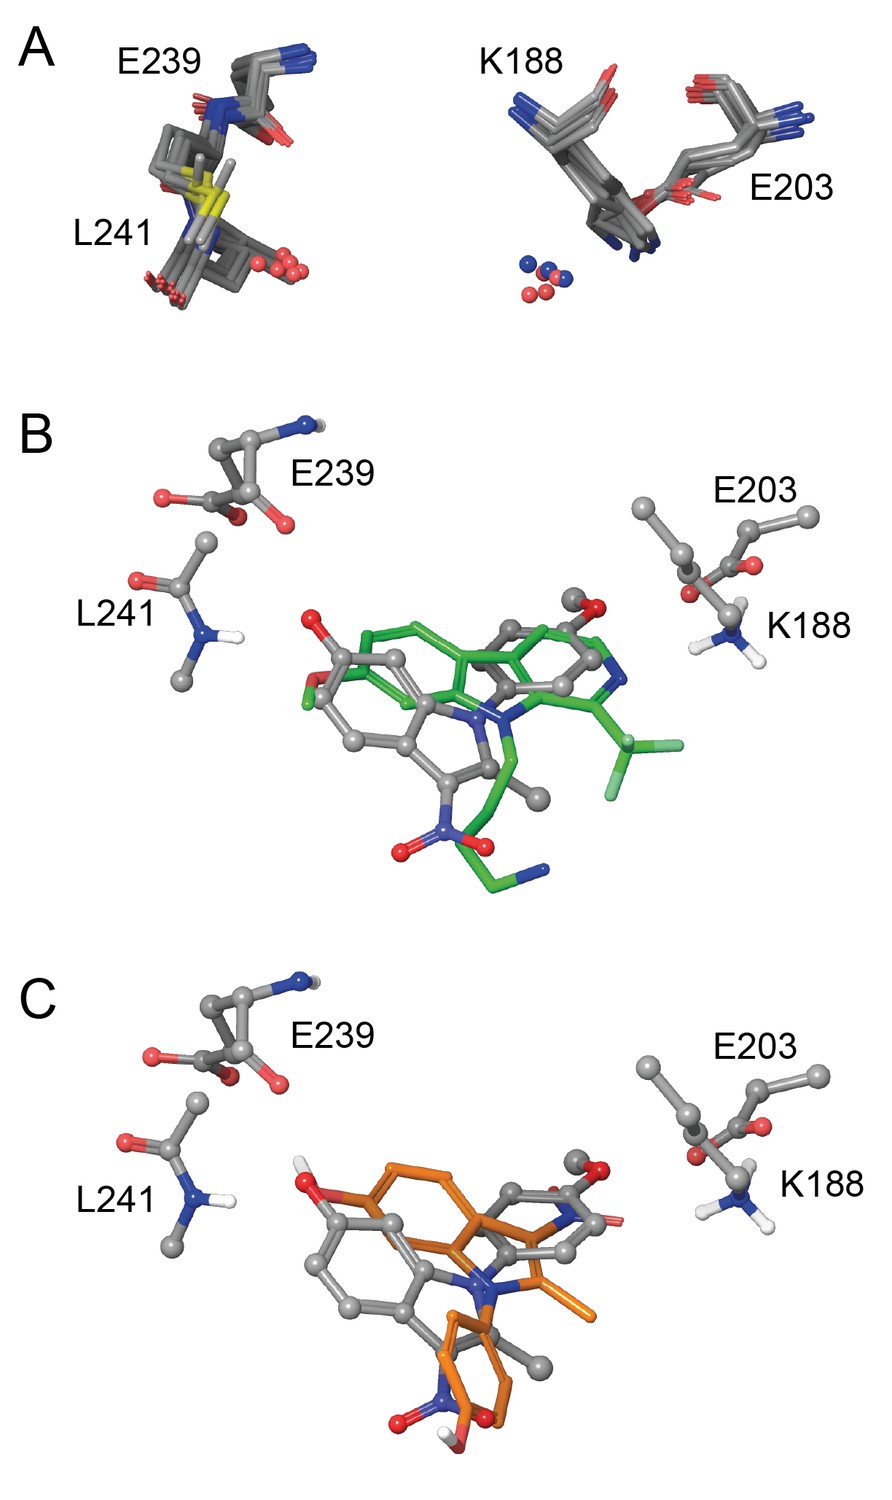
In silico modelling of binding of ID-8 and compound 45 to DYRK1A.
(A) Overlay of seven ligand-bound X-ray structures of ligand-bound complexes of DYRK1A showing similar positioning of active site residues K188, E203, E239 and L241 (PDB codes: 5AIK, 3ANQ, 3ANR, 4YU2, 4MQ1, MQ2 and 4AZE). (B) Overlay of the docked pose of ID-8 (grey) with the experimentally-determined pose of LDN-211898 (green) with DYRK1A derived from the 5AIK structure. (C) Overlay of docked poses of ID-8 (grey) and compound 45 (orange). Maestro (version 2015–3) was used to dock ligands into 5AIK using the XP algorithm and the default settings were applied.
Figure 5—figure supplement 1
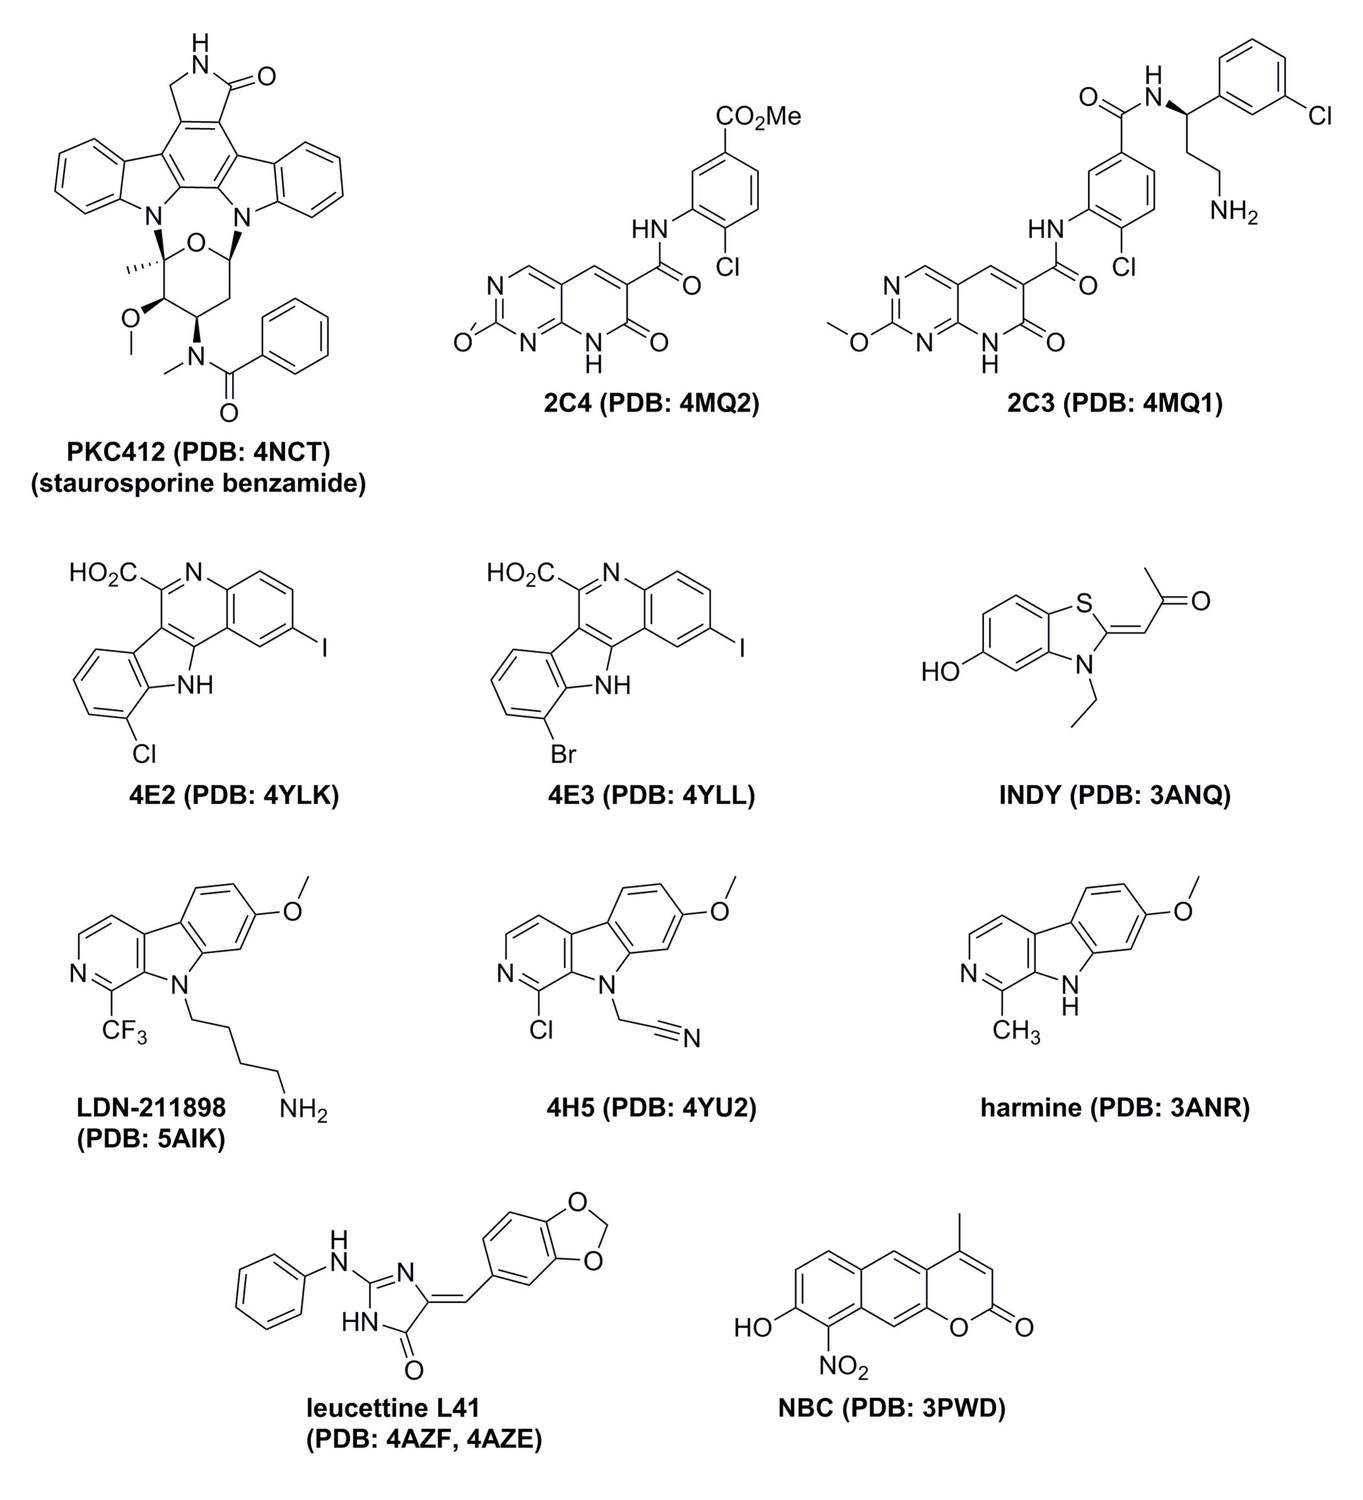
Summary of X-ray structures of DYRK1A and ligands bound.
The information in parentheses is the PDB code for the relevant structure.
Tables
Table 1
IC50 values for ID-8 against a selection of kinases.
Ranks are given based on the original screening data presented in Figure 1B and Supplementary file 1. NC = an IC50 value could not be calculated.
| Rank | Kinase | IC50 (nM) |
|---|---|---|
| 1 | DYRK1B | 54 |
| 3 | DYRK1A | 78 |
| 5 | PIM1 | 280 |
| 7 | GSK3a | 380 |
| 8 | CLK4 | 440 |
| 2 | GSK3b | 450 |
| 9 | CLK1 | 4200 |
| 47 | CLK2 | NC |
| 65 | DYRK3 | NC |
| 78 | DYRK4 | NC |
| 121 | CLK3 | NC |
Table 2
Activity of novel indole compounds against DYRK1A and related kinases relative to ID-8.
https://doi.org/10.7554/eLife.24502.005| Compound | R1 | R2 | R3 | IC50 (μM) | |||||||||
|---|---|---|---|---|---|---|---|---|---|---|---|---|---|
| DYRK1A | DYRK1B | DYRK2 | CLK1 | CLK4 | GSK3α | GSK3β | LRRK2 | PIM1 | PIM3 | ||||
| ID-8 | 6-OH | NO2 | p-OCH3 | 0.104 | 0.040 | NC | 1.37 | 1.05 | 0.428 | 0.153 | 0.100 | 0.376 | 0.176 |
| 34 | 6-OCOCH3 | NHCOCH3 | p-OCH3 | NC | NC | NC | NC | NC | NC | NC | NC | NC | NC |
| 28 | 6-OCH3 | NO2 | p-OCH3 | 0.346 | 0.695 | NC | NC | 2.23 | 2.36 | 3.44 | 0.854 | 0.176 | 0.259 |
| 29 | 6-OCH2C6H5 | NO2 | p-OCH3 | 6.52 | 3.57 | NC | NC | NC | 18.0 | 14.3 | 8.16 | 18.5 | 8.28 |
| 30 | 6-OCOCH3 | NO2 | p-OCH3 | 0.680 | 0.299 | NC | NC | 11.95 | 22.15 | 1.71 | 0.891 | 4.15 | 1.21 |
| 45 | 6-OH | NO2 | p-OH | 0.122 | 0.060 | 2.30 | 0.364 | 0.163 | 0.375 | 0.233 | 0.046 | 0.243 | 0.180 |
| 48 | 6-OH | NO2 | m-OCH3 | 0.594 | 0.257 | NC | 13.0 | 4.77 | 2.32 | 0.692 | 2.17 | 0.654 | 0.593 |
| 49 | 6-OH | NO2 | o-OCH3 | 0.829 | 0.341 | 41.9 | 10.7 | 8.59 | 6.12 | 3.82 | 1.98 | 1.44 | 0.892 |
| 51 | 5-NO2 | NO2 | p-OCH3 | NC | NC | NC | NC | NC | NC | NC | NC | 7.62 | 4.57 |
| 38 | H | NO2 | p-OCH3 | NC | NC | NC | NC | NC | NC | NC | NC | NC | 20.74 |
Additional files
-
Supplementary file 1
Activity of ID-8 against a range of 338 protein kinases.
Assays were performed as described in Materials and methods. The table shows percentage of activity relative to control at a 10 μM concentration of ID-8, along with IC50 (M) values for positive control compounds.
- https://doi.org/10.7554/eLife.24502.014
-
Supplementary file 2
Chemical syntheses.
The text describes general experimental procedures and details of chemical syntheses and physical properties of the novel compounds used in this study.
- https://doi.org/10.7554/eLife.24502.015
-
Supplementary file 3
Kinase inhibition of ID-8 relative to other known DYRK1A inhibitors.
Table shows IC50 (nM) or percentage inhibition values for compounds against a series of CMGC kinase family members. Values are from this study (ID-8, see Materials and methods) or the literature cited.
- https://doi.org/10.7554/eLife.24502.016
-
Transparent reporting form
- https://doi.org/10.7554/eLife.24502.017
Download links
A two-part list of links to download the article, or parts of the article, in various formats.
Downloads (link to download the article as PDF)
Open citations (links to open the citations from this article in various online reference manager services)
Cite this article (links to download the citations from this article in formats compatible with various reference manager tools)
Inhibition of DYRK1A disrupts neural lineage specificationin human pluripotent stem cells
eLife 6:e24502.
https://doi.org/10.7554/eLife.24502


