The Na+/Ca2+, K+ exchanger NCKX4 is required for efficient cone-mediated vision
- Washington University, United States
- Keck School of Medicine, University of Southern California, United States
- Johns Hopkins University, United States
Figures
Figure 1

NCKX4 is expressed in cone photoreceptors.
In situ hybridization with Nckx4 (Slc24a4) probe demonstrating sparse expression of NCKX4 in the photoreceptor layer of a WT mouse retina (a, arrows) and strong expression of NCKX4 in the photoreceptor layer of an Nrl-/- (‘cone-only’) mouse retina (b). A robust expression of NCKX4 is also evident in the inner nuclear layers of WT and Nrl-/- retinas (a, b). OS, outer segment; IS, inner segment; ONL, outer nuclear layer; OPL, outer plexiform layer; INL, inner nuclear layer. Scale bar = 50 μm.
Figure 2
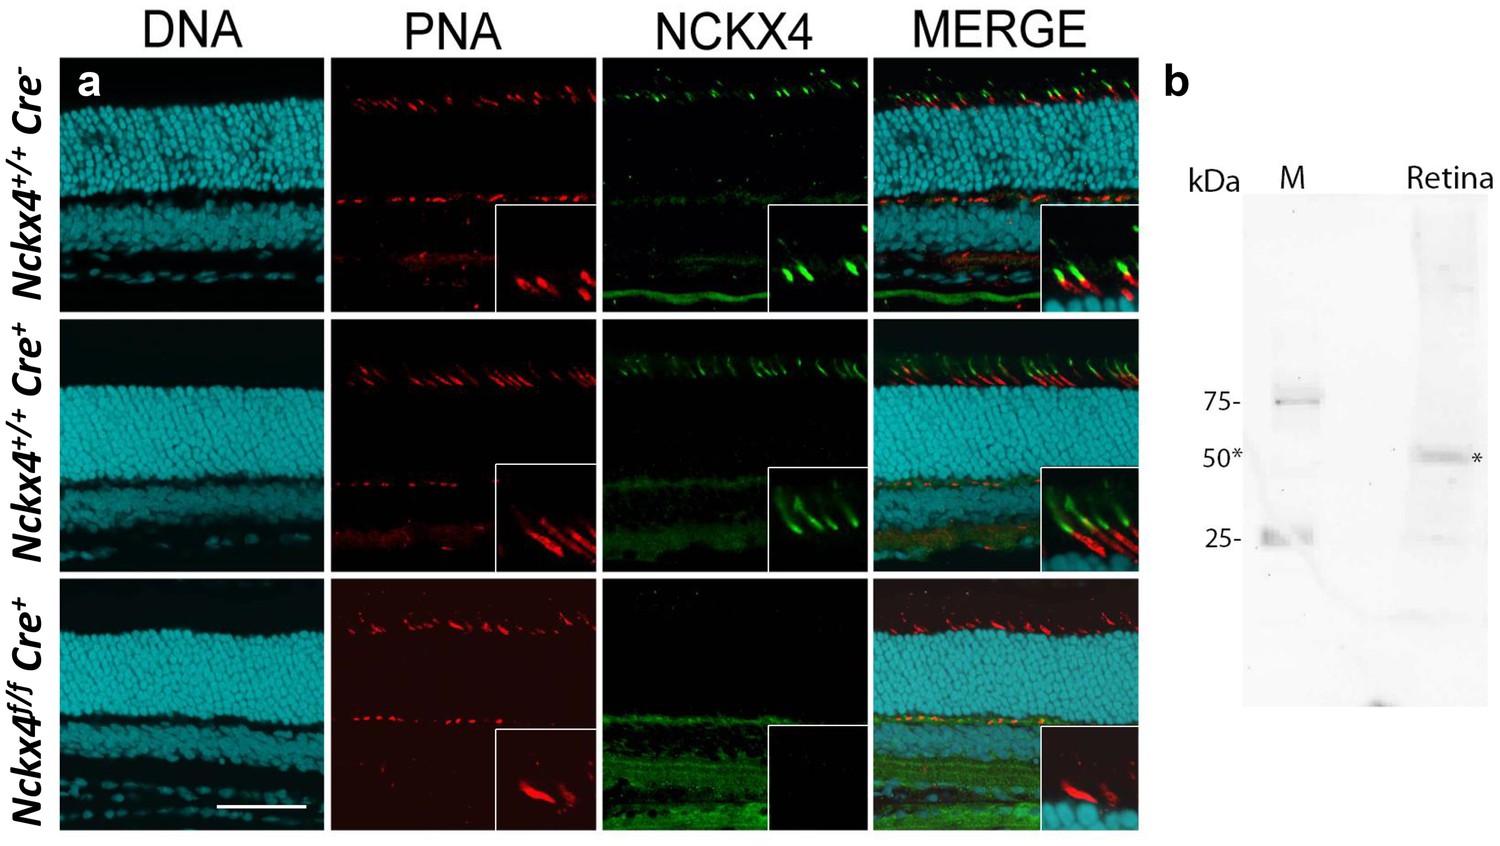
NCKX4 is expressed in the outer segments of cone photoreceptors.
(a) Immunostaining for NCKX4 in vertical sections of mouse retinas (photoreceptors on the top). Nuclei (DNA, cyan), cone photoreceptors (PNA, red), and NCKX4 (green) staining in Cre-negative Nckx4+/+ (top row), Cre-positive control Nckx4+/+ Cre+ (middle row) and Nckx4f/f Cre+ (bottom row) mice. Insets show larger magnification immunostaining for cones in the photoreceptor layer. Scale bar = 50 μm. (b) Western blot of wild-type mouse retinal homogenate revealing a protein band of ~50 kDa (*) consistent with NCKX4.
Figure 3
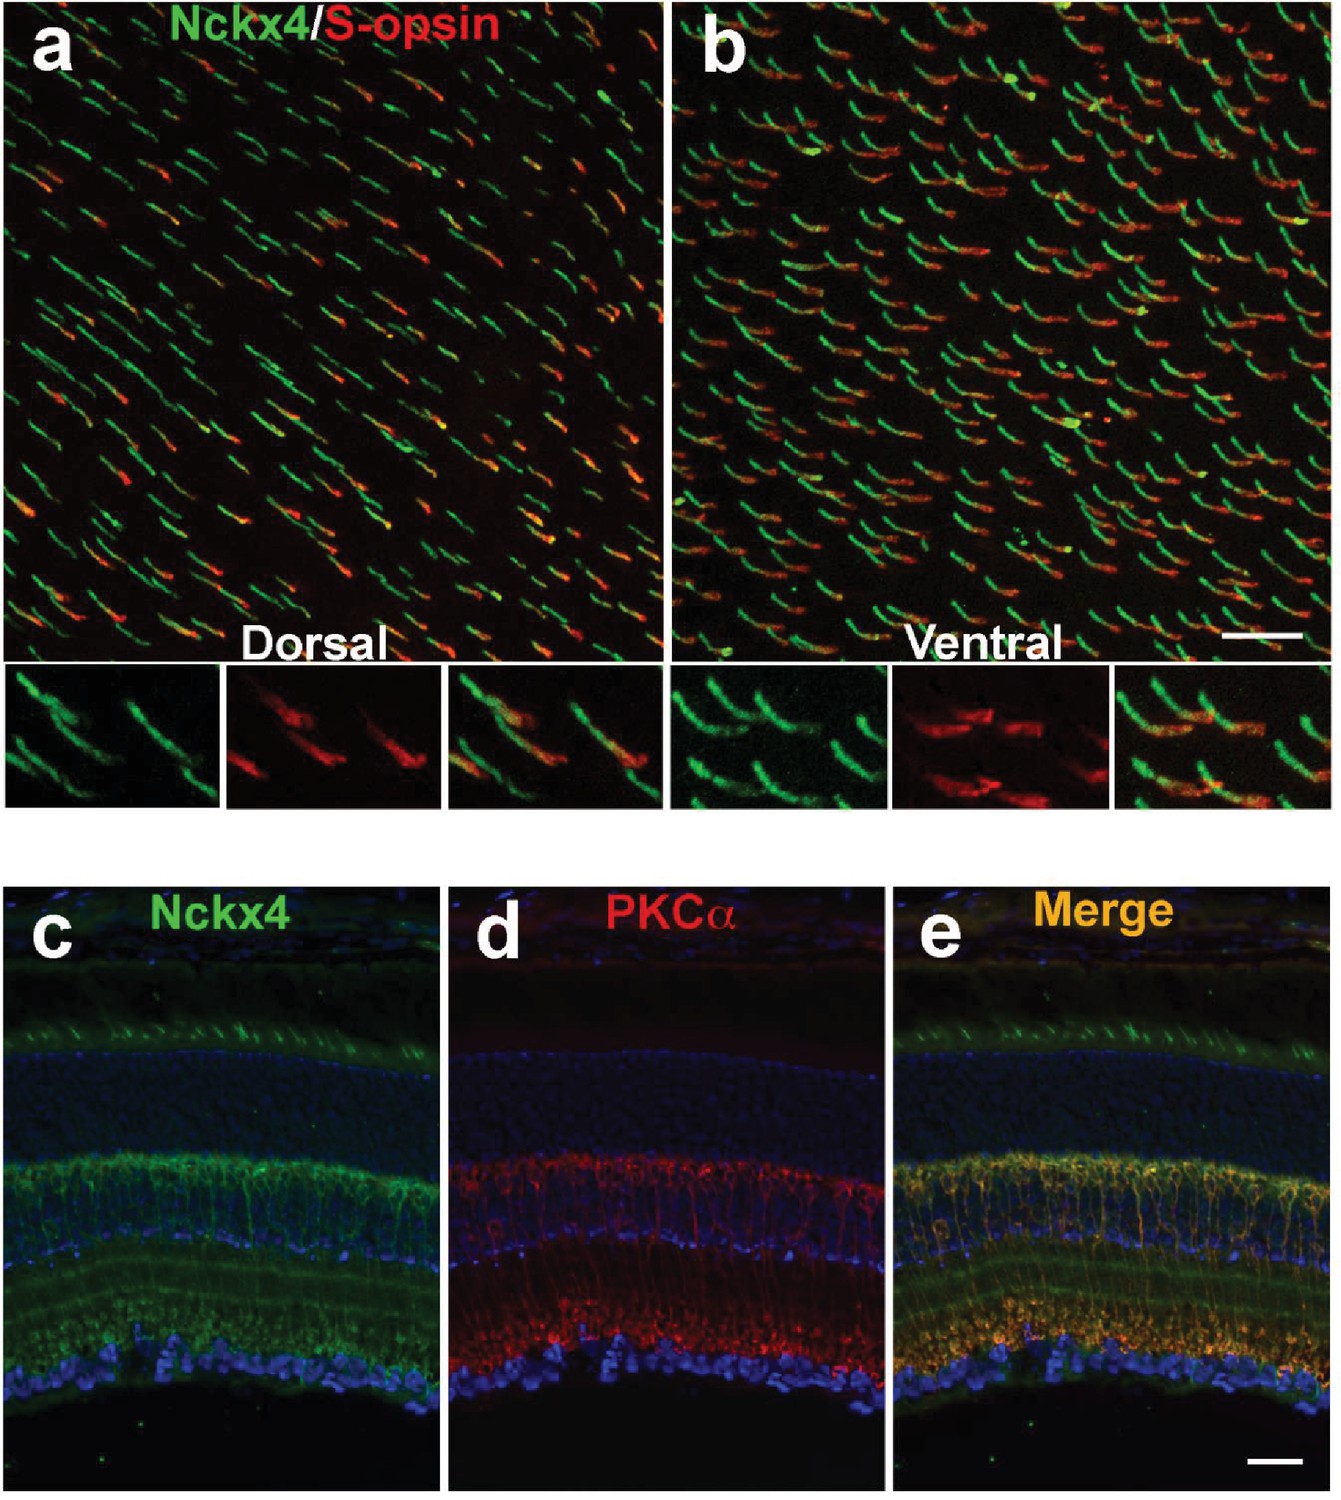
NCKX4 is broadly expressed in cones and in rod bipolar cells.
Immunostaining for NCKX4 (green) and short-wave opsin (S-opsin, red) in flat mounted retinas. In the dorsal region, S-opsin expressing cones were only a fraction of the NCKX4-expressing cones (a) consistent with the low density of S-cones and high density of M-cones in the dorsal mouse retina. In contrast, nearly all NCKX4-expressing cones in the ventral region expressed S-opsin as well (b) A higher magnification of the labeled cones is shown at the bottom of each panel. S opsin staining appeared stronger in the inner segment and tapered off toward the outer segment, whereas NCKX4 labeling appeared uniform in the outer segment. Immunostaining of retinal sections show NCKX4 expression in cells in the inner nuclear layer (c) Staining of the same tissue section with PKCα (d) a rod bipolar cell marker, shows extensive overlap (e) Scale bars = 20 μm.
Figure 4
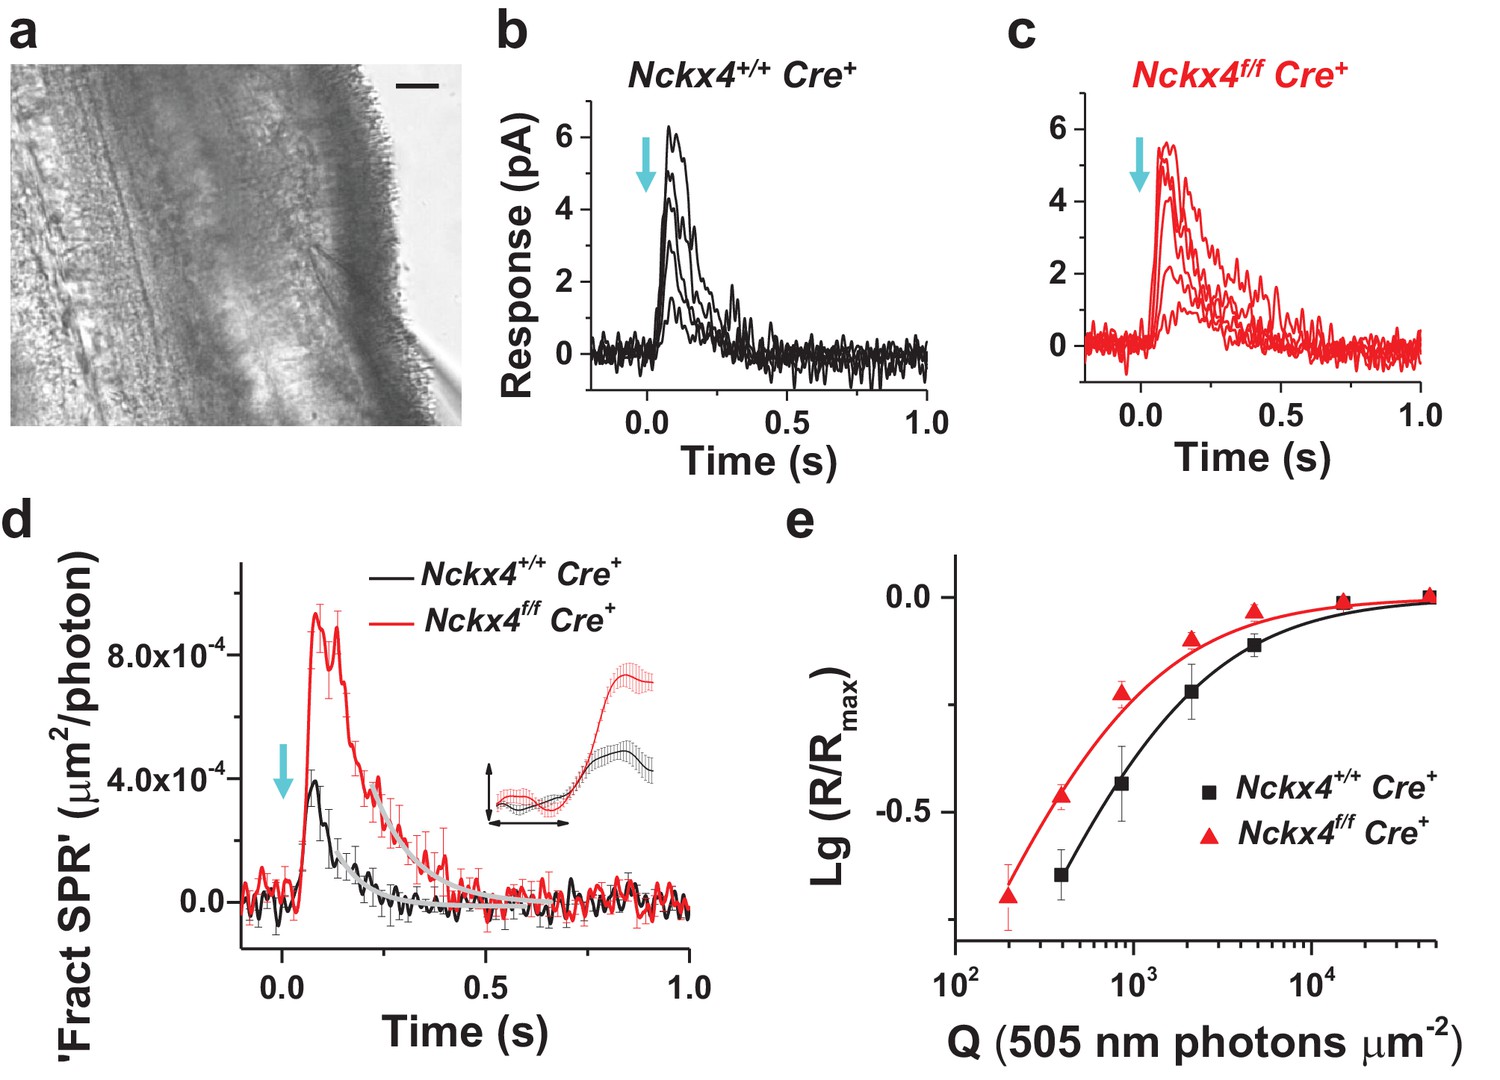
NCKX4 accelerates light response termination and decreases the sensitivity of mouse cones.
(a) Slice preparation under infrared illumination. Photoreceptor outer segments are pointing to the right and the recording glass pipette is visible at the bottom right corner. Scale bar = 20 μm. Representative light responses recorded from a single inner segment of a control Nckx4+/+ Cre+ (b) and Nckx4f/f Cre+ (c) cone. Light flashes (flash length = 1 ms, λ = 505 nm, flash strength Q = 200–46, 100 photons μm−2) were delivered at t = 0 s (arrow). (d) Population averaged (mean ± SEM) responses to a dim flash normalized with Q (in photons μm−2) and maximal response amplitude (Rmax) recorded from Nckx4+/+ Cre+ control (black, Q = 860 photons μm−2, N = 6 cells from two mice) and Nckx4f/f Cre+ (red, Q = 393 photons μm−2, N = 6 cells from three mice) cones. The tail of the responses is fit by a single exponential function (Equation 1) with τ = 75 ms and 106 ms in control and NCKX4-deficient cones, respectively. The inset shows the rising phase of dim flash responses on a finer time scale. The horizontal bar measures 50 ms and the vertical bar is 0.04%. (e) Normalized population averaged response amplitudes (R/Rmax) are plotted as a function of flash strength in photons μm−2 for control (black, N = 6 cells from two animals) and NCKX4-deficient cones (red, N = 6 cells from three animals). Smooth traces plot Equation 3 with Q1/2 = 1390 photons μm−2 and 730 photons μm−2 for control (black) and Nckx4f/f Cre+ (red) cones, respectively.
Figure 5
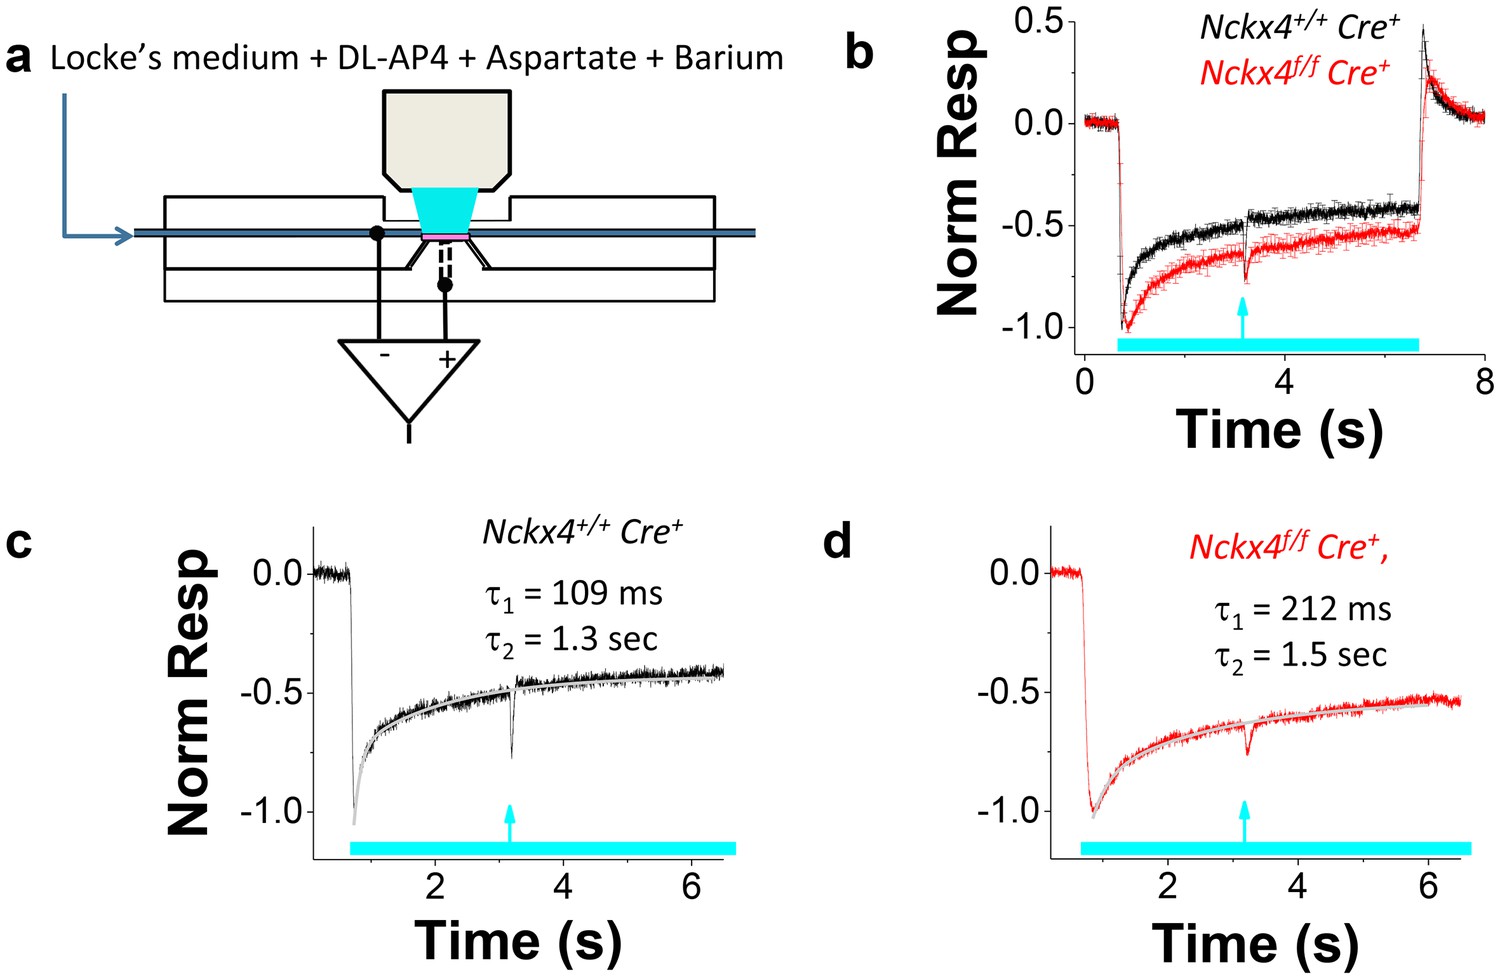
NCKX4 accelerates cone light adaptation.
(a) A schematic of the system to record transretinal voltage (ex vivo ERG) from a superfused isolated mouse retina (pink, see Materials and methods for details). (b) Population averaged ex vivo cone ERG responses (mean ± SEM) to steps of light normalized to the peak amplitude recorded from Nckx4+/+ Cre+ control (black, background light intensity I = 37,800 photons μm−2 s−1, N = 5 mice) and Nckx4f/f Cre+ (red, I = 15,500 photons μm−2 s-1, N = 5 mice) retinas. A test flash (arrow) was delivered 2.5 s after the onset of each light step (bar) to probe the sensitivity of cones at different background light intensities (see below). A sum of two exponential functions (Equation 2) was fitted to the recovery phase of the averaged step responses (after the step onset) shown in (b) for Nckx4+/+ Cre+ control (c) and Nckx4f/f Cre+ (d) mice. The values of the best-fitting time constants are indicated in each panel.
Figure 6
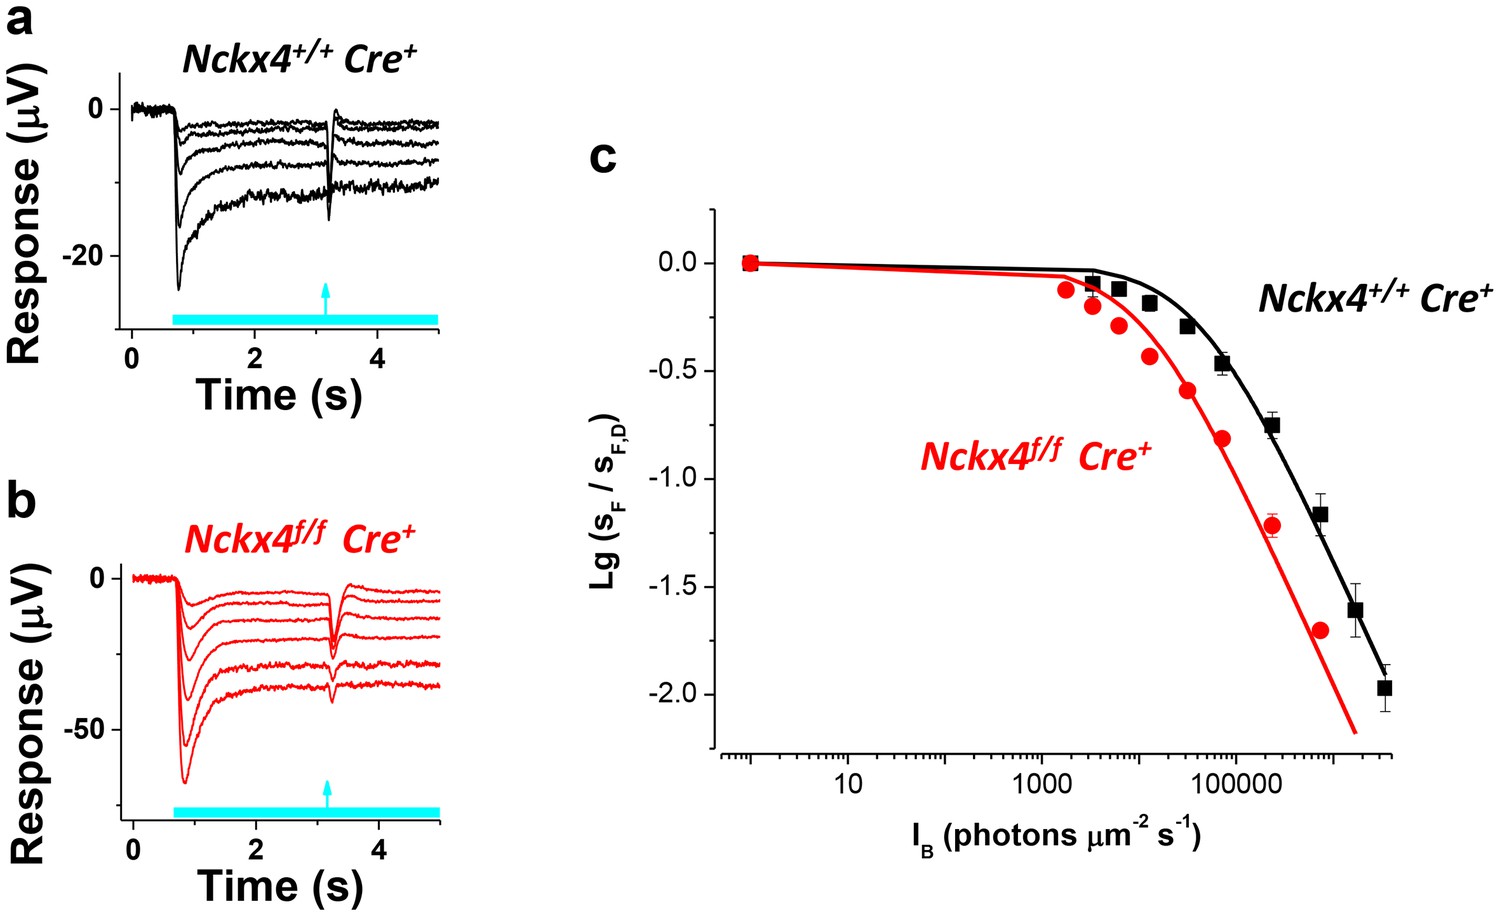
NCKX4 extends the function of cones to brighter light.
The sensitivity to a flash of light (SF) for Nckx4+/f Cre+ control (a) and Nckx4f/f Cre+ (b) cones in background light was determined 2.5 s after the light step onset. Light step and flash timing are indicated on the bottom of each panel. (c) SF as normalized to the sensitivity in darkness (SF,D, mean ± SEM) is plotted as a function of light step intensity (IB) for Nckx4+/+ Cre+ control (black, N = 5 retinas) and Nckx4f/f Cre+ (red, N = 5 retinas) mice. Smooth traces plot the Weber-Fechner function (Equation 4) with I0 = 43,000 and 11,300 photons μm−2 s−1 for control (black) and NCKX4-deficient (black) cones, respectively.
Figure 7
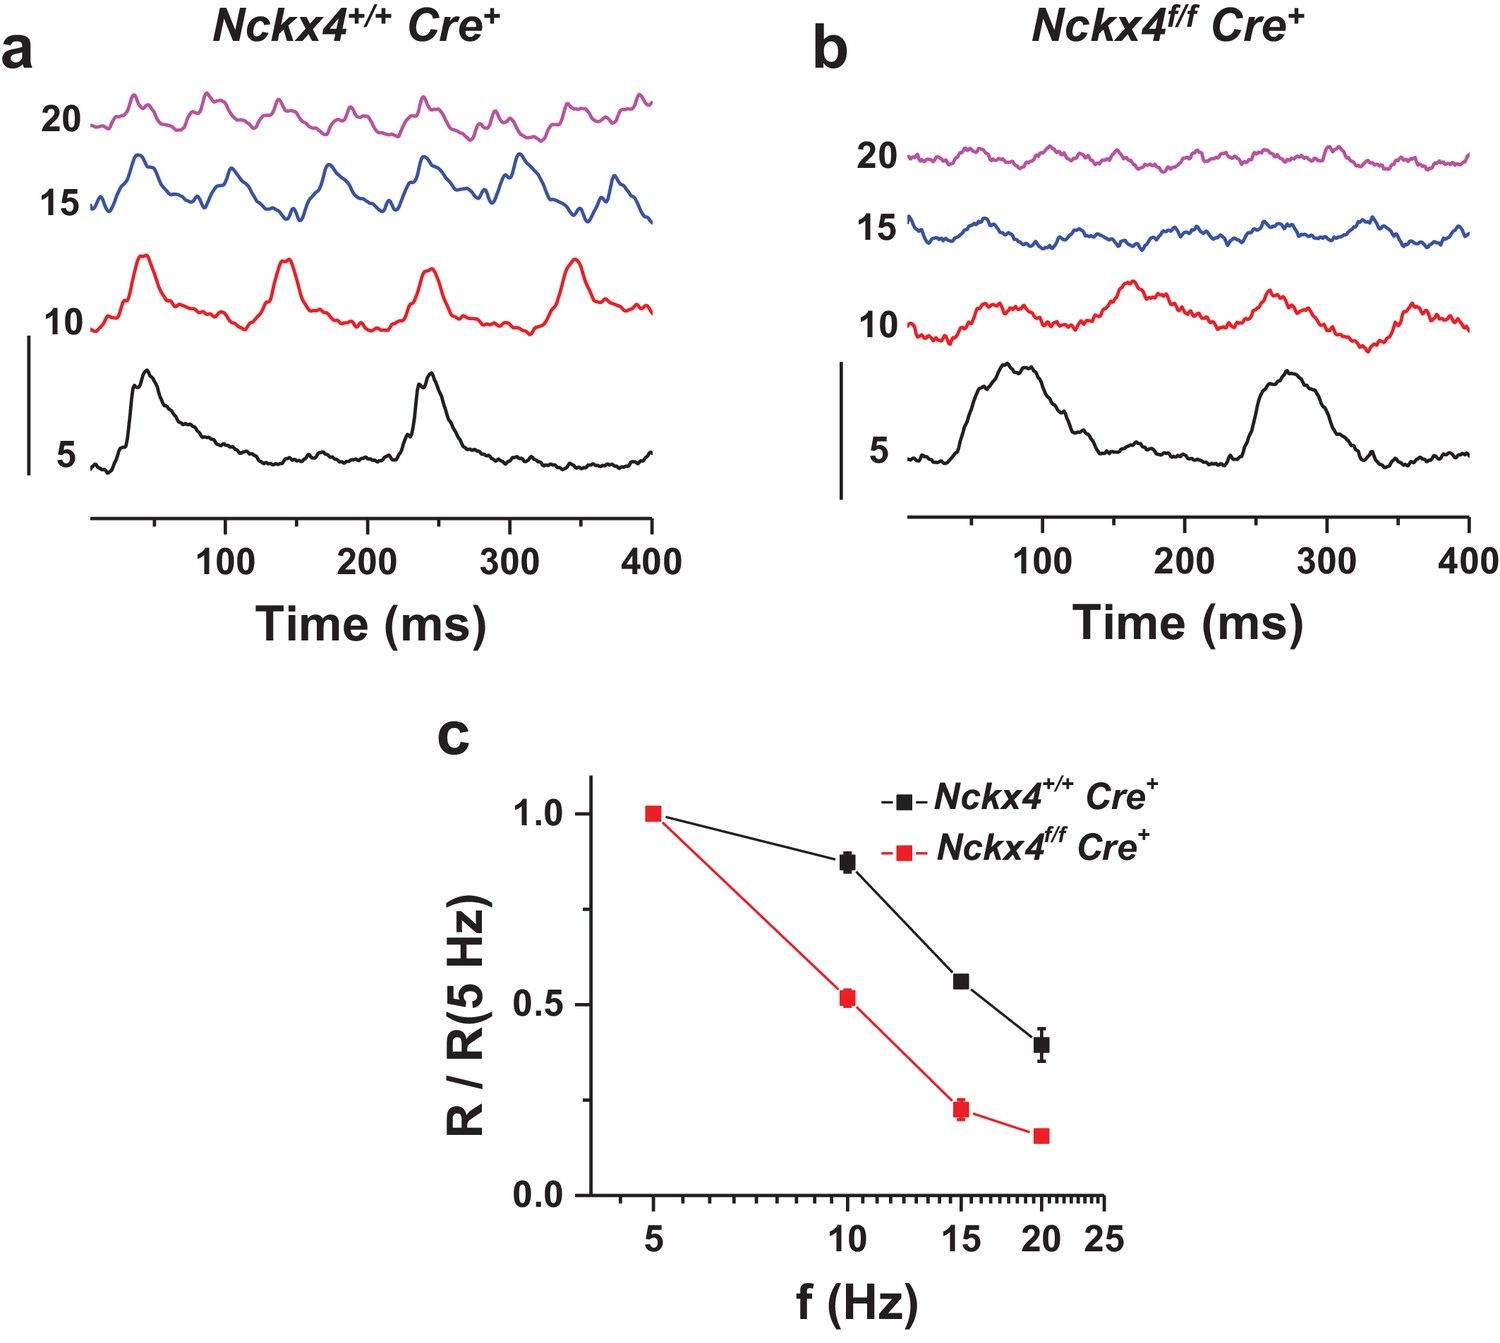
NCKX4 extends the temporal resolution of cone-mediated vision to higher frequencies.
In vivo electroretinogram (ERG) responses to flickering light recorded from dark-adapted anesthetized Nckx4+/+ Cre+ (a) and Nckx4f/f Cre+ (b) mice. The frequency of the flicker stimulus (f) is indicated on the left for each trace in Hz. Vertical scale bar = 3 μV. The energy of flickering flashes were either 0 or 0.5 lg(Cd m−2 s). (c) The fundamental response amplitude (R), measured from the most negative peak/plateau to the most positive peak and normalized to the fundamental response amplitude at 5 Hz stimulation, is plotted as a function of the flicker stimulus for Nckx4+/+ Cre+ (black, N = 5 eyes from three animals) and Nckx4f/f Cre+ (red, N = 8 eyes from four animals) mice.
Figure 8

Loss of both NCKX2 and NCKX4 expressions leads to alteration of outer segment structure and cone cell death.
Confocal stacked images from flat mounted retinas from 3-month-old Nckx2-/- mice (a, c, e) and their littermate Nckx2/4 double knockout animals (b, d, f) stained with antibodies against S-opsin (a, b) or CNGA3 (c, d). A slice from the CNG3A stacked image is shown in e and f. Higher magnification of representative cells are shown in inset. Cones were labeled with peanut agglutinin (PNA) in representative flat mounted retina from 3-month-old (g) and 9-month-old (h) Nckx2/4 double knockout mice. Scale bar = 20 μm. The number of cones from retinas of control, Nckx4 knockout, and Nckx2/4 double knockout mice were counted and plotted (i). One-way ANOVA showed no differences in cone numbers in the group of 3-month-old mice (p=0.3), but significant (p<0.0001) reduction in cone numbers in the 9-month-old Nckx2/4 double knockouts compared to Nckx2-/- mice.
Figure 9

Loss of both NCKX2 and NCKX4 expressions severely compromises cone function.
Representative light responses recorded from isolated retinas of Nckx4+/+ Cre+ (a), Nckx4f/f Cre+ (b) and Nckx2-/- Nckx4f/f Cre+ (c) mice using ex vivo ERG method. Light flashes ranged from 390 to 460,000 photons (505 nm) μm−2 in (a) and (b), and from 4000 to 1.4 * 106 photons (505 nm) μm−2. (d) Population averaged (mean ± SEM) responses to a dim flash normalized with Q (in photons μm−2) and maximal response amplitude (Rmax) recorded from Nckx4+/+ Cre+ control (black, N = 5 retinas from four mice), Nckx4f/f Cre+ (red, N = 8 retinas from four mice) and Nckx2-/- Nckx4f/f Cre+ (blue, N = 4 retinas from three mice) retinas. The response from Nckx2-/- Nckx4f/f Cre+ mice shown in (d) is scaled up by 25-fold to facilitate comparison of response kinetics between the genotypes. The inset shows fractional dim flash responses of control (WT) and Nckx2-/- cones modified from (Sakurai et al., 2016). (e) Normalized population averaged response amplitudes (R/Rmax) are plotted as a function of flash strength in photons μm−2 for Nckx4+/+ Cre+ control (black, N = 5), Nckx4f/f Cre+ (red, N = 8), and Nckx2-/- Nckx4f/f Cre+ (blue, N = 4) mouse retinas. Smooth traces plot Eq. 3 with Q1/2 = 5200 photons μm−2 and 3900 photons μm−2 for control (black) and Nckx4f/f Cre+ (red) retinas, respectively. (f) Light adaptation persists in the cones from Nckx2-/- Nckx4f/f Cre+ mice. Representative response to a bright step of 530 nm light (I = 38,600,000 photons μm−2 s−1) recorded from Nckx2-/- Nckx4f/f Cre+ mouse retina. Light step timing is indicated on the bottom of the graph.
Figure 10
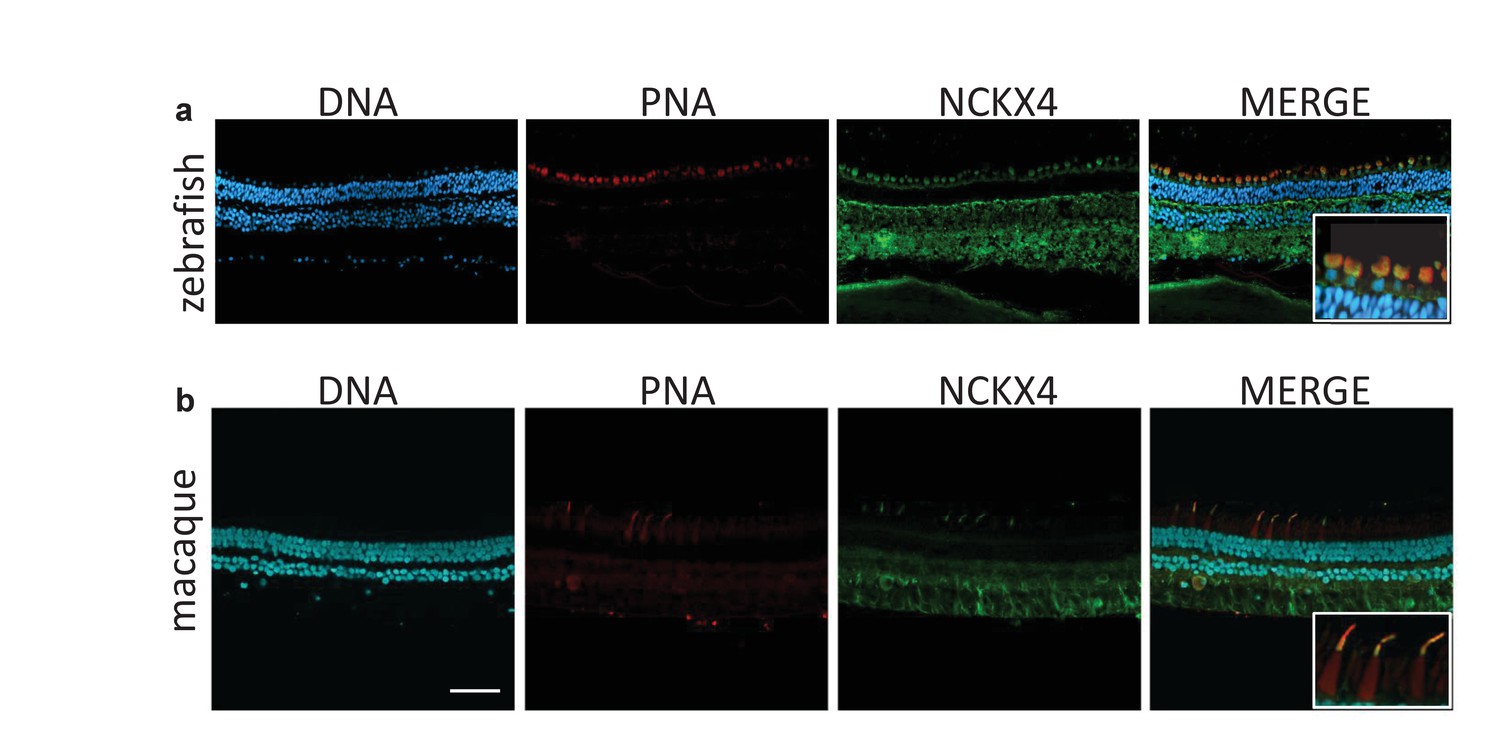
NCKX4 is expressed in the outer segments of zebrafish and non-human primate cones.
Immunostaining of NCKX4 in the vertical sections of zebrafish (top) and macaque (bottom) retinas (photoreceptors on the top). Nuclei (DNA, cyan), cone photoreceptors (PNA, red), and NCKX4 (green) staining. Insets show larger magnification immunostaining of cones in the photoreceptor layer. Scale bar = 50 μm.
Tables
Table 1
Comparison of control and NCKX4-deficient cone flash response and light adaptation parameters. Rmax, maximal flash response amplitude (in pA) in single-cell recordings; tp, time from flash to the peak amplitude (in ms) of a dim flash response in single-cell recordings; τrec, the recovery time constant (in ms) of the tail phase of a dim flash response in single-cell recordings (see Equation 1); Q1/2, flash strength (in photons μm−2) eliciting 50% of the Rmax in single-cell recordings (see Equation 3); τ1 and τ2, time constants in Equation 2 describing the recovery kinetics of ex vivo ERG signal after step onset (see Figure 4c,d); I0, background light intensity (in photons μm−2 s−1) reducing the flash response sensitivity of cones to 50% of that in darkness as derived from ex vivo ERG data; Tint, integration time of dim flash responses (defined as the area between baseline and response divided by the peak amplitude) Statistics for parameters (mean ± SEM) derived from ex vivo ERG data (τ1, τ2 and I0) were from five control and eight Nckx4f/f Cre+ mice, and the statistics for the other parameters from single-cell recordings were from six control cells (two mice) and six Nckx4f/f Cre+ cells (three mice). * indicates significant (p<0.05) difference between control and NCKX4-deficient cones.
| Rmax (pA) | tp (ms) | τrec (ms) | Q1/2 (hv μm−2) | τ1 (ms) | τ2 (s) | I0 (hv μm−2 s−1) | Tint (ms) | |
|---|---|---|---|---|---|---|---|---|
| Nckx4+/+ Cre+ | 5.8 ± 1 | 76 ± 3 | 52 ± 8 | 1,150 ± 240 | 109 ± 27 | 1.3 ± 0.2 | 49,000 ± 11,000 | 80 ± 14 |
| Nckx4f/f Cre+ | 5.6 ± 0.4 | 121 ± 6* | 101 ± 13* | 670 ± 73* | 212 ± 37* | 1.5 ± 0.3 | 11,508 ± 990* | 160 ± 9* |
Download links
A two-part list of links to download the article, or parts of the article, in various formats.
Downloads (link to download the article as PDF)
Open citations (links to open the citations from this article in various online reference manager services)
Cite this article (links to download the citations from this article in formats compatible with various reference manager tools)
The Na+/Ca2+, K+ exchanger NCKX4 is required for efficient cone-mediated vision
eLife 6:e24550.
https://doi.org/10.7554/eLife.24550


