Beta band oscillations in motor cortex reflect neural population signals that delay movement onset
- University of California, Berkeley, United States
Figures
Figure 1
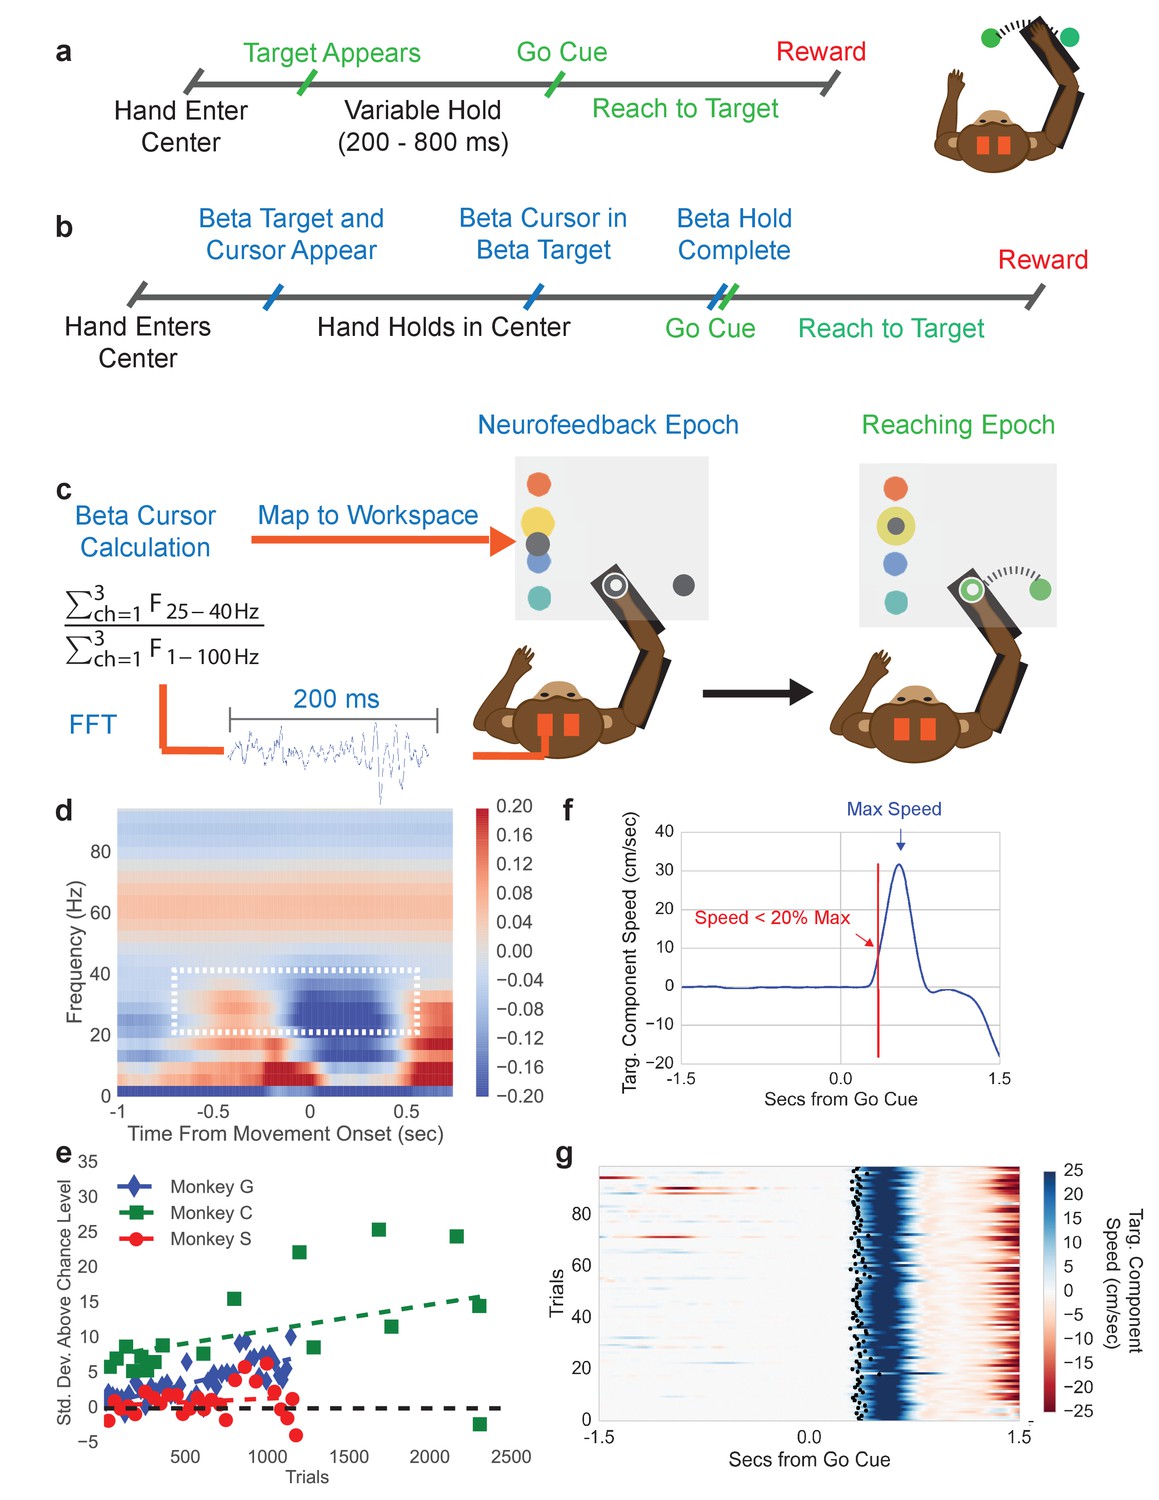
Center-out reaching task and neurofeedback-reaching task.
(a) Timeline of center-out reaching task (CO task) with variable hold times (200–800 ms) (b) Timeline of neurofeedback-reaching task (NR task), where blue text indicates the neurofeedback epoch and green text indicates the reaching epoch. (c) The NR task feedback loop. Subjects keep their right hand held in a central target throughout the task. They are then shown a single beta target (shown in yellow here) and beta cursor (shown in gray here) on the screen. The cursor has a fixed horizontal position and a vertical position that is updated every 100 ms. Once the beta cursor is held in the beta target for 450 ms, the beta cursor and beta target disappear and the subject reaches to a peripheral target 6.5 cm away. (d) Trial-averaged spectrogram of movement onset aligned motor cortical LFP signals for Monkey C, with a mean 1/f trend estimated with first-order linear regression and subtracted away. The white box highlights the beta desynchronization in the 25–40 Hz range. (e) All three subjects perform the neurofeedback epoch part of the task above chance. The x axis corresponds to all trials from all sessions concatenated. Each point corresponds to a session and each point’s position on the x axis corresponds to the first trial that falls within that session. Position on the Y axis indicates standard deviations above mean chance level (shown by the black dotted line). (f) Illustration of the metric termed movement-onset time (MOT) throughout the text. Trial-averaged hand speed in the direction of the target is shown in blue with an arrow pointing out the time of maximum hand speed. To find the MOT, step backward in time along the hand speed trace until the hand speed falls below 20% of the maximum speed value. (g) 100 trials (rows) of hand speed are shown, where time prior to 0.0 s is the neurofeedback epoch and time after 0.0 s is the reaching epoch in (b). Black dots indicate the calculated MOT. Increasing blue corresponds to increasing hand speed.
Figure 2
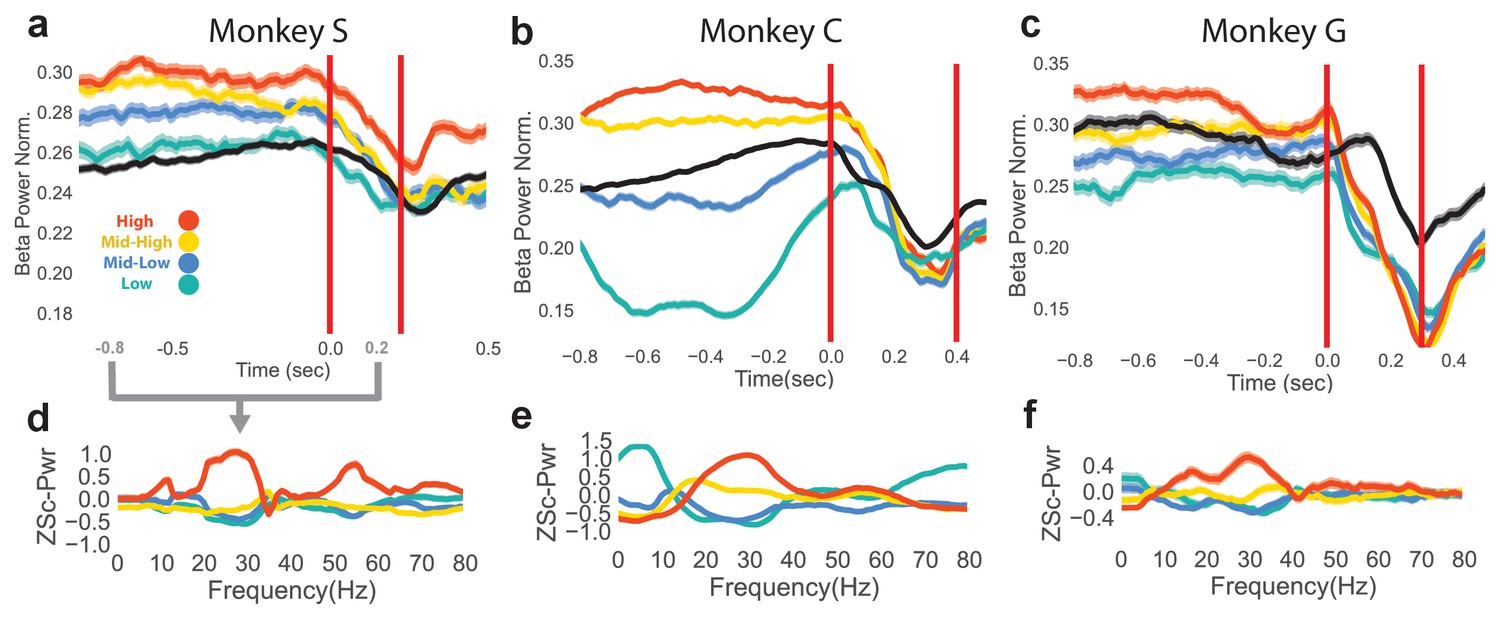
Differences in beta power at go cue of reaching epoch in NR task.
(a–c) Mean (s.e.m) of normalized beta power for Monkeys S, C, and G aligned to the end of the neurofeedback epoch. High, mid-high, mid-low, and low beta targets are in red, yellow, blue, and green, and go-cue aligned CO trials are in black for reference. (d–f) Z-scored PSDs estimated from a time slice 0.8 s prior to the end of the neurofeedback epoch (labeled as 0.0 s in a-c) and 0.2 s after the end of the neurofeedback epoch. This time slice is marked in gray below the time axis in (a).
Figure 3
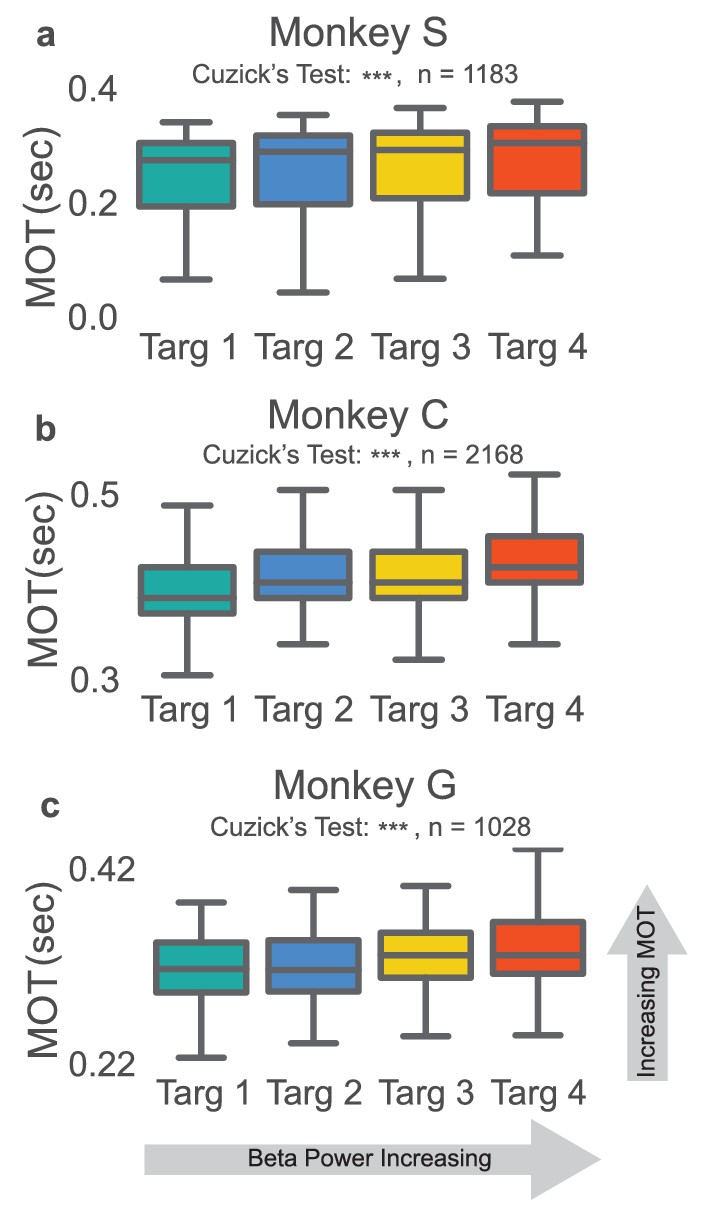
Increases in beta power precede increases in movement onset time.
(a–c) Boxplot of reaching movement onset times grouped by preceding beta target. Subjects exhibit an increase in movement onset time (MOT) when modulating normalized beta power to higher targets. Gray line at center of boxplot is median. ***p<5e-09, Cuzick’s two-tailed test.
Figure 4
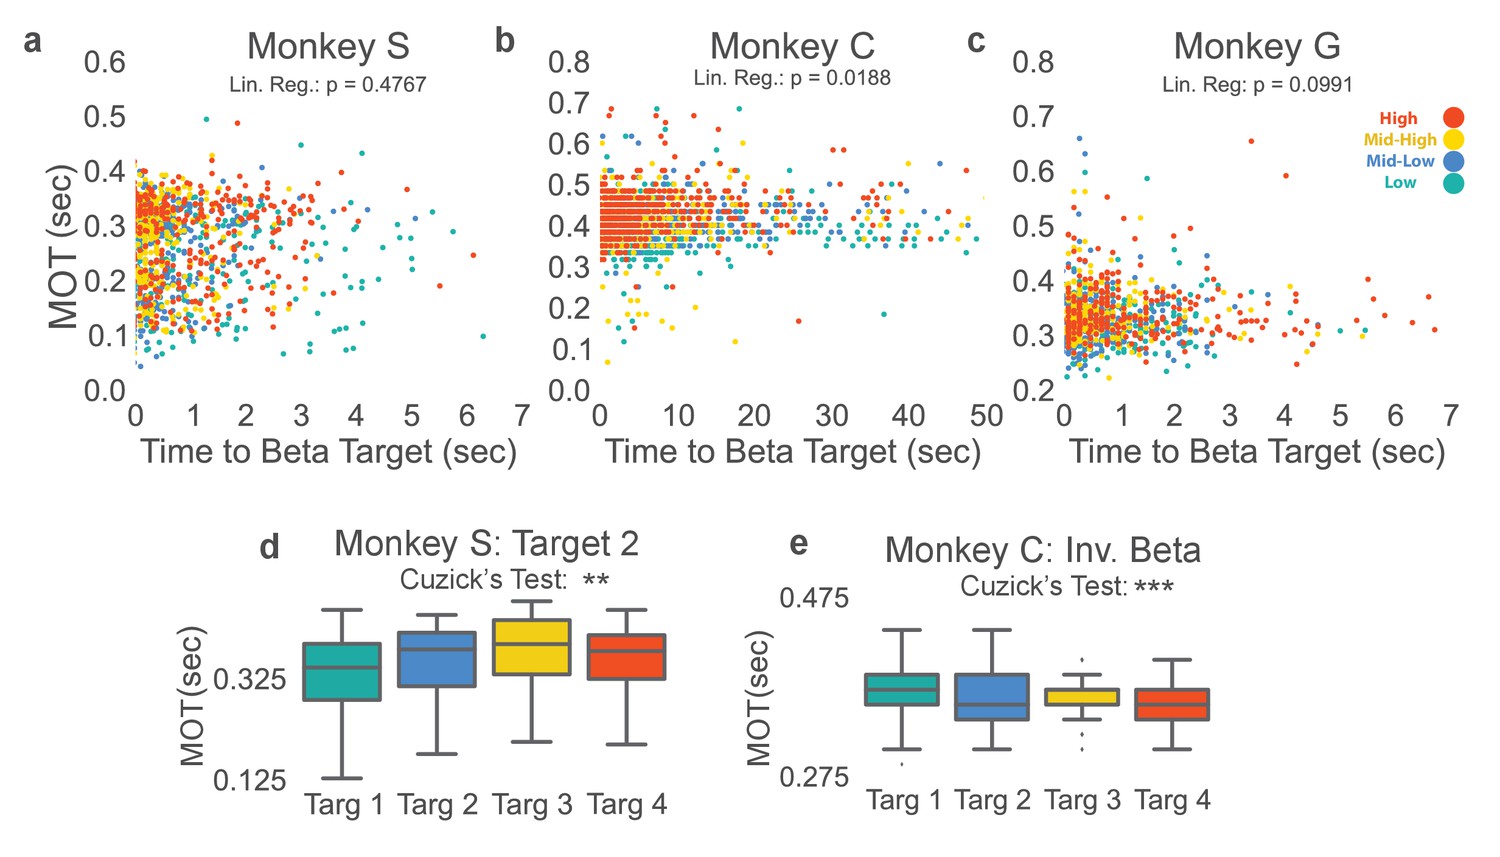
Beta target difficulty, beta target location, and arm-reaching location do not account for increase in movement onset times.
(a–c) Movement onset time (MOT) from Figure 3 is plotted against time to beta target for Monkeys S, C, and G. Colors correspond to the beta target for that trial following the same colormap as Figures 2 and 3. Linear regression is performed to assess whether time to beta target is predictive of MOT. Non-significant p-values for Monkeys S and G show that time to beta target (interpreted as beta target difficulty) does not significantly predict MOT. Monkey C exhibits a significant relationship, but when MOTres is computed by subtracting predicted MOTs from time to beta target from actual MOT, MOTres exhibits the same increase with increasing beta target as seen in Figure 3. (d) Changing location of the arm-reaching location from 6.5 cm to the right of the central target, to 6.5 cm above the central target does not change the observed relationship between increasing movement onset times and increasing beta power target in Monkey S. (e) Inverting the vertical ordering of beta targets on the screen to make green the high-beta target, blue the mid-high beta target, yellow the mid-low beta target, and red the low beta target also shows the same increase in MOT with increased beta target as in Figure 3b. *p<0.05, **p<0.01, ***p<0.001, Cuzick’s two-tailed test for significant increases and decreases by grouping except where noted.
Figure 5
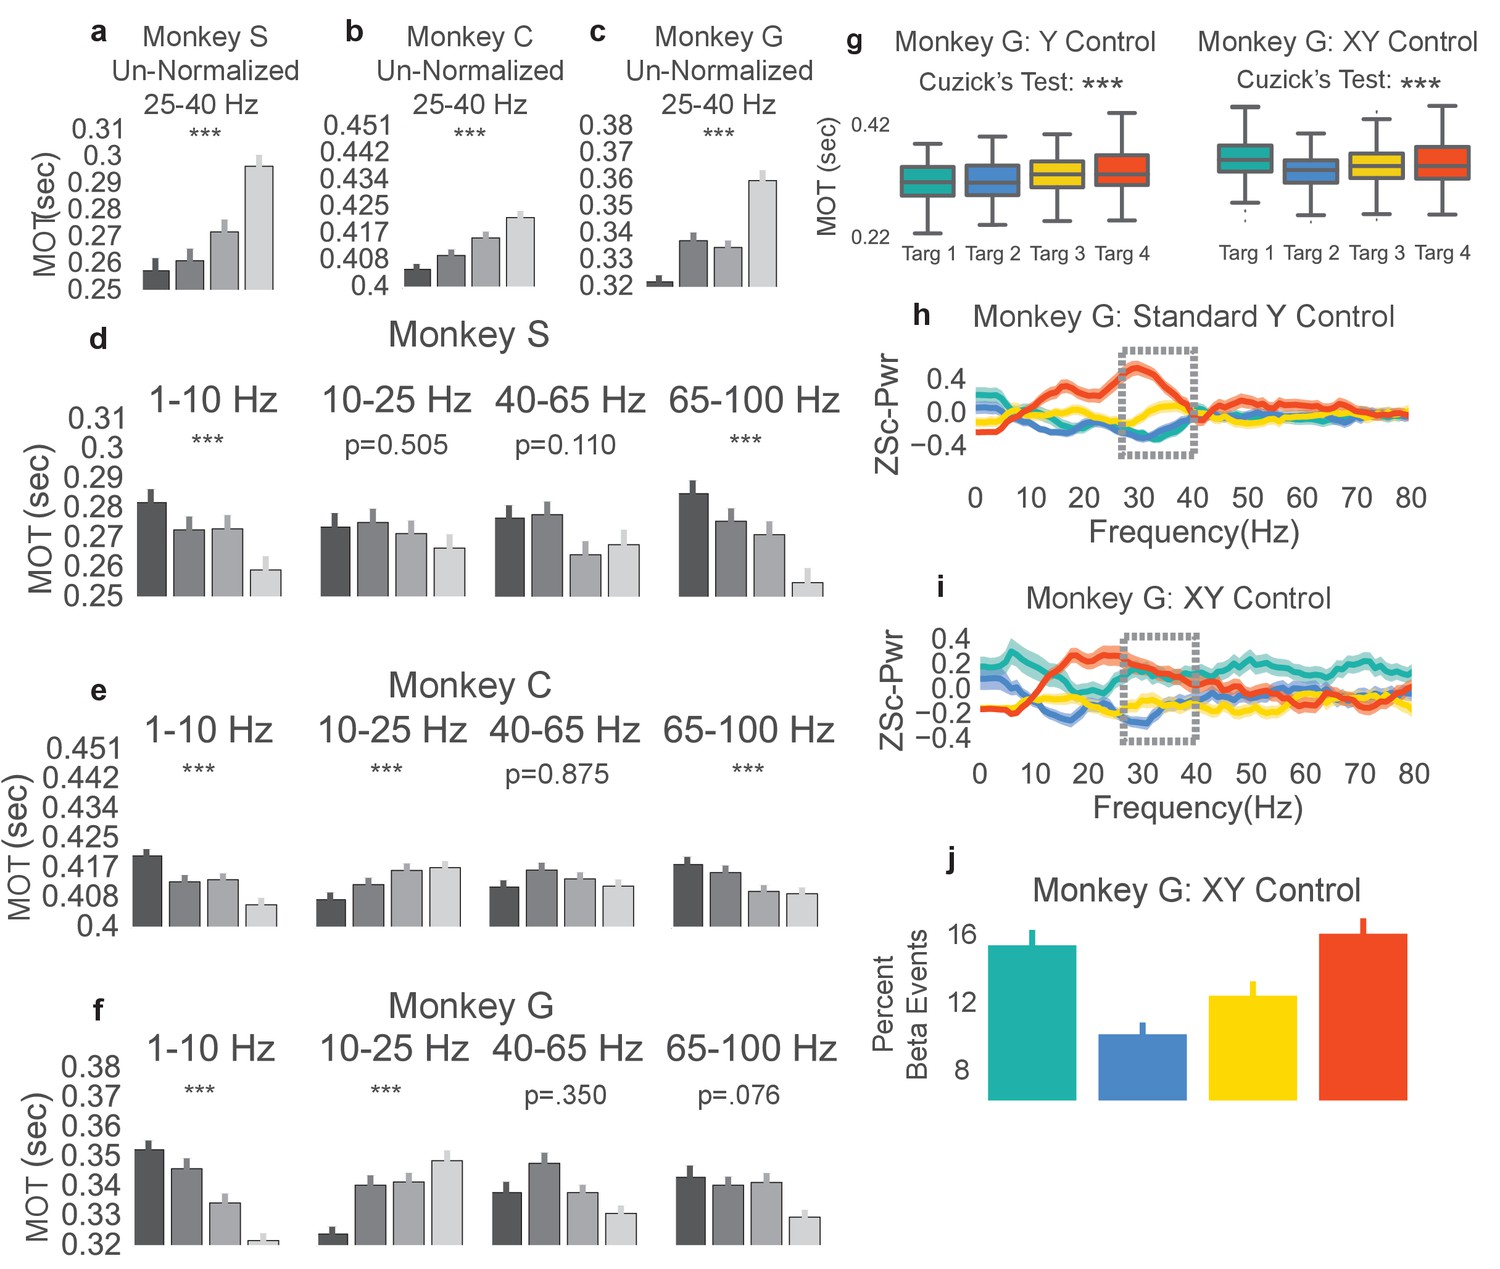
Non-beta frequencies’ involvement in movement onset time.
(a–c) Trials from Monkeys S, C, G were re-labeled as low, mid-low, mid-high, and high according to the non-normalized beta power during time slice −0.8 to 0.0 s with respect to the end of the neurofeedback epoch. The movement onset times (MOTs) of the re-labeled trials were compared and the mean (s.e.m) are plotted in each subplot. Below titles, p-values are shown for Cuzick’s test. (d–f) The same as (a-c) except using normalized non-beta frequencies indicated at the top of plots. (g) Right shows MOTs for version of task where the X axis position of the cursor is controlled by normalized 1–10 Hz power in addition to the Y axis position controlled by normalized 25–40 Hz power. Note that Cuzick’s test for the right plot assumes ordering of targets is mid-low, mid-high, high, low (instead of low, mid-low, mid-high, high). Left, same MOT plot for Monkey G from Figure 3c for comparison. (h, i) Z scored PSD plots (same method as Figure 2d–f) for different beta targets in the standard beta neurofeedback task (h), and the neurofeedback task that incorporates 1-10 Hz power modulation to control X axis position (i). Dotted lines indicate that the ordering of targets in the beta range follows the movement onset time ordering in (g). (j) Percent of time points within the last 0.8 s of the neurofeedback epoch that are part of beta oscillatory episodes during the task requiring both beta and 1–10 Hz control. *p<0.05, **p<0.01, ***p<0.001, Cuzick’s two-tailed test for ordered grouping.
Figure 6
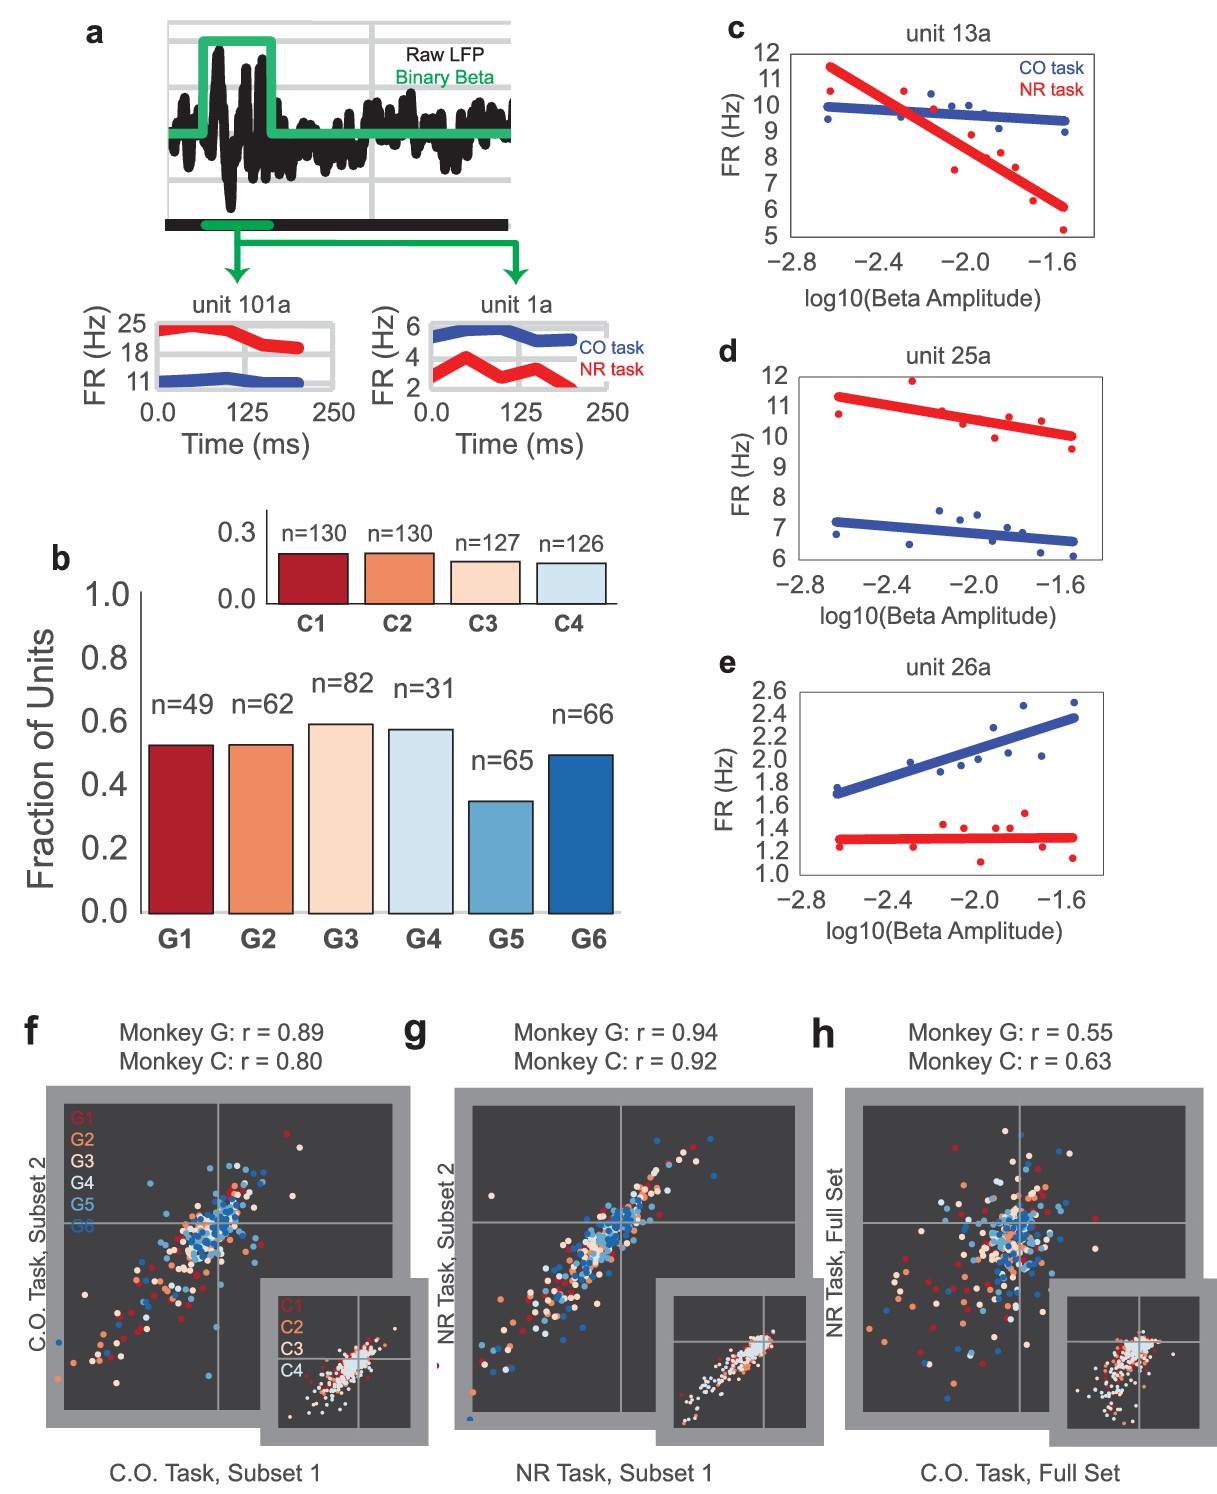
Units exhibit different mean firing rates during CO and NR tasks on-beta timepoints and different beta amplitude-to-firing rate mappings during entire CO and NR trials.
(a) Schematic of an LFP trace (in black) with an on-beta vs. off-beta indicator shown in green. During oscillatory events, example mean firing rates are shown for two example single units from Monkey G (unit 101a, unit 1a), where the red trace is for on-beta bins during the neurofeedback epoch and the blue trace is for slow, on-beta bins during the CO task. Graphs are aligned to starting bin of beta event. (b) For each day (main plot Monkey G: days G1 – G6, subplot Monkey C: days C1 – C4), a bar plot indicates the fraction of units that exhibit significantly different firing patterns during slow, on-beta time points in the CO and NR task assessed by the Mann–Whitney U test (p<0.05). Number of units recorded per day are printed above each bar. (c–e) Example beta amplitude-to-spike rate mappings for single-units from a day. Mappings in red are from the CO task. Mappings in blue are from the same unit on the same day during the NR task. Units can exhibit similar means but different slopes (c), similar slopes but different means (d), or different slopes and different means (e). (f, g) Stability of beta-to-rate slope estimates from subset #1 versus subset #2 of CO (f) and NR (g) tasks (main plot Monkey G, subplot Monkey C). R values indicate correlation coefficient between beta-to-rate slopes computed from subset #1 and from subset #2, averaged across days. (h) Comparison of beta-to-rate slopes from CO versus NR tasks (full set, not subset). R values indicate correlation coefficient between slopes from CO task versus slopes computed from NR task, averaged across days.
Figure 7 with 1 supplement
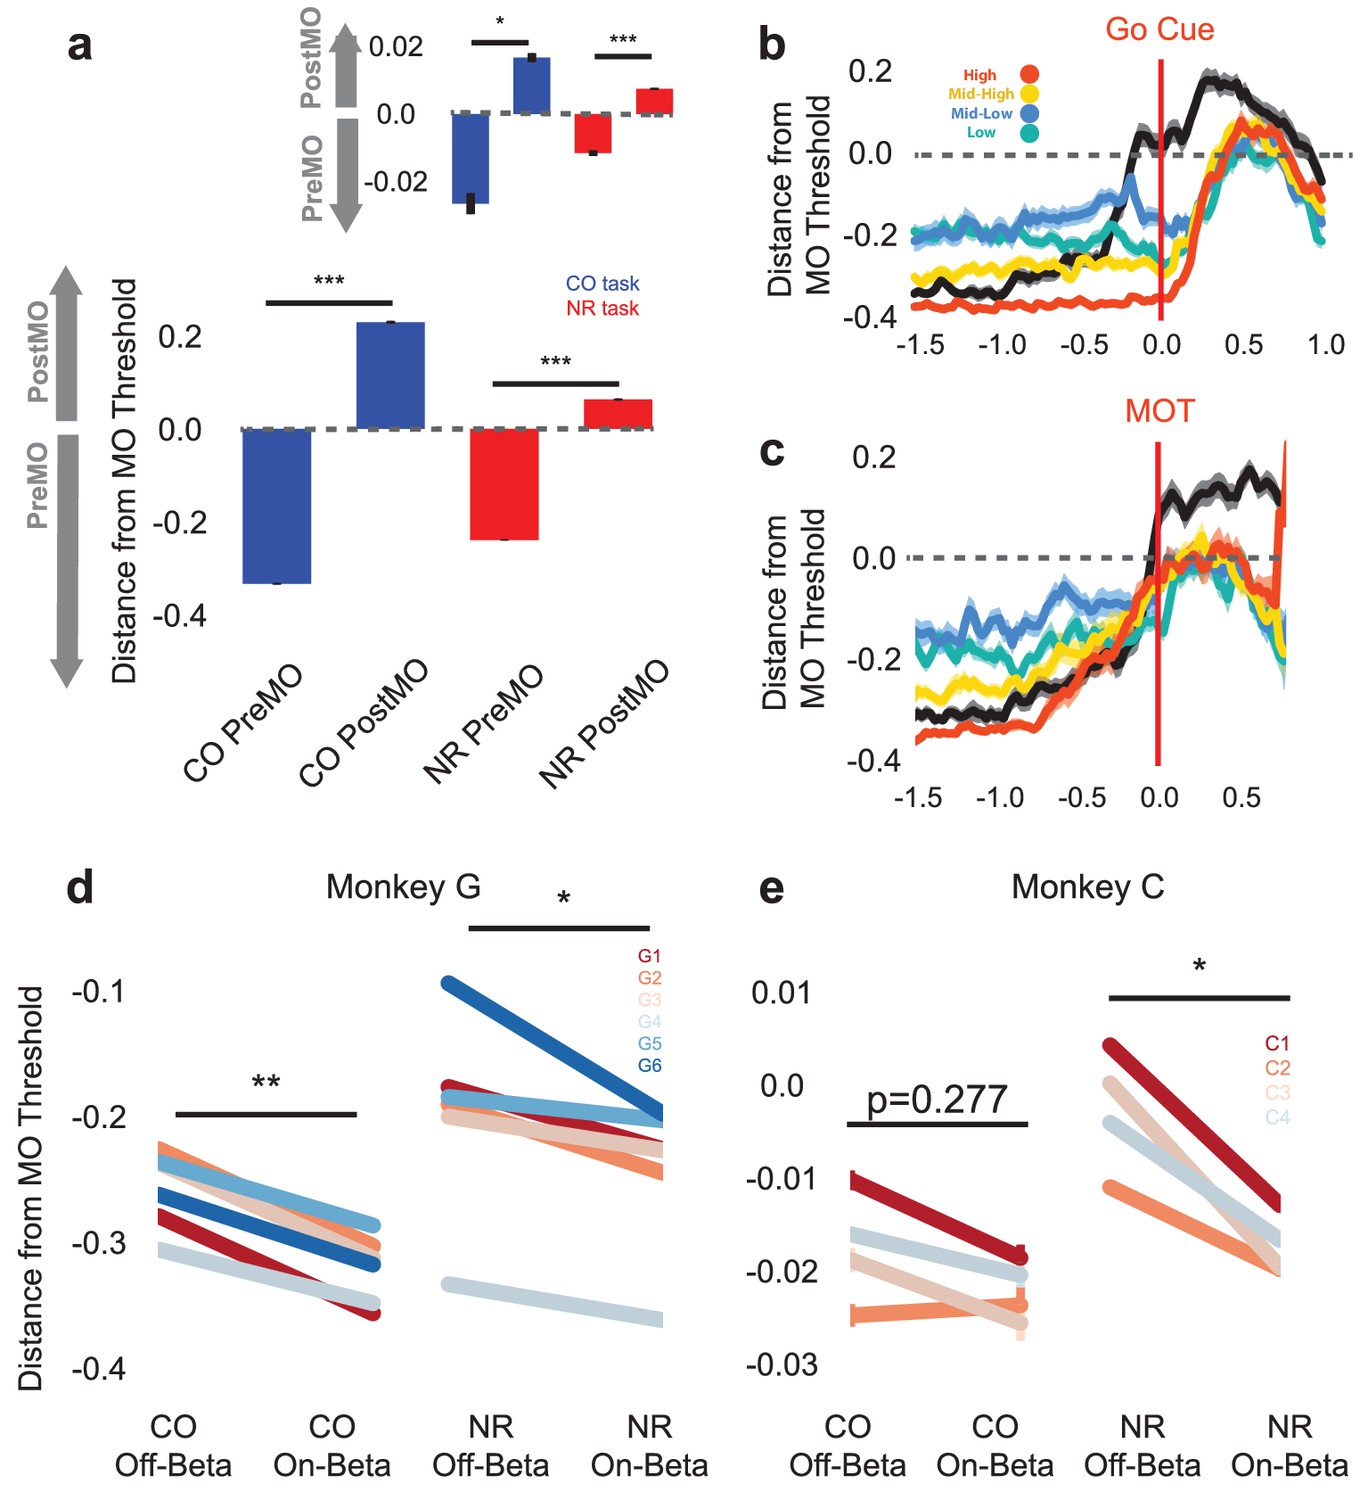
Population activity shifts away from MO threshold during on-beta timepoints in both the CO and NR tasks.
(a) Distance to MO threshold for the CO (blue) and NR (red) tasks for PreMO and PostMO timepoints from Monkey G and Monkey C (inset). Bars less than and greater than zero indicate mean scores predicting PreMO and PostMO, respectively. (b) Example mean (s.e.m) of distance from MO threshold as a function of time to go cue for CO trials (black), high beta target NR trials (red), mid-high beta target NR trials (yellow), mid-low beta target NR trials (blue), and low beta target NR trials (green). At the go cue, distances to MO threshold are greatest for high beta target, and lowest for low beta targets. (c) Similar to (b) but aligned to MOT instead of go cue. Trials converge to MO threshold at MOT. (d–e) The mean distance from MO threshold for slow, preMO, off-beta and slow, preMO, on-beta timepoints during the CO (left) and NR (right) tasks for Monkey G and Monkey C, respectively. Individual lines connect mean off-beta and on-beta distances (s.e.m) for individual sessions.
Figure 7—figure supplement 1
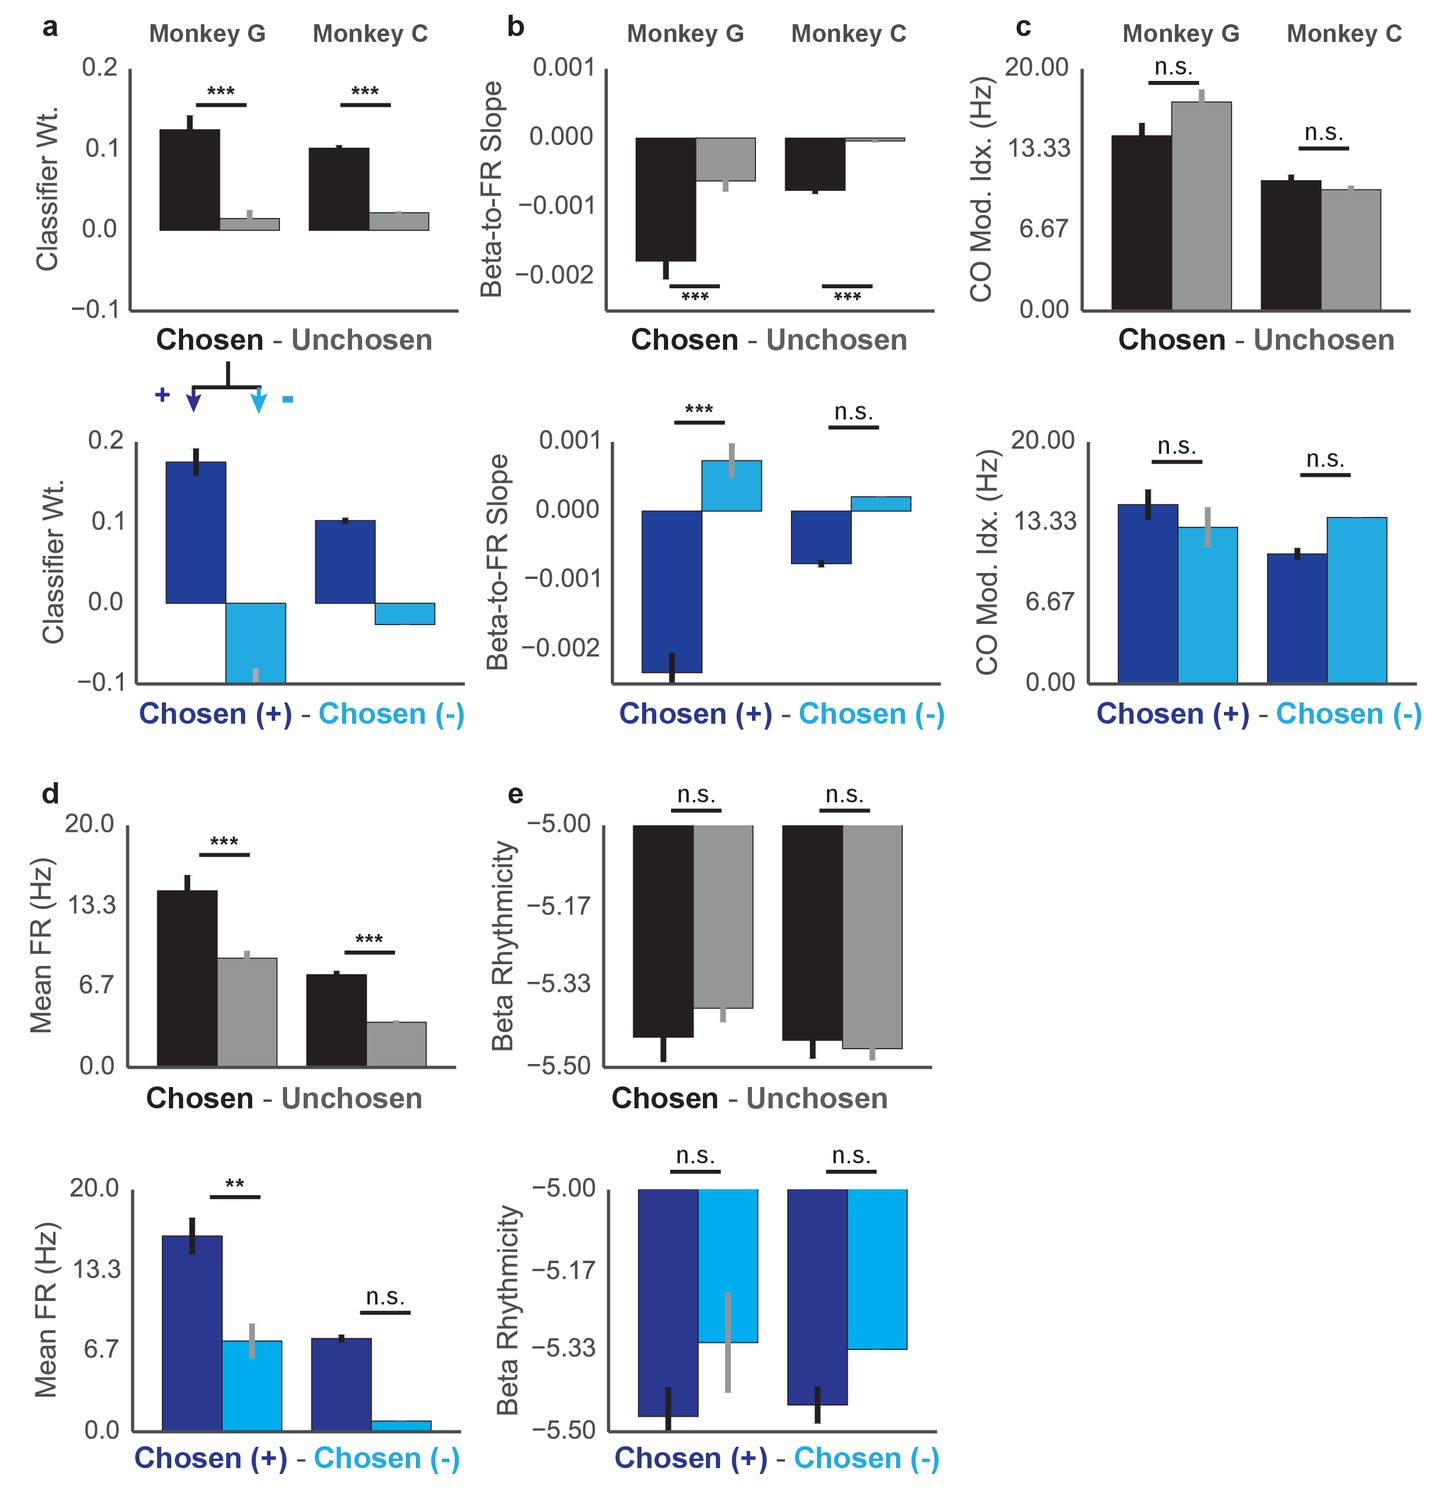
Properties of Chosen vs Unchosen units and Chosen+ vs Chosen- units.
Top shows differences between classifier weight β1 for chosen and unchosen units (top) and chosen+ and chosen- units (bottom) for Monkey G (left) and Monkey C (right). Same layout for (b) beta-to-FR slope (as in Figure 6f–h), (c) CO task modulation, (d) mean firing rate, and (e) beta rhythmicity. Differences are assessed with Kruskal–Wallis test and reported along with sample sizes in Supplementary file 1. *p<0.05, **p<0.01, ***p<0.001.
-
Figure 7—figure supplement 1—source data 1
Sample sizes and Kruskal Wallis test results for Figure 7—figure supplement 1.
- https://doi.org/10.7554/eLife.24573.015
Tables
Table 1
Normalized Beta Values Needed to Reach Center of Each Beta Target
| Target location | Monkey S | Monkey C | Monkey G |
|---|---|---|---|
| High | 0.32 | 0.34 | 0.23 |
| Med-High | 0.25 | 0.26 | 0.18 |
| Med-Low | 0.17 | 0.18 | 0.13 |
| Low | 0.10 | 0.11 | 0.07 |
Table 2
Cuzick’s Test for ordered trend for reaching kinematics by beta target.
| Metric | Monkey S Z-Statistic (p-value) | Monkey C Z-Statistic (p-value) | Monkey G Z-Statistic (p-value) | Combined Z-Statistic (p-value) |
|---|---|---|---|---|
| Onset Speed | 1.378 (p=0.168) | -3.593 (***) | 0.0734 (p=0.941) | -1.244 (p=0.2134) |
| Peak Speed | 4.476 (***) | 4.142 (***) | -1.330 (p=0.187) | 1.834 (p=0.06670) |
| Onset Acceleration | 1.901 (p=0.0573) | 2.573 (*) | 0.159 (p=0.873) | 0.818 (p=0.4135) |
-
*p<0.05, **p<0.01, ***p<0.001, Cuzick’s two-tailed test for ordered grouping. Monkey S: n = 1183, Monkey C: n = 2168, Monkey G: n = 1028, Combined: n = 4379
Table 3
Predicting MOT with beta (β, 25-40 Hz), gamma (γ, 65-100 Hz), and non-beta frequency Low Frequency (LF, 1-10 Hz) bands.
| R2 Model 1: MOT ~ β | R2 Model 2: MOT ~ γ | R2 Model 3: MOT ~ LF | R2 Model 4: MOT ~ β+γ | R2 Model 5: MOT ~ β+LF | F statistic (p-value): Model 4 > Model 2 | F statistic (p-value): Model 5 > Model 3 | |
|---|---|---|---|---|---|---|---|
| Monkey S | 0.0403 | 0.01483 | 0.006417 | 0.05806 | 0.04321 | F(1181, 1180) = 54.162, p < 1e-16 | F(1181, 1180) = 45.373, p < 1e-16 |
| Monkey C | 0.0138 | 0.004384 | 0.01253 | 0.01733 | 0.01456 | F(2166, 2165) = 28.531, p < 1e-16 | F(2166, 2165) = 4.47718, p < 1e-16 |
| Monkey G | 0.0767 | 0.005467 | 0.05866 | 0.10561 | 0.07963 | F(1026, 1025) = 114.77, p < 1e-16 | F(1026, 1025) = 23.356, p < 1e-16 |
| Combined Monkeys | 0.04363 | 0.01383 | 0.018204 | 0.05677 | 0.04522 | F(4377, 4376) = 199.20, p < 1e-16 | F(4377, 4376) = 123.83, p < 1e-16 |
Table 4
Percentage of broadband power estimate comprised by 65–100 Hz.
| Monkey | Mean (std) Percentage |
|---|---|
| Monkey S | 2.43 +/- 1.13% |
| Monkey C | 1.50 +/-0. 518% |
| Monkey G | 2.14 +/-0. 825% |
Additional files
-
Supplementary file 1
Supplemental methods.
- https://doi.org/10.7554/eLife.24573.016
Download links
A two-part list of links to download the article, or parts of the article, in various formats.
Downloads (link to download the article as PDF)
Open citations (links to open the citations from this article in various online reference manager services)
Cite this article (links to download the citations from this article in formats compatible with various reference manager tools)
Beta band oscillations in motor cortex reflect neural population signals that delay movement onset
eLife 6:e24573.
https://doi.org/10.7554/eLife.24573


