PTEN controls glandular morphogenesis through a juxtamembrane β-Arrestin1/ARHGAP21 scaffolding complex
- Queen’s University of Belfast, United Kingdom
- Inserm, U1016, Institut Cochin, France
- CNRS, UMR8104, France
- Univ. Paris Descartes, Sorbonne Paris Cité, France
- University of Glasgow, Scotland
Figures
Figure 1 with 6 supplements

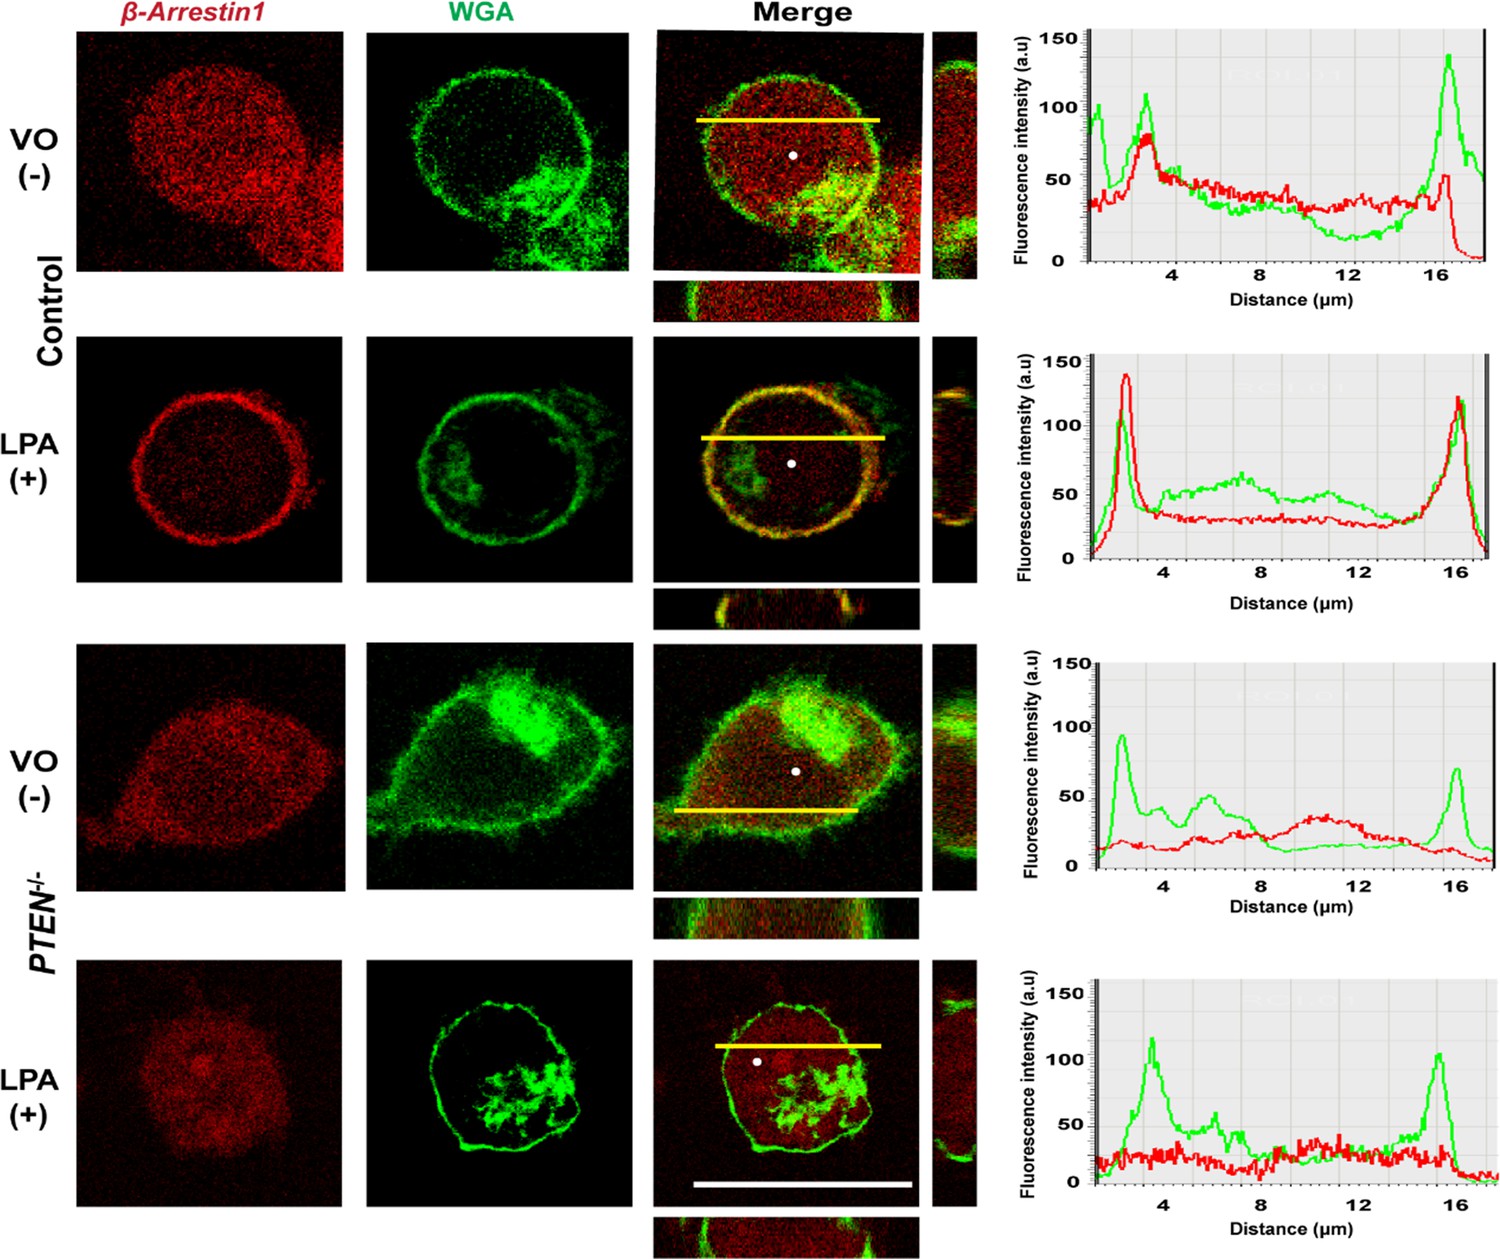
PTEN enhances membrane recruitment of β-Arrestin1.
(A,B) Total lysate β-Arrestin1 and ARHGAP21 expression in ShPTEN vs Caco-2 (control). GAPDH loading control; β-Arrestin1 = 0.78 ± 0.06; p=NS (0.08); ARHGAP21 = 1.29 ± 0.05;*p=0.03. (C) Cytosol and membrane localization of β-Arrestin1 and ARHGAP21 in control Caco-2 or Caco-2 ShPTEN (ShPTEN) cells. E-Cadherin and HSP90 used as cell membrane or cytosol markers. (D) Summary β-Arrestin1 and ARHGAP21 membrane ADU in ShPTEN cells vs Caco-2 control. Membrane values are normalized against total lysate ADU values for each protein (β-Arrestin1 = 0.82 ± 0.03 *p<0.05; ARHGAP21 = 1.48 ± 0.05 **p<0.01). (E) β-Arrestin1 expression in membrane fractions of control Caco-2 and ShPTEN cells after treatment. (F) Summary fold change of membrane β-Arrestin1 after LPA (+) or VO [vehicle only(-)] treatment shown in (E) ;Caco-2 (+) vs (-)=1.74 ± 0.09; **p<0.01; ShPTEN (+) vs ShPTEN (-)=0.97 ± 0.08 vs 0.66 ± 0.07;*p<0.05 values expressed as fold change relative to Caco-2 (-) control. ShPTEN (-) vs Caco-2 (-)=0.66 ± 0.07;*p<0.05; ShPTEN (+) vs Caco-2 (+)=0.97 ± 0.08 vs 1.74 ± 0.09;**p<0.01. Green bars indicate ShPTEN cells. (G) Plasma membrane localization of the β-Arrestin1-mCherry fusion protein in Caco-2 control (top two panels) or ShPTEN (bottom two panels) after VO (-) or LPA (+) treatment. Red and green fluorescence emitted by m-Cherry and Alexa 488 labels correspond to β-Arrestin1 and WGA, respectively. Note WGA localization to plasma membranes and Golgi apparatus. Colocalization of β-Arrestin1 and WGA at the plasma membrane revealed by composite yellow signal in Merge, Z-stack images and by overlap of fluorescence intensity curves in line scans. Horizontal yellow bars indicate focal plane. All experiments in triplicate. Analyses by Student’s paired t test or ANOVA with Tukey post hoc test. White scale bar 20 µm. Molecular weights indicated by arrows in blots.
-
Figure 1—source data 1
Source data for Figure 1B.
- https://doi.org/10.7554/eLife.24578.010
-
Figure 1—source data 2
Source data for Figure 1D.
- https://doi.org/10.7554/eLife.24578.011
-
Figure 1—source data 3
Source data for Figure 1F.
- https://doi.org/10.7554/eLife.24578.012
Figure 1—figure supplement 1
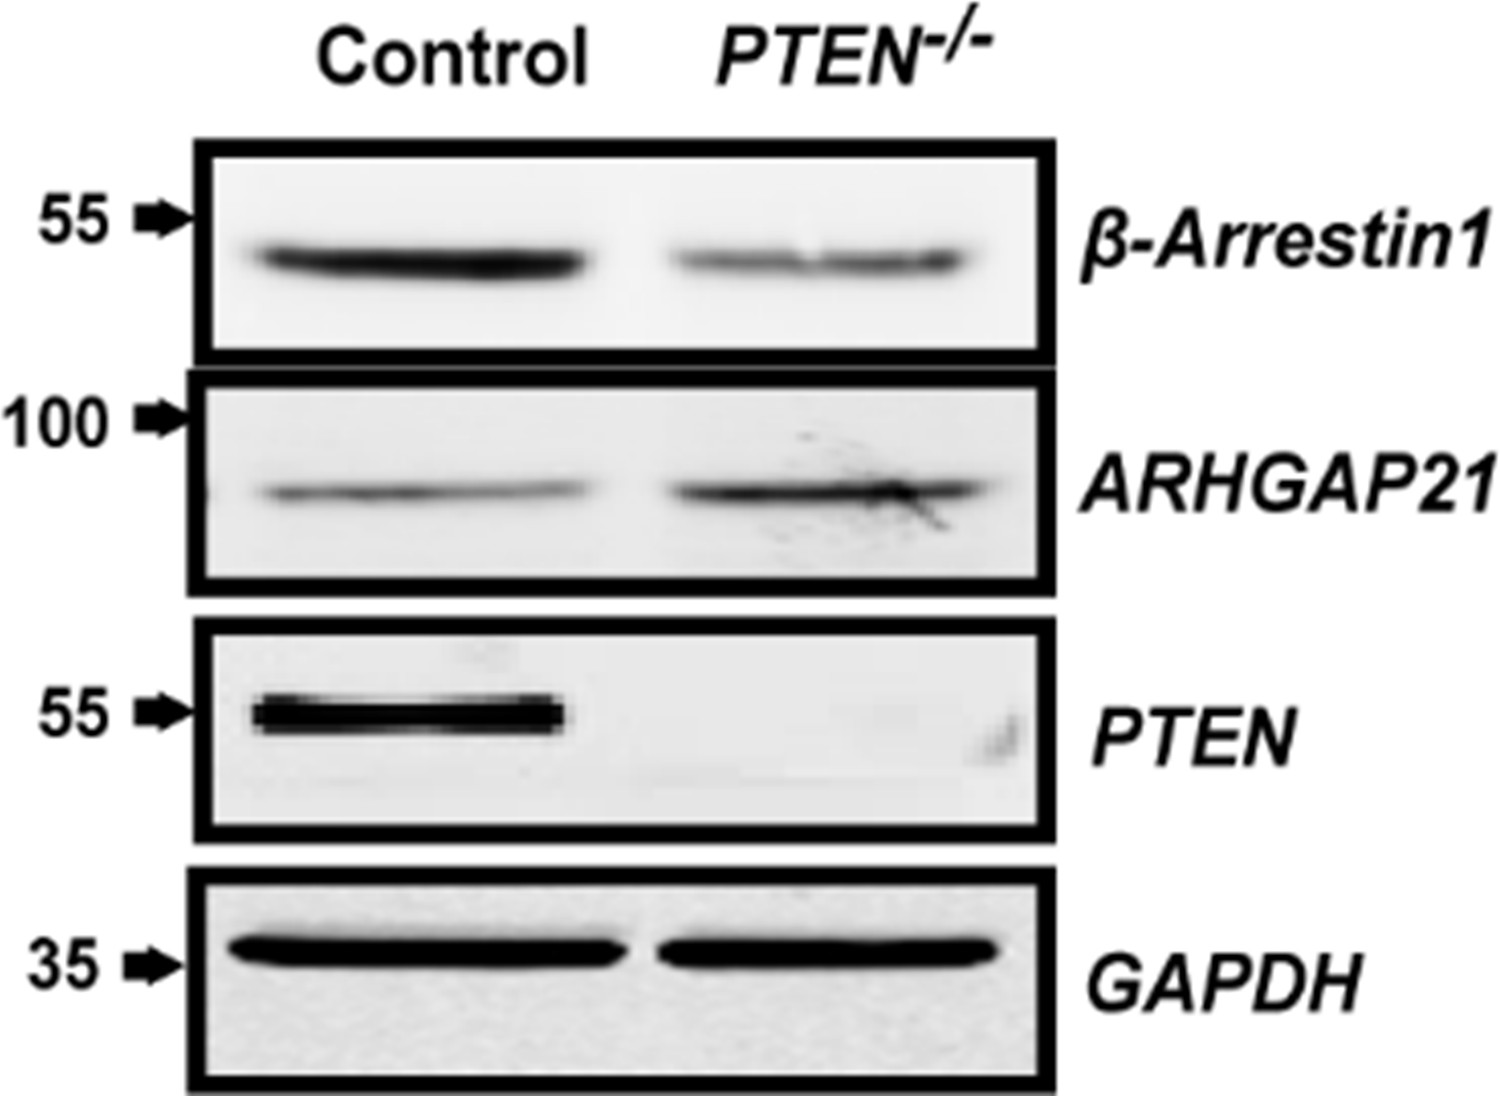
Total β-Arrestin1 and ARHGAP21 expression in control HCT116 and PTEN -/- cell lysates.
GAPDH loading control.
Figure 1—figure supplement 2
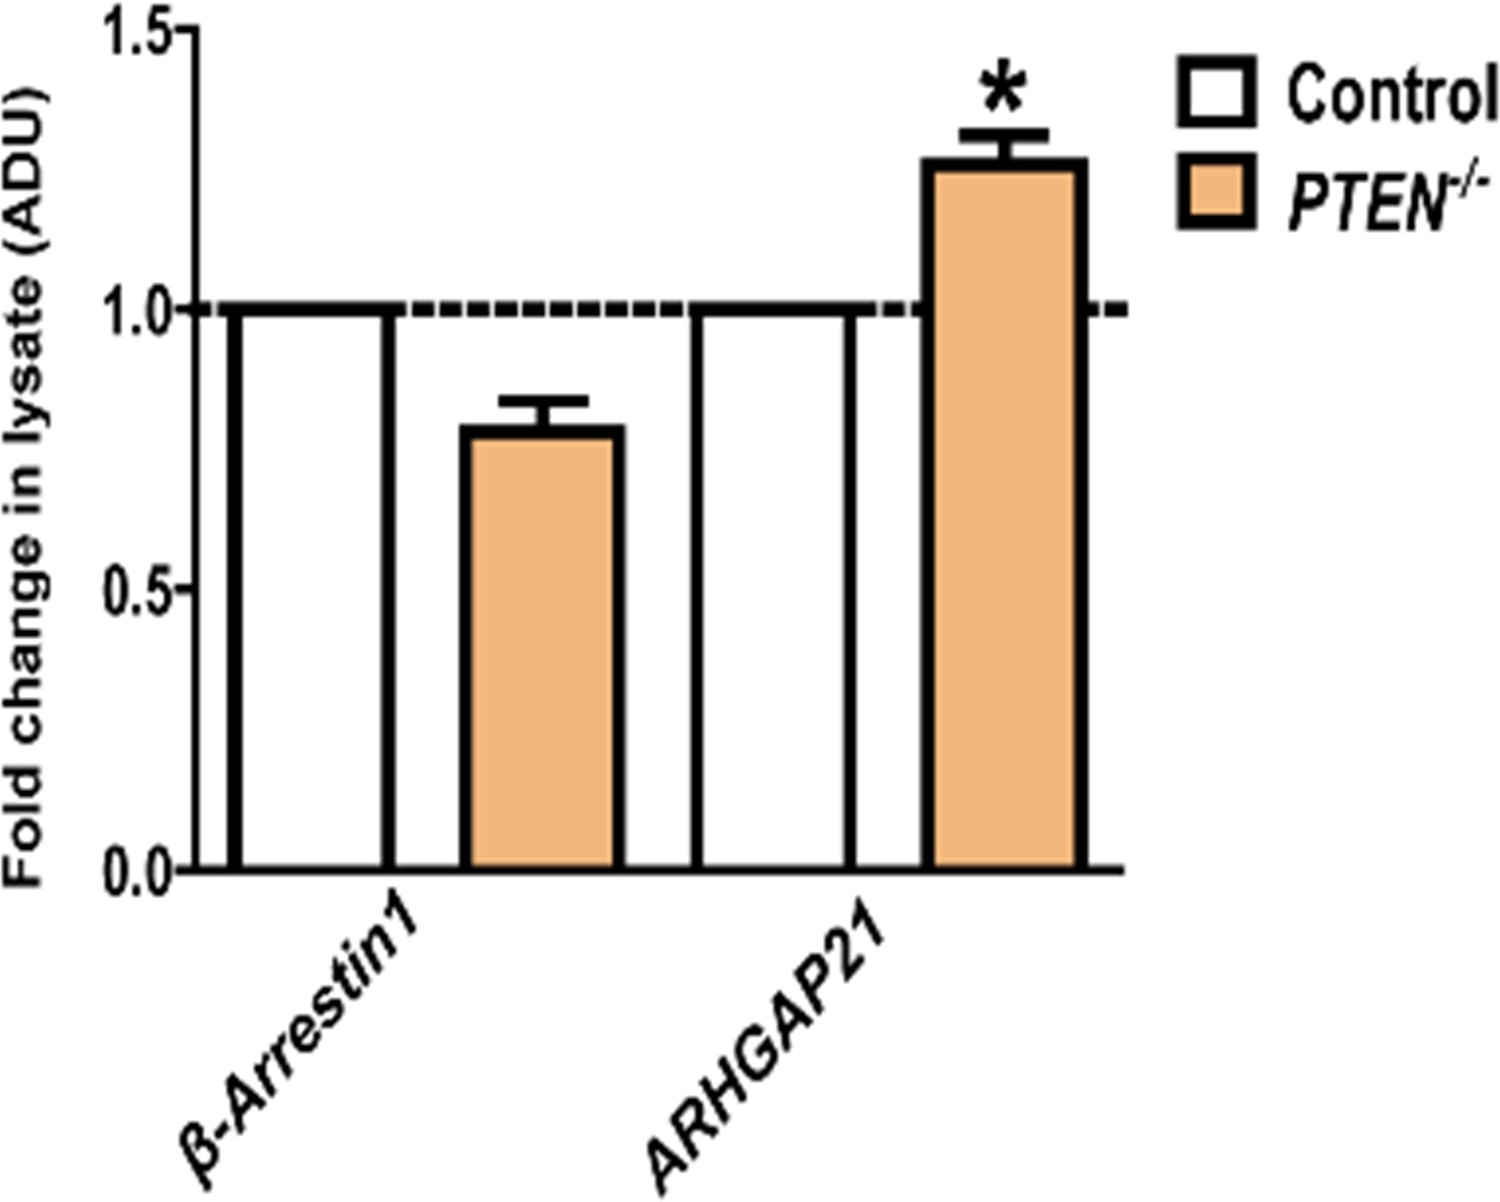
Cell lysate expression of β-Arrestin1 and ARHGAP21 shown in Figure 1—figure supplement 1.
Values in PTEN -/- cells are expressed as fold change relative to HCT116 control - β-Arrestin1 = 0.78 ± 0.06; p=NS (0.06); ARHGAP21 = 1.53 ± 0.09; *p=0.03. Orange bars indicate PTEN -/- cells.
-
Figure 1—figure supplement 2—source data 1
. Figure 1—figure supplement 2 Beta-Arestin1 and ARHGAP21 expression in HCT116 clones -Source data.
- https://doi.org/10.7554/eLife.24578.013
Figure 1—figure supplement 3
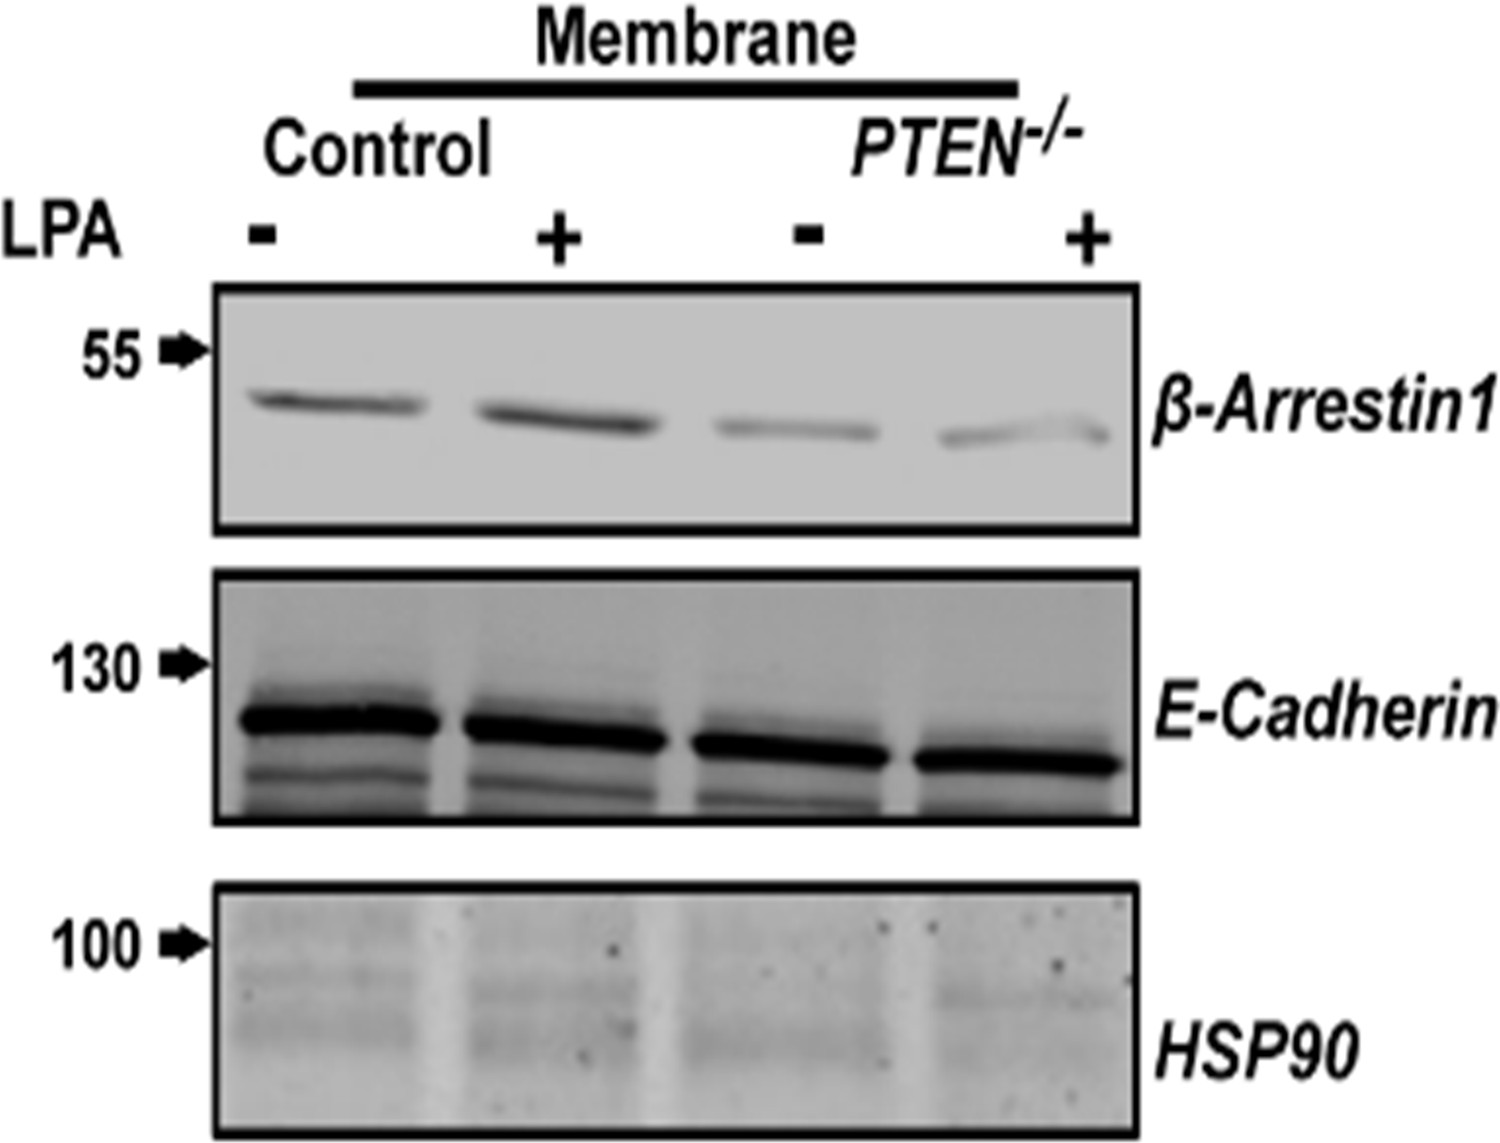
Treatment effects on membrane β-Arrestin1 in HCT116 control vs PTEN -/- cells.
E-Cadherin and HSP90 used as membrane and cytosolic markers, respectively.
Figure 1—figure supplement 4
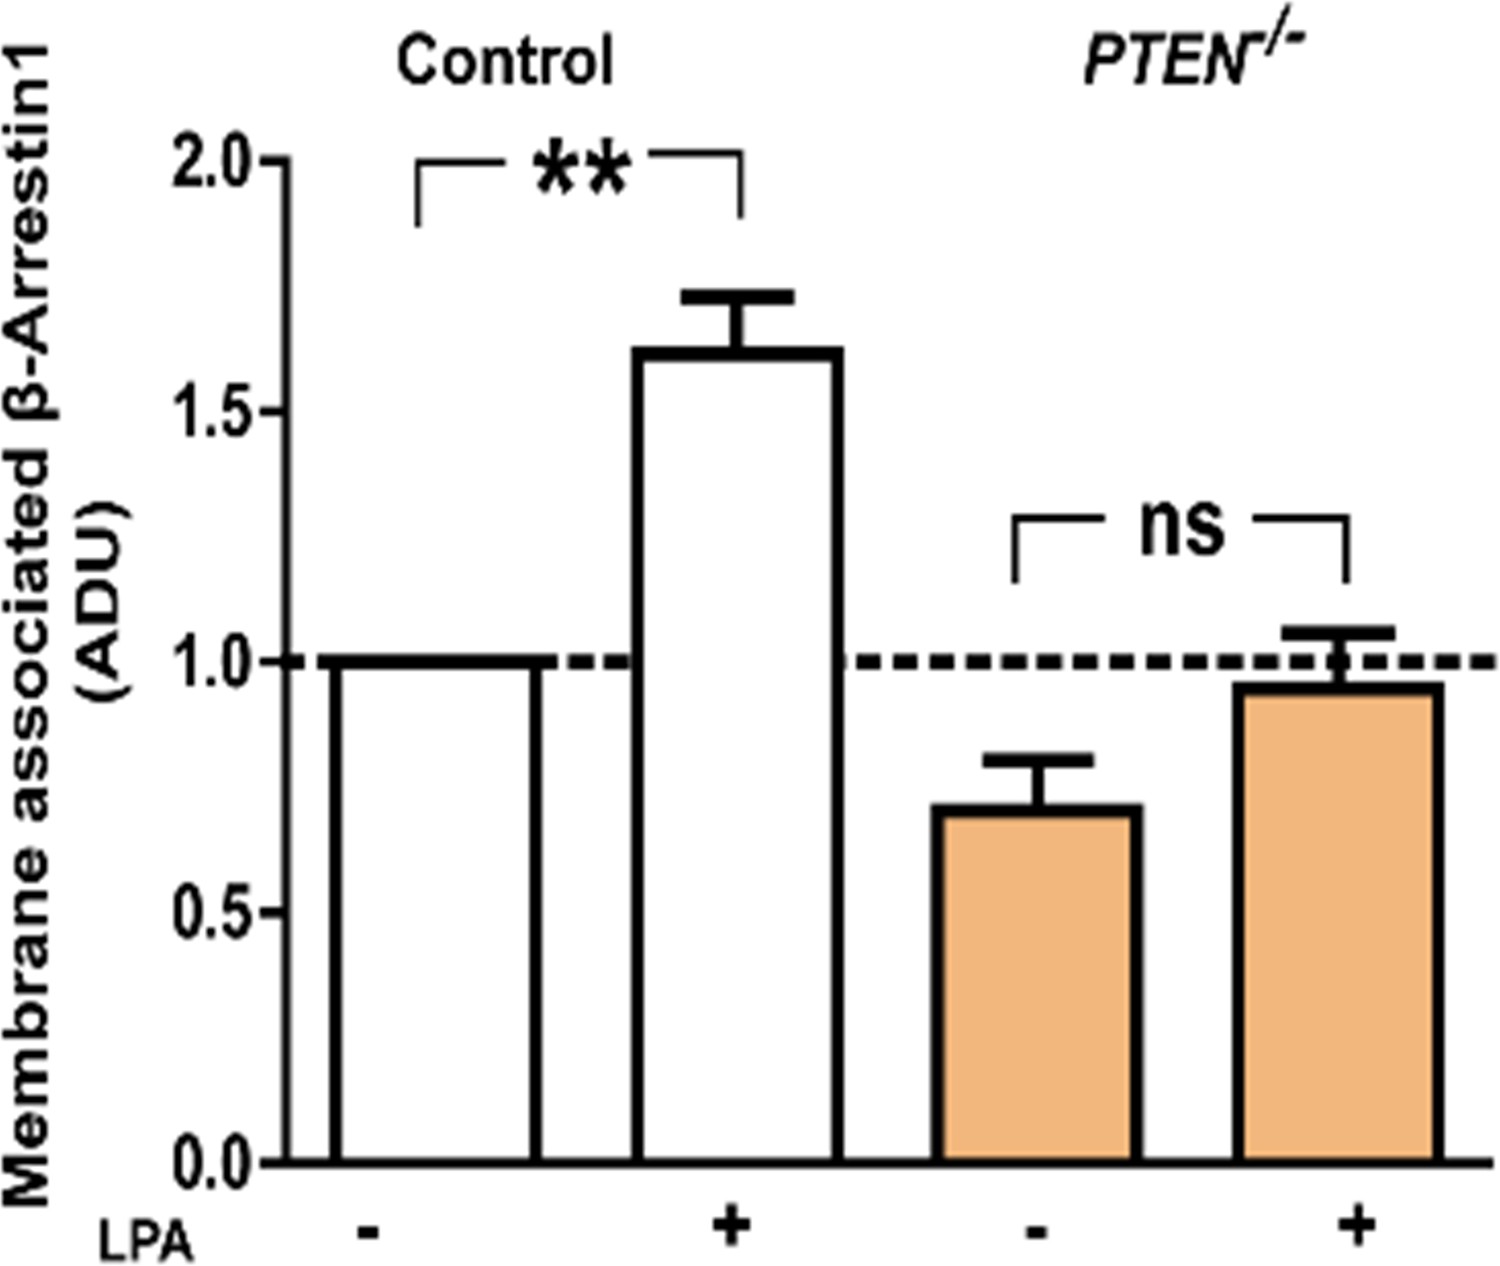
Treatment effects on membrane β-Arrestin1 shown in Figure 1—figure supplement 3.
Fold change of membrane β-Arrestin1 after LPA (+) or VO [vehicle only (-)] treatment; HCT116 control cells (+) vs (-)=1.62 ± 0.11; **p=0.01; PTEN -/- (+) vs PTEN -/- (-)=0.94 ± 0.11 vs 0.70 ± 0.10; p=NS; HCT116 (-) vs PTEN -/- (-); p=NS. Values are expressed as fold change relative to HCT116 (-) control. Membrane values were normalized against total lysate ADU values for each protein.
-
Figure 1—figure supplement 4—source data 1
Figure 1—figure supplement 4 LPA effects on Beta-Arrestin1 in HCT116 clones.
- https://doi.org/10.7554/eLife.24578.014
Figure 1—figure supplement 5
Plasma membrane localization of the β-Arrestin1-mCherry fusion protein in HCT116 control (top two panels) or PTEN -/- cells (bottom two panels) after VO (-) or LPA (+) treatment.
Red and green fluorescence emitted by m-Cherry and Alexa 488 labels correspond to β-Arrestin1 and WGA signals. Colocalization revealed by composite yellow signal in Merge, Z-stack images and overlap of fluorescence intensity curves in line scans. Data analysis by ANOVA or Student’s paired t test. Horizontal yellow bars indicate focal plane.
Figure 1—figure supplement 6

Control mCherry distribution in HCT116 and PTEN -/- cells.
Scale bars (white) 20 µm. Molecular weights indicated by arrows in blots.
Figure 2 with 4 supplements
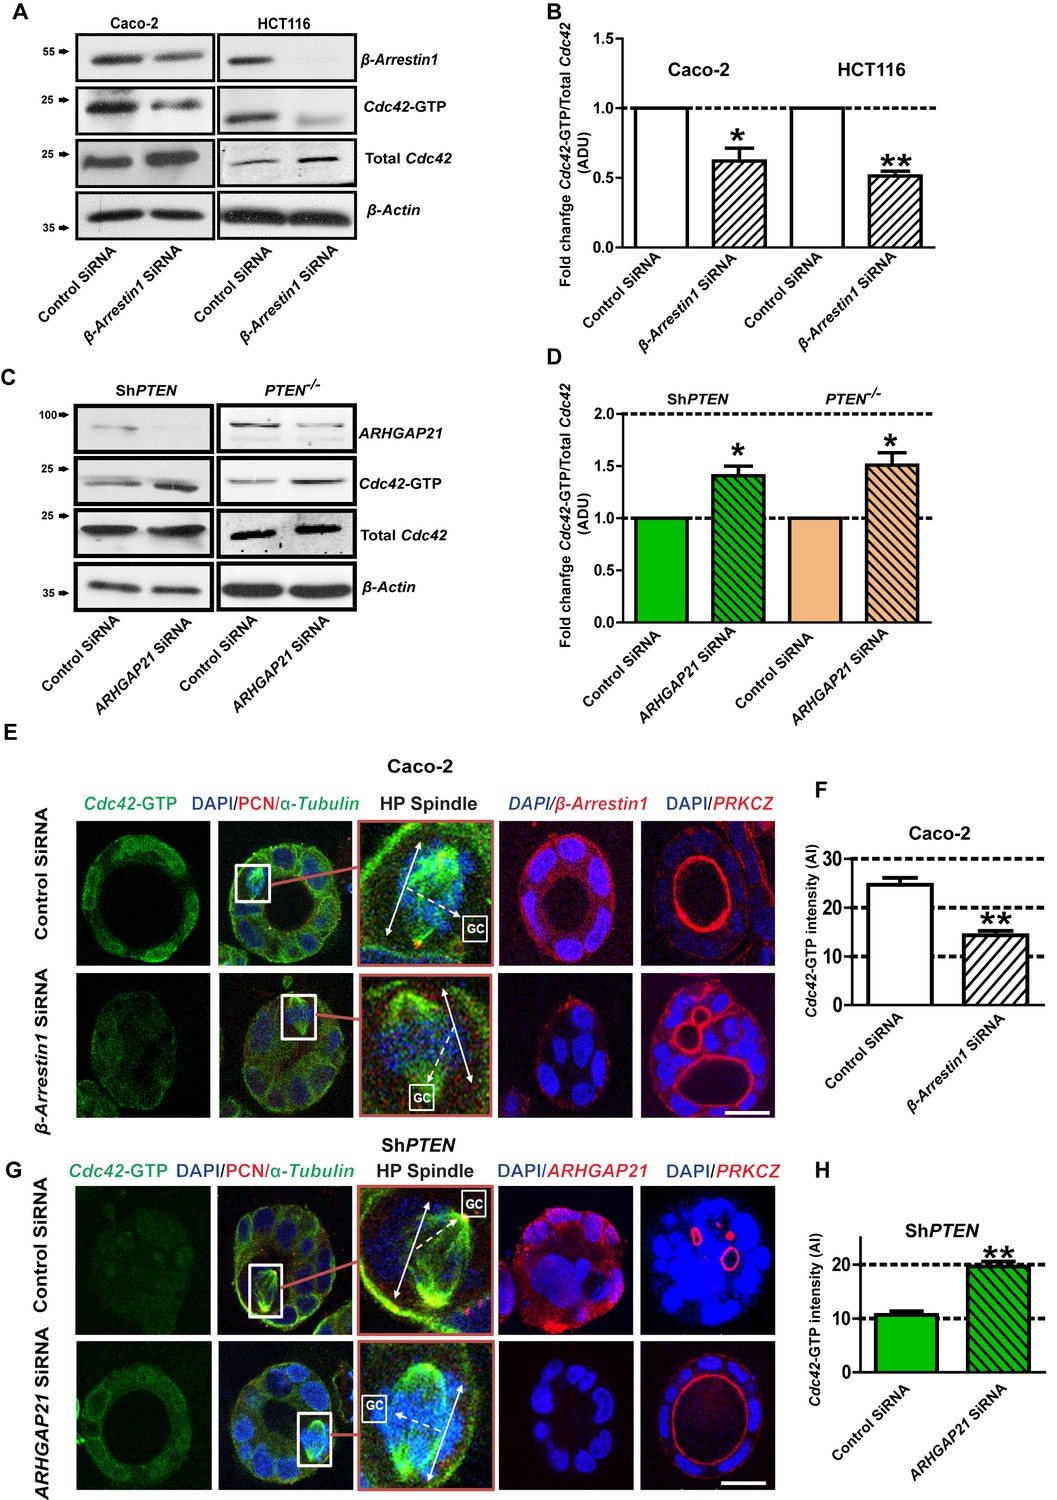
PTEN controls morphogenesis through Cdc42/β-Arrestin1/ARHGAP21 interactions.
(A,B) SiRNA β-Arrestin1 knockdown (KD) suppresses Cdc42-GTP in Caco-2 and HCT116 cells (fold changes = 0.62 ± 0.09;*p=0.03 and 0.51 ± 0.03;**p=0.005 respectively. (C,D) SiRNA ARHGAP21 KD enhances Cdc42-GTP in Caco-2 ShPTEN (ShPTEN) and HCT116 PTEN -/- (PTEN -/-) cells (fold change = 1.41 ± 0.09 and 1.51 ± 0.11, respectively; *p=0.02 for each. Cdc42-GTP ADU was normalized against total Cdc42. (E) SiRNA β-Arrestin1 KD suppresses Cdc42-GTP signal intensity, impairs spindle orientation and inhibits single lumen formation. High-power (HP) spindle views (orange border) enlarge areas within white rectangles and show orientation angles (interrupted white arrows) of spindle planes (double-headed solid white arrows) toward gland centres (GCs). Normal spindle planes are orientated at approximately 900 angles relative to gland centres [GCs] (Jaffe et al., 2008). Summary SiRNA effects on spindle angles relative to GCs are shown in Figure 2—figure supplement 1. (F) Summary SiRNA effects on Cdc42-GTP intensity shown in (E) - control vs β-Arrestin1 SiRNA = 24.67 ± 1.45 vs 14.33 ± 0.88 AI units; **p=0.004. β-Arrestin1 KD also suppresses single central lumen formation in 3D Caco-2 cultures (E; Figure 2—figure supplement 2). (G) SiRNA ARHGAP21 KD increases Cdc42-GTP signal intensity (H), rescues spindle orientation (G, Figure 2—figure supplement 3) and central lumen formation in ShPTEN 3D cultures (G, Figure 2—figure supplement 4). (H) Cdc42-GTP, control vs SiRNA ARHGAP21 KD in ShPTEN cultures = 10.67 ± 0.67 vs=19.67 ± 0.88 AI units; **p<0.01. Assays at 4 days of culture. Imaging Cdc42-GTP [green], pericentrin (PCN) [red], α-Tubulin [green], ARHGAP21 [red], PRKCZ [red], β-Arrestin1 [red] and DAPI [blue]. All experiments conducted in triplicate. All analyses by paired Student’s t test. Scale bars 20 µm. Molecular weights indicated by arrows in blots.
-
Figure 2—source data 1
Source data for Figure 2B.
- https://doi.org/10.7554/eLife.24578.020
-
Figure 2—source data 2
Source data for Figure 2D.
- https://doi.org/10.7554/eLife.24578.021
-
Figure 2—source data 3
Source data for Figure 2F.
- https://doi.org/10.7554/eLife.24578.022
-
Figure 2—source data 4
Source data for Figure 2H.
- https://doi.org/10.7554/eLife.24578.023
Figure 2—figure supplement 1
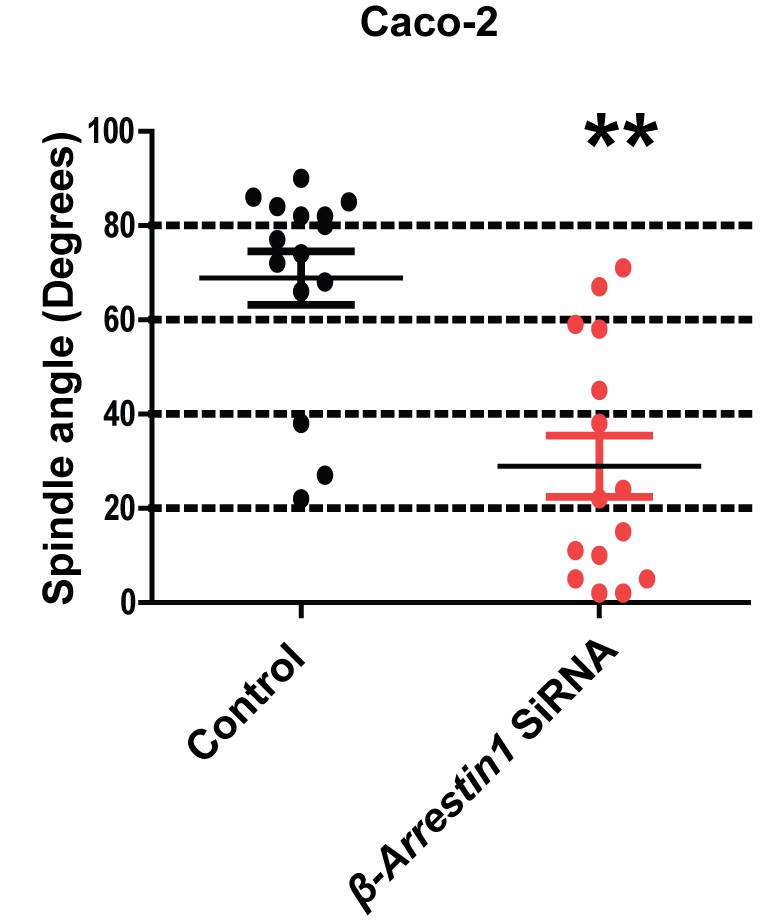
Summary effects of siRNA β-Arrestin1 or ARHGAP21 KD vs control non-targeting SiRNA on mitotic spindle angles and lumen formation in 3D Caco-2 and Caco-2 ShPTEN (ShPTEN) cultures.
Effects of control SiRNA vs β-Arrestin1 SiRNA on spindle angles (68.9 ± 5.600 vs 28.9 ± 6.490; **p<0.01) in 3D Caco-2 cultures. Green bars indicate ShPTEN cultures. All analyses by paired Student’s t test.
-
Figure 2—figure supplement 1—source data 1
Figure 2—figure supplement 1 Spindle angles in Caco-2 after Beta-Arrestin1 KD.
- https://doi.org/10.7554/eLife.24578.024
Figure 2—figure supplement 2
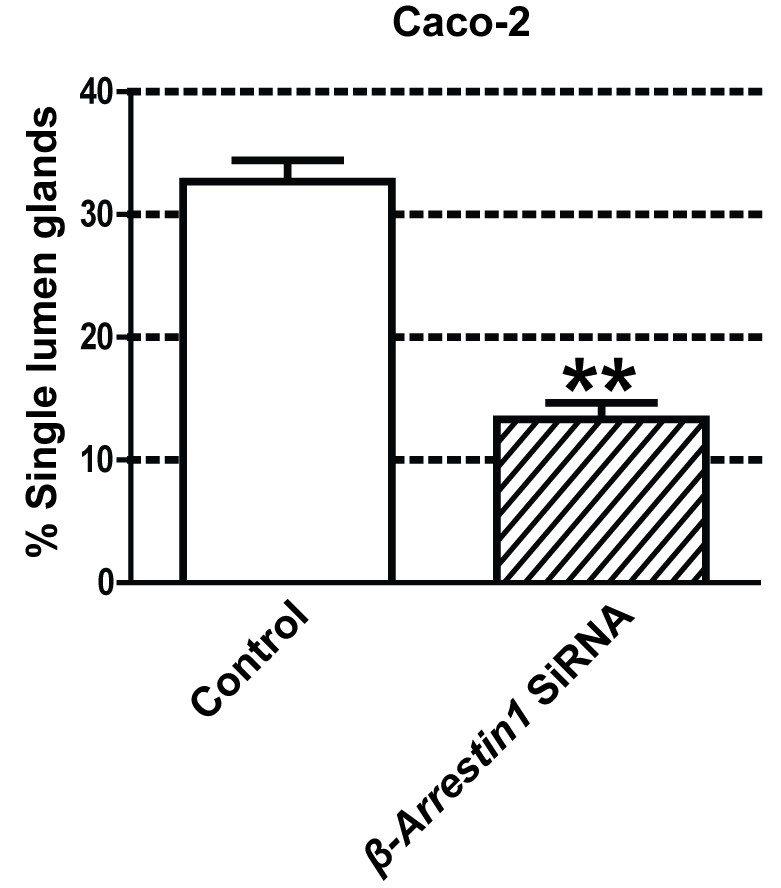
Summary effects of siRNA β-Arrestin1 or ARHGAP21 KD vs control non-targeting SiRNA on mitotic spindle angles and lumen formation in 3D Caco-2 and Caco-2 ShPTEN (ShPTEN) cultures.
Effects of control SiRNA vs β-Arrestin1 SiRNA on percentage single lumen formation (32.67 ± 1.76% vs 12.67 ± 1.76%;**p<0.01) in 3D Caco-2 cultures. Green bars indicate ShPTEN cultures. All analyses by paired Student’s t test.
-
Figure 2—figure supplement 2—source data 1
Figure 2—figure supplement 2 - Single central lumen fomation on Caco-2 after Beta-Arrestin1 KD.
- https://doi.org/10.7554/eLife.24578.025
Figure 2—figure supplement 3
Summary effects of siRNA β-Arrestin1 or ARHGAP21 KD vs control non-targeting SiRNA on mitotic spindle angles and lumen formation in 3D Caco-2 and Caco-2 ShPTEN (ShPTEN) cultures.
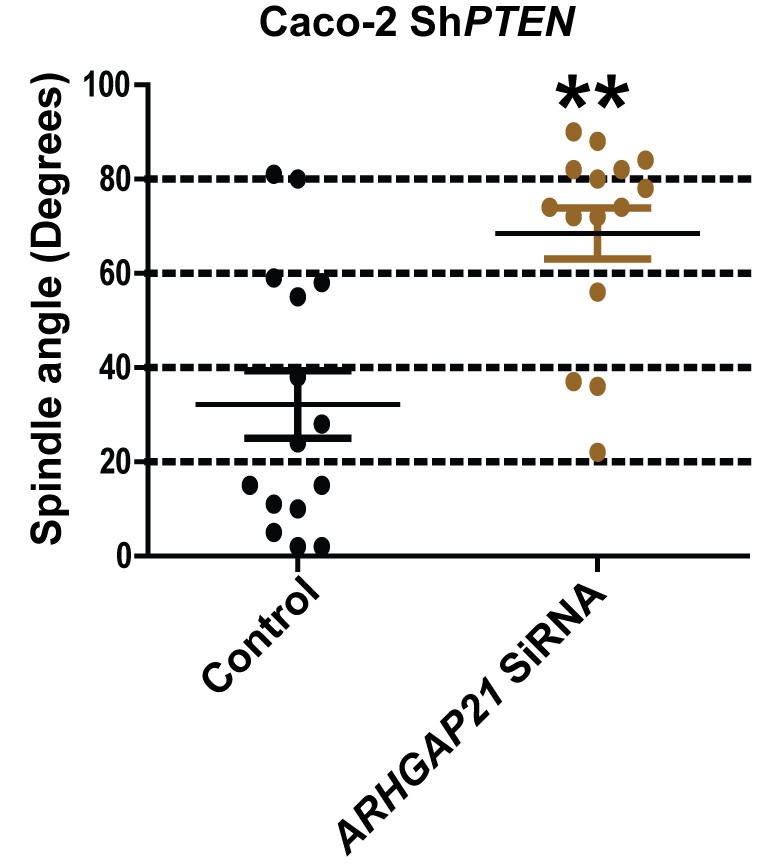
Effects of control SiRNA vs ARHGAP21 SiRNA on spindle angles (32.2 ± 7.17 vs 68.5 ± 5.400’; **p<0.01), in 3D Caco-2 ShPTEN (ShPTEN) cultures. Green bars indicate ShPTEN cultures. All analyses by paired Student’s t test.
-
Figure 2—figure supplement 3—source data 1
Figure 2—figure supplement 3 Spindle angles in ShPTEN after ARHGAP21 KD.
- https://doi.org/10.7554/eLife.24578.026
Figure 2—figure supplement 4
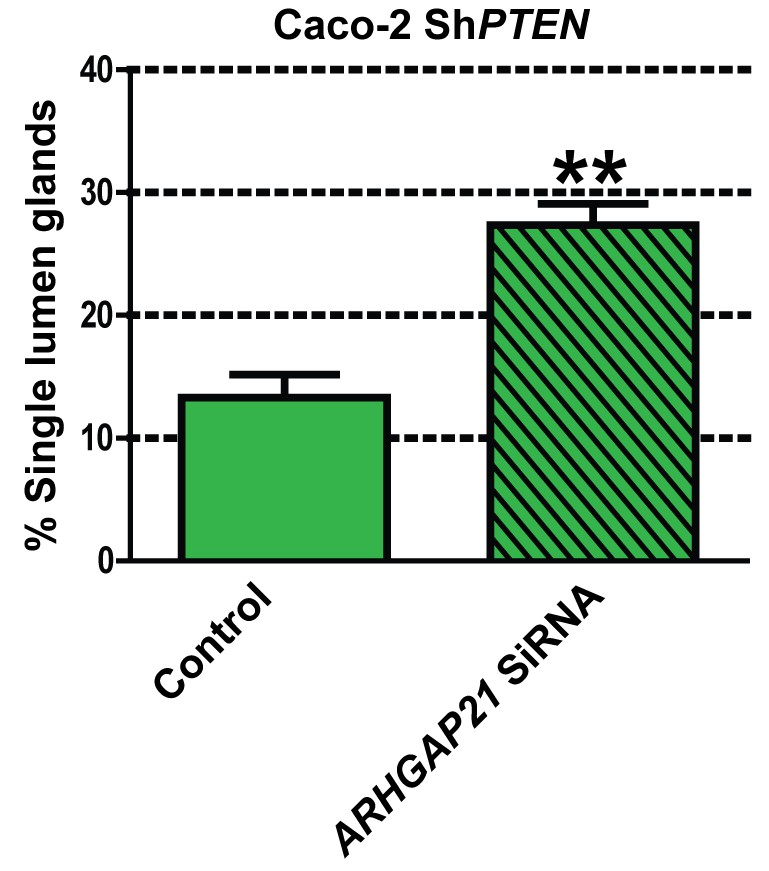
Summary effects of siRNA β-Arrestin1 or ARHGAP21 KD vs control non-targeting SiRNA on mitotic spindle angles and lumen formation in 3D Caco-2 and Caco-2 ShPTEN (ShPTEN) cultures.
Effects of control SiRNA vs ARHGAP21 SiRNA on percentage single lumen formation (13.33 ± 1.33% vs 27.33 ± 1.76%; **p=0.01) in 3D Caco-2 ShPTEN (ShPTEN) cultures. Green bars indicate ShPTEN cultures. All analyses by paired Student’s t test.
-
Figure 2—figure supplement 4—source data 1
Figure 2—figure supplement 4 Single central lumen in ShPTEN after ARHGAP21kd.
- https://doi.org/10.7554/eLife.24578.027
Figure 3 with 5 supplements
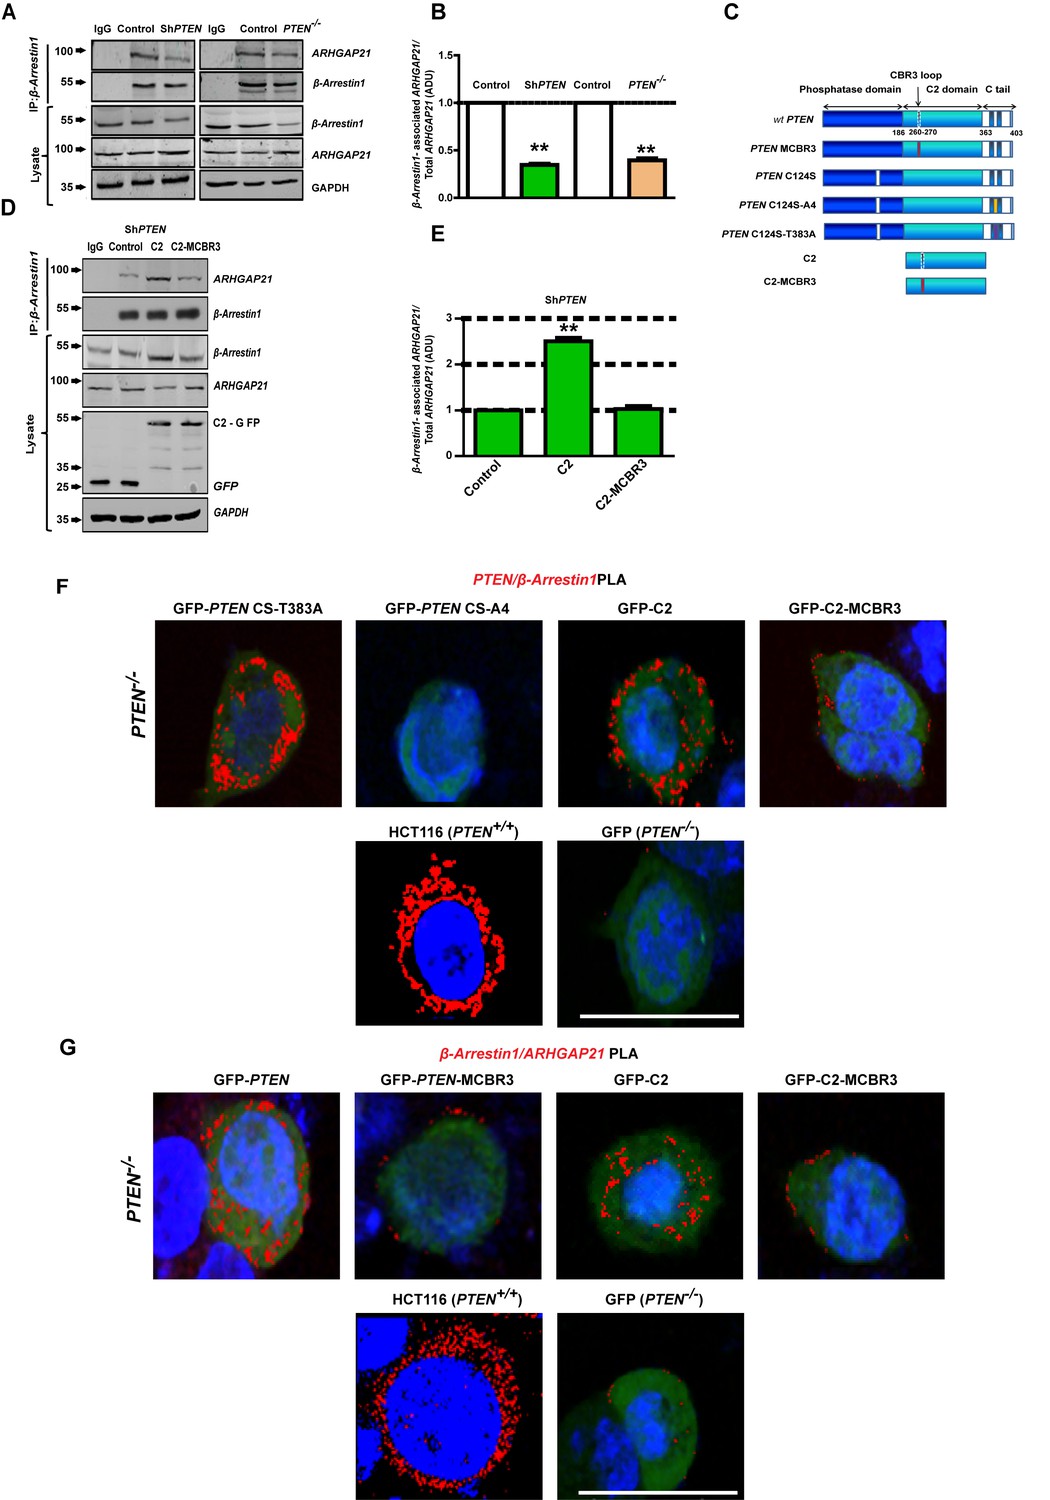
PTEN C2 enhances β-Arrestin1-ARHGAP21 binding.
(A) β-Arrestin1-ARHGAP21 CoIPs in PTEN-expressing and -deficient cells. β-Arrestin1-associated ARHGAP21 shown in top panel against a constant β-Arrestin1 bait signal (second panel). IgG-negative controls. Total β-Arrestin1 and ARHGAP21 in lysates and GAPDH loading controls shown in lower three panels. (B) Summary β-Arrestin1-associated ARHGAP21 in PTEN-deficient (colored bars) vs PTEN-expressing cells (clear bars). Values normalized against total ARHGAP21 = 0.35 ± 0.01;**p<0.01 (ShPTEN) and 0.39 ± 0.02;**p<0.01 (PTEN -/ - cells), respectively. (C) Schematic of GFP-labeled PTEN constructs used (top to bottom - wild type (wt) PTEN; PTEN - MCBR3 membrane binding mutant; catalytically inactive PTEN C124S; PTEN C124S - A4 (CS-A4) and PTEN C124S -T383A (CS-T383A) mutants that lack or retain β-Arrestin1 binding capacity, respectively (Lima-Fernandes et al., 2011), C2 and the C2-MCBR3 membrane binding mutant. (D) β-Arrestin1-associated ARHGAP21 in ShPTEN cells after transfection with GFP-labeled-EV control vs- C2 or -C2-MCBR3 (top panel). β-Arrestin1 bait signal shown in second panel. Total β-Arrestin1 and ARHGAP21 in lysates shown in third and fourth panels. Expression of GFP-labeled C2, C2-MCBR3 and EV and GAPDH loading controls shown in two lowest panels. (E) Summary fold change of β-Arrestin1-associated ARHGAP21 vs EV control; C2 = 2.51 ± 0.08;**p<0.01 or C2-MBCR3 = 1.03 ± 0.06; p=NS. β-Arrestin1-associated ARHGAP21 normalized against total ARHGAP21 in lysate. (F) Proximity ligation assay (PLA) of β-Arrestin1 interactions with PTEN constructs (red fluorescence) in PTEN -/- cells. Top row - GFP-labeled CS-T383A, CS-A4, C2, C2-MCBR3; Bottom row - positive control - HCT116 cells; negative control - PTEN -/- cells transfected with GFP only. (G) β-Arrestin1-ARHGAP21 interactions. Top row PTEN -/- cells transfected with GFP-labeled full-length PTEN, -PTEN-MCBR3, -C2 and -C2-MCBR3; Bottom row - positive control - HCT116 cells; negative control - PTEN -/- cells transfected with GFP only. Scale bars - 20 µm; Molecular weights indicated by arrows in blots.
-
Figure 3—source data 1
Source data for Figure 3B.
- https://doi.org/10.7554/eLife.24578.034
-
Figure 3—source data 2
Source data for Figure 3E.
- https://doi.org/10.7554/eLife.24578.035
Figure 3—figure supplement 1
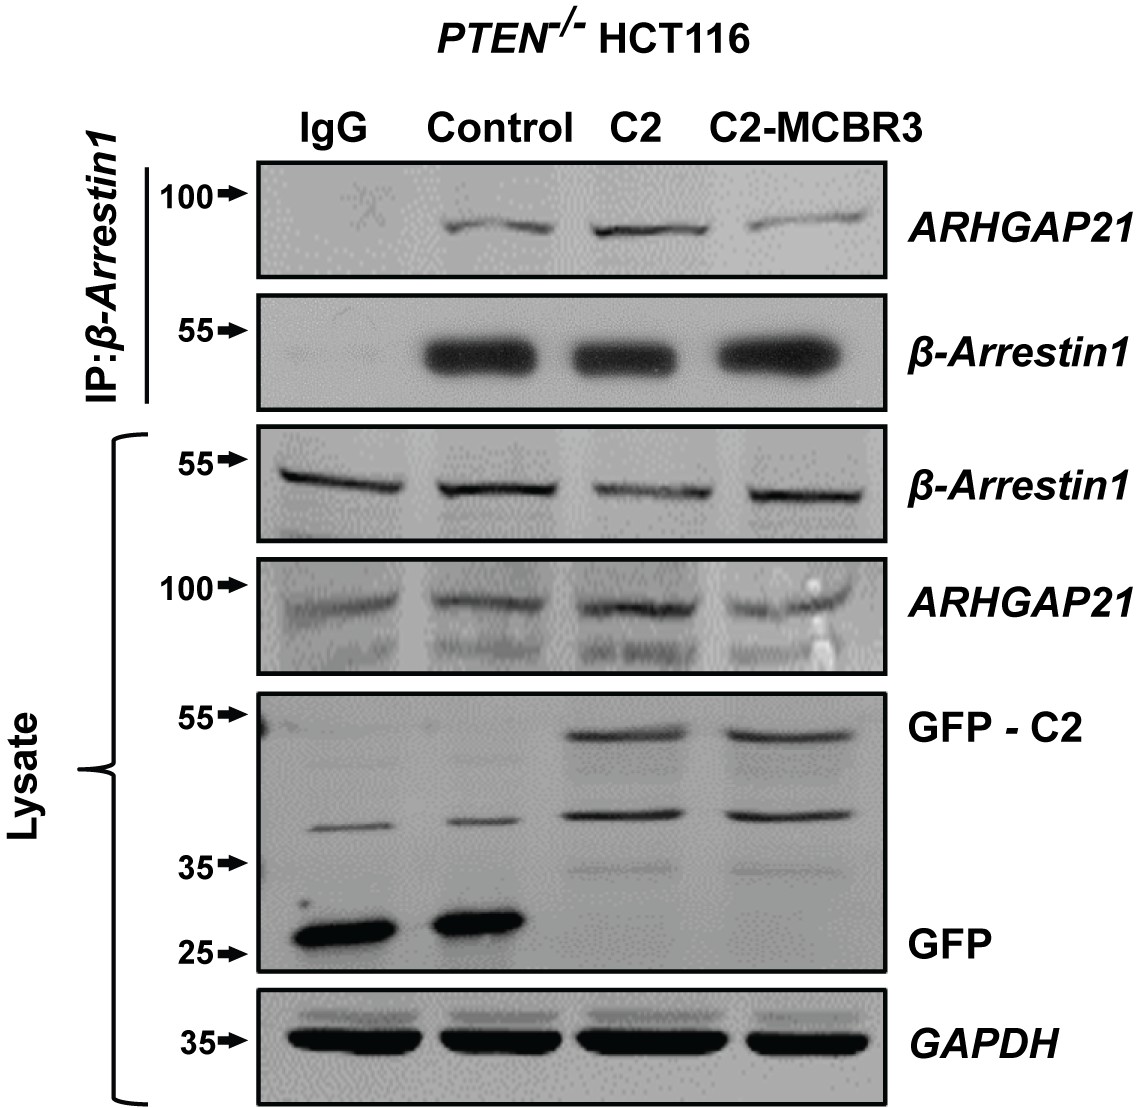
Top panel - Effects of GFP-labelled empty vector (EV) control, C2 and C2-MCBR3-GFP on β-Arrestin1-associated ARHGAP21 in PTEN -/- cells.
Second panel - β-Arrestin1 bait signal. IgG-negative controls shown. Panels 3–6 Total β-Arrestin1, total ARHGAP21, expression of GFP-labeled C2, C2-MCBR3 or EV control constructs and GAPDH loading controls.
Figure 3—figure supplement 2
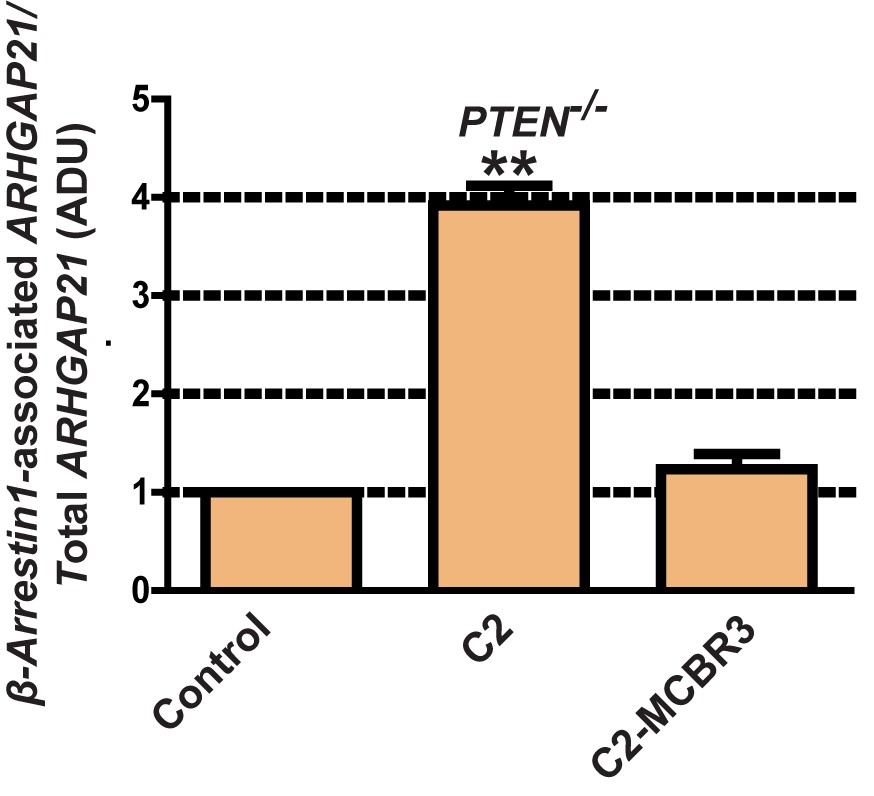
Fold changes of β-Arrestin1-associated ARHGAP21 shown in Figure 3—figure supplement 1 vs EV control.
C2 = 3.92 ± 0.2;**p<0.01; C2-MCBR3 = 1.23 ± 0.15 ADU; C2-MCBR3 vs EV, p=NS. β-Arrestin1-associated ARHGAP21 normalized against total ARHGAP21.
-
Figure 3—figure supplement 2—source data 1
Figure 3—figure supplement 2 Transfection effects on Beta-Arrestin1-associated ARHGAP21
- https://doi.org/10.7554/eLife.24578.036
Figure 3—figure supplement 3

Diagram of Rluc-PTEN-YFP illustrating how conformational changes may alter BRET measurements, although the real orientations of donor and acceptor proteins are not known.
mBRET measurements in HEK cells transfected with Rluc-PTEN-YFP (wt), Rluc-PTEN CS - T383A-YFP or PTEN CS - A4-YFP. Data shown represent mean ± sem for four independent experiments and indicate different conformations between wt PTEN, CS - T383A and CS - A4.
Figure 3—figure supplement 4
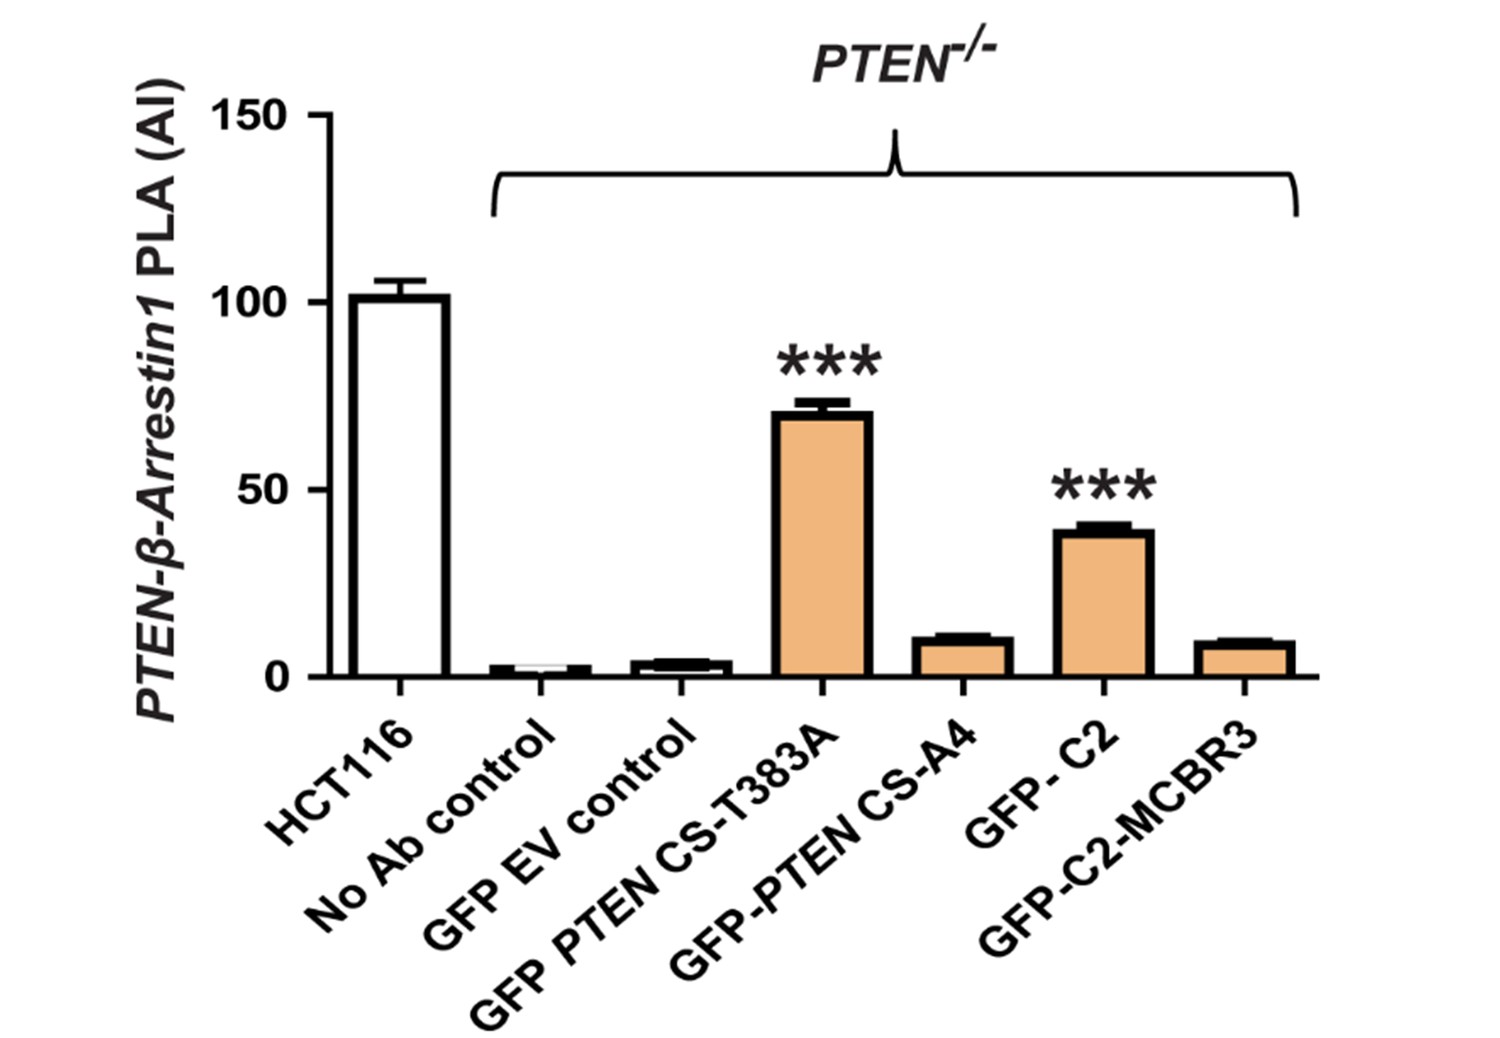
PTEN:β-Arrestin1 interaction AI after transfection of PTEN -/- cells by CS-T383A, CS-A4, C2 or C2-MCBR3.
Vs EV control shown in (F); CS-T383A = 69.83 ± 3.67; CS-A4 = 9.62 ± 0.99; C2 = 38.3 ± 2.09; C2-MCBR3 = 8.66 ± 0.81 AI units;**p<0.01. EV control vs CSTA4 or C2-MCBR3 = NS. Positive control - PTEN:β-Arrestin1 interactions in HCT116 cells = 101 ± 4.9; negative controls - No antibody (2.12 ± 0.25 and PTEN -/- cells transfected with GFP-EV only = 3.21 ± 0.48).
-
Figure 3—figure supplement 4—source data 1
Figure 3—figure supplement 4 PLA analysis of PTEN:Beta-Arrestin1 interactions.
- https://doi.org/10.7554/eLife.24578.037
Figure 3—figure supplement 5

β-Arrestin1-ARHGAP21 interaction AI after transfection of PTEN -/- cells by GFP-labelled C2, C2-MCBR3, wt PTEN or PTEN-MCBR3.
C2 = 44.23 ± 1.92; C2-MCBR3 = 13.47 ± 0.88; wt PTEN = 63.7 ± 2.35; PTEN M-CBR3 = 18.53 ± 0.90 AI units; Positive control - β-Arrestin1:ARHGA21 interactions in HCT116 cells = 122.8 ± 3.8; negative controls - No antibody (0.39 ± 0.09 and PTEN -/- cells transfected with GFP-EV only = 7.58 ± 0.56). ***p<0.001; For C2 and wt PTEN vs EV (***) p<0.001; For PTEN-MCBR3 vs EV; (**) - p<0.01; For EV vs C2-MCBR3 and C2-MCBR3 vs PTEN-MCBR3, p=NS (n = 35 cells for each PLA experimental condition in triplicate). Red, blue and green bars - BRET assays. Statistical analyses were ANOVA with Bonferroni's multiple comparison for BRET assays and ANOVA with Tukey’s post hoc test for densitometry and PLA assays;**p<0.01, ***p<0.001. Molecular weights indicated by arrows in blots.
-
Figure 3—figure supplement 5—source data 1
Figure 3—figure supplement 5 PLA assay of Beta-Arrestine1:ARHGAP21 interactions.
- https://doi.org/10.7554/eLife.24578.038
Figure 4 with 6 supplements

PTEN regulation of juxtamembrane β-Arrestin1 and ARHGAP21.
(A) shows total β-Arrestin1 and ARHGAP21 expression in Caco-2 ShPTEN cell lysates (top two panels) after PTEN C2 (C2), C2-MCBR3 or EV control transfections. Expression levels of transfected GFP-labelled proteins and β-Actin loading controls shown in lower two panels. (B) indicates summary fold changes of total β-Arrestin1; C2 = 1.23 ± 0.02; **p<0.01; MCBR3 = 1.07 ± 0.02; [MCBR3 vs control = NS]. (C) shows respective fold changes of ARHGAP21; C2 = 0.8 ± 0.02; **p<0.01; MCBR3 = 0.95 ± 0.03; [MCBR3 vs control = NS; all values in ADU]. (D) Effects of transfections on cytosol and membrane β-Arrestin1 and ARHGAP21 in Caco-2 ShPTEN (ShPTEN) cells (top two panels). Expression levels of transfected GFP-labelled proteins and E-Cadherin and HSP90 membrane and cytosolic markers shown in lower three panels. (E, F) Fold change of β-Arrestin1 and ARHGAP21 expression induced in the membrane fraction. (E) β-Arrestin1, C2 = 1.25 ± 0.05; *p=0.04 and (F) ARHGAP21 = 0.53 ± 0.09; *p=0.03. β-Arrestin1 and ARHGAP21 ADU values normalized against total lysate ADU for each protein. (G) β-Arrestin1-associated ARHGAP21 induced in ShPTEN membrane fractions by C2, C2-MCBR3 vs EV control transfections (top panel). β-Arrestin1 bait signal shown in second panel. Total β-Arrestin1 and ARHGAP21 in lysates shown in third and fourth panels. Expression of GFP-labeled C2, C2-MCBR3, EV and E-Cadherin membrane marker shown in lower three panels. (H) Fold changes of β-Arrestin1-associated ARHGAP21 normalized against total ARHGAP21 in the membrane fraction (ADU) - C2 = 6.27 ± 0.51; ***p<0.001; MCBR3 = 1.25 ± 0.15; [MCBR3 vs control = NS]. (I) β-Arrestin1-associated ARHGAP21 ADU after expression of C2, C2-MCBR3, wt PTEN or PTEN-MCBR3 vs EV control in PTEN -/- cell membrane fractions (top panel). β-Arrestin1 bait signal, total lysate expression of each protein, expression of GFP-labelled EV or C2 domain constructs and E-Cadherin membrane marker shown in lower five panels. (J) Summary fold changes of β-Arrestin1-associated ARHGAP21 normalized against total membrane ARHGAP21; C2 = 7.33 ± 0.64; C2-MCBR3 = 2.5 ± 0.35; PTEN = 12.93 ± 0.19; PTEN MCBR3 = 3.15 ± 0.21 ADU; control vs C2 or PTEN, ***p<0.001; control vs C2-MCBR3 (NS). Control vs PTEN-MCBR3 = *p<0.05. Analyses by ANOVA, Tukey post hoc or Student’s paired test. Molecular weights indicated by arrows in blots.
-
Figure 4—source data 1
Source data for Figure 4B.
- https://doi.org/10.7554/eLife.24578.046
-
Figure 4—source data 2
Source data for Figure 4C.
- https://doi.org/10.7554/eLife.24578.047
-
Figure 4—source data 3
Source data for Figure 4E.
- https://doi.org/10.7554/eLife.24578.048
-
Figure 4—source data 4
Source data for Figure 4F.
- https://doi.org/10.7554/eLife.24578.049
-
Figure 4—source data 5
Source data for Figure 4H.
- https://doi.org/10.7554/eLife.24578.050
-
Figure 4—source data 6
Source data for Figure 4J.
- https://doi.org/10.7554/eLife.24578.051
Figure 4—figure supplement 1
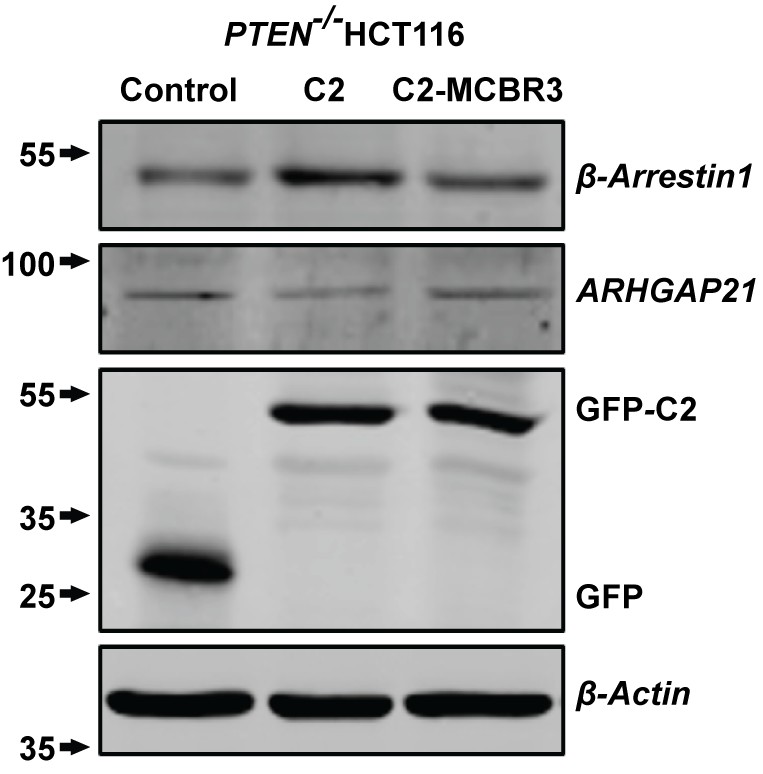
Total β-Arrestin1 and ARHGAP21 expression (top two panels) in.
PTEN -/- cell lysates after C2, C2-MCBR3 or EV control transfections. Expression levels of transfected GFP-labeled proteins and β-Actin loading controls shown in lower two panels.
Figure 4—figure supplement 2
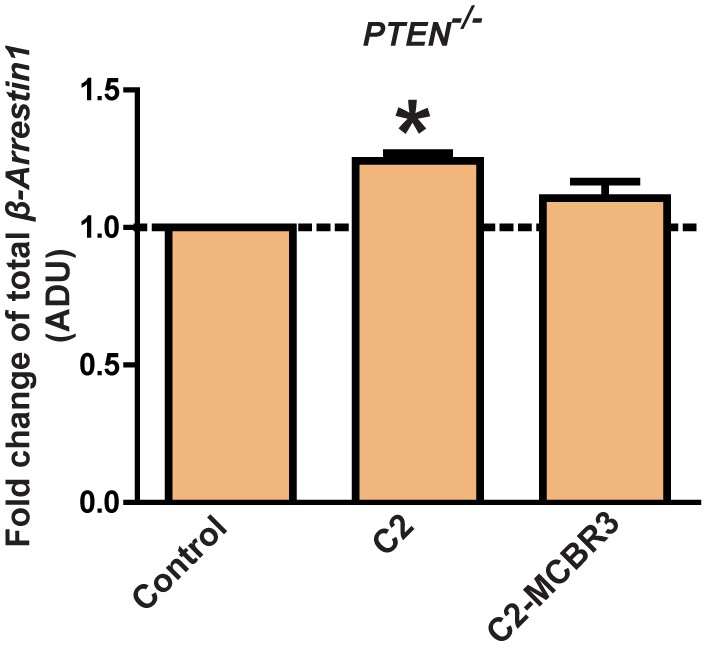
Fold changes of β-Arrestin1 - C2 = 1.24 ± 0.03; *p<0.05; C2-MCBR3 = 1.11 ± 0.06 [MCBR3 vs control = NS].
https://doi.org/10.7554/eLife.24578.041-
Figure 4—figure supplement 2—source data 1
Figure 4—figure supplement 2 Transfection effects on Beta-Arrestin1 in PTEN-/- cells.
- https://doi.org/10.7554/eLife.24578.052
Figure 4—figure supplement 3
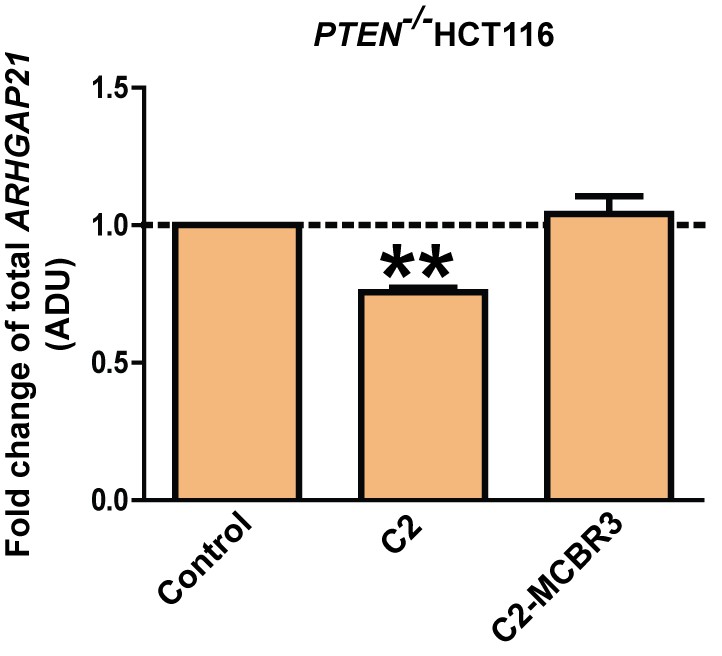
Fold changes of ARHGAP21.
C2 = 0.76 ± 0.02; **p<0.01; MCBR3 = 1.04 ± 0.06; [MCBR3 vs control = NS].
-
Figure 4—figure supplement 3—source data 1
Figure 4—figure supplement 3 Transfection effects on ARHGAP21 in PTEN-/- HCT116 cells.
- https://doi.org/10.7554/eLife.24578.053
Figure 4—figure supplement 4
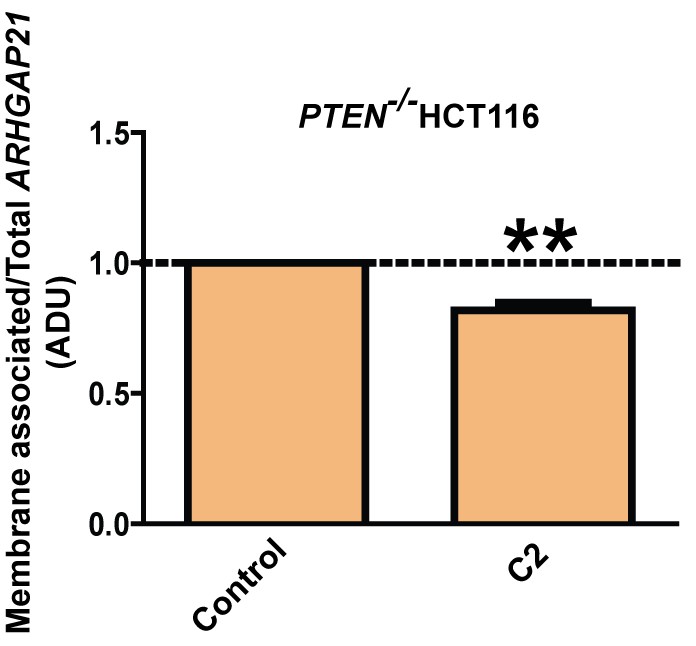
Fold changes of membrane ARHGAP21 (0.82 ± 0.03;**p<0.01).
ARHGAP21 expression values in membrane fractions were normalized against total expression of each protein. Molecular weights indicated by arrows in blots. Analyses by one-way ANOVA with Tukey post hoc test or Student’s paired t test.
Figure 4—figure supplement 5
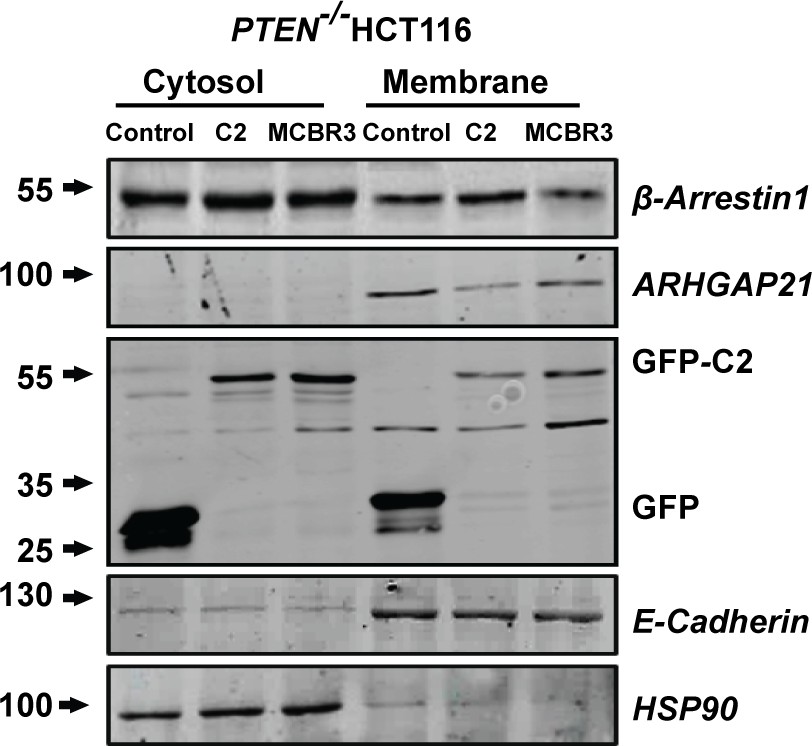
Effects of transfection on cytosol and membrane β-Arrestin1 and ARHGAP21 in PTEN -/- cells (top two panels).
Expression levels of transfected GFP-labeled proteins and E-Cadherin and HSP90 membrane and cytosolic markers shown in lower three panels.
-
Figure 4—figure supplement 5—source data 1
Figure 4—figure supplement 5 Membrane Beta-Arrestin1 in PTEN-/- cells - Source data.
- https://doi.org/10.7554/eLife.24578.054
Figure 4—figure supplement 6
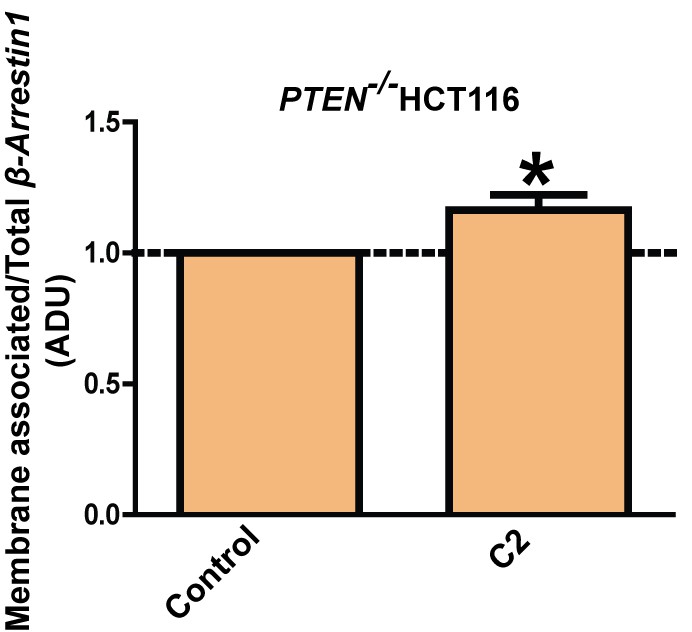
Fold changes of membrane β-Arrestin1 (1.16 ± 0.03; *p=0.04).
β-Arrestin1 expression values in membrane fractions were normalized against total expression of each protein. Molecular weights indicated by arrows in blots. Analyses by one-way ANOVA with Tukey post hoc test or Student’s paired t test.
-
Figure 4—figure supplement 6—source data 1
Figure 4—figure supplement 6 - Transfection effects on Membrane ARHGAP21in PTEN-/- cells.
- https://doi.org/10.7554/eLife.24578.055
Figure 5 with 6 supplements
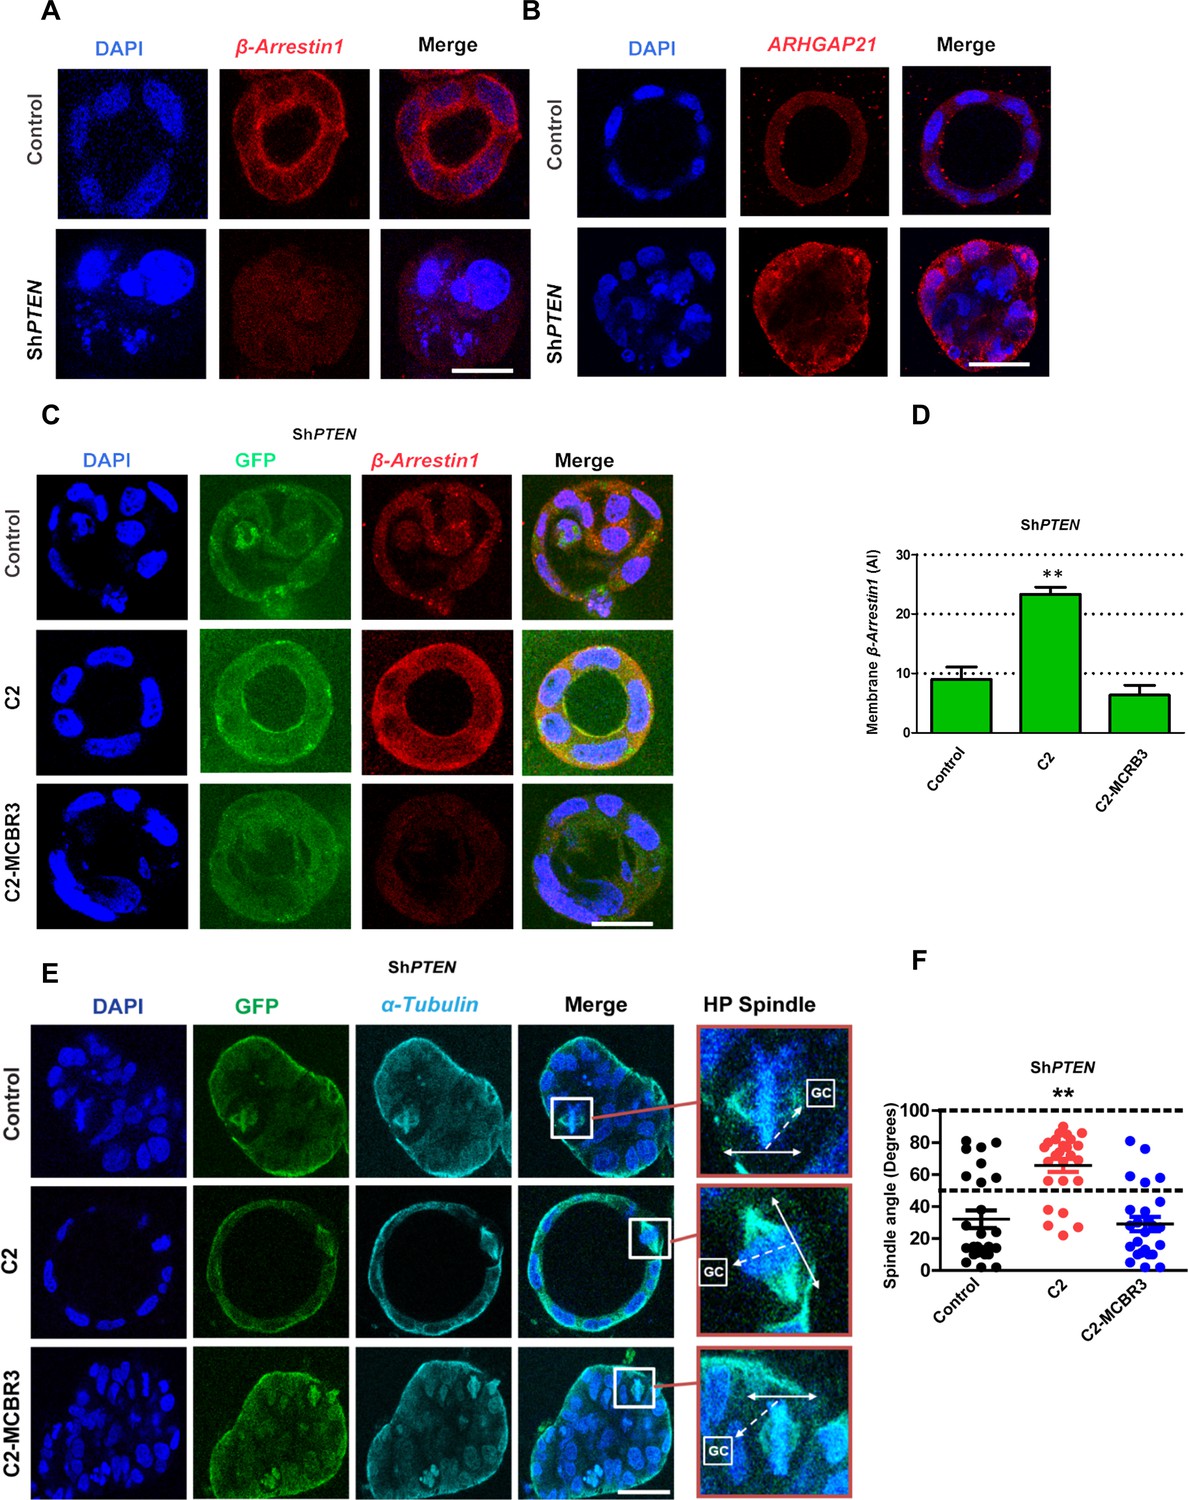
PTEN controls mitotic spindle orientation and 3D morphogenesis by noncatalytic regulation of β-Arrestin1.
(A) β-Arrestin1 and (B) ARHGAP21 immunofluorescence intensity in 3D control Caco-2 and ShPTEN cultures. (C) Effects of C2 vs C2-MCBR3 expression on membrane β-Arrestin1 immunoreactivity in ShPTEN cultures. (D) Summary cell membrane β-Arrestin1 immunoreactivity AI; EV control vs C2 vs C2-MCBR3 = 9.0 ± 2.08 vs 23.3 ± 1.20 vs 6.33 ± 1.67 AI;**p<0.01, control vs C2-MCBR3 = NS. (E) Effects of C2 vs C2-MCBR3 expression on spindle orientation. High-power (HP) spindle views (orange border) enlarge areas within white rectangles and show orientation angles (interrupted white arrows) of spindle planes (double-headed solid white arrows) toward gland centres (GCs). (F) Summary spindle angles relative to GCs in 3D ShPTEN cultures after transfection (● – Control = 32.08 ± 5.50 vs ● - C2 = 65.72 ± 4.10; **p<0.01 vs ● - MCBR3 = 29.1 ± 4.40; [MCBR3 vs control = NS], One-way ANOVA; **p<0.01, Tukey post hoc test. Imaging - DAPI [blue], β-Arrestin1 (A,C) red, ARHGAP21, (B) [red], GFP [green] and α-Tubulin (E) [cyan]. Scale bars = 20 µm.
-
Figure 5—source data 1
Source data for Figure 5D.
- https://doi.org/10.7554/eLife.24578.063
-
Figure 5—source data 2
Source data for Figure 5F.
- https://doi.org/10.7554/eLife.24578.064
Figure 5—figure supplement 1

Summary β-Arrestin1 immunoreactivity (AI) in control Caco-2 vs ShPTEN organotypic cultures in Figure 5A = 24.3 ± 4.1 vs 11.00 ± 1.16;*p=0.04.
https://doi.org/10.7554/eLife.24578.057-
Figure 5—figure supplement 1—source data 1
Figure 5—figure supplement 1 - Beta-Arrestin 1 intensity in Caco-2 and ShPTEN.
- https://doi.org/10.7554/eLife.24578.065
Figure 5—figure supplement 2
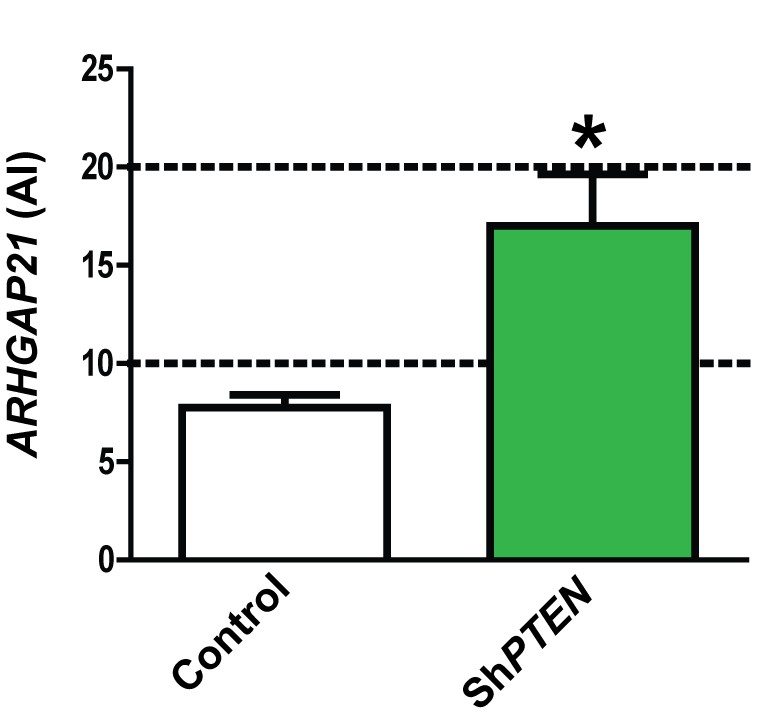
ARHGAP21 immunoreactivity (AI) in control Caco-2 vs ShPTEN organotypic cultures in Figure 5B = 8.0 ± 0.58 vs 17.0 ± 2.64 AI; *p=0.02.
https://doi.org/10.7554/eLife.24578.058-
Figure 5—figure supplement 2—source data 1
Figure 5—figure supplement 2 ARHGAP21 intensity in Caco-2 and ShPTEN glands.
- https://doi.org/10.7554/eLife.24578.066
Figure 5—figure supplement 3
Effects of expression C2 or C2-MCBR3 vs EV control on lumen formation in ShPTEN cultures.
https://doi.org/10.7554/eLife.24578.059
Figure 5—figure supplement 4
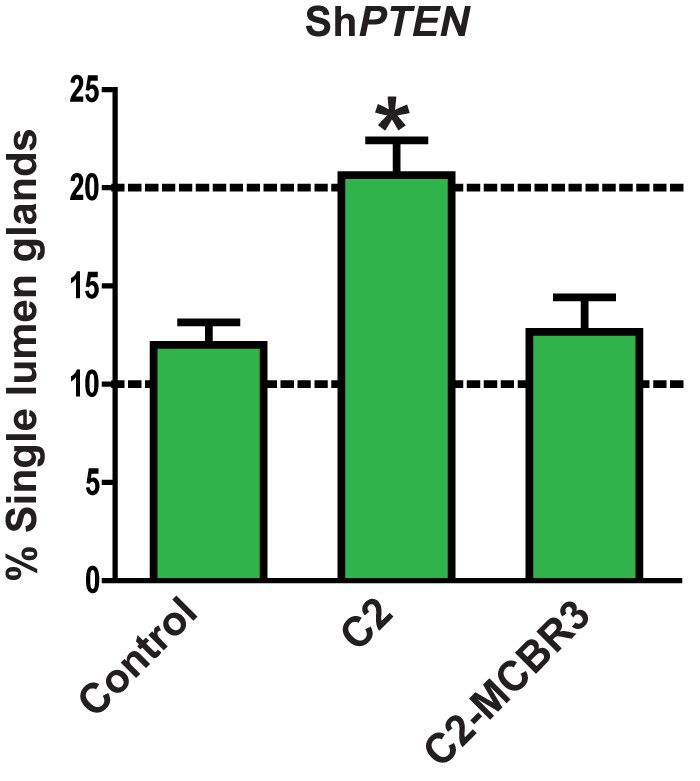
Effects of expression C2 or C2-MCBR3 vs EV control on lumen formation in ShPTEN cultures.
Indicates percentage ShPTEN glands with single central lumens after transfection, control = 12.0 ± 1.15%; C2 = 20.67 ± 1.76%; *p<0.05; MCBR3 = 12.67 ± 1.76%; [MCBR3 vs EV = NS].
-
Figure 5—figure supplement 4—source data 1
Figure 5—figure supplement 4 Transfection effects on single lumen formation in ShPTEN.
- https://doi.org/10.7554/eLife.24578.067
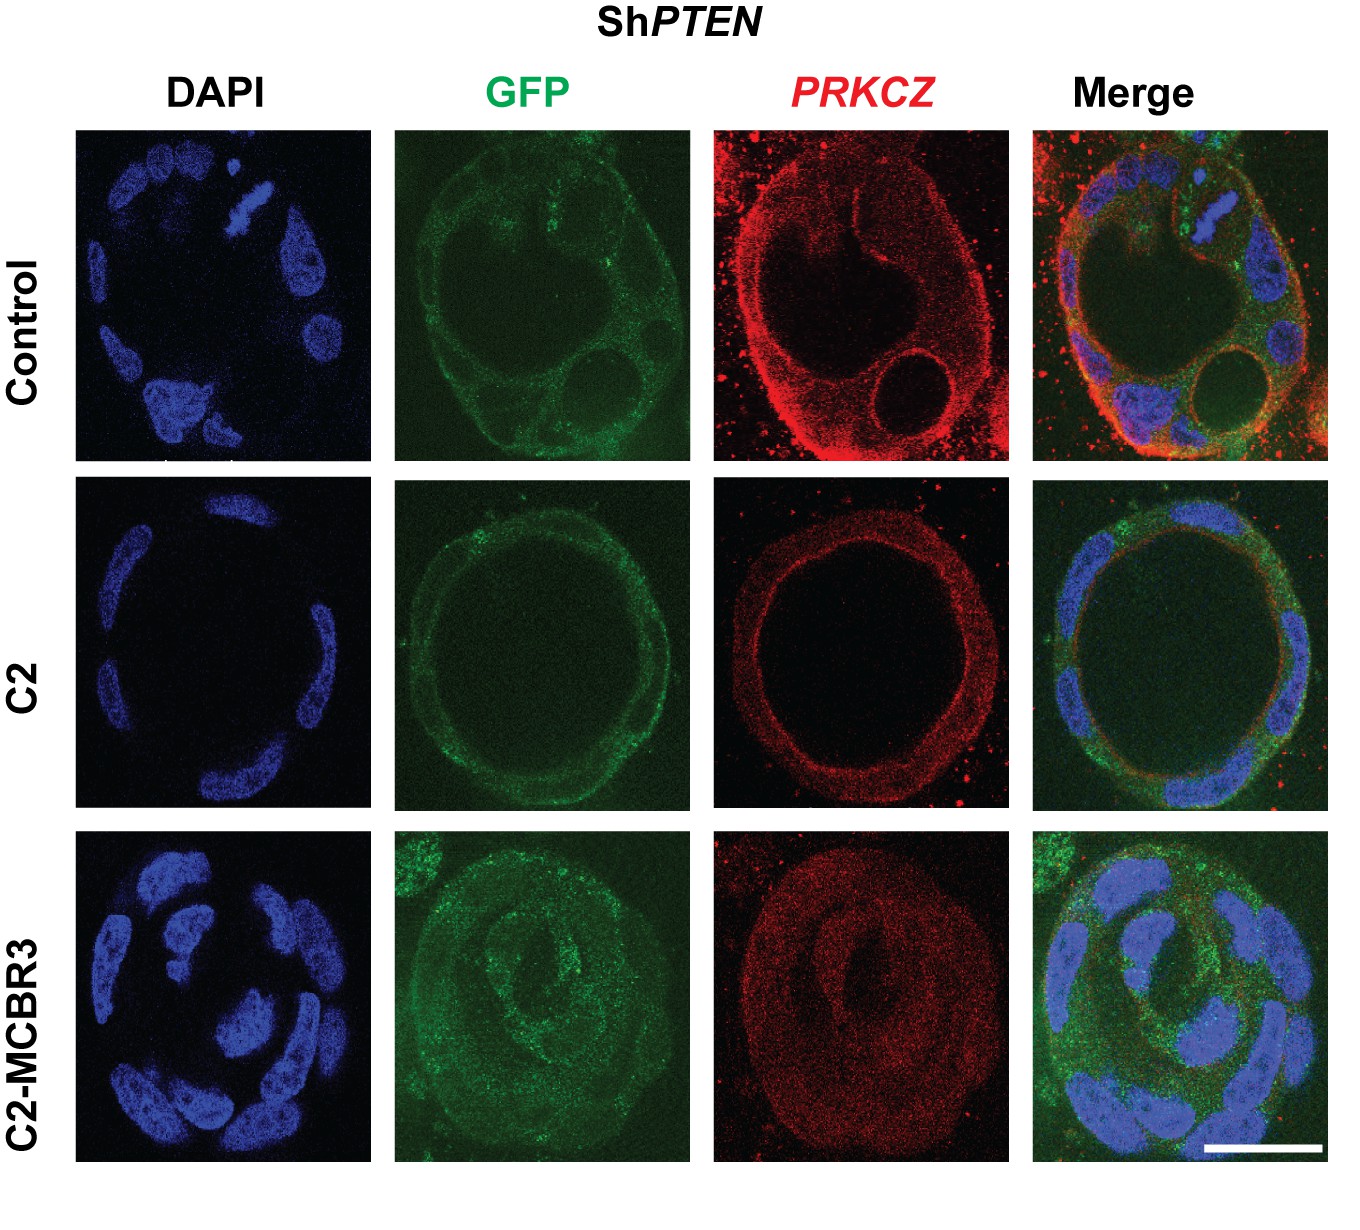
Figure 5—figure supplement 5
Effects of ShRNA-resistant (shR) PTEN or EV control on lumen formation in ShPTEN cultures.
https://doi.org/10.7554/eLife.24578.061
Figure 5—figure supplement 6

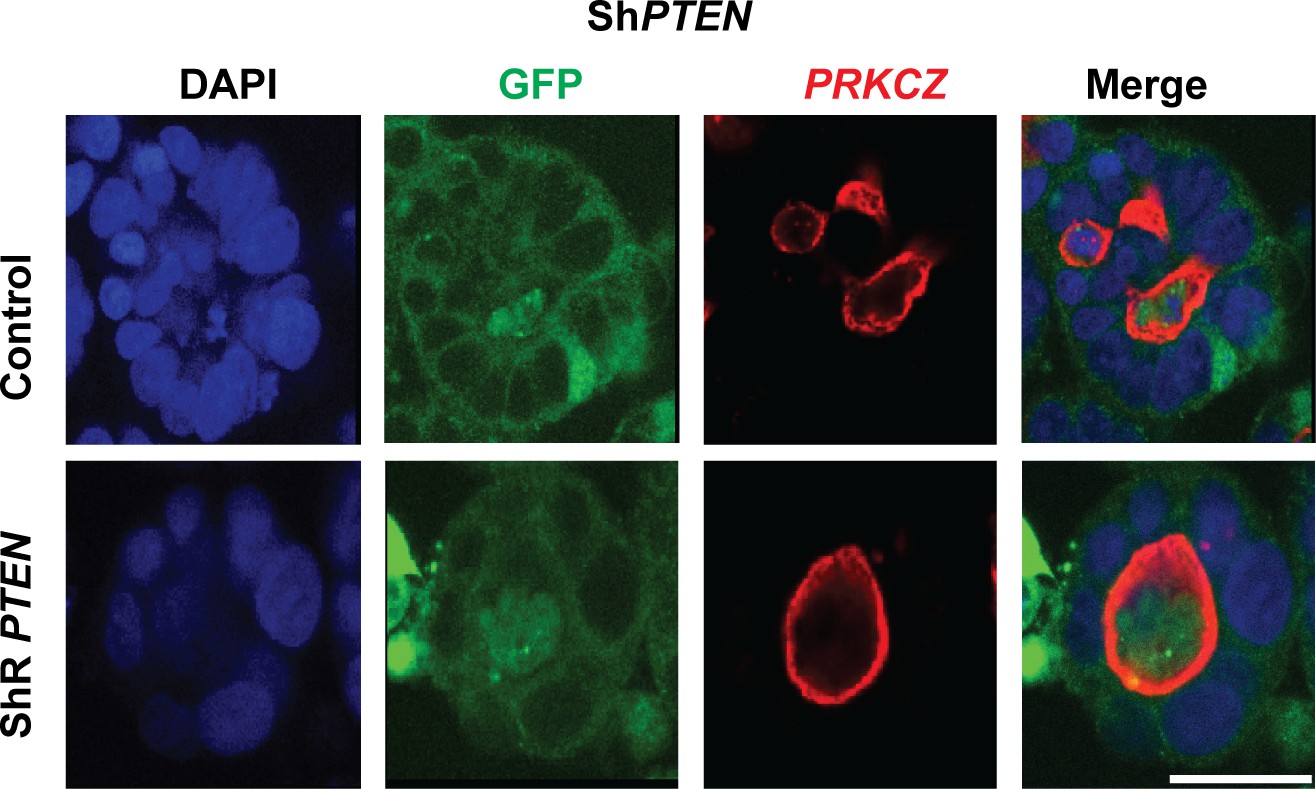
Summary effects of shR PTEN vs EV control on single lumen formation in 3D ShPTEN cultures - control = 11.33 ± 2.40%; ShR PTEN = 30.67 ± 2.91%; **p<0.01.
Analyses by ANOVA with Tukey post hoc test or Student’s t test. Imaging - DAPI (blue), GFP (green), protein kinase C zeta (PRKCZ), here used as an apical membrane marker (red). Scale bar 20 µm.
-
Figure 5—figure supplement 6—source data 1
Figure 5—figure supplement 6 Effects of shRNA resistant PTEN on single lumen formation in ShPTEN glands.
- https://doi.org/10.7554/eLife.24578.068
Figure 6 with 6 supplements
PTEN morphogenic functions mediated by β-Arrestin1, ARHGAP21 and Cdc42.
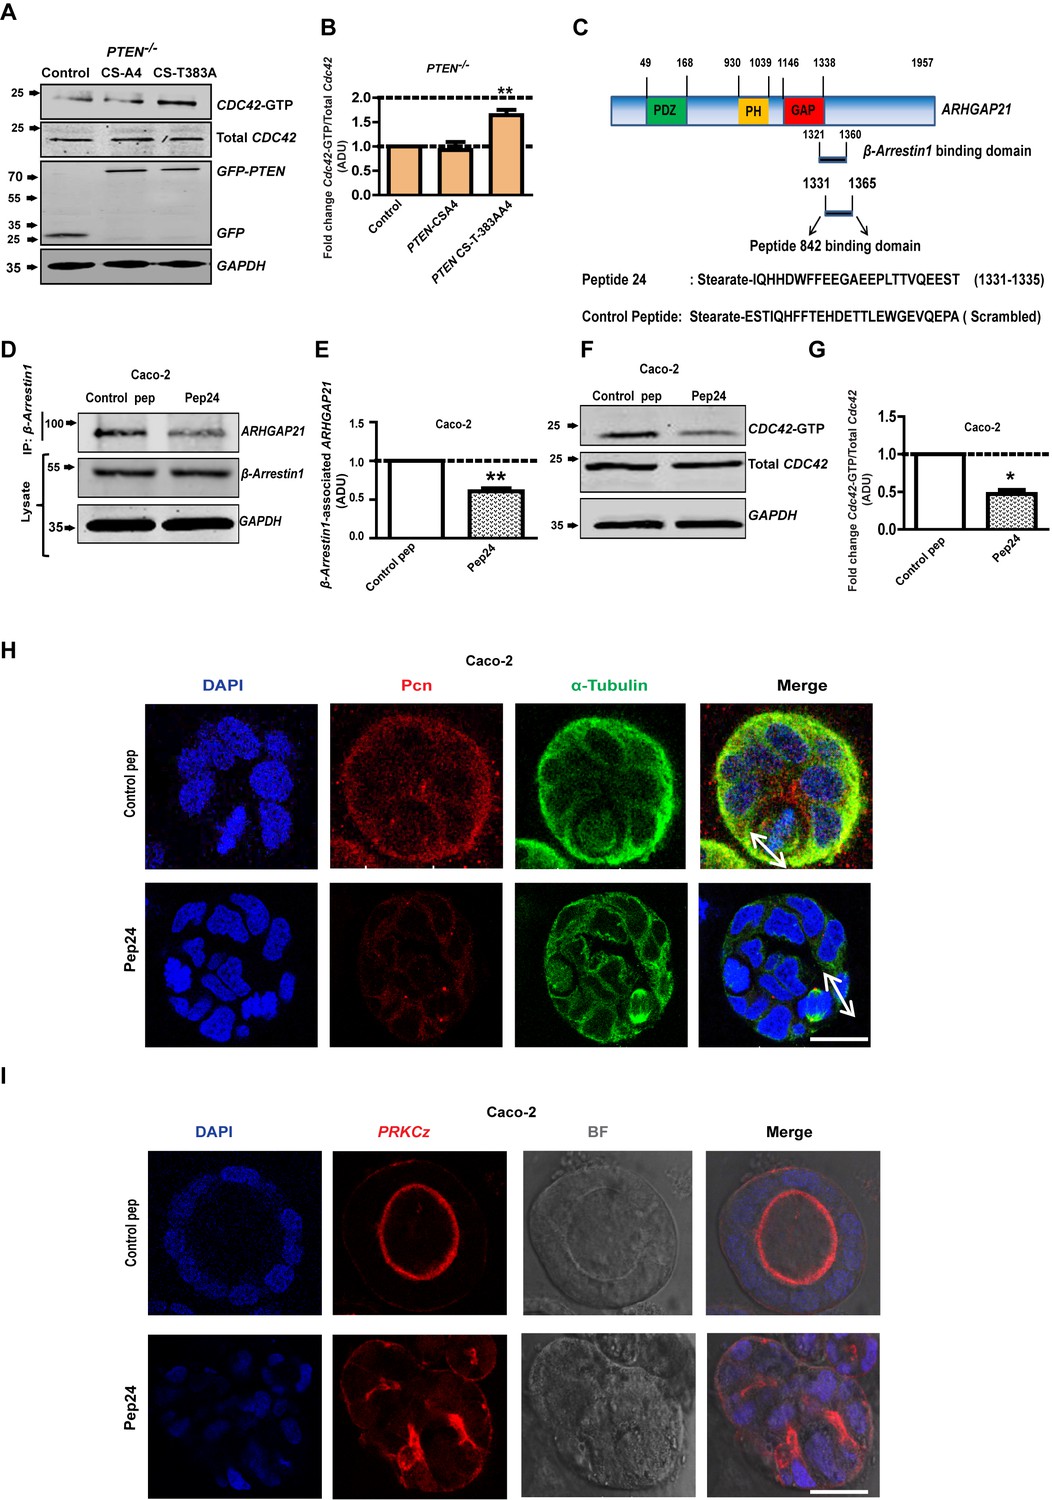
(A) Effects of PTEN CS-A4 or PTEN CS-T383A vs EV control on Cdc42 - GTP levels in PTEN -/- cells. (B) indicates fold change of Cdc42-GTP vs EV control; CS-A4 = 0.92 ± 0.16;p=NS; CS-T383A = 1.64 ± 0.11; **p=0.008. (C) Schematic of ARHGAP21 showing the β-Arrestin1-binding domain, the pep24 peptide-binding inhibitor and control peptide sequences (Anthony et al., 2011). Effects of pep24 vs control peptide (pep) on β-Arrestin1-ARHGAP21 binding (D,E) and Cdc42-GTP (F,G) in Caco-2 cells. (E) indicates fold change of β-Arrestin1-associated ARHGAP21 ADU in Caco-2 cells after pep24 vs control peptide treatment = 0.63 ± 0.02; **p=0.003. (G) indicates fold change of Cdc42-GTP in Caco-2 cells after pep24 vs control peptide treatment = 0.48 ± 0.05; **p=0.01. Treatment effects on spindle orientation (H) and lumenogenesis (I) in 3D Caco-2 cultures. Imaging for pericentrin (PCN) [red]; PRKCZ [red]; α-Tubulin [green], DAPI for nuclear DNA [blue] and bright-field (BF) imaging of lumen outlines. Spindle planes indicated by double-headed white arrows in Merge (H). Analyses by ANOVA, Tukey’s post hoc test. Scale bar - 20 µm. Molecular weights indicated by arrows in blots.
-
Figure 6—source data 1
. Figure 6B -Cdc42-GTP after transfection - source data
- https://doi.org/10.7554/eLife.24578.076
-
Figure 6—source data 2
Figure 6E - Peptide inhibitor treatment effects on Beta Arrestin1:ARHGAP21 binding in Caco-2
- https://doi.org/10.7554/eLife.24578.077
-
Figure 6—source data 3
Figure 6G Peptide inhibitor treatment effects on Cdc42-GTP in Caco-2
- https://doi.org/10.7554/eLife.24578.078
Figure 6—figure supplement 1
pep24 vs control peptide treatment effects on β-Arrestin1-associated ARHGAP21 ADU = 0.39 ± 0.09;*p=0.02.
https://doi.org/10.7554/eLife.24578.070
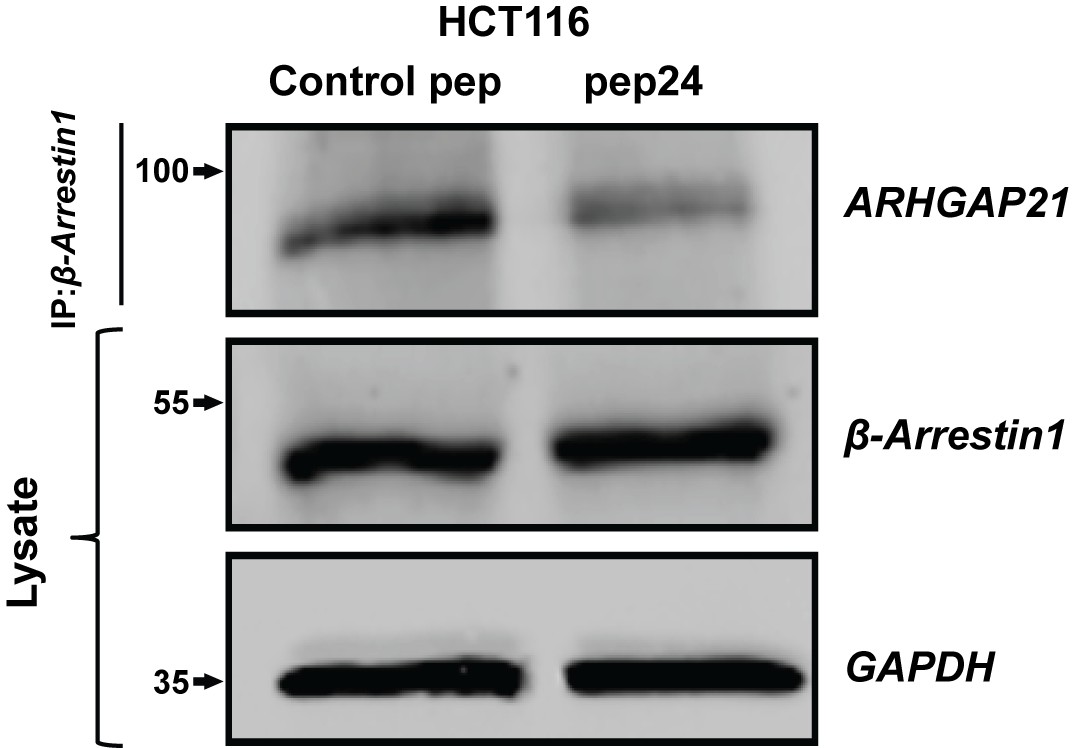
Figure 6—figure supplement 2
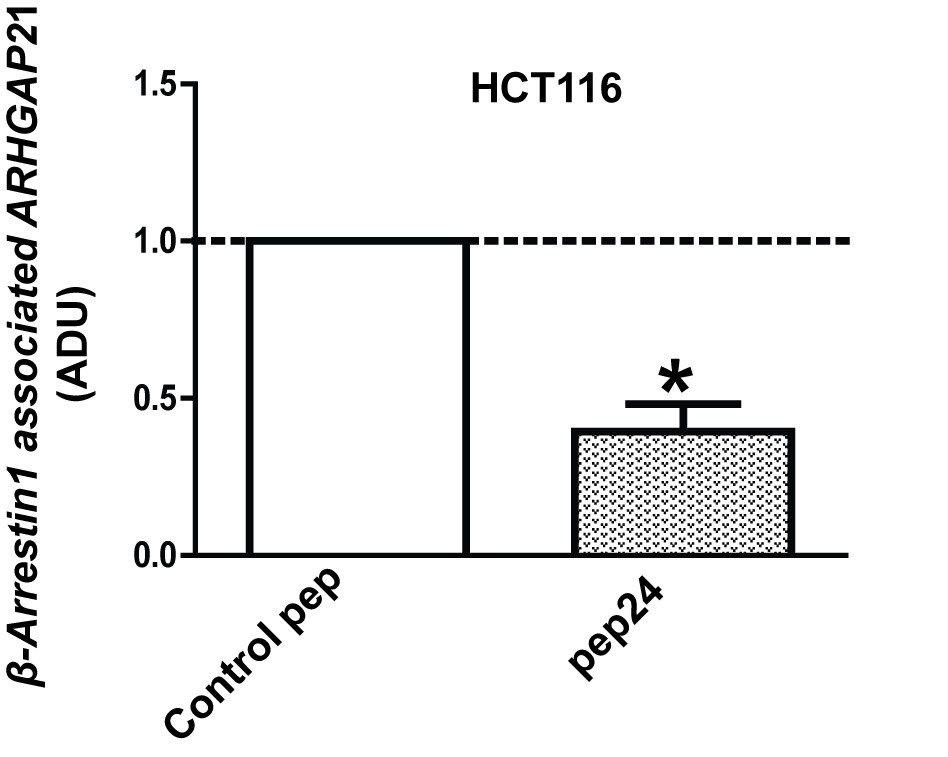
pep24 vs control peptide treatment effects on β-Arrestin1-associated ARHGAP21 ADU = 0.39 ± 0.09;*p=0.02.
https://doi.org/10.7554/eLife.24578.071-
Figure 6—figure supplement 2—source data 1
Figure 6—figure supplement 2 Effects of peptide binding inhibitor on Beta-arrestin1:ARHGAP21 interactions in HCT116 cells
- https://doi.org/10.7554/eLife.24578.079
Figure 6—figure supplement 3
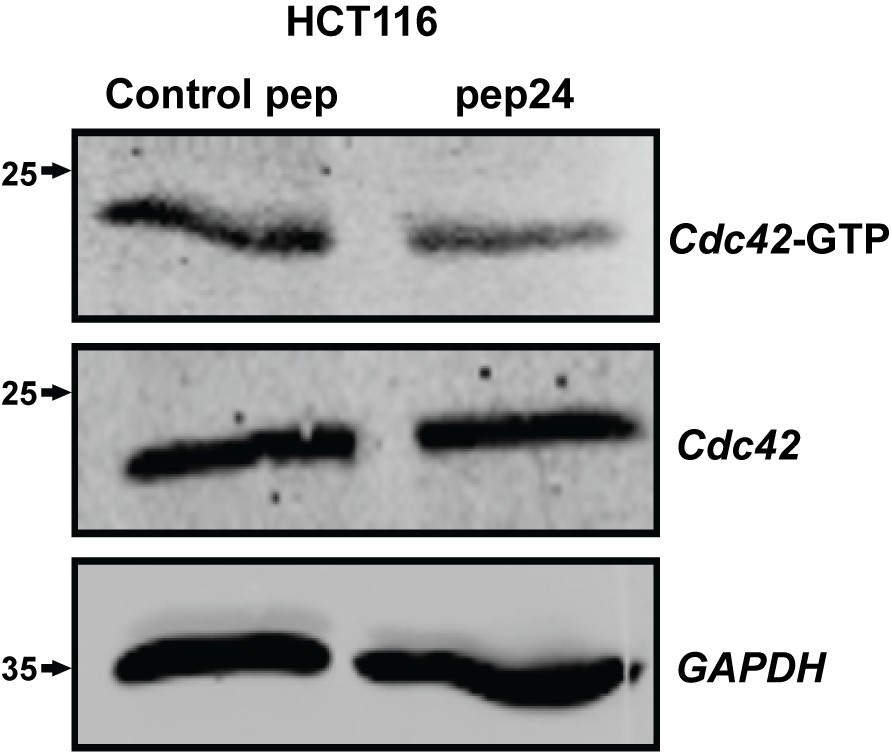
pep24 vs control peptide treatment effects on Cdc42-GTP ADU = 0.44 ± 0.02; **p<0.01 in HCT116 cells.
https://doi.org/10.7554/eLife.24578.072
Figure 6—figure supplement 4
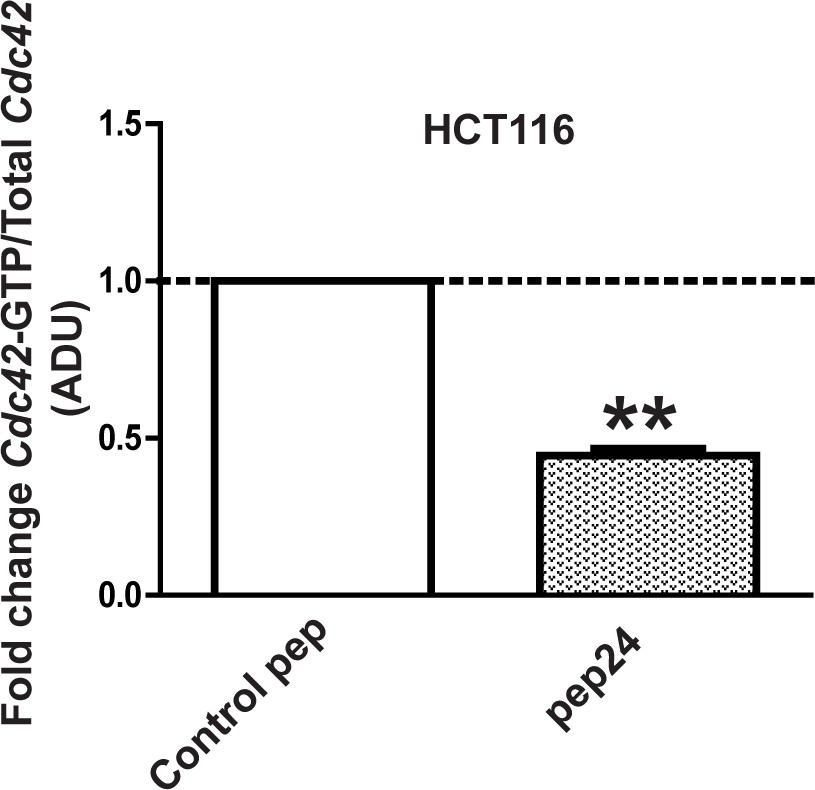
pep24 vs control peptide treatment effects on Cdc42-GTP ADU = 0.44 ± 0.02; **p<0.01 in HCT116 cells.
https://doi.org/10.7554/eLife.24578.073-
Figure 6—figure supplement 4—source data 1
Figure 6—figure supplement 4 - Peptide inhibitor treatment effects in Cdc42-GTP in HCT116 cells - source data
- https://doi.org/10.7554/eLife.24578.080
Figure 6—figure supplement 5
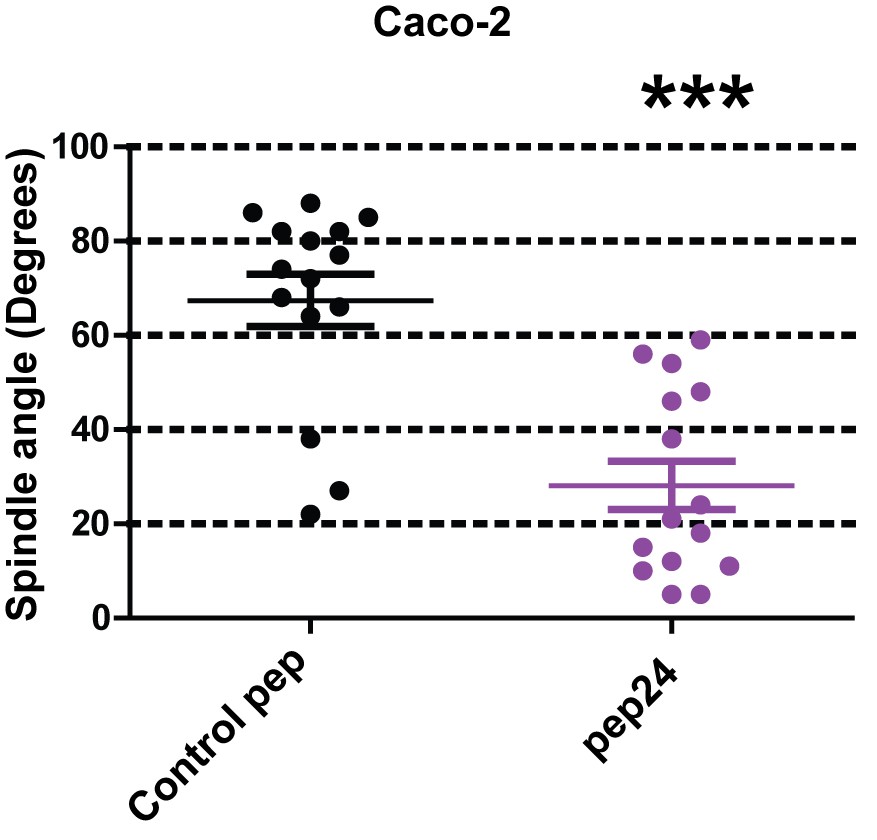
Summary treatment effects on mitotic spindle angles [●Control peptide = 67.4 ± 5.50 vs ● pep24 = 28.1 ± 5.10; ***p<0.001] and % glands with single central lumens in 3D Caco-2 cultures (Control peptide = 35.33 ± 1.76% vs pep24 = 20.67 ± 1.76%;**p<0.01).
Molecular weights indicated by arrows in blots. Analysis by paired Student’s t test.
-
Figure 6—figure supplement 5—source data 1
Figure 6—figure supplement 5 - Peptide inhibitor treatment effects on spindle angles in Caco-2 cultures
- https://doi.org/10.7554/eLife.24578.081
Figure 6—figure supplement 6

Summary treatment effects on mitotic spindle angles [●Control peptide = 67.4 ± 5.50 vs ● pep24 = 28.1 ± 5.10; ***p<0.001] and % glands with single central lumens in 3D Caco-2 cultures (Control peptide = 35.33 ± 1.76% vs pep24 = 20.67 ± 1.76%;**p<0.01).
Molecular weights indicated by arrows in blots. Analysis by paired Student’s t test.
-
Figure 6—figure supplement 6—source data 1
Figure 6—figure supplement 6 Peptide inhibitor treatment effects on spindle angles in Caco-2 cultures
- https://doi.org/10.7554/eLife.24578.082
Figure 7
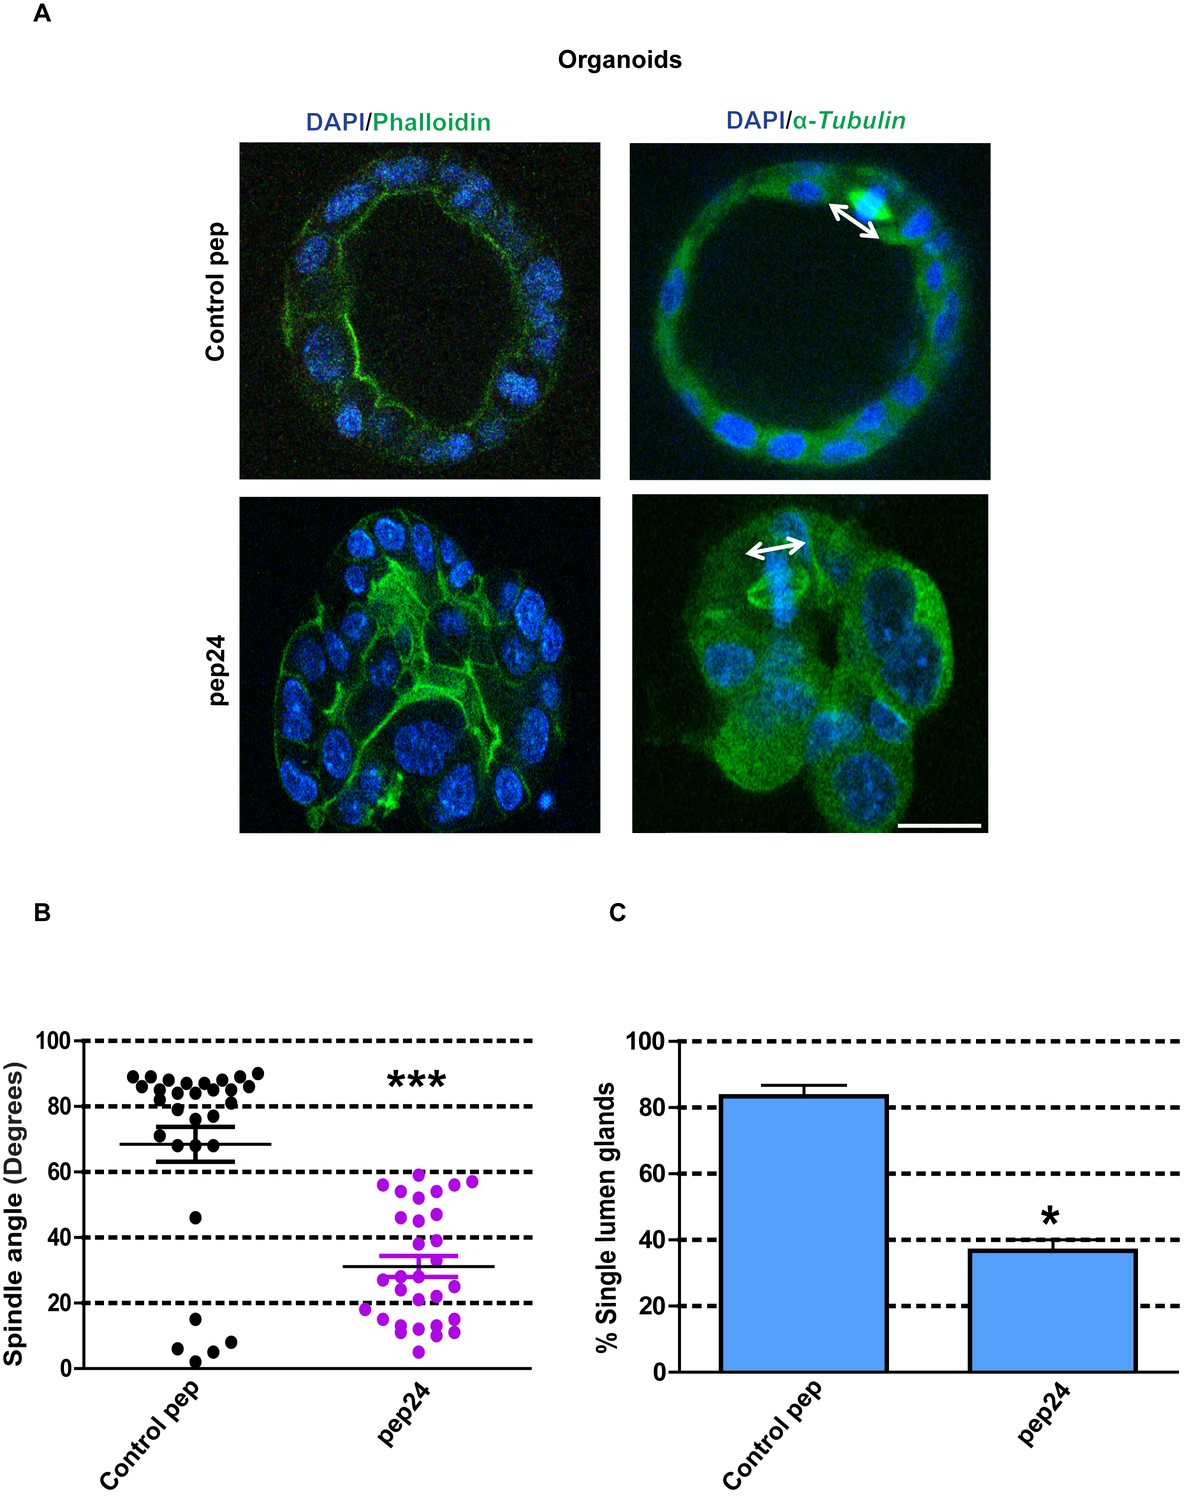
β-Arrestin1-ARHGAP21 binding is essential for morphogenesis of normal colorectal organoids.
(A) Effects of pep24 vs control peptide (pep) on multicellular morphogenesis of normal colorectal epithelium. Imaging - apical actin marker FITC-labeled phalloidin [green], DAPI for nuclear DNA [blue] and FITC-labeled α-Tubulin [green]. Spindle orientation indicated by double-headed white arrows. (B) Summary spindle angles in 3D colorectal organoids after treatment (n = 30 per treatment group) ●Control peptide = 68.47 ± 5.370 vs ●pep24 = 31.13 ± 3.200; ***p<0.001. (C) Summary data represent percentage glandular colorectal organoids with single central lumens after treatment; control peptide = 80.00 ± 5.77% vs pep24 = 36.67 ± 3.3%;*p=0.039; (n = 10 organoids per treatment group in triplicate). Student’s t test. Scale bar 20 µm.
-
Figure 7—source data 1
Figure 7B Spindle angles in organoids - souce data.
- https://doi.org/10.7554/eLife.24578.084
-
Figure 7—source data 2
Figure 7C Single central lumen formation in organoids - source data.
- https://doi.org/10.7554/eLife.24578.085
Author response image 1
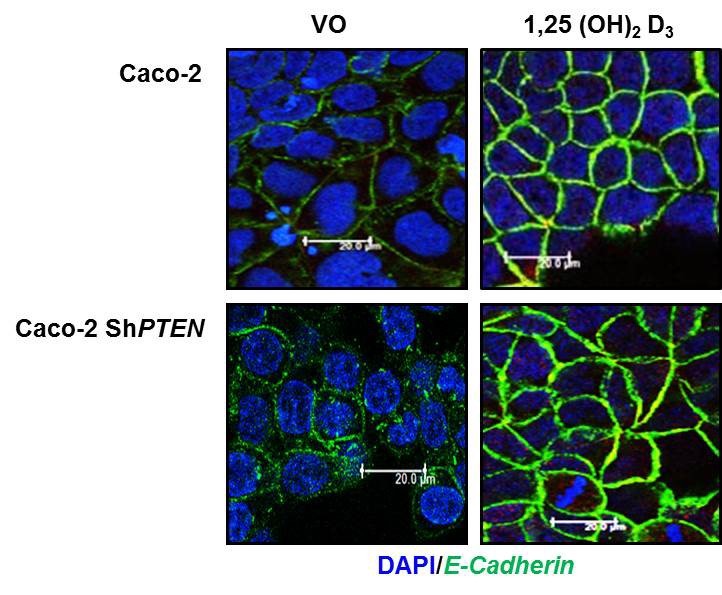
To investigate effects of PTEN on ligand- mediated enhancement of a membrane protein (Reviewer 2, point 2, Figure 1C), we tested 100nM 1,25 (OH)2 Vit D3vs vehicle only control against membrane recruitment of E-Cadherin (4) in Caco-2 and Caco-2 ShPTEN cells.
Author response image 2
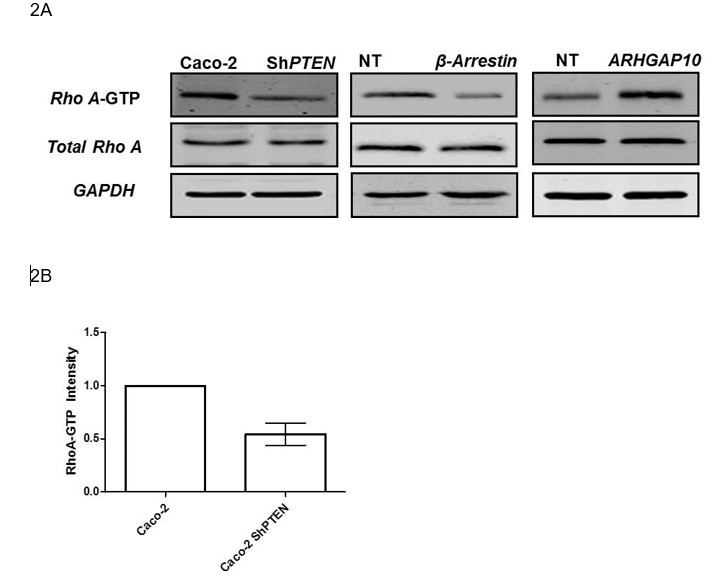
2A To investigate effects of the PTEN/β-Arrestin1/ARHGAP10 cascade on RHOA (Reviewer 2; point 3), we assessed RHOA-GTP in Caco-2 vs Caco2 ShPTEN (ShPTEN) cells (First column).
Download links
A two-part list of links to download the article, or parts of the article, in various formats.
Downloads (link to download the article as PDF)
Open citations (links to open the citations from this article in various online reference manager services)
Cite this article (links to download the citations from this article in formats compatible with various reference manager tools)
PTEN controls glandular morphogenesis through a juxtamembrane β-Arrestin1/ARHGAP21 scaffolding complex
eLife 6:e24578.
https://doi.org/10.7554/eLife.24578


