Dissection of zebrafish shha function using site-specific targeting with a Cre-dependent genetic switch
- Victor Chang Cardiac Research Institute, Australia
- University of New South Wales, Australia
Figures
Figure 1 with 2 supplements
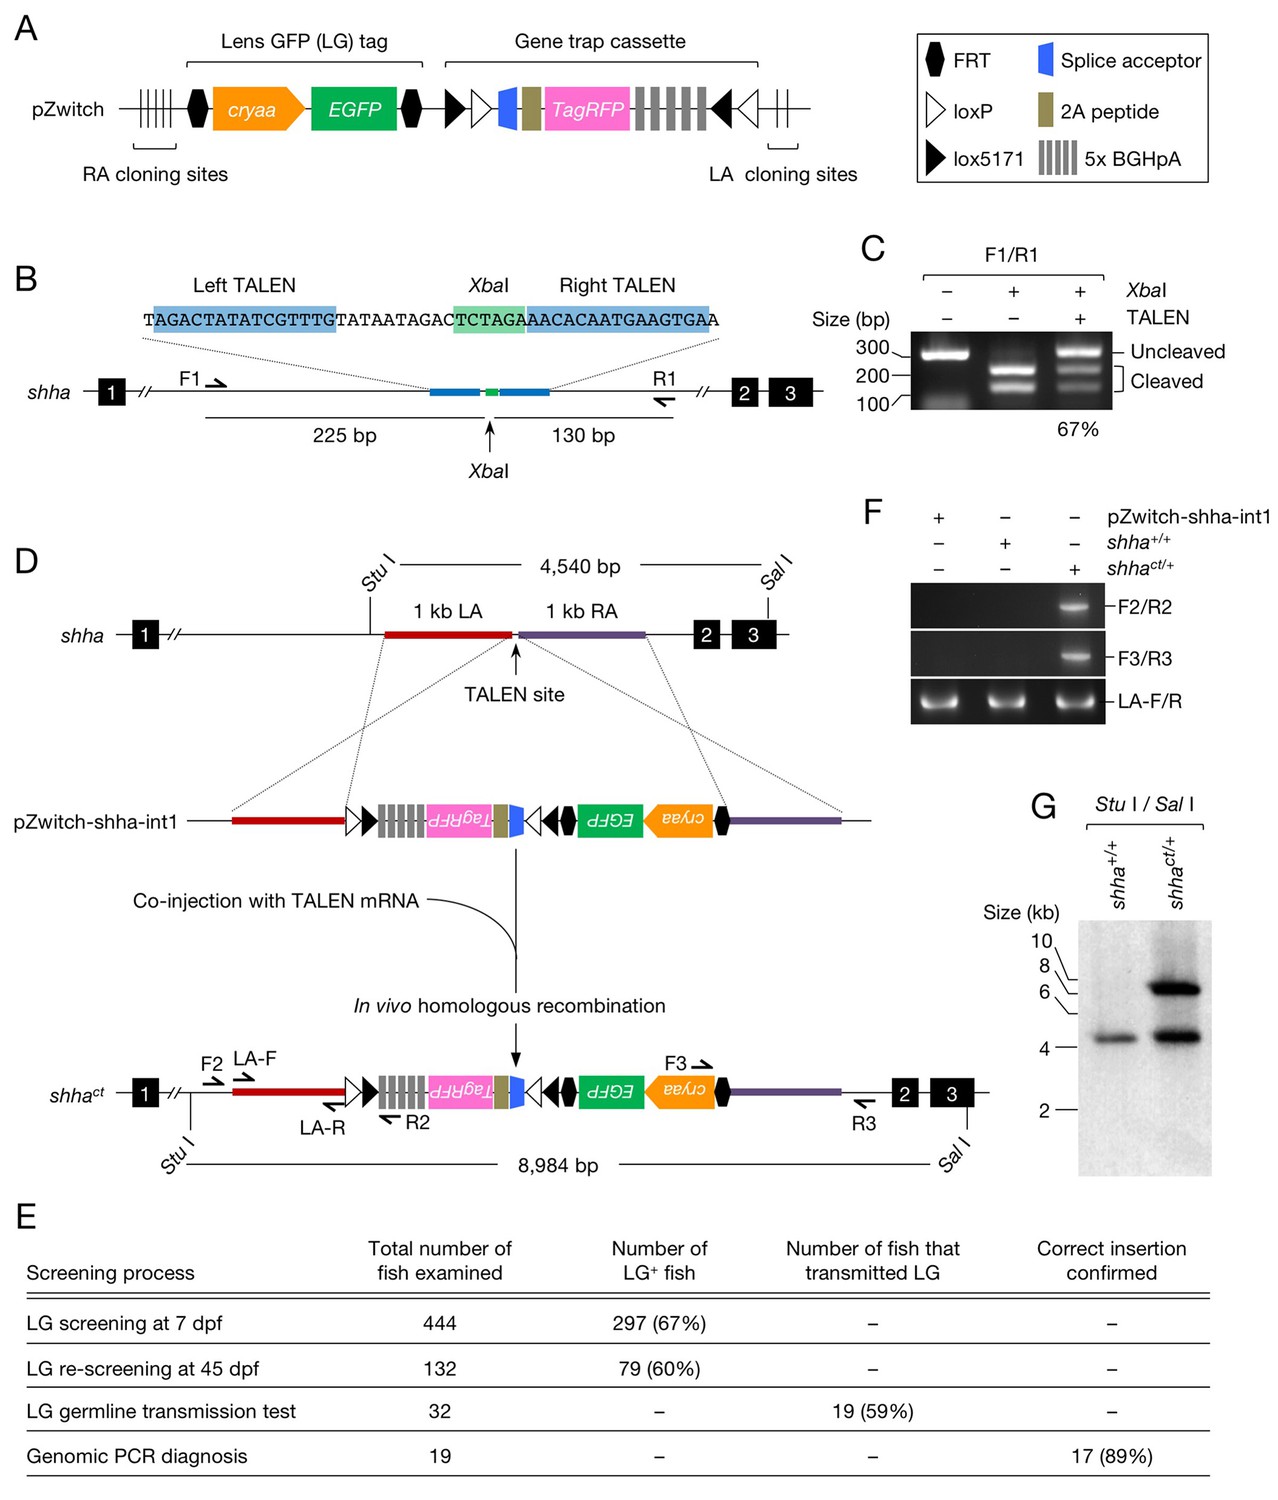
Generation of the shha conditional allele using Zwitch.
(A) Schematic of Zwitch. (B) Schematic of the zebrafish shha locus and TALEN used to induce DNA DSBs in intron 1. Exons are indicated by filled boxes with numbers. The binding sites for the TALEN pair are highlighted in blue, and the XbaI site in the spacer region is highlighted in green. (C) The efficiency of the TALENs in introducing DSBs. XbaI digestion of PCR products amplified from the genomic DNA of embryos injected with TALEN mRNAs. The efficiency of the TALEN pair in inducing DSBs (67%) was quantified from the gel image using ImageJ software. (D) Schematic of the strategy used to target shha via TALEN-mediated homologous recombination with pZwitch-shha-int1. (E) The screening process for founders. (F) Genomic PCR analysis of the Zwitch insertion with the correct orientation. (G) Southern blot analysis of the Zwitch-modified shha allele. BGHpA, bovine growth hormone polyadenylation signal; cryaa, α A-crystallin; LA, left arm; RA, right arm.
Figure 1—figure supplement 1
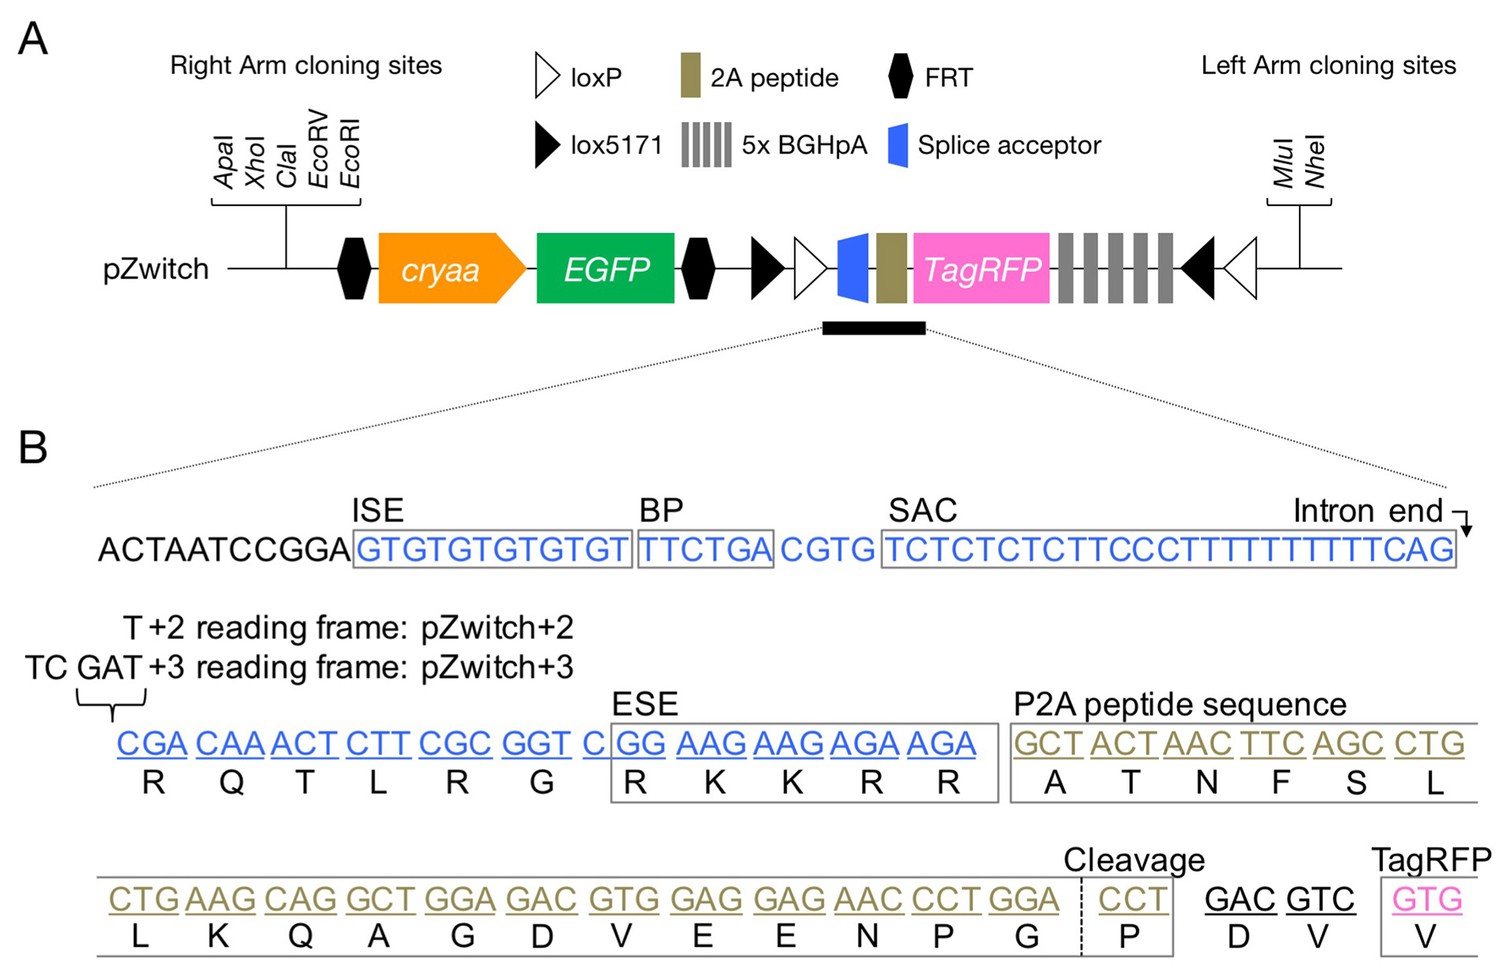
pZwitch vector.
(A) Schematic of pZwitch. (B) Sequence of the splice acceptor and P2A components of pZwitch (filled bar in A). The splice acceptor sequence was derived from pFT1 (Ni et al., 2012). pZwitch for the +2 and+3 reading frames was generated by inserting T and TCGAT, respectively, at the indicated site. BP, branch point; ESE, exonic splice enhancer; ISE, intronic splice enhancer; SAC, splice acceptor consensus.
Figure 1—figure supplement 2

DNA sequence of the shhact allele.
(A) DNA sequence at the 5′ end of the LA homology sequence of pZwitch-shha-int1. (B) DNA sequence at the 3′ end of the RA homology sequence of pZwitch-shha-int1.
Figure 2 with 3 supplements
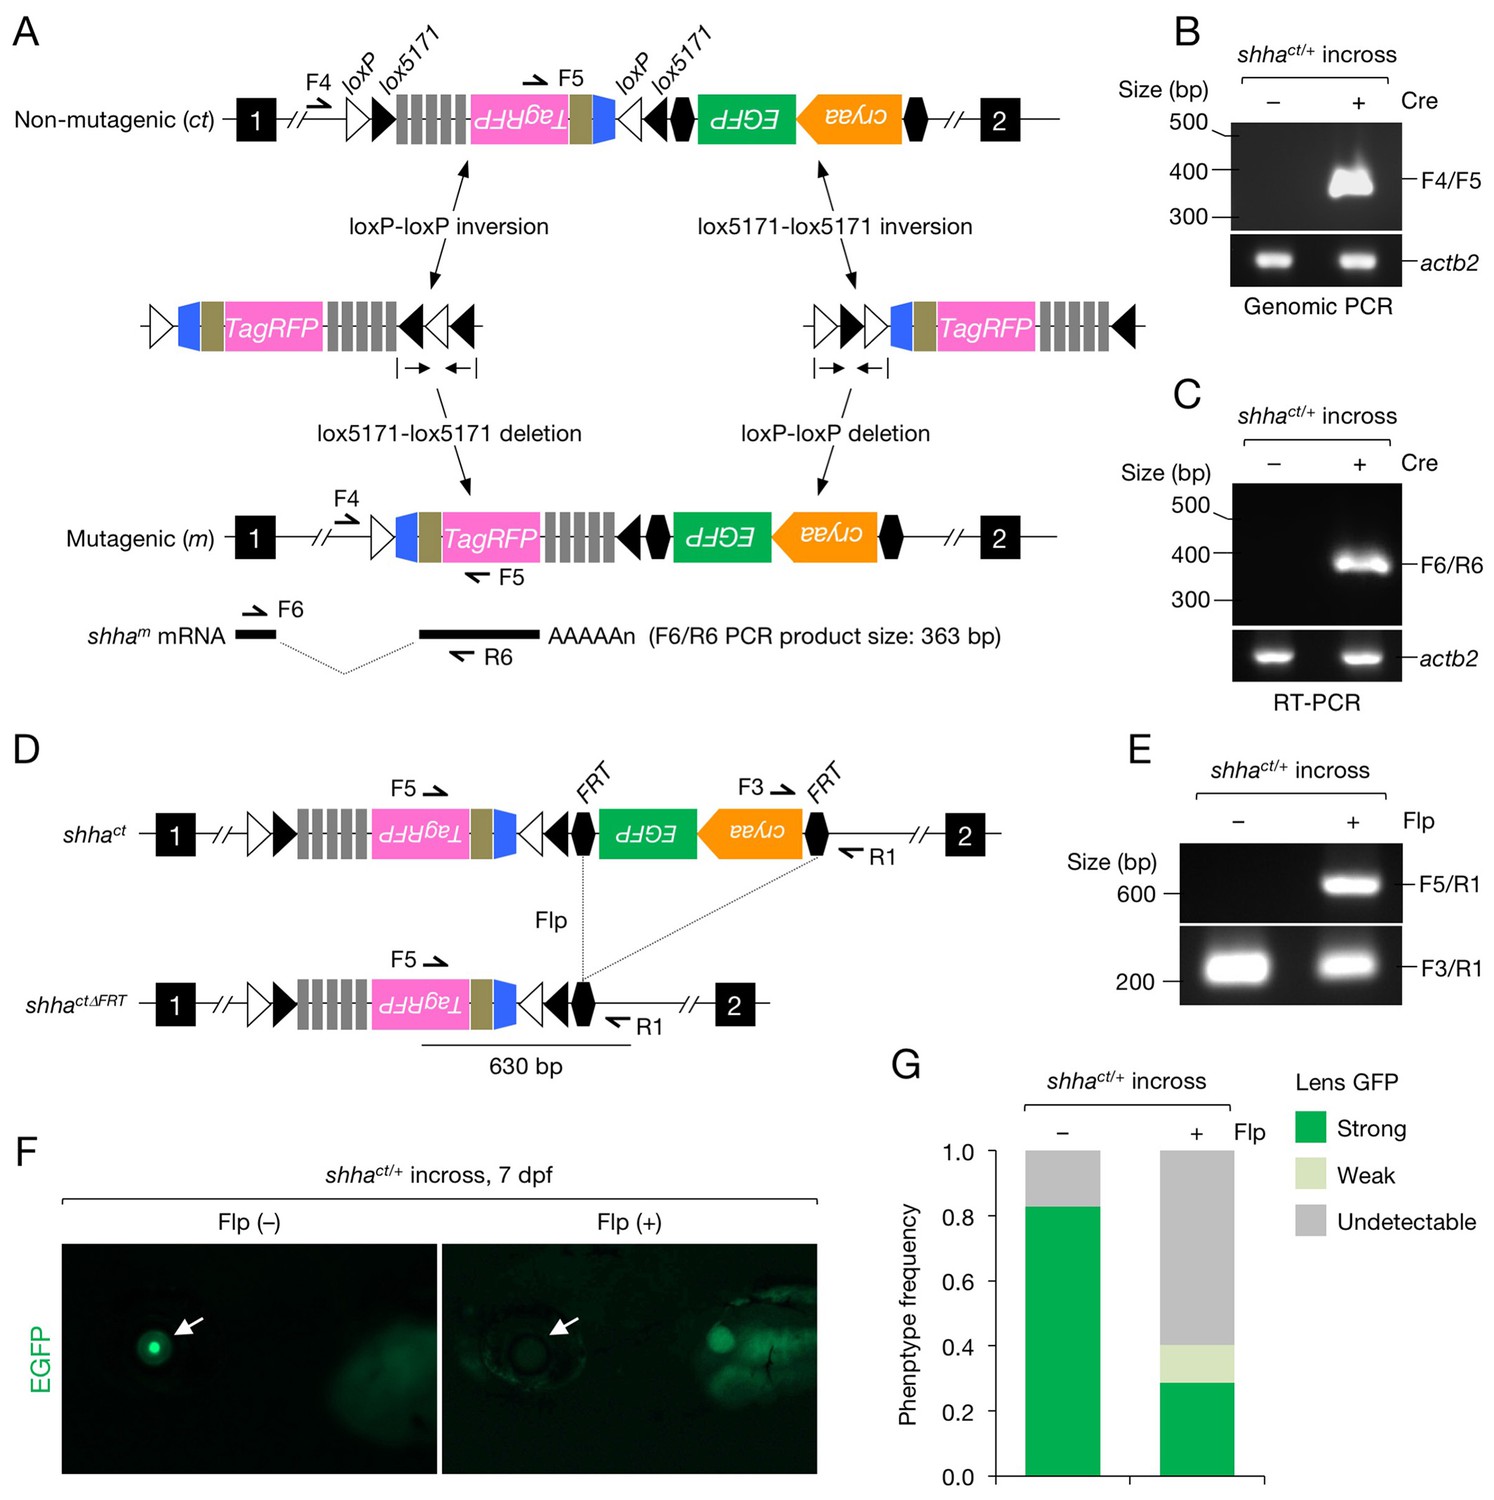
Characterization of the shhact allele.
(A) Schematic of Cre-dependent conversion of Zwitch from the non-mutagenic orientation to the mutagenic orientation. Cre activation induces an inversion between loxP or lox5171 sites and the subsequent excision of loxP or lox5171-flanking DNA sequences (Schnütgen and Ghyselinck, 2007), thereby permanently converting Zwitch into the mutagenic form and inducing aberrant shha splicing. (B) PCR analysis of the Zwitch inversion. Genomic DNA from 72 hpf Cre+ and Cre− shhact/+ embryos was analyzed using PCR. (C) RT-PCR analysis of shha expression in 72 hpf Cre+ and Cre− shhact/+ embryos. (D) Schematic of Flp-mediated excision of the FRT-flanked LG tag in the shhact allele. (E) Genomic PCR analysis of Flp-injected (+) or uninjected (−) embryos from a cross of shhact/+ adults. PCR using F3 and R1 primers detected shhact alleles in both samples. Flp mRNA was synthesized from linearized pCS2-FLPo (Materials and methods). (F) Representative image of embryos injected with Flp mRNA. Arrows indicate the lens. (G) Quantification of phenotypes of the embryos analyzed in F. A total of 87 Flp-injected (+) and 99 uninjected embryos (−) were analyzed (****p<1.0 × 10⁻⁸ Fisher’s exact test). dpf, days post-fertilization.
Figure 2—figure supplement 1
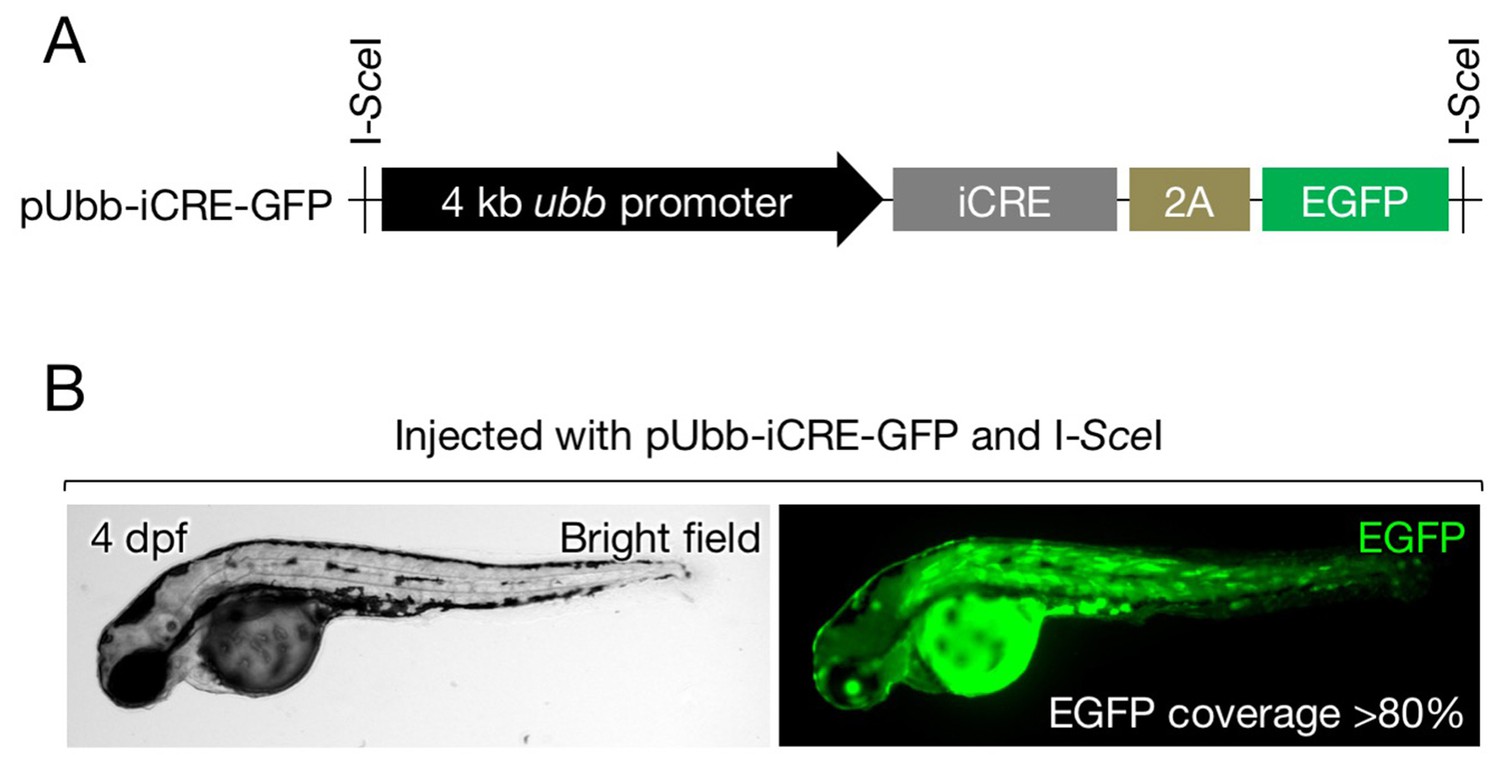
Cre expression vector.
(A) Schematic of pUbb-iCRE-GFP. (B) A representative image of embryos injected with pUbb-iCRE-GFP expressing EGFP (right) on approximately 80% of the body surface (left). Embryos expressing EGFP at similar or greater levels were selected for the analysis presented in Figure 3A–C.
Figure 2—figure supplement 2
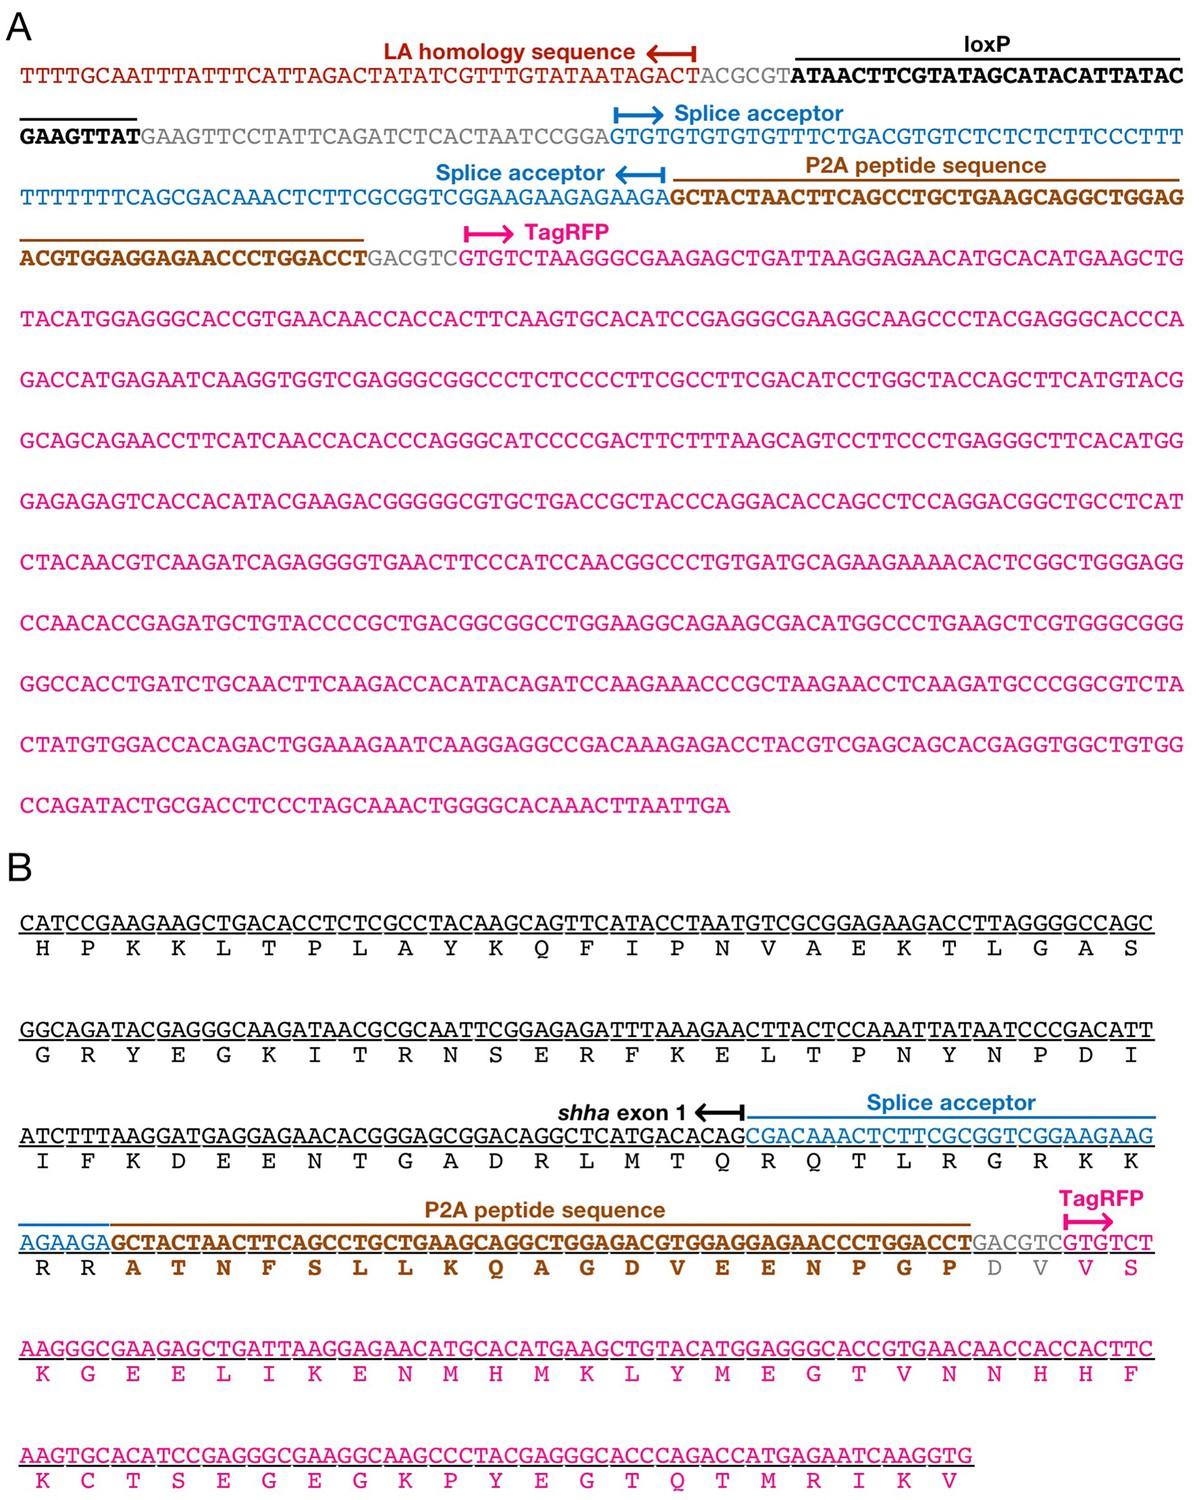
DNA sequence of the inverted shhact allele and its transcript.
(A) DNA sequence of the inverted shhact allele. (B) DNA sequence of shha-P2A-TagRFP mRNA.
Figure 2—figure supplement 3
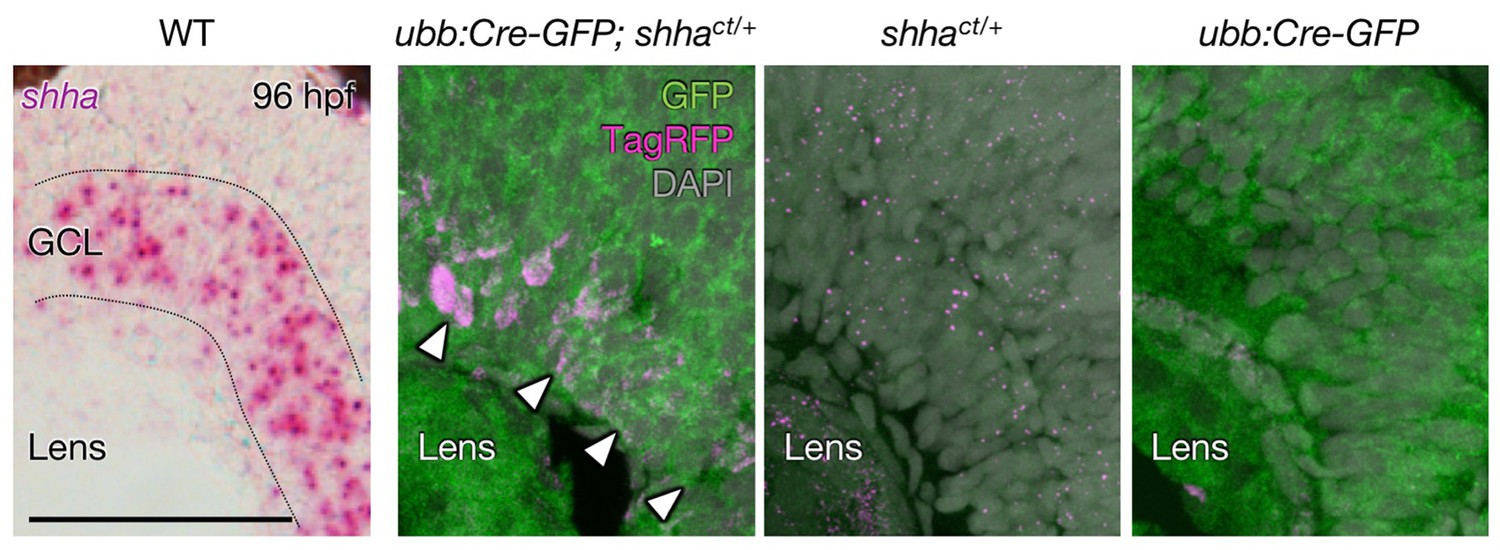
TagRFP expression from the inverted shhact allele.
Weak expression of TagRFP was detected in cells in the ganglion cell layer (GCL) in the retina of ubb:Cre-GFP; shhact/+ embryos but not in shhact/+ and ubb:Cre-GFP embryos. Confocal projections of z-stacks are shown in three panels from the right, and the bright field image of in situ hybridization of shha mRNA is shown in the far left panel. Dotted lines, approximate border of the GCL. Scale bar, 50 μm.
Figure 3 with 2 supplements

Phenotype of shhact/ct embryos globally expressing Cre.
(A) qRT-PCR analysis of 72 hpf Cre+ and Cre− shhact/ct embryos (n = 10 and 9). WT embryos injected with pUbb-iCRE-GFP DNA were used as a control (n = 9). Ten pooled embryos per sample were used for qRT-PCR analysis. The data are presented as the mean ± SEM (***p<0.001, Mann–Whitney U test). (B) Phenotypes of 72 hpf Cre+ and Cre- shhact/ct embryos. Arrows, pectoral fins; arrowheads, somite boundaries; brackets, horizontal myoseptum. Bright field images were captured using an MVX10 microscope. The composite images shown were generated using ImageJ software. Somite defects were observed in all embryos with severe pectoral fin defects. (C) Quantification of pectoral fin phenotypes from the embryos in B (n = 7 [WT, Cre+], n = 12 [shhact/ct, Cre−], and n = 28 [shhact/ct, Cre+]; **p<0.01, Fisher’s exact test). N.S., not significant (p=0.5392). The embryos used in A–C were selected on the basis of their high-level expression of Cre as described in Figure 2—figure supplement 1B (see also Cre DNA and mRNA injection, Materials and methods). A moderate pectoral fin defect was observed in control samples, likely due to injection artifacts.
Figure 3—figure supplement 1
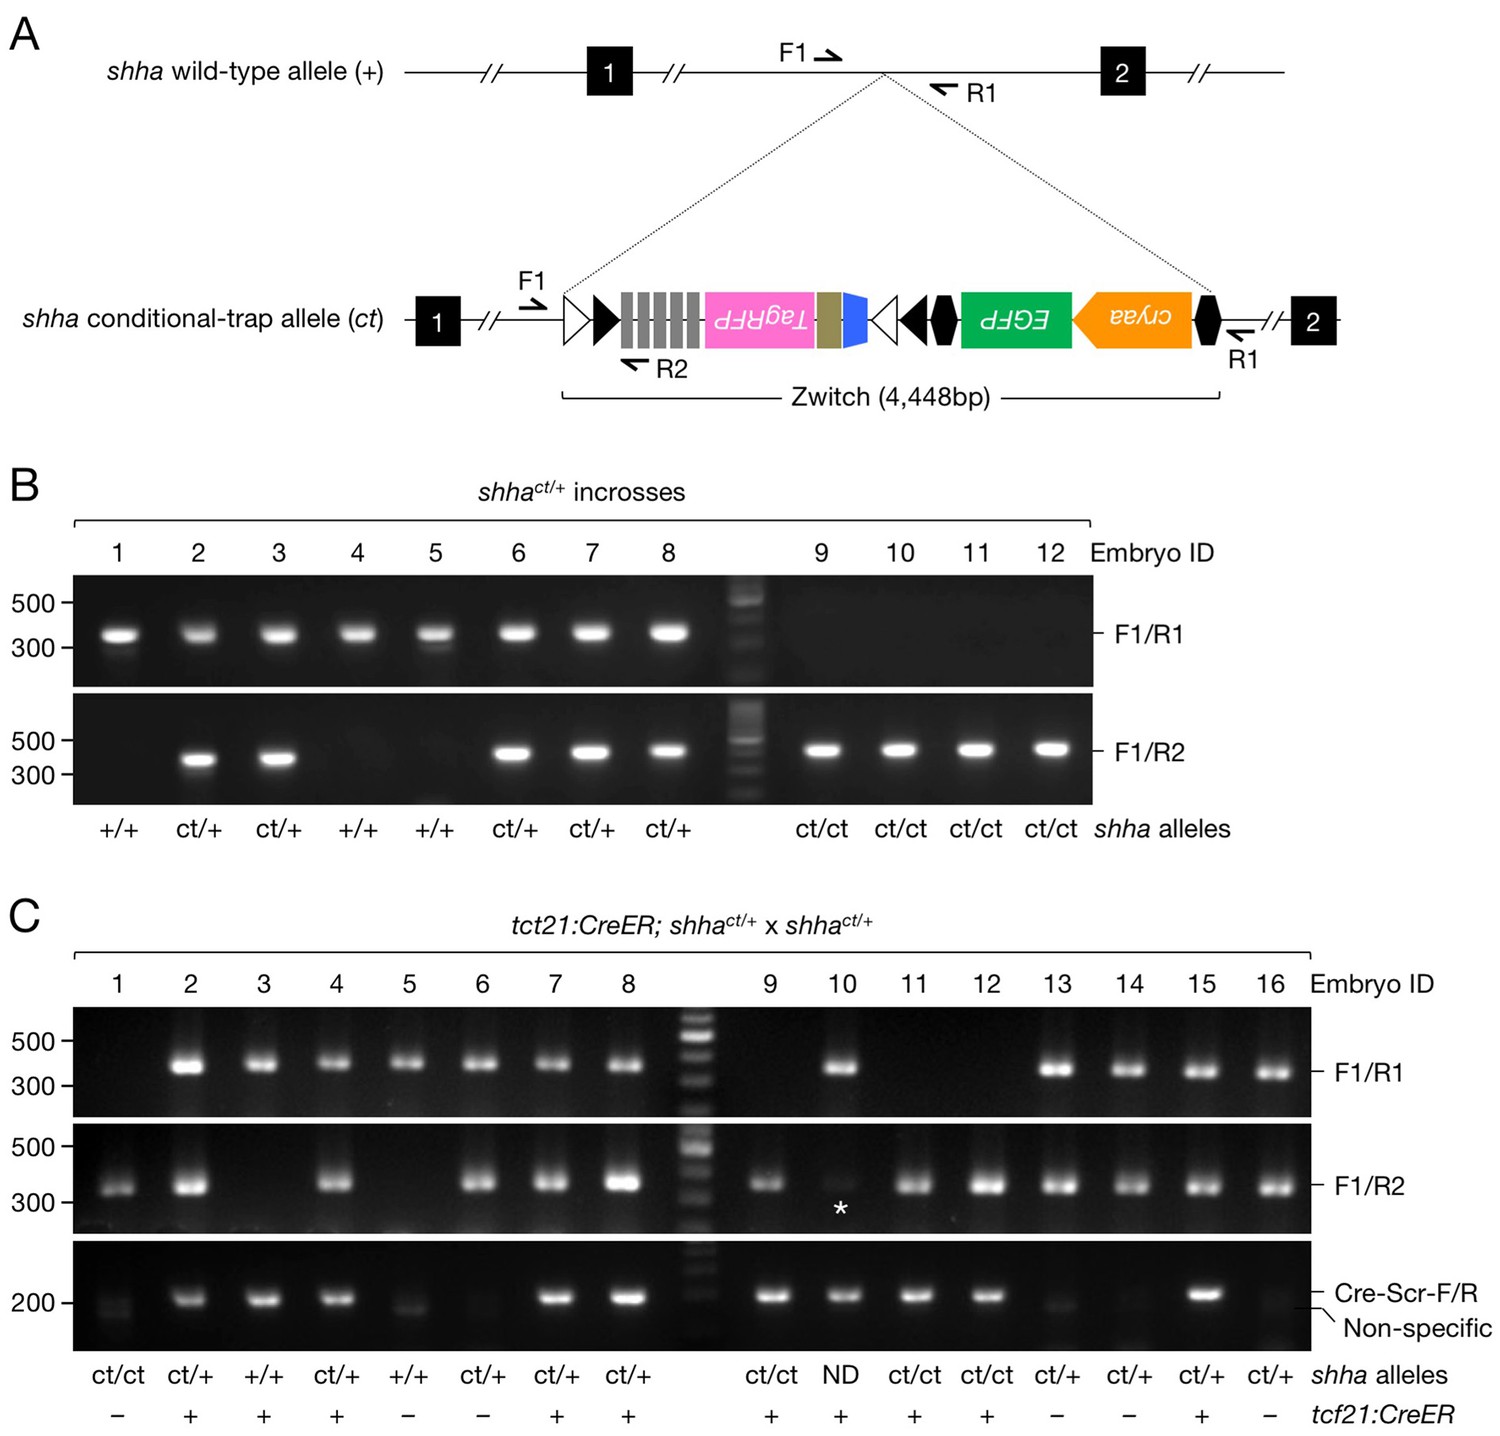
Genotyping PCR of shhact alleles.
(A) Schematic of the shha WT allele (+) and conditional trap allele (ct) and primers sites. (B) Genotyping PCR result of single embryos from an incross of shhact/+ fish injected with Cre DNA at single-cell stage. Note that ct/ct genotype was predictable due to the developmental defects observed in shhact/ct embryos after Cre DNA injection. (C) Genotyping PCR result of single embryos from a cross of tcf21:CreER; shhact/+ fish with shhact/+ fish. We did not use embryos exhibiting a faint band for experiments (asterisk). PCR with Cre-Scr-F/R primers occasionally amplified a faint non-specific band at a lower size. ND, not determined. Please see the Genotyping and Sample preparation for embryo genotyping and analysis section in the Materials and methods for details of the screening procedures.
Figure 3—figure supplement 2
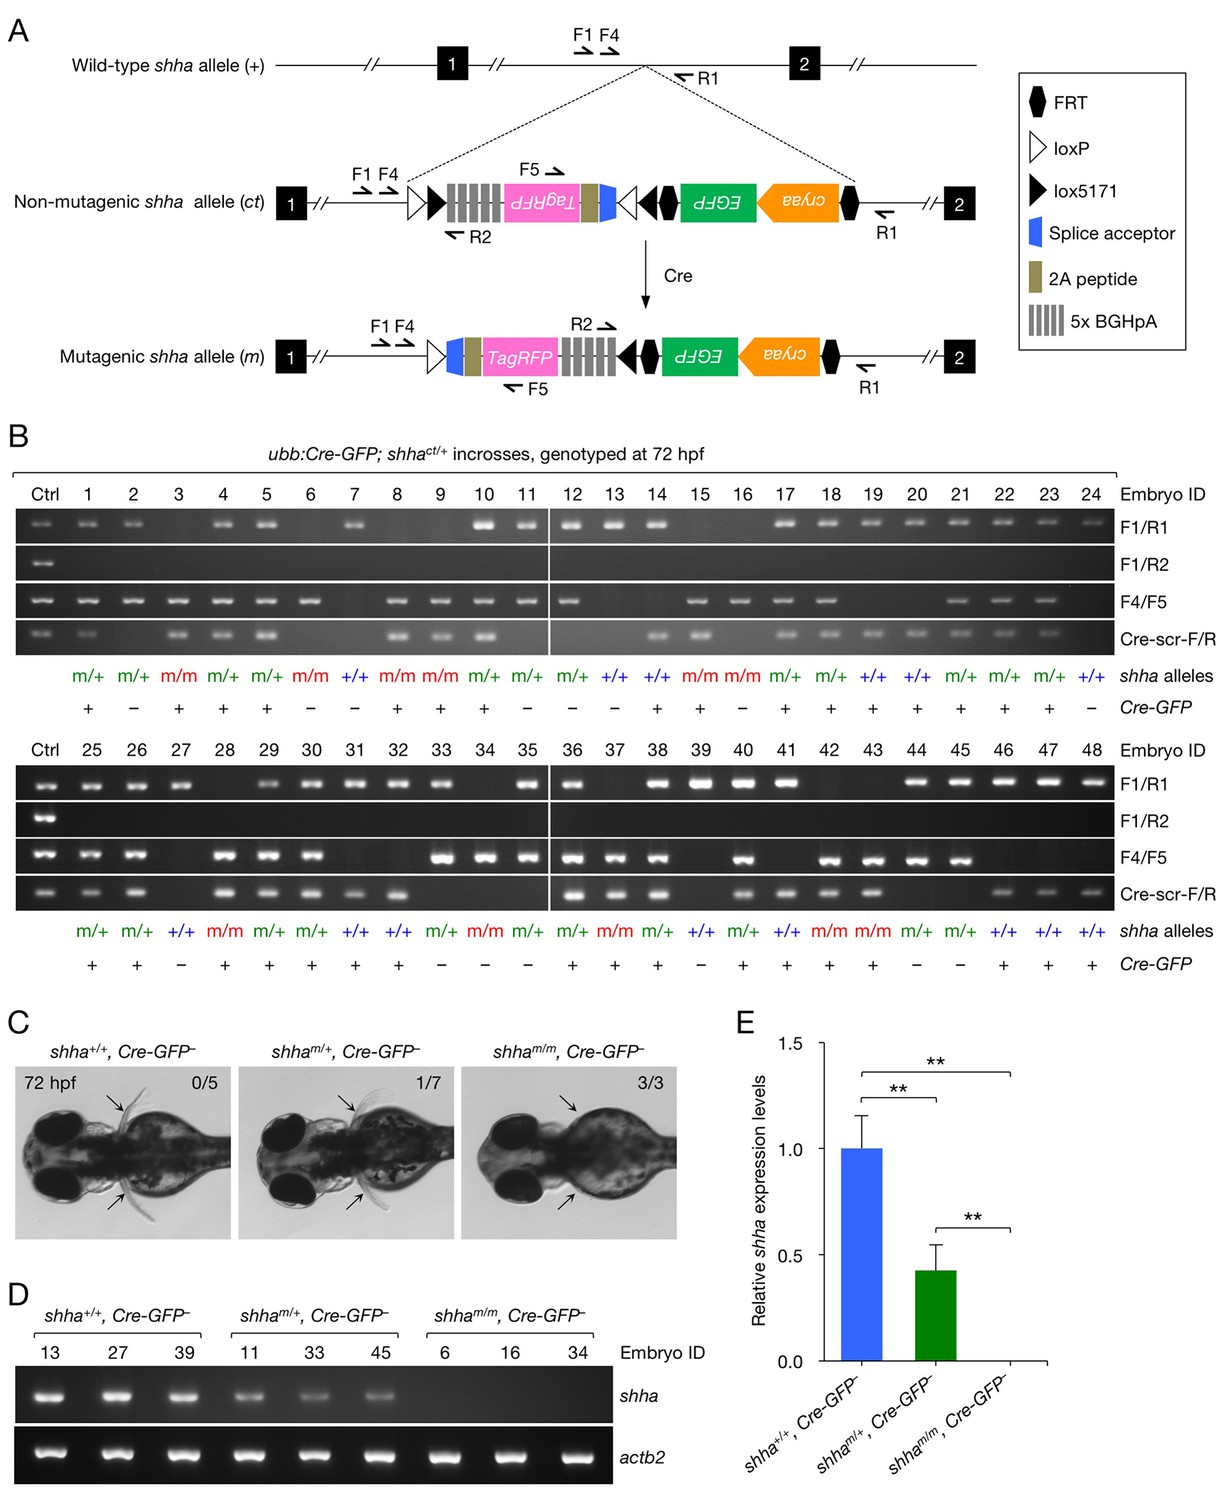
Analysis of embryos carrying mutagenic shha alleles.
(A) Schematic of the shha WT allele (+), non-mutagenic, conditional-trap allele (ct), and inverted mutagenic allele (m), and primers sites. (B) Genotyping PCR result of single embryos from incrosses of ubb:Cre-GFP; shhact/+ fish. (C) Pectoral fin phenotype of WT and heterozygous and homozygous mutagenic embryos in B. Embryos that did not carry ubb:Cre-GFP transgene were analyzed (Cre-GFP−). Pectoral fin development was normal in all WT embryos (0 abnormal in 5 analyzed) and most heterozygous mutants (1 moderately abnormal in 7 analyzed; p=0.3774, Fisher's exact test), but severely hampered in all homozygous mutants (3 abnormal in 3 analyzed; p<0.01, Fisher’s exact test). (D) Semi-qRT-PCR analysis of shha expression in WT and heterozygous and homozygous mutagenic embryos. The number above each lane in the gel picture indicates the Embryo ID in B. (E) Densitometric quantification of the PCR result in D. The data represent the mean ± SD (**p<0.01; Mann–Whitney U test).
Figure 4 with 2 supplements
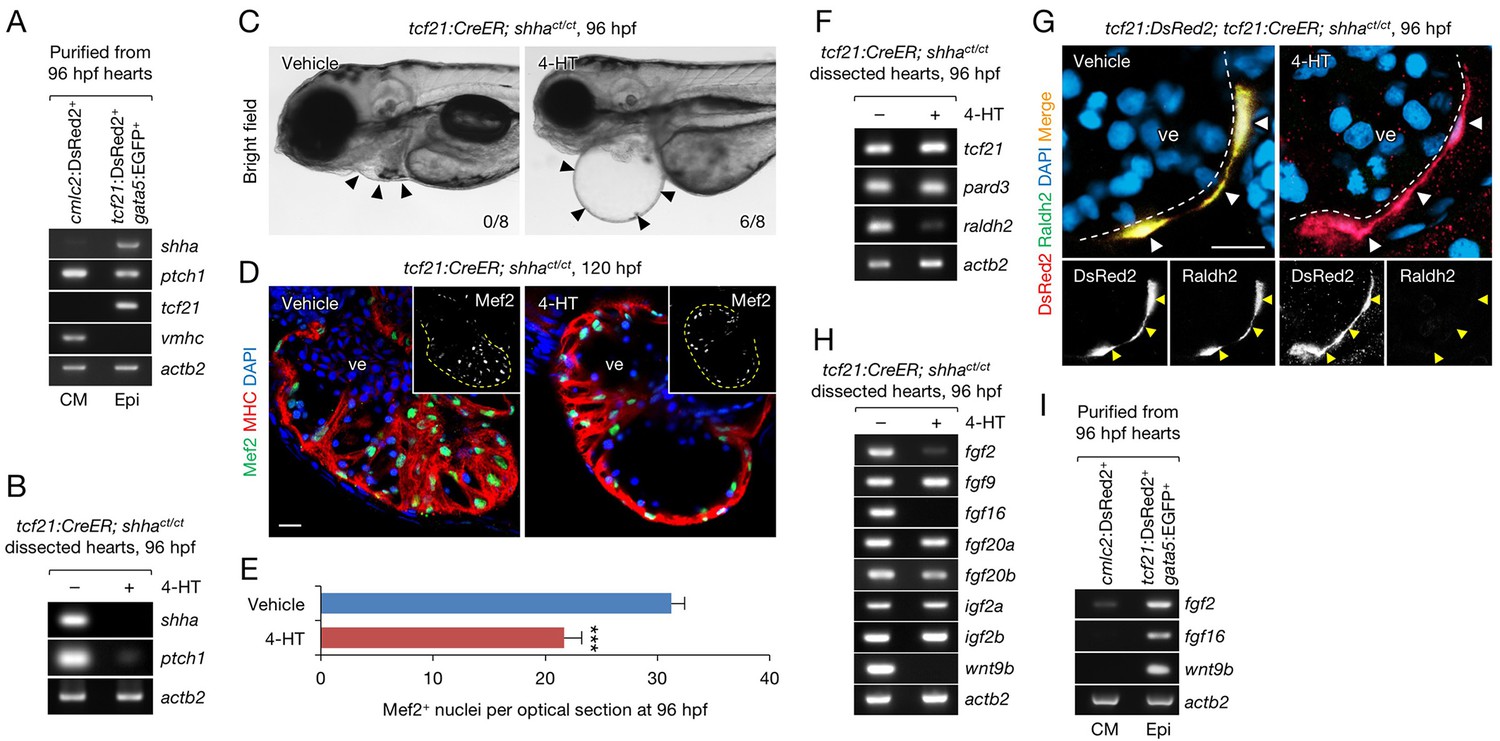
Epicardium-specific inactivation of shha expression during heart development.
(A) Semi-qRT-PCR analysis of purified cardiomyocytes (CM) and epicardial cells (Epi) from 96 hpf hearts (see also Flow Cytometry, Materials and methods). Cardiomyocyte (vmhc) and epicardial (tcf21) markers were used to confirm the specificity of cell sorting. (B) Semi-qRT-PCR analysis of shha and ptch1 expression in hearts dissected from tcf21:CreER; shhact/ct embryos treated with the vehicle (−) or 4-HT (+). (C) Phenotype of tcf21:CreER; shhact/ct embryos treated with the vehicle or 4-HT. Severe cardiac edema was observed in 4-HT–treated embryos at 96 hpf (six abnormal in eight analyzed; right, arrowheads) but not in vehicle-treated embryos (zero abnormal in eight analyzed; left, arrowheads; n = 8 each; p<0.01, Fisher’s exact test). (D) Immunofluorescence of heart sections obtained from vehicle- or 4-HT–treated tcf21:CreER; shhact/ct embryos. Insets, single-channel images of Mef2 immunofluorescence. Dotted yellow lines in insets depict the outline of the ventricle. (E) Quantification of Mef2+ nuclei from the sections obtained from the vehicle- or 4-HT–treated tcf21:CreER; shhact/ct embryos in D (n = 13 and 12). The data are presented as the mean ± SEM (***p<0.001, Mann–Whitney U test). (F) Semi-qRT-PCR analysis of epicardial marker gene expression in hearts dissected from tcf21:CreER; shhact/ct embryos treated with the vehicle (−) or 4-HT (+). (G) Immunofluorescence staining of heart sections obtained from vehicle- or 4-HT–treated tcf21:CreER; shhact/ct embryos. Raldh2 immunofluorescence was detected in tcf21:DsRed2+ epicardial cells in vehicle-treated embryos (left, arrowheads) but not in 4-HT-treated embryos (right, arrowheads). Bottom panels, single-channel images of Raldh2 immunofluorescence. (H) Semi-qRT-PCR analysis of the expression of myocardial growth factor genes in hearts dissected from tcf21:CreER; shhact/ct embryos treated with the vehicle (−) or 4-HT (+). (I) Semi-qRT-PCR analysis of shha-dependent myocardial growth factor genes in purified cardiomyocytes (CM) and epicardial cells (Epi) obtained from 96 hpf hearts. Single confocal sections are shown in D and G. ve, ventricle. Scale bar, 10 μm.
Figure 4—figure supplement 1
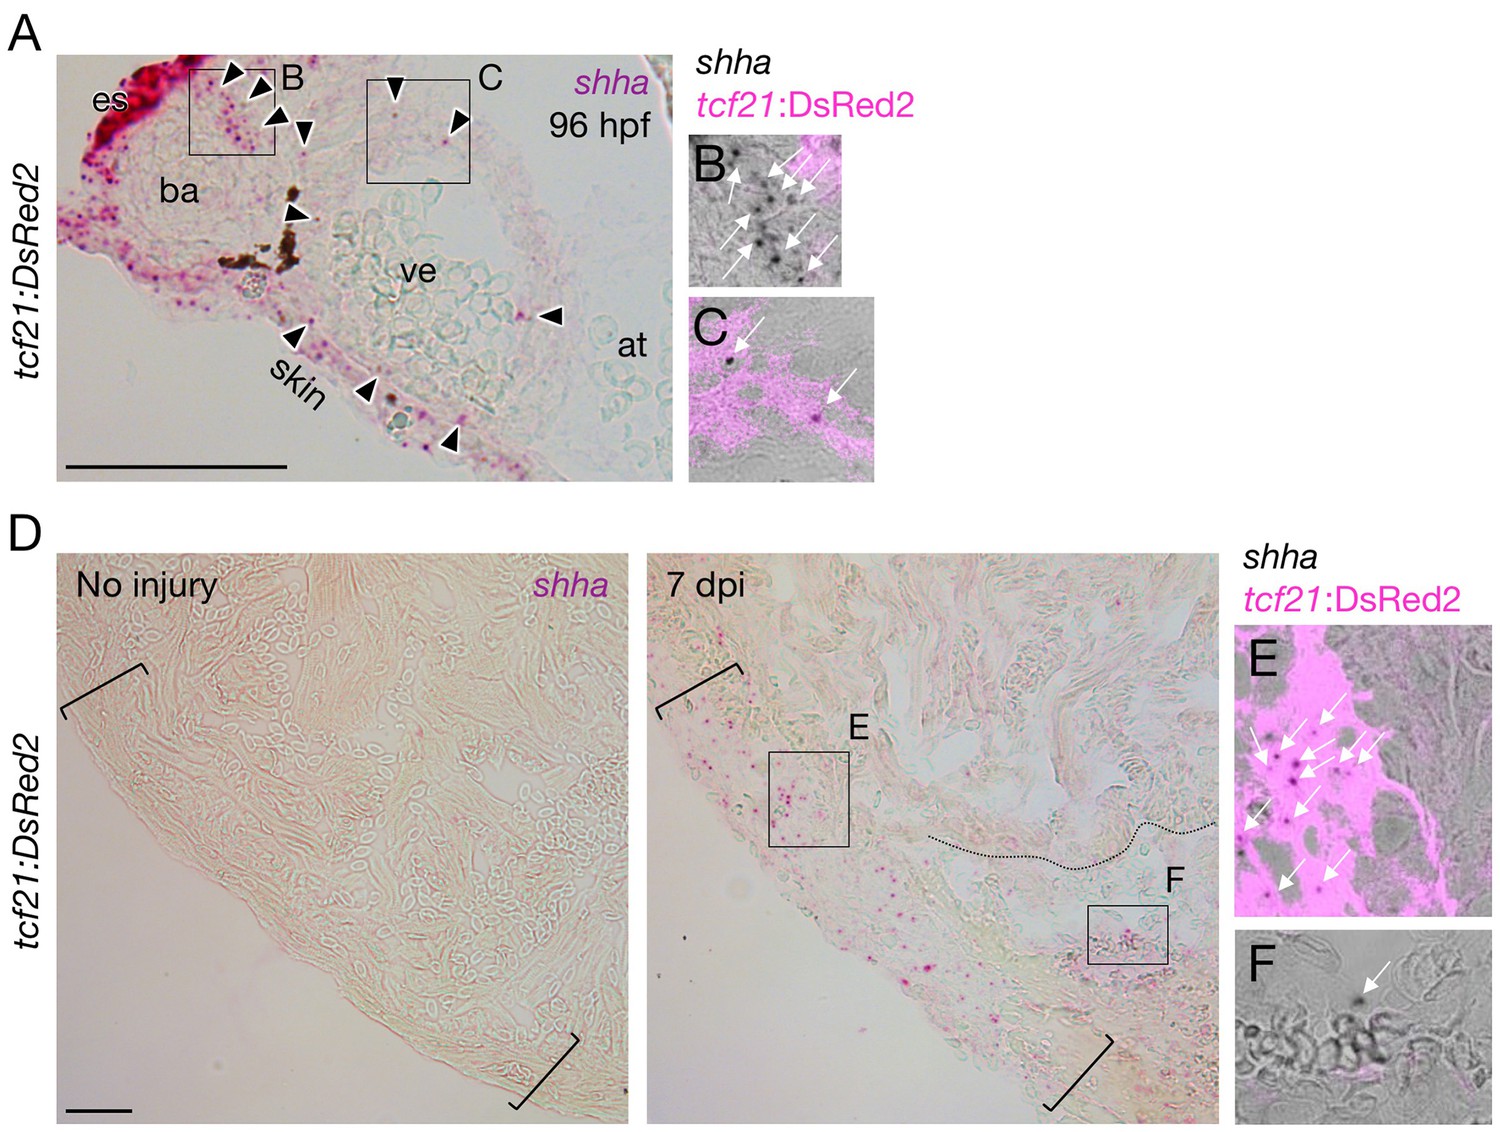
shha expression during heart development and regeneration.
(A–C) shha expression during heart development in zebrafish. Single confocal slice images of the rectangles in A are shown in B and C. (D–F) shha expression during heart regeneration in zebrafish. Single confocal slice images of the rectangles in the right panel of D are shown in E and F. at, atrium; ba, bulbus arteriosus; es, esophagus; ve, ventricle. Scale bar, 50 μm.
Figure 4—figure supplement 2
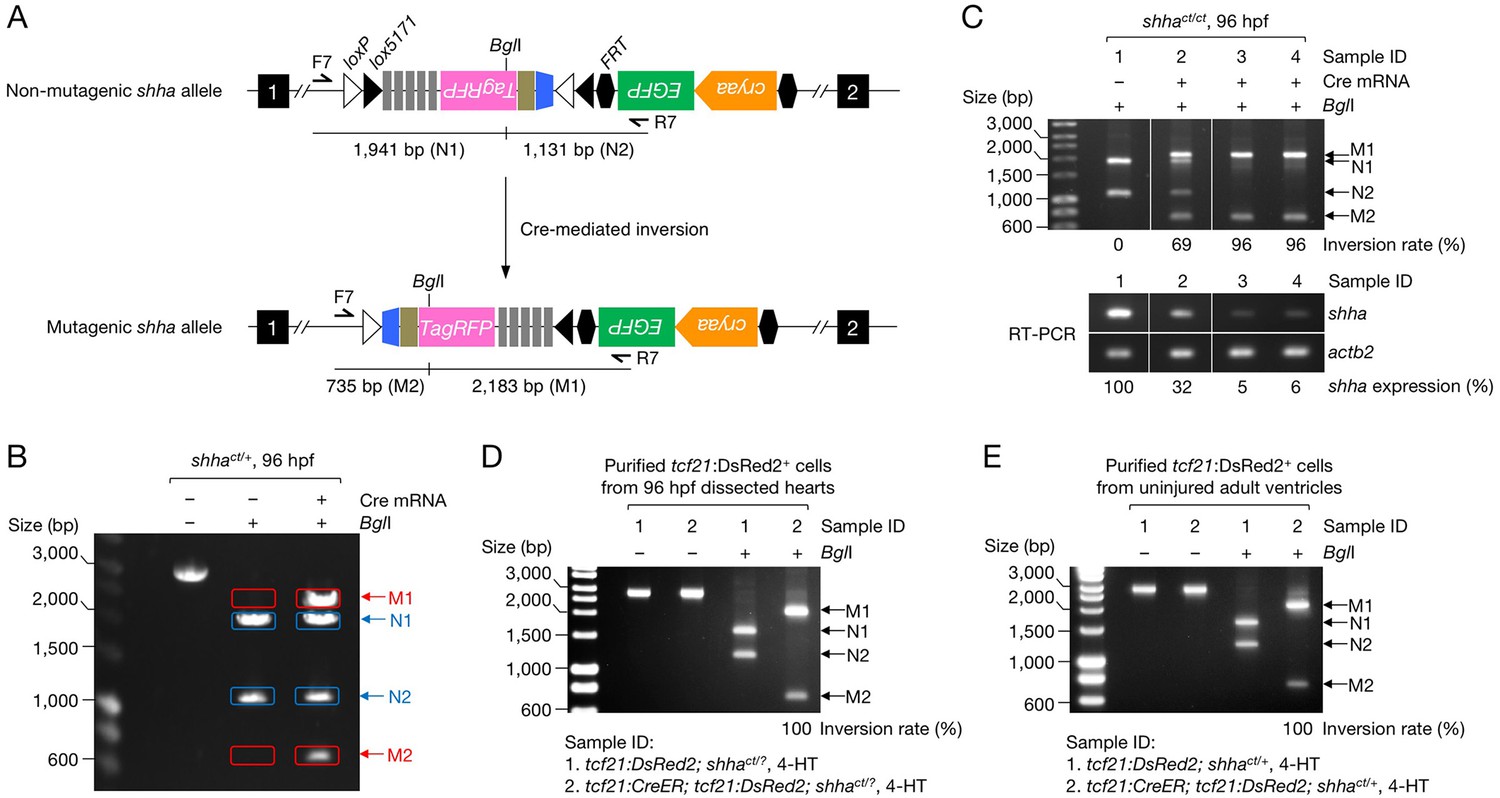
Inversion rate measurement.
(A) Schematic of the non-mutagenic and mutagenic allele, primer sites, and BglI recognition site. (B) A gel image showing the PCR products of the non-mutagenic alleles without (left) and with BglI digestion (middle) and the PCR products of the mutagenic alleles with BglI digestion (right). Genomic DNA was prepared from 96 hpf shhact/+ embryos injected with (+) or without (−) Cre mRNA at single-cell stage. Cre mRNA was prepared from linearized pCS2-iCRE-BFP, in which iCRE cDNA is linked to TagBFP via P2A peptide sequence. (C) Analysis of inversion rate and shha expression levels in single embryos. Embryos were prepared from an incross of shhact/+ fish and injected with Cre mRNA at single-cell stage. Embryos without Cre mRNA injection were used as control (Sample 1). The injected embryos were separated based on the expression of TagBFP at moderate (Sample 2) and high levels (Sample 3 and 4). Individual embryos were genotyped at 96 hpf and genomic DNA and total RNA of each embryo using TRIzol following the manufactured protocol. The upper panels are the gel images used for inversion rate measurement. The numbers on the bottom are the obtained inversion rate in each sample. The lower panels are the results of semi-qRT-PCR analysis of shha expression levels of each sample. (D) Analysis of inversion rate in epicardial cells in zebrafish embryos. Embryos were prepared from crosses of tcf21:DsRed2; shhact/+ fish with shhact/+ fish (Sample 1) and tcf21:CreER; shhact/+ fish with tcf21:DsRed2; shhact/+ fish (Sample 2). Embryos were treated with 4-HT and examined for DsRed2 expression to screen tcf21:DsRed2 transgene and lens EGFP expression to screen tcf21:CreER transgene (Kikuchi et al., 2011). Lens EGFP from tcf21:CreER transgene is considerably stronger than that from shhact alleles in embryos, which enables us to sort tcf21:CreER+ embryos with shhact background. PCR genotyping on shhact alleles were not performed; this does not affect the measurement as the inversion rate is quantified based on the PCR products of the shhact alleles. tcf21:DsRed2+ epicardial cells were isolated by FACS and 1,000 DsRed2+ cells were used for analysis. The estimated inversion rate is 100%; note that the bands from the non-mutagenic allele (N1 and N2) are undetectable in Sample 2 after BglI digestion. (E) Analysis of inversion rate in epicardial cells in the adult zebrafish ventricle. Ventricles were prepared from 4-HT–treated adult tcf21:DsRed2; shhact/+ fish (Sample 1) and tcf21:CreER; tcf21:DsRed2; shhact/+ fish (Sample 2). tcf21:DsRed2+ epicardial cells were isolated by FACS and 5000 DsRed2+ cells were used for analysis. The estimated inversion rate is 100%; note that the bands from the non-mutagenic allele (N1 and N2) are undetectable in Sample 2 after BglI digestion.
Figure 5 with 2 supplements
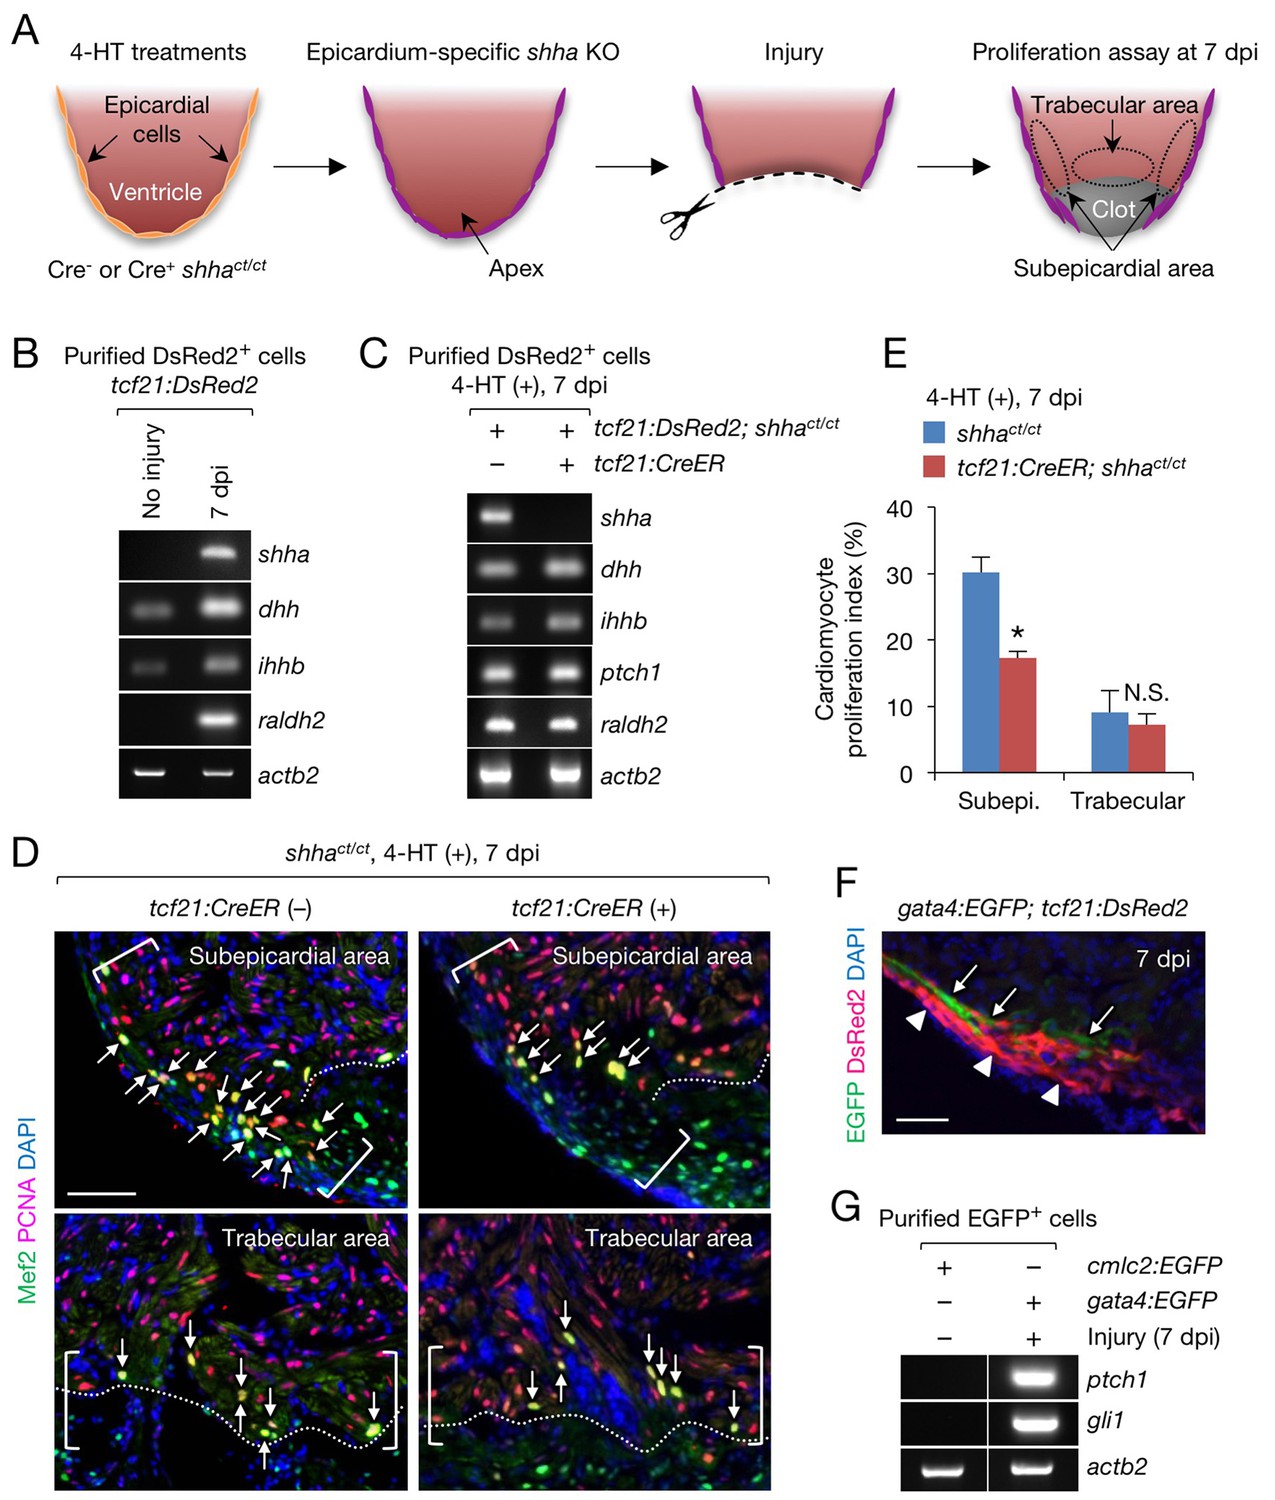
Epicardial shha expression promotes subepicardial cardiomyocyte proliferation during heart regeneration.
(A) Schematic of the experiment. (B) Semi-qRT-PCR analysis of shha in purified tcf21:DsRed2+ epicardial cells obtained from uninjured and injured (7 dpi) tcf21:DsRed hearts. Injury was confirmed by the induction of raldh2 expression. (C) Semi-qRT-PCR analysis of Hh pathway genes using purified tcf21:DsRed2+ epicardial cells obtained from 4-HT–treated 7 dpi tcf21:DsRed; shhact/ct (control, left) and tcf21:DsRed; tcf21:CreER; shhact/ct hearts (right). (D) Immunofluorescence images of the subepicardial (top) and trabecular areas (bottom) of heart sections obtained from 4-HT–treated 7 dpi shhact/ct (control) or tcf21:CreER; shhact/ct hearts. Brackets, subepicardial areas. Dotted lines, approximate amputation plane. Arrows indicate proliferating cardiomyocytes. (E) Quantification of cardiomyocyte proliferation in the subepicardial and trabecular areas of the heart sections obtained from 4-HT–treated 7 dpi shhact/ct (control) or tcf21:CreER; shhact/ct hearts shown in D (n = 6 each). The data are presented as the mean ± SEM (**p<0.01, Mann–Whitney U test). N.S., not significant (p=0.3367). (F) Image of heart sections obtained from 7 dpi gata4:EGFP; tcf21;DsRed2 fish. Subepicardial cardiomyocytes (green, arrows) associate with epicardial cells (magenta, arrowheads). (G) Semi-qRT-PCR analysis of shha pathway genes using purified subepicardial cardiomyocytes obtained from 7 dpi gata4:EGFP ventricles. Cardiomyocytes purified from uninjured cmlc2:EGFP ventricles were used as negative controls. Scale bar, 50 μm.
Figure 5—figure supplement 1
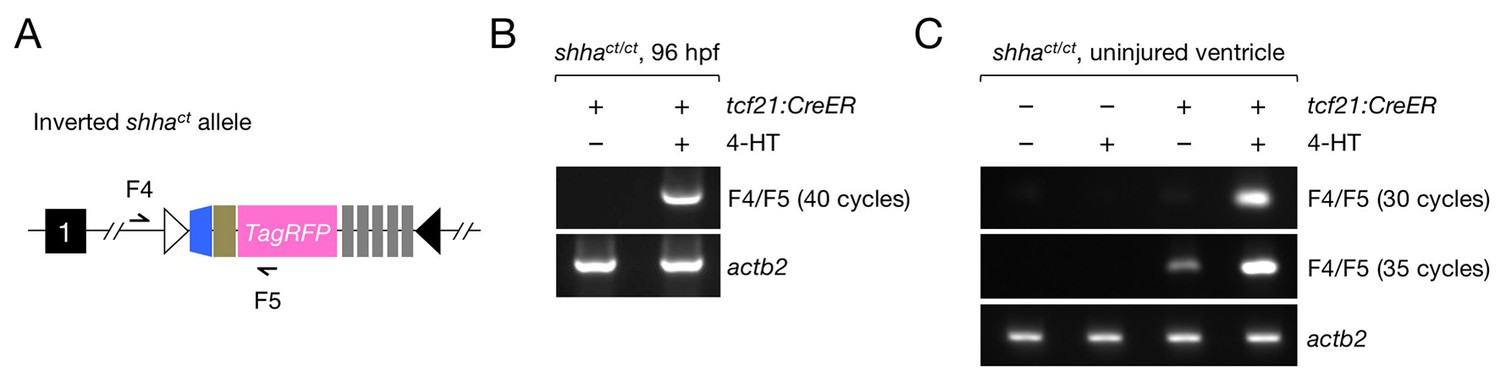
Assessment of spontaneous cassette inversion.
(A) Schematic of the inverted shhact allele and primers sites. (B) The inverted allele was not detected in untreated tcf21:CreER; shhact/ct embryos using 40 cycles of PCR. (C) The inverted allele was not detected in untreated adult tcf21:CreER; shhact/ct fish using 30 cycles of PCR, but it was detected when the cycle number was increased to 35. Each PCR sample used genomic DNA isolated from five pooled hearts as a template.
Figure 5—figure supplement 2
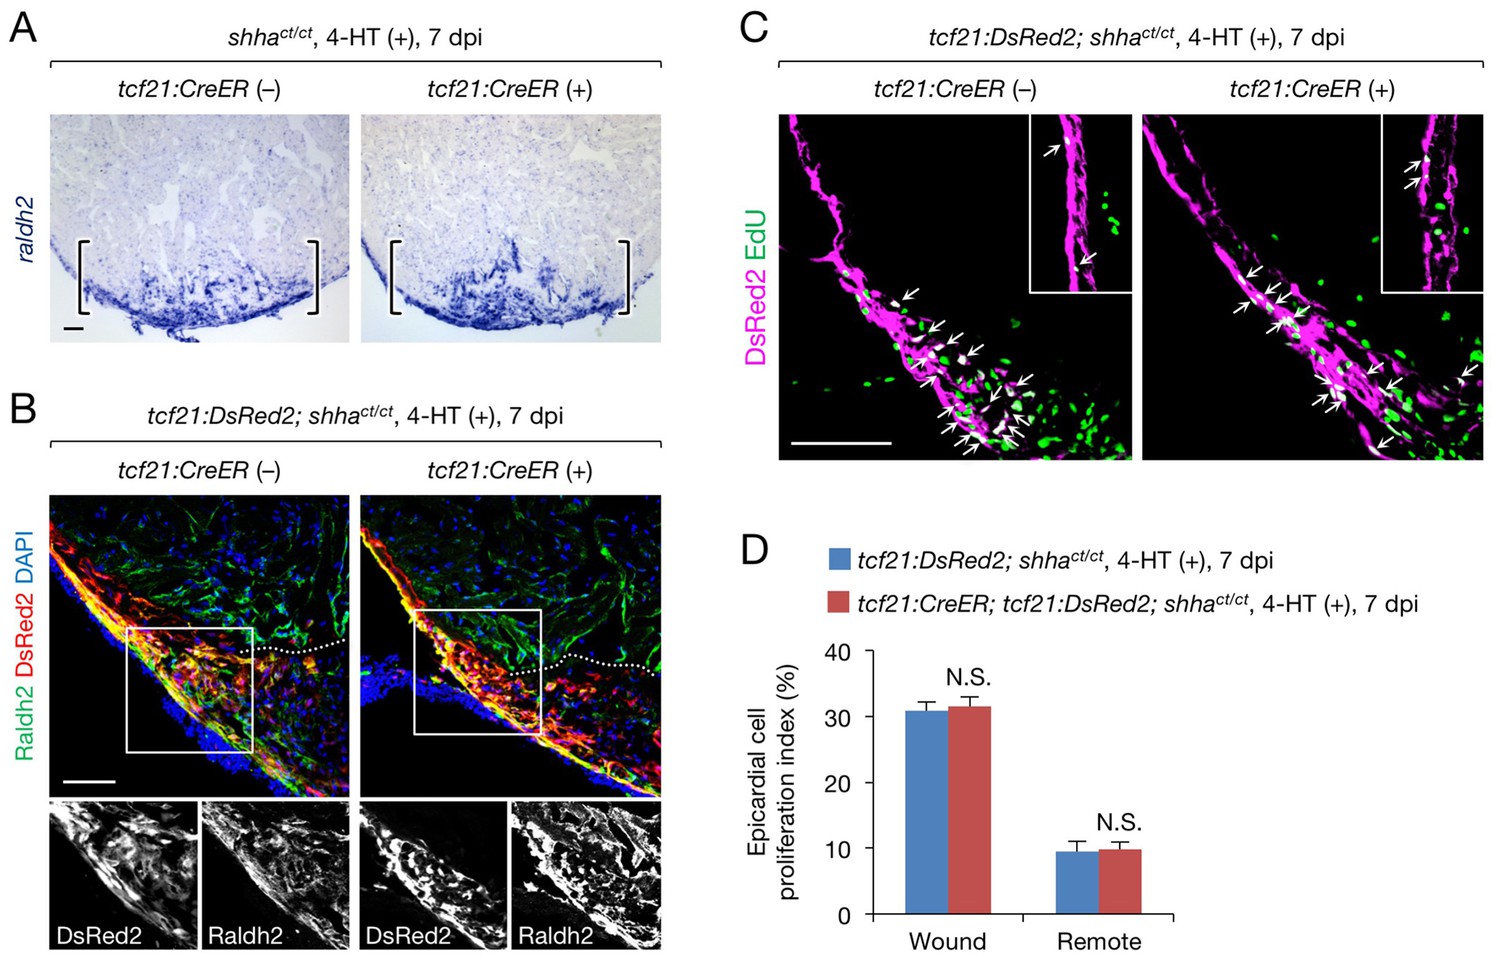
A redundant role for epicardial shha in epicardial migration and proliferation during heart regeneration.
(A) In situ hybridization analysis of raldh2 expression in sections obtained from 4-HT-treated 7 dpi shhact/ct (control) and tcf21:CreER; shhact/ct hearts. Brackets, injury site. (B) Immunofluorescence staining of Raldh2 and DsRed2 using sections obtained from 4-HT-treated 7 dpi tcf21:DsRed; shhact/ct (control) and tcf21:DsRed; tcf21:CreER; shhact/ct hearts (right). Single-channel images of the rectangle are shown at the bottom. Dotted line, approximate amputation plane. (C) Immunofluorescence staining of DsRed2 and EdU in sections obtained from 4-HT-treated 7 dpi tcf21:DsRed; shhact/ct (control) and tcf21:CreER; tcf21:DsRed; shhact/ct hearts. Inset, non-injured area. Arrows indicate proliferating tcf21+ epicardial cells, which were defined as epicardial cells colabeled DsRed2 and EdU. (D) Quantification of epicardial cell proliferation in the sections obtained from 4-HT-treated 7 dpi tcf21:DsRed; shhact/ct (control) and tcf21:CreER; tcf21:DsRed; shhact/ct hearts shown in C (n = 5 each). The data represent the mean ± SEM (wound, p=0.754; remote, p=0.602; Mann–Whitney U test). N.S., not significant. Single confocal slice images are shown in B and C. Scale bar, 50 μm.
Additional files
-
Supplementary file 1
Sequences of PCR primers used in this study.
- https://doi.org/10.7554/eLife.24635.018
-
Supplementary file 2
Raw quantification data and statistical tests from experiments in this study.
- https://doi.org/10.7554/eLife.24635.019
Download links
A two-part list of links to download the article, or parts of the article, in various formats.
Downloads (link to download the article as PDF)
Open citations (links to open the citations from this article in various online reference manager services)
Cite this article (links to download the citations from this article in formats compatible with various reference manager tools)
Dissection of zebrafish shha function using site-specific targeting with a Cre-dependent genetic switch
eLife 6:e24635.
https://doi.org/10.7554/eLife.24635


