A type I IFN-dependent DNA damage response regulates the genetic program and inflammasome activation in macrophages
- Weill Cornell Medical College, United States
- Washington University School of Medicine, United States
- National Institute of Environmental Health Sciences, United States
Figures
Figure 1 with 2 supplements
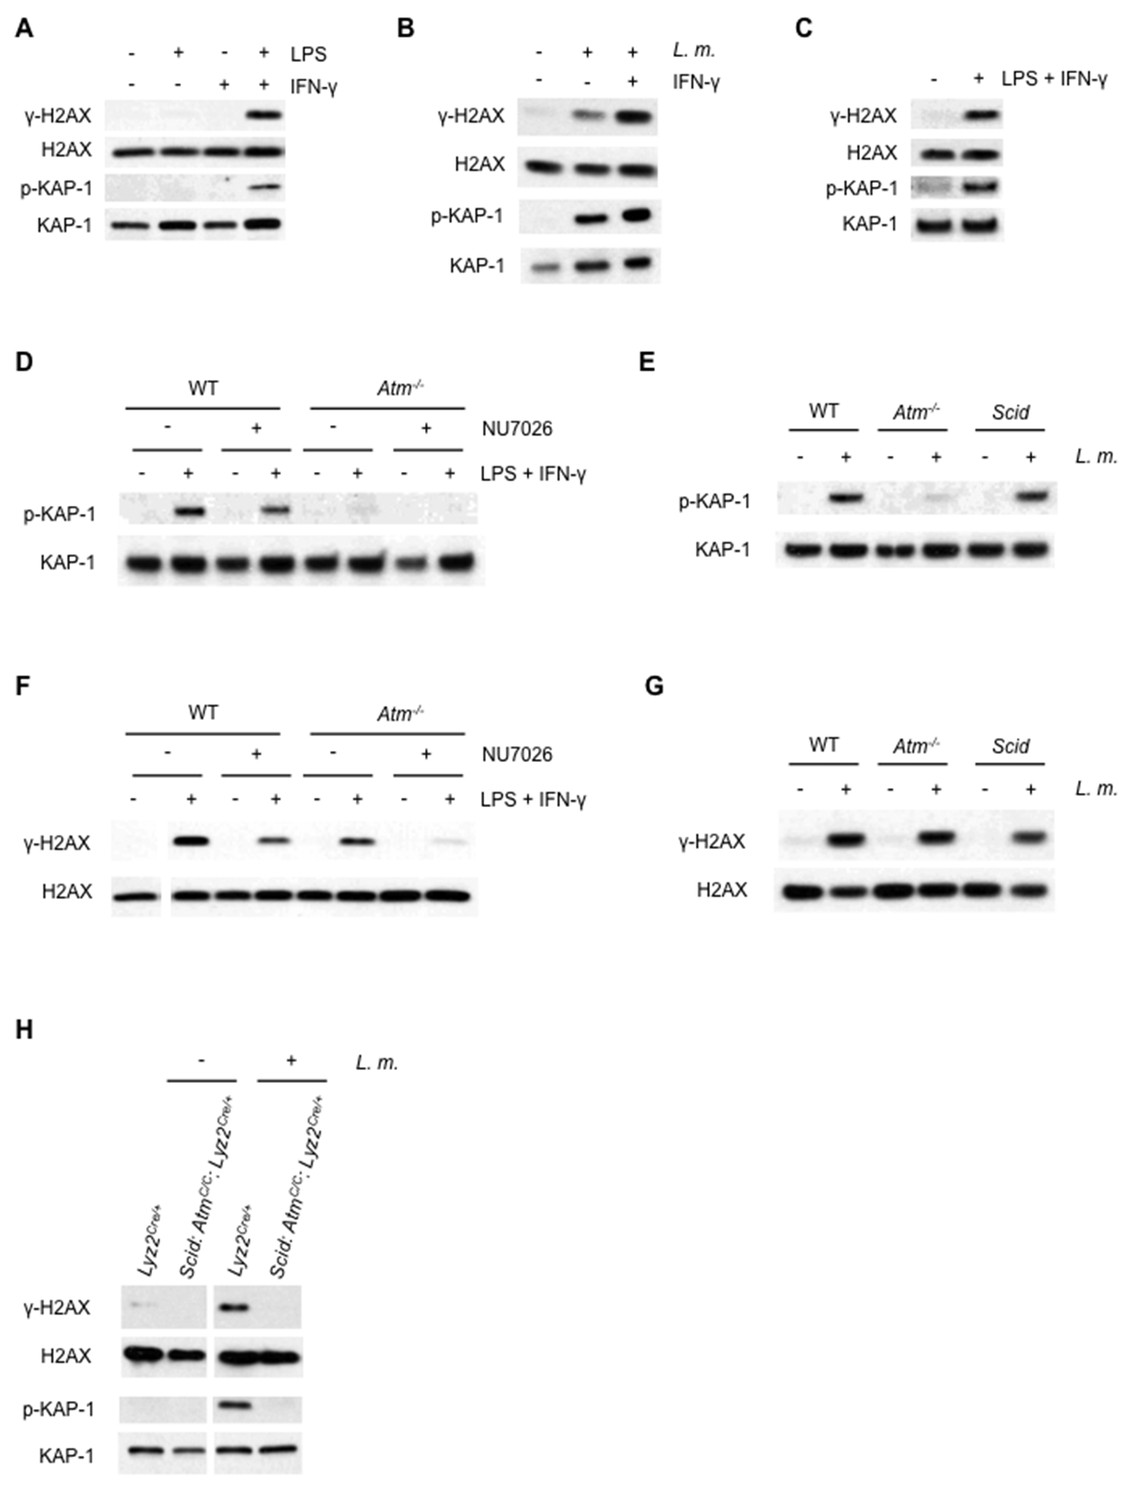
ATM and DNA-PKcs-dependent DDR activation in macrophages.
(A–C) Western blotting for γ-H2AX, H2AX, phosphorylated KAP-1 (p-KAP-1) and KAP-1 in whole cell lysates from (A) wild type (WT) BMDMs after no stimulation (-) or stimulation (+) with LPS, IFN-γ, or both for 9 hr. (B) WT BMDMs after no infection (-) or infection (+) with L. monocytogenes (L. m.) either in the presence (+) or absence (-) of IFN-γ for 9 hr. (C) WT peritoneal macrophages after no stimulation (-) or stimulation (+) with LPS + IFN-γ for 24 hr. (D, F) Western blotting of p-KAP-1 and KAP-1 (D) and γ-H2AX and H2AX (F) in whole cell lysates from WT and Atm-/- BMDMs after no treatment (-) or treatment (+) with LPS + IFN-γ for 9 hr. in the presence (+) or absence (-) of NU7026. (E, G) Western blotting of p-KAP-1 and KAP-1 (E) and γ-H2AX and H2AX (G) in whole cell lysates from WT, Atm-/-, and Scid BMDMs after no infection (-) or infection (+) with L. m. for 24 hr. (H) Western blotting for γ-H2AX, H2AX, p-KAP-1, and KAP-1 in whole cell lysates from Lyz2Cre/+ and Scid:AtmC/C:Lyz2Cre/+ BMDMs after no infection (-) or infection (+) with L. m. for 24 hr. Data are representative of 2–5 independent experiments. Blank spaces in (F) and (H) indicate that blots have been cropped.
Figure 1—figure supplement 1

ATM is efficiently deleted in BMDM.
Southern blot analysis of genomic DNA digested with KpnI and hybridized to the 3’ ATM probe from BMDMs from AtmC/C, Atm-/-and Scid:AtmC/C:Lyz2Cre/+ mice. Arrows indicate the conditional (C) and deleted (-) alleles. Molecular weight (kb) markers are indicated.
Figure 1—figure supplement 2
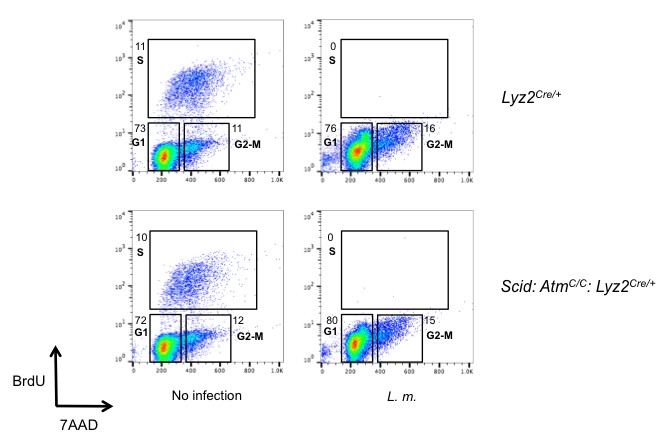
L. monocytogenes infection induces G1 arrest.
Flow cytometric analysis of BrdU incorporation (y axis) and DNA content (7AAD; x axis) was performed in Lyz2Cre/+ and Scid: AtmC/C: Lyz2Cre/+ BMDMs after L. monocytogenes infection for 16 hr. Percentage of cells in each phase of the cell cycle (G1, S, and G2-M) after BrdU labeling is indicated. Data are representative of two independent experiments.
Figure 2 with 1 supplement

Activation of DDR by DNA DSBs.
(A) Neutral Comet assay and Olive Tail Moment quantification of BMDMs left untreated (UT) or after infection with L. m. or LPS + IFN-γ for 12 hr. (B) Immunofluorescence for L. m. (green) and γ-H2AX (red) in WT BMDMs 9 hr. post-infection. Nuclei are revealed by DAPI (blue). (C) Western blotting of DNA Ligase IV-deficient (Lig4loxP/loxP: Lyz2Cre/+) or Lyz2Cre/+ BMDMs after no infection (-) or infection (+) with L. m. for 24 hr. (D) Western blotting of WT or Mre11ATLD1/ATLD1 BMDMs after no stimulation (-) or stimulation (+) with LPS + IFN-γ for 9 hr. (E, F) Western blot analysis of (E) WT BMDMs after no stimulation (-) or stimulation (+) with LPS + IFN-γ for 9 hr. in the presence or absence of MnTMPyP or AGHS (F) WT, iNOS-deficient (Nos2-/-), or NADPH oxidase-deficient (Nox2-/-) BMDMs after no stimulation (-) or stimulation (+) with LPS + IFN-γ for 9 hr. Data are representative of two or more independent experiments. Quantitation in (A) is the mean and SEM of three independent experiments where ≥ 50 tails were analyzed for each condition and Olive Tail Moment of treated BMDMs is expressed as a ratio to untreated BMDMs. *p<0.05 (Student’s paired t-test). Blank spaces in (C) and (FE) indicate that blots have been cropped.
Figure 2—figure supplement 1
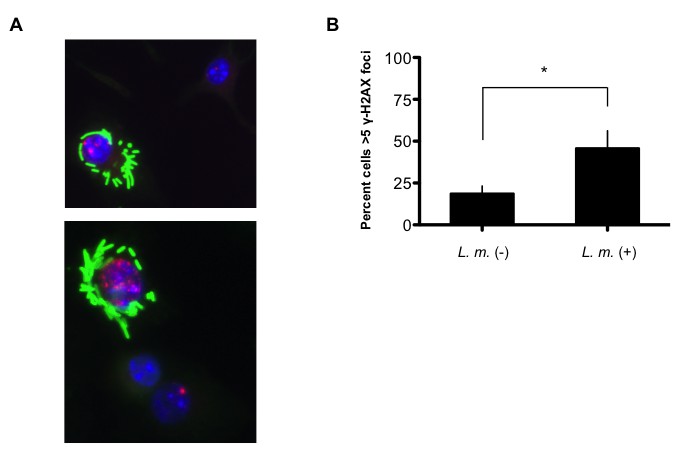
L.monocytogenes-infected BMDM exhibit discrete γ-H2AX foci.
(A) Additional representative images of immunofluorescence for L. m. (green) and γ-H2AX (red) in WT BMDMs 9 hr. post-infection. Nuclei are revealed by DAPI (blue). (B) Quantification of γ-H2AX foci in L. monocytogenes-negative and –positive BMDMs. Nuclei with>5 γ-H2AX foci were scored positive for DDR. 119 and 829 L. monocytogenes-negative and –positive nuclei, respectively, were quantified. Data are the mean and SEM of three independent experiments. *p<0.05.
Figure 3
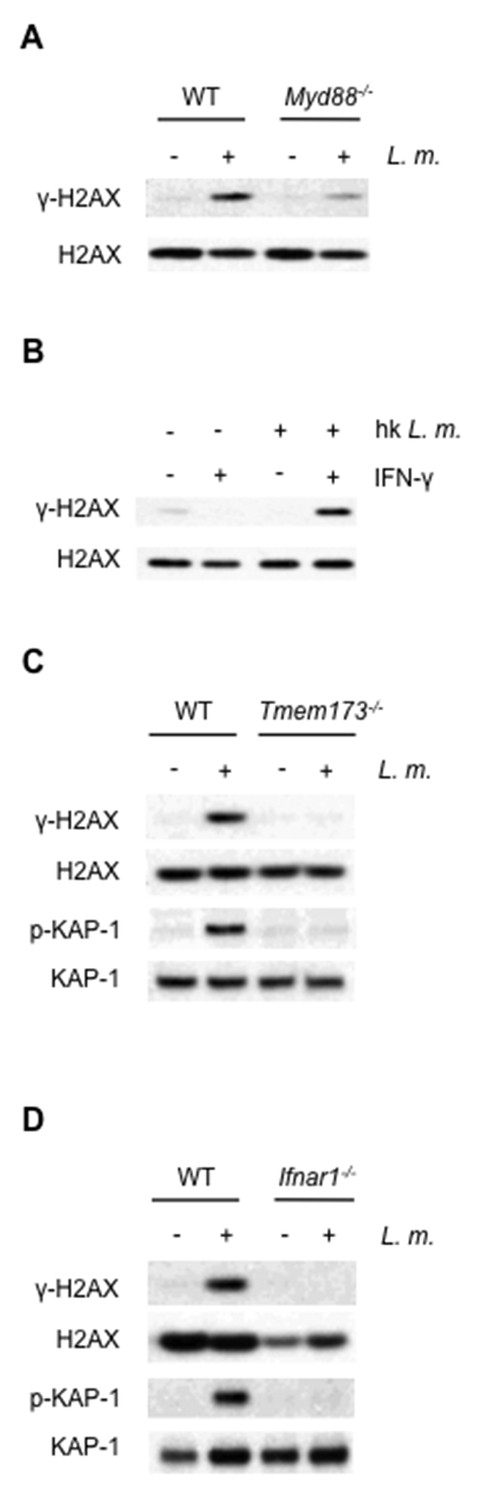
The DDR depends on TLR and interferon signaling cascades.
(A,B) Western blotting for γ-H2AX and H2AX in whole cell lysates from (A) WT or Myd88-/- BMDMs after no infection (-) or infection (+) with L. monoctytogenes (L. m.) for 24 hr. (B) WT BMDMs after no treatment (-) or treatment (+) with IFN-γ, heat-killed L. monocytogenes, or both for 9 hr. (C, D) Western blotting for γ-H2AX, H2AX, p-KAP-1, and KAP-1 in whole cell lysates from WT, Tmem173-/- (C) or Ifnar1-/- (D) BMDMs after no infection (-) or infection with L. m. for 24 hr. Data are representative of 2–4 independent experiments.
Figure 4 with 2 supplements
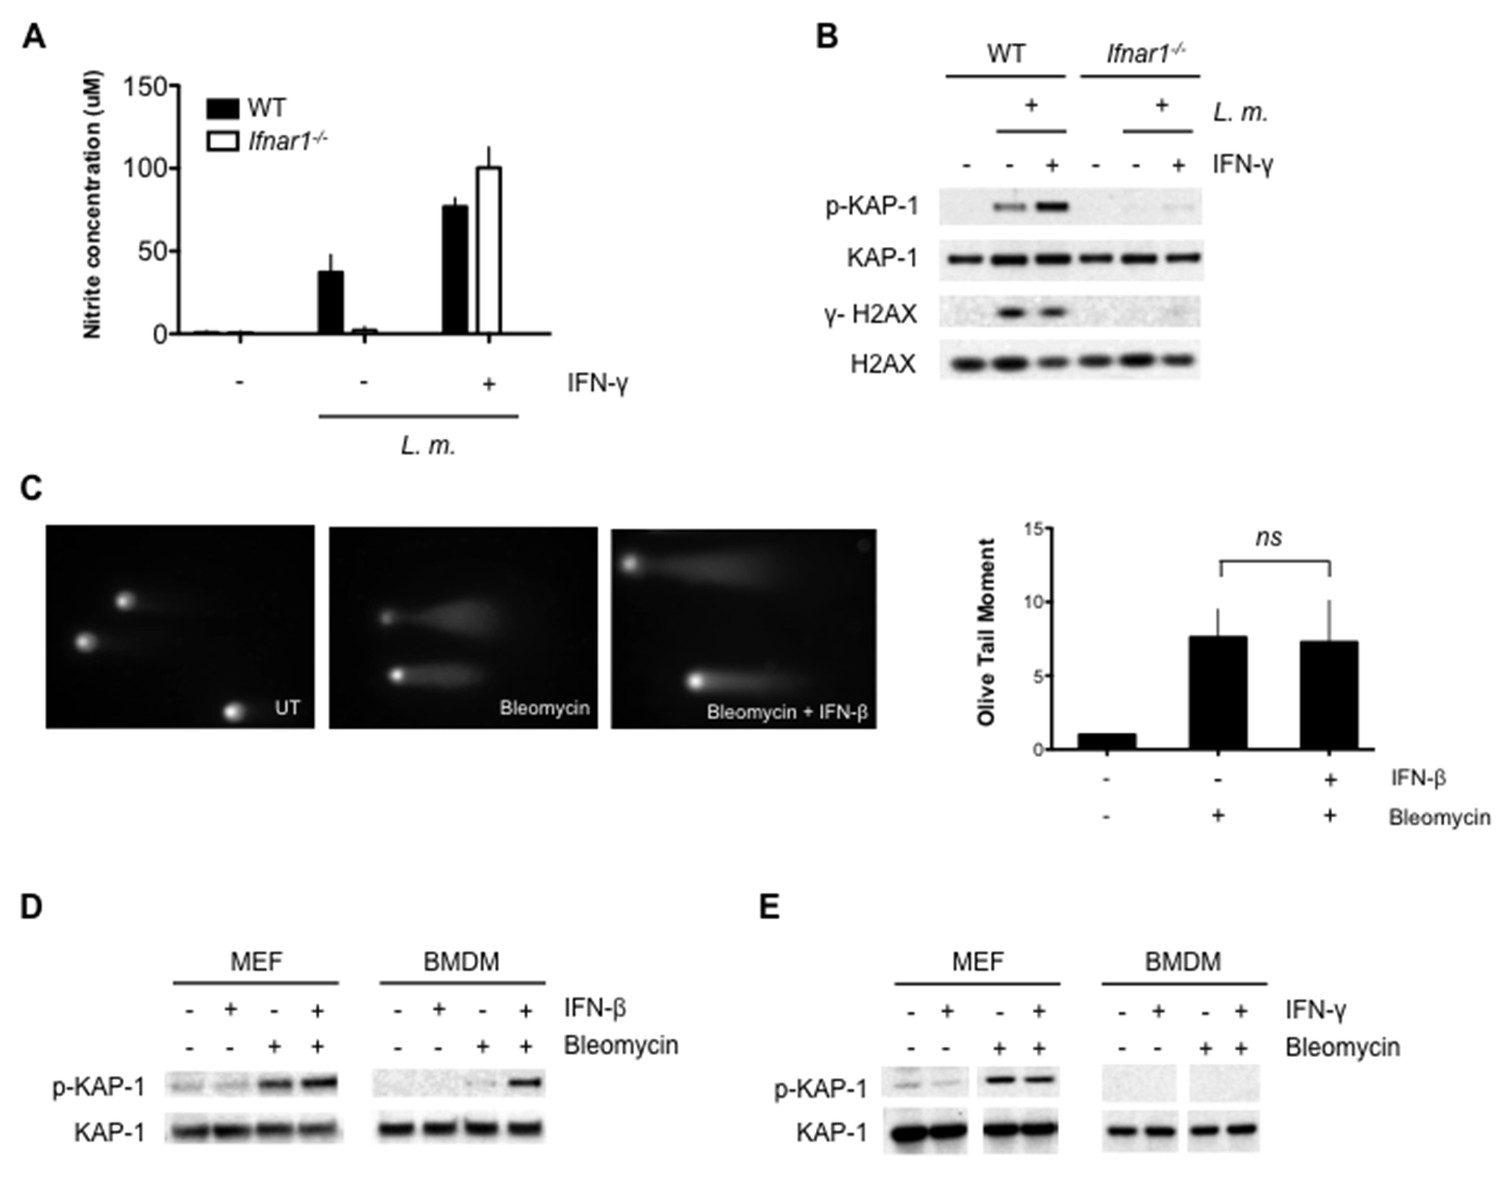
Optimal DDR depends on type I interferon signaling.
(A) Nitrite concentration in culture supernatants collected from WT and Ifnar1-/- BMDMs after no infection (-) or infection (+) with L. m. for 24 hr. in the presence or absence of IFN-γ. Data are a compilation of three independent experiments and depict mean and SEM. (B) Western blotting for γ-H2AX, H2AX, p-KAP-1, and KAP-1 in whole cell lysates from WT and Ifnar1-/- BMDMs after no infection (-) or infection (+) with L. m. for 24 hr. in the presence or absence of IFN-γ . (C) Neutral Comet assay and Olive Tail Moment quantification of BMDMs left untreated (UT) or after treatment with bleomycin in the presence or absence of type I interferon (IFN-β). (D, E) Western blotting for p-KAP-1 and KAP-1 of WT mouse embryonic fibroblasts (MEFs) or BMDMs after no stimulation (-) or stimulation with bleomycin (1 ug/mL), (D) IFN-β (100 U/mL), or bleomycin + IFN-β for 6 hr. (E) IFN-γ (10 ng/mL), or bleomycin + IFN-γ for 6 hr. Data are representative of 2-4 independent experiments. Quantitation in (C) is the mean and SEM of three independent experiments where ≥50 tails were analyzed for each condition and Olive Tail Moment of treated is expressed as a ratio to untreated. ns = not significant. Blank space in (E) indicates that blot has been cropped
Figure 4—figure supplement 1
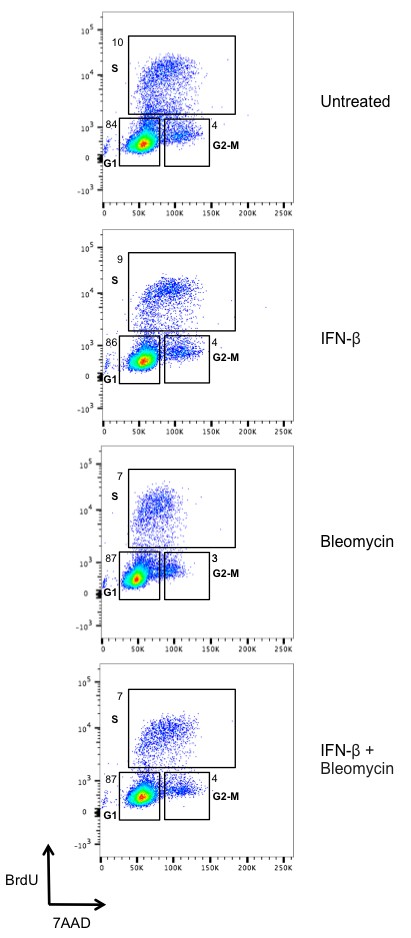
Type I IFN does not affect the cell cycle in BMDMs.
Flow cytometric analysis of BrdU incorporation (y axis) and DNA content (7AAD; x axis) was performed in BMDMs left untreated or after stimulation with IFN-β (100 U/mL), bleomycin (1 ug/mL), or bleomycin + IFN-β for 6 hr. Percentage of cells in each phase of the cell cycle (G1, S, and G2-M) after BrdU labeling is indicated. Data are representative of three independent experiments.
Figure 4—figure supplement 2
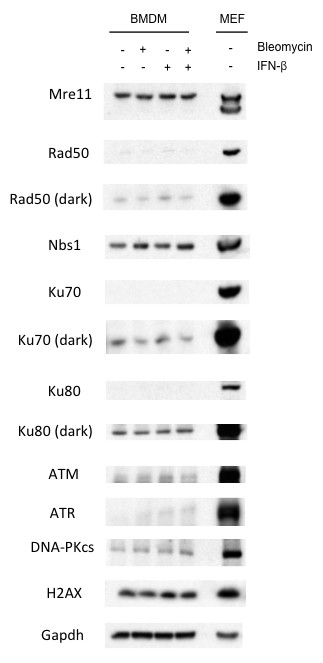
Type I IFN does not impact expression of key DDR factors.
Western blotting for Mre11, Nbs1, Rad50, Ku70, Ku80, ATM, ATR, DNA-PKcs, and H2AX in untreated (-) WT mouse embryonic fibroblasts (MEFs) or BMDMs after no stimulation (-) or stimulation (+) with IFN-β (100 U/mL), bleomycin (1 ug/mL), or bleomycin + IFN-β for 6 hr. GAPDH is used as a protein loading control. Data are representative of three independent experiments.
Figure 5
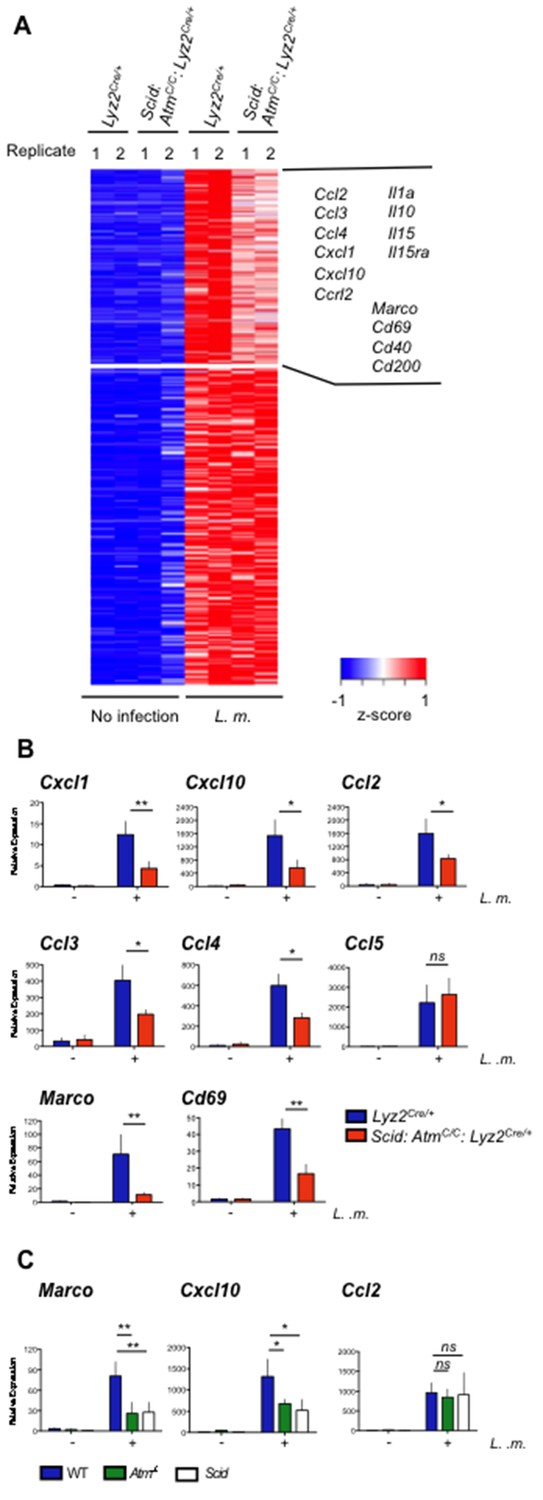
ATM and DNA-PKcs regulate the genetic program of activated macrophages.
(A) Heat map showing genes that are significantly up-regulated (≥4 fold, adj. p-value<0.001) in L. m.-infected Lyz2Cre/+and Scid:Atm C/C:Lyz2Cre/+ BMDMs relative to no infection. Red indicates relatively higher expression; blue indicates relatively lower expression. Genes with increased expression (>1.25 fold) in Lyz2Cre/+controls relative to L. m.-infected Scid:Atm C/C:Lyz2Cre/+ BMDMs are clustered in the upper right hand corner of the heat map. Select genes in this group are indicated. Shown are two biological replicates (1 and 2) for each condition and genotype. (B,C) Quantitative real-time PCR (RT-PCR) of gene expression in uninfected (-) and L. m.-infected (+) (B) Scid:Atm C/C:Lyz2Cre/+ and Lyz2Cre/+ BMDMs and (C) Atm-/-, Scid, and WT BMDMs. Data are the mean and SEM of three or more independent experiments. *p<0.05, **p<0.01, ns = not significant.
-
Figure 5—source data 1
Gene expression changes induced by L. monocytogenes infection.
Normalized log2 probe values for genes up-regulated (≥4 fold, adj. p-value<0.001) in L. m.-infected Lyz2Cre/+and Scid:Atm C/C:Lyz2Cre/+ BMDMs relative to uninfected cells. The fold-change between infected Scid:Atm C/C:Lyz2Cre/+-and infected Lyz2Cre/+ cells for each gene is also shown.
- https://doi.org/10.7554/eLife.24655.012
Figure 6 with 2 supplements
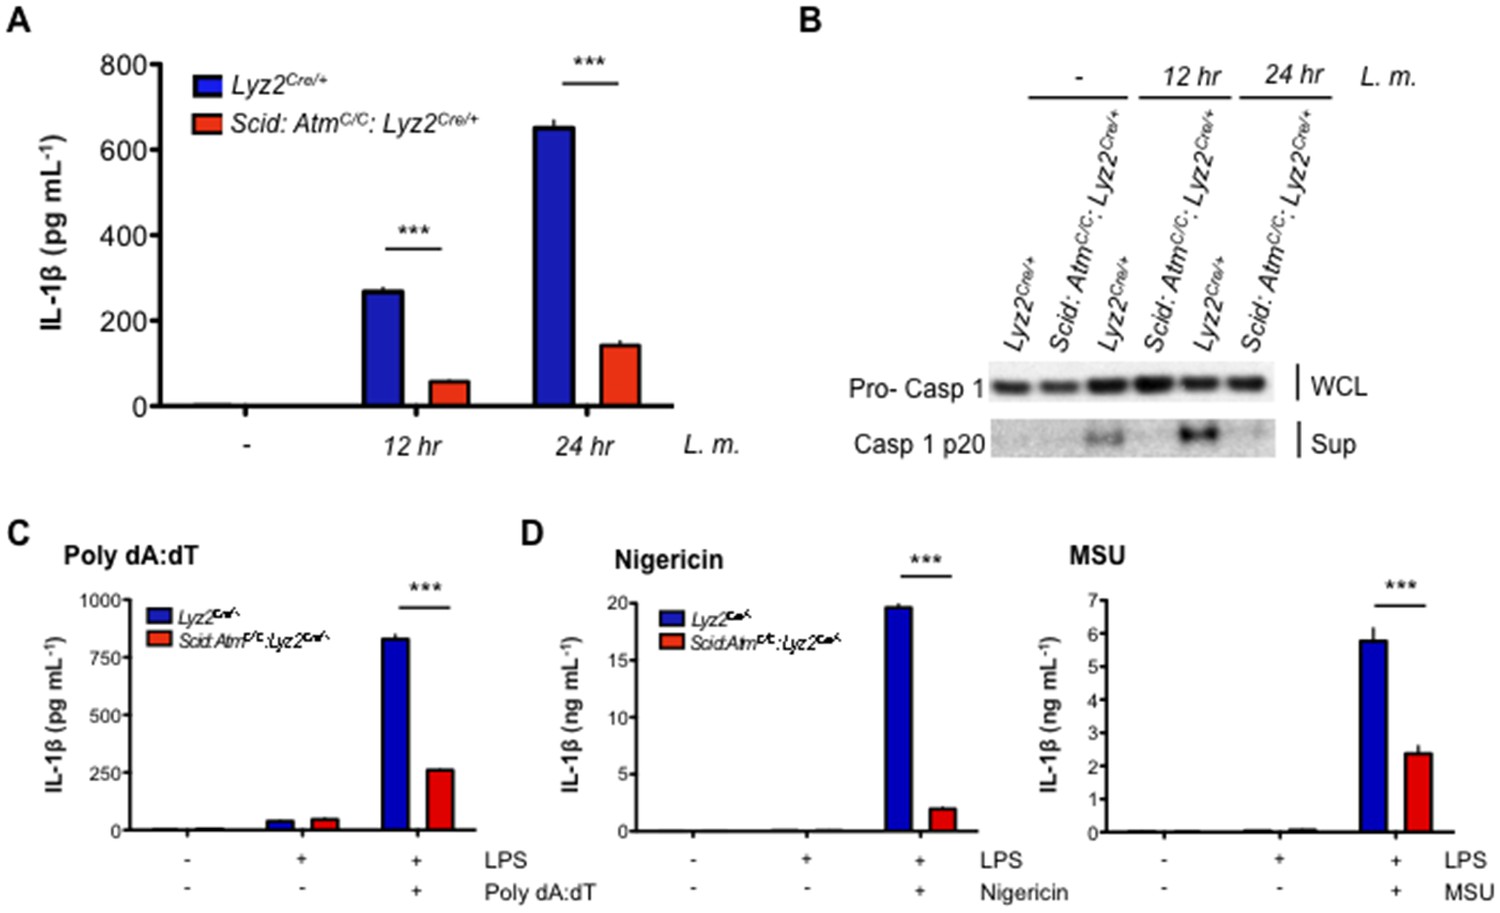
DDR regulates inflammasome activation.
(A) IL-1β protein concentration as determined by ELISA in supernatants from uninfected (-) and L. m.-infected (+) Scid:AtmC/C:Lyz2Cre/+ and Lyz2Cre/+ BMDMs 12 and 24 hr. post-infection. Data are mean and SEM of technical replicates and are representative of four independent experiments. ***p<0.0001. (B) Western blot analysis of pro-caspase 1 in whole cell lysates (WCL) and active caspase 1 (p20) in supernatants (Sup) from Lyz2Cre/+ and Scid:AtmC/C:Lyz2Cre/+ BMDMs 12 and 24 hr. post-L. m. infection. Data are representative of two independent experiments. (C,D) IL-1β protein concentration by ELISA in supernatants from Lyz2Cre/+ and Scid:AtmC/C:Lyz2Cre/+ BMDMs left untreated (-) or after treatment with LPS (200 ng/mL) for 12 hr and in the presence or absence of (C) poly(dA:dT) (5 ug/mL) for 12 hr. (D) nigericin (5 uM) for 30 min. or monosodium urate crystals (MSU, 50 ug/mL) for 12 hr. Data are mean and SEM of technical replicates and are representative of two or three independent experiments. ***p<0.0001.
Figure 6—figure supplement 1
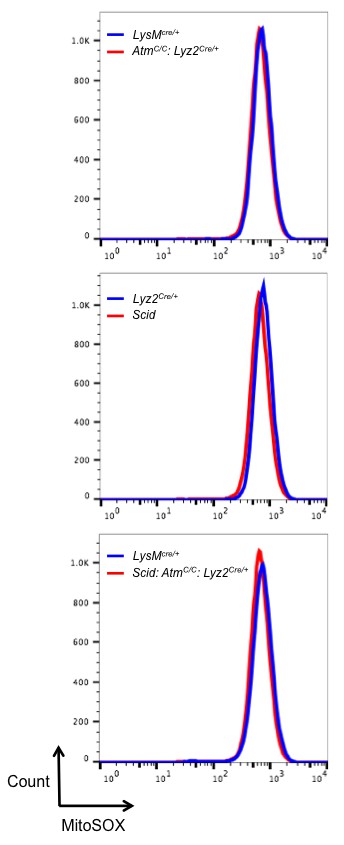
Mitochondrial ROS levels are equivalent in DDR-deficient and –sufficient BMDM.
Flow cytometric analysis of mitochondrial superoxide levels in live BMDM from Lyz2Cre/+, AtmC/C: Lyz2Cre/+, and Scid: AtmC/C: Lyz2Cre/+ mice. Superoxide is detected with the fluorogenic dye MitoSOX Red.
Figure 6—figure supplement 2

Gene expression of inflammasome components.
(A–D) Quantitative RT- PCR analysis of (A) pro Il-1β, (B) Asc, (C) Nlrp3, and (D) Aim2 gene expression in Scid: AtmC/C: Lyz2cre/+and Lyz2cre/+BMDMs infected (+) or not (-) with L. m. Data are a compilation of three independent experiments and depict mean and SEM. ns = not significant.
Figure 7 with 1 supplement
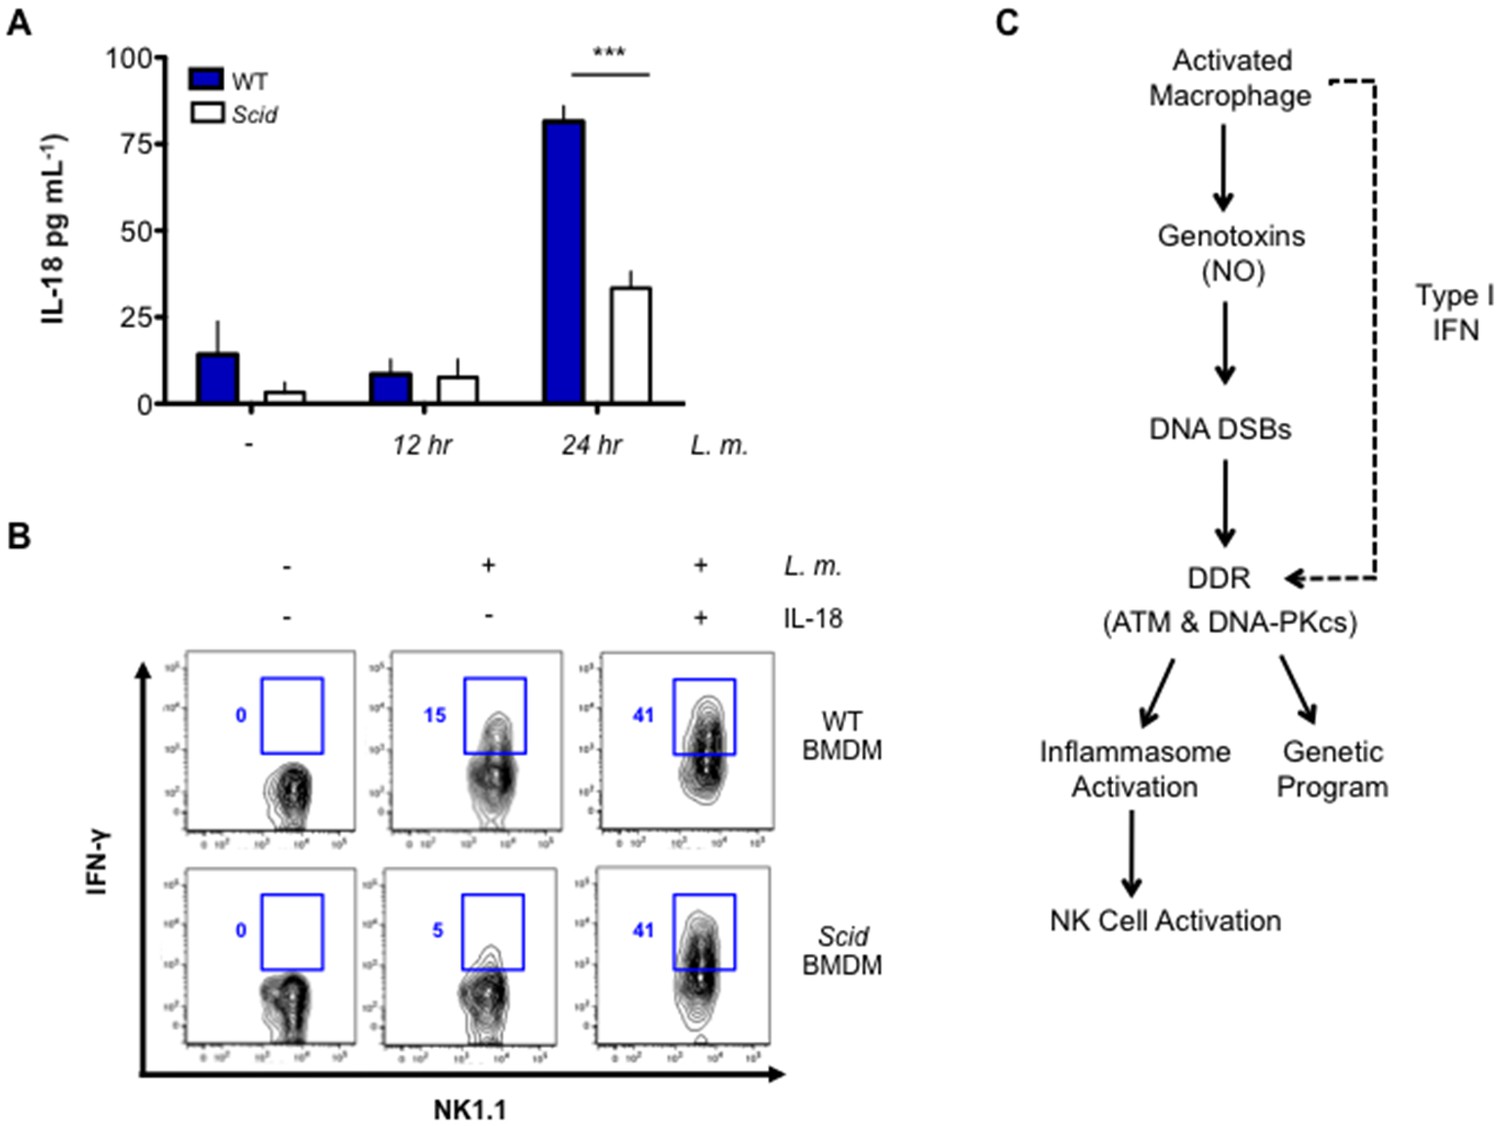
DNA-PKcs regulates IL-18 production and NK cell activation.
(A) IL-18 protein concentration as determined by ELISA in supernatants from uninfected (-) and L. m.-infected WT and Scid BMDMs 12 and 24 hr. post-infection. Data are mean and SEM of technical replicates and are representative of three independent experiments. ***p≤0.0002. (B) Flow cytometric analysis of intracellular IFN-γ production by WT splenic NK cells co-cultured with uninfected or L. m.-infected WT or Scid BMDM with (+) or without (-) the addition of IL-18 for 15 hr. Data are representative of four independent experiments. (C) Schematic showing the regulation of macrophage functions by DDR.
Figure 7—figure supplement 1

Il18 and Il12 gene expression is equivalent in WT and Scid BMDM after L.m. infection.
(A,B) Quantitative RT- PCR analysis of (A) Pro Il18 and (B) Il12p40 gene expression in WT and Scid BMDM 12 hr post- L. m. infection. Data are a compilation of three independent experiments and depict mean and SEM. ns = not significant.
Download links
A two-part list of links to download the article, or parts of the article, in various formats.
Downloads (link to download the article as PDF)
Open citations (links to open the citations from this article in various online reference manager services)
Cite this article (links to download the citations from this article in formats compatible with various reference manager tools)
A type I IFN-dependent DNA damage response regulates the genetic program and inflammasome activation in macrophages
eLife 6:e24655.
https://doi.org/10.7554/eLife.24655


