Changes of mitochondrial ultrastructure and function during ageing in mice and Drosophila
- Max-Planck-Institute of Biophysics, Germany
- Max Planck Institute for Biology of Ageing, Germany
- Université de Bordeaux, France
- CNRS, Institut de Biochimie et Génétique Cellulaires UMR 5095, France
- University College London, United Kingdom
- Karolinska Institutet, Sweden
Figures
Figure 1 with 1 supplement
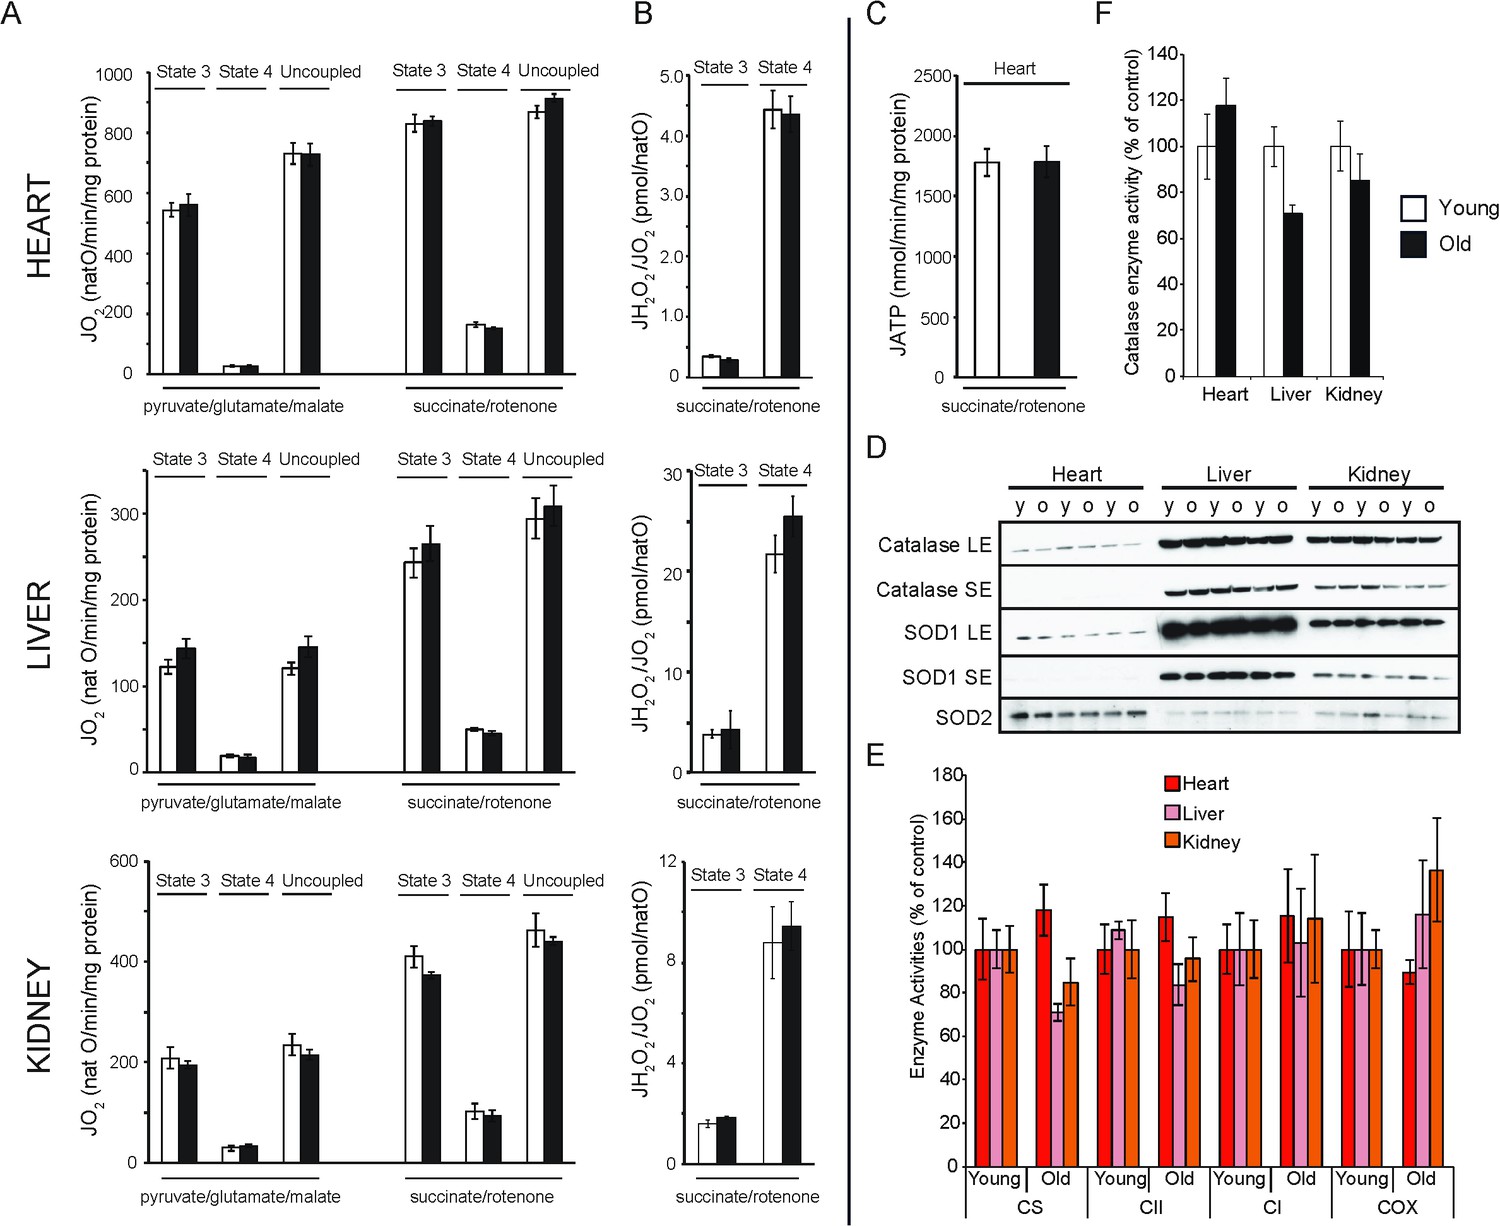
Bioenergetic and functional analysis of mitochondria from heart, liver and kidney from young (20 weeks old; white bars) and old (80–96 weeks old; black bars) mice.
(A) Oxygen consumption rate of mitochondria isolated from young (n = 7–8) or old (n = 8) animals. Isolated mitochondria were incubated with electron donors to complex I (pyruvate, glutamate, malate) or complex II (succinate, complex I inhibited with rotenone). Each set of substrates was successively combined with ADP (to assess the phosphorylating respiration, state 3), oligomycin (to measure non-phosphorylating respiration, state 4) and finally uncoupled by adding increasing concentrations of CCCP. (B) Mitochondrial peroxide yield assessed in mitochondria from young (n = 3–4) and old (n = 3–4) animals. (C) Mitochondrial ATP synthesis rate in heart mitochondria from young (n = 4) and old (n = 3) animals. Error bars indicate mean ± standard error of the mean (SEM). (D) Steady-state levels of different antioxidant enzymes in heart, liver and kidney mitochondria isolated from young (y) and old (o) mice were quantified by western blot analyses. Long (LE) and short exposure (SE) times are presented for catalase and SOD1 detection. (E) Citrate synthase (CS) and respiratory chain enzyme activity (complex I, II and IV) measurements in heart, liver and kidney tissue extracts from young (n = 4) and old (n = 4) animals. Error bars indicate mean ± SEM. (F) Catalase enzyme activity measured in heart, liver and kidney tissue extracts from young (n = 4) and old (n = 4) animals.
Figure 1—figure supplement 1
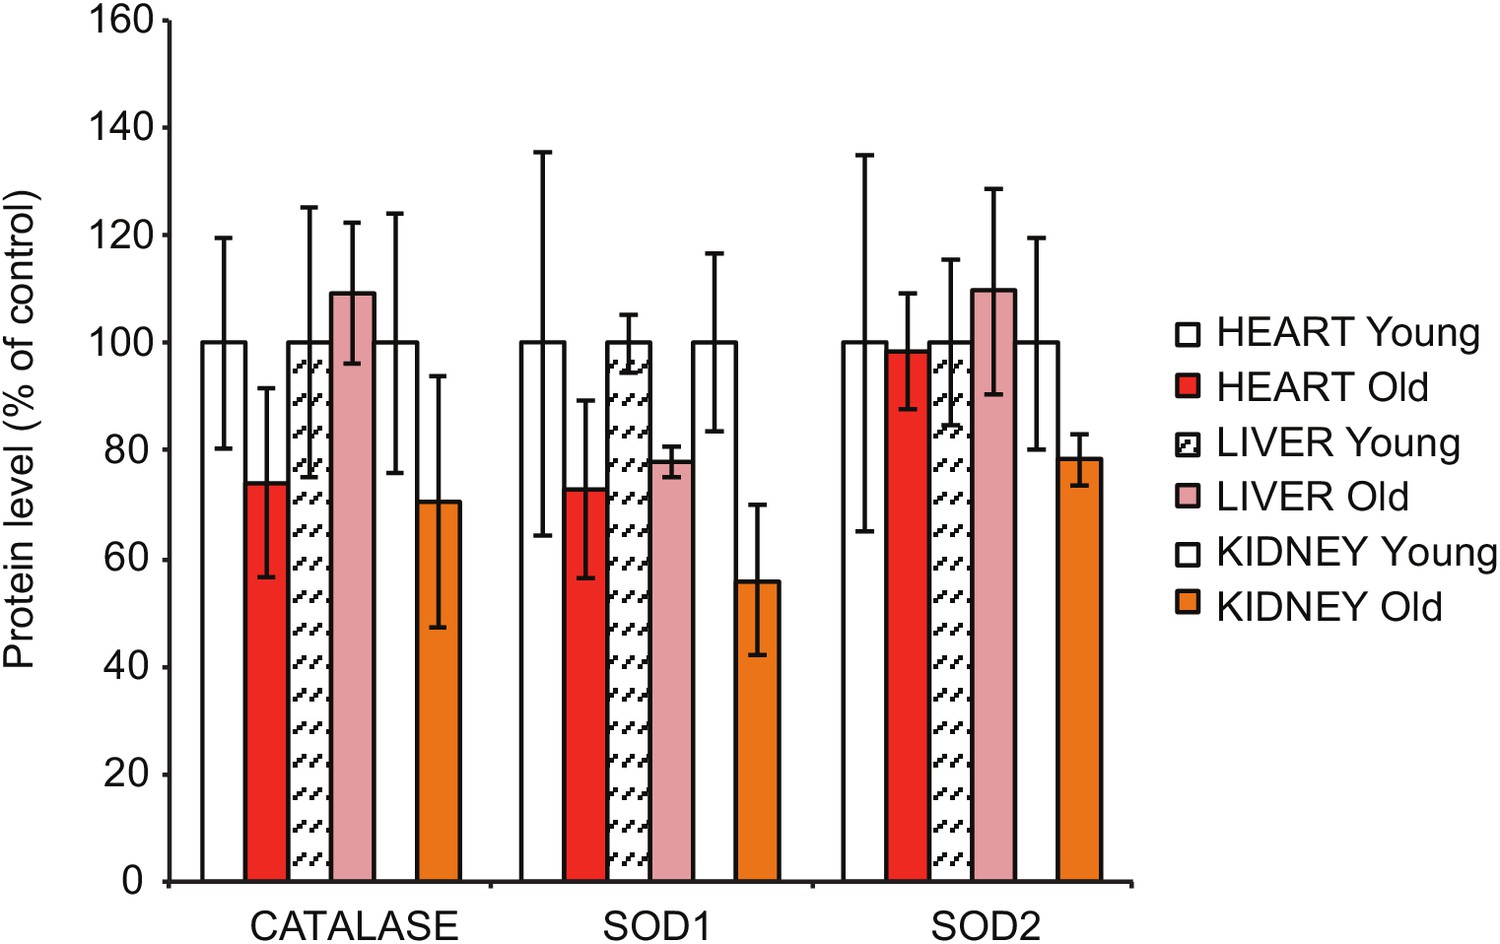
Steady-state levels of different antioxidant enzymes in heart, liver and kidney extracts, as assessed by quantitative densitometry of western blots in Figure 1D.
https://doi.org/10.7554/eLife.24662.003
Figure 2 with 1 supplement
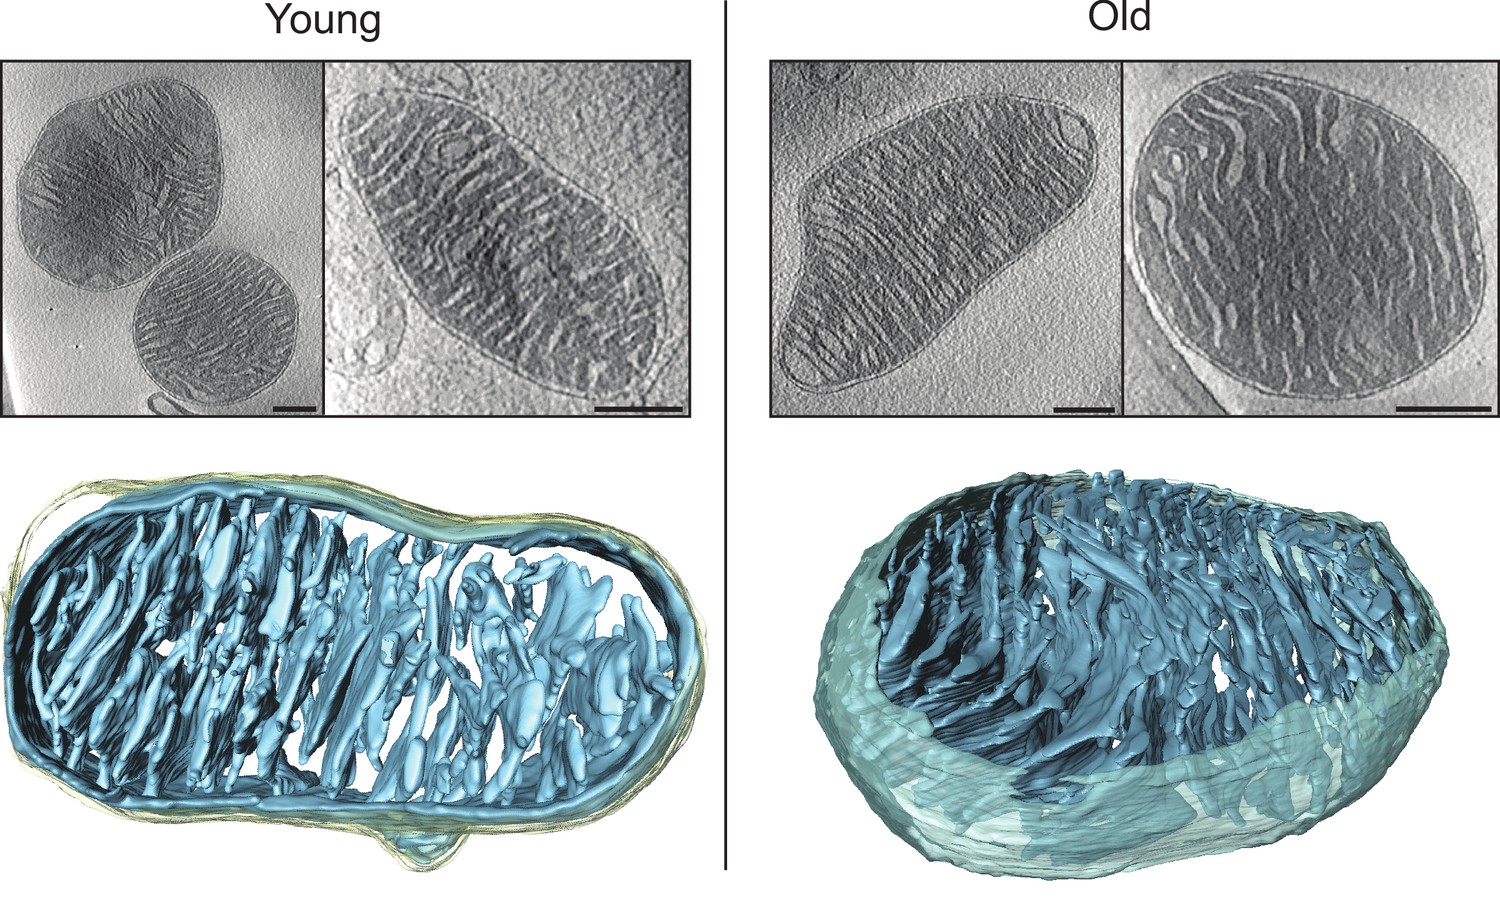
Cryo-ET of heart mitochondria from young (left, 20 weeks old) and old (right, 80–96 weeks old) mice.
Upper panel: slices through tomographic volumes (scale bars, 250 nm). Lower panels: segmented 3D volumes of two typical mitochondria with closely stacked, roughly parallel cristae (blue). The outer membrane (omitted for clarity in the right panel) is yellowish grey. Cristae are connected to the intermembrane space by well-defined, multiple crista junctions.
Figure 2—figure supplement 1
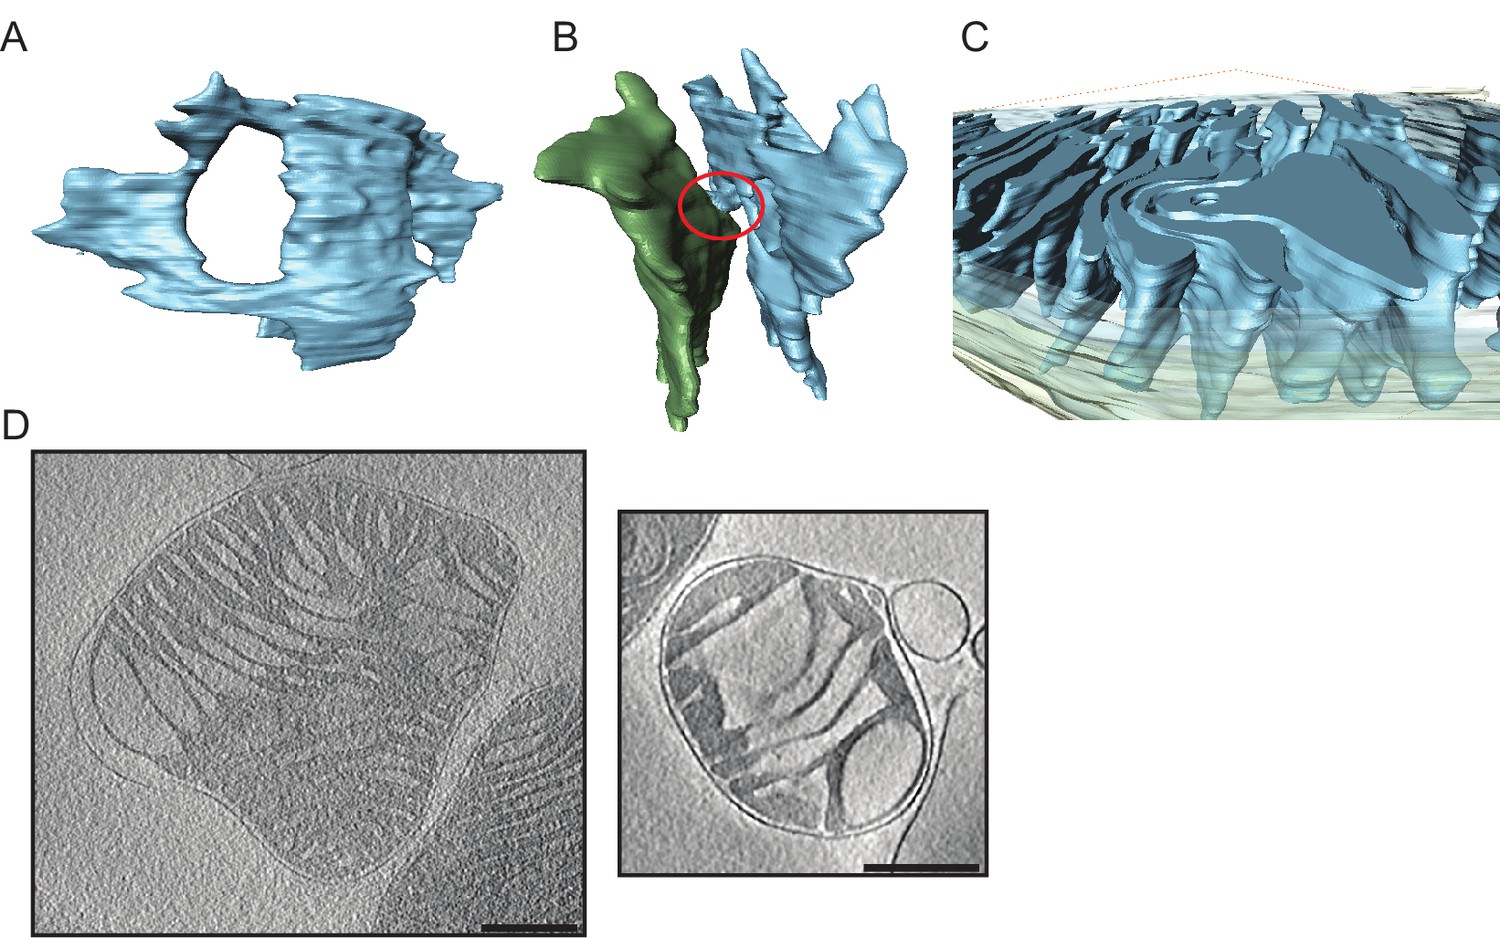
Detailed views of cristae in young and old mouse heart mitochondria.
(A–C) Young mouse heart mitochondrion. (A): Crista fenestration. (B): Two neighbouring cristae with a narrow tubular connection. (C): Cut-open view of a membrane swirl. (D): Two examples of old mouse heart mitochondria with widened cristae (scale bar 250 nm).
Figure 3
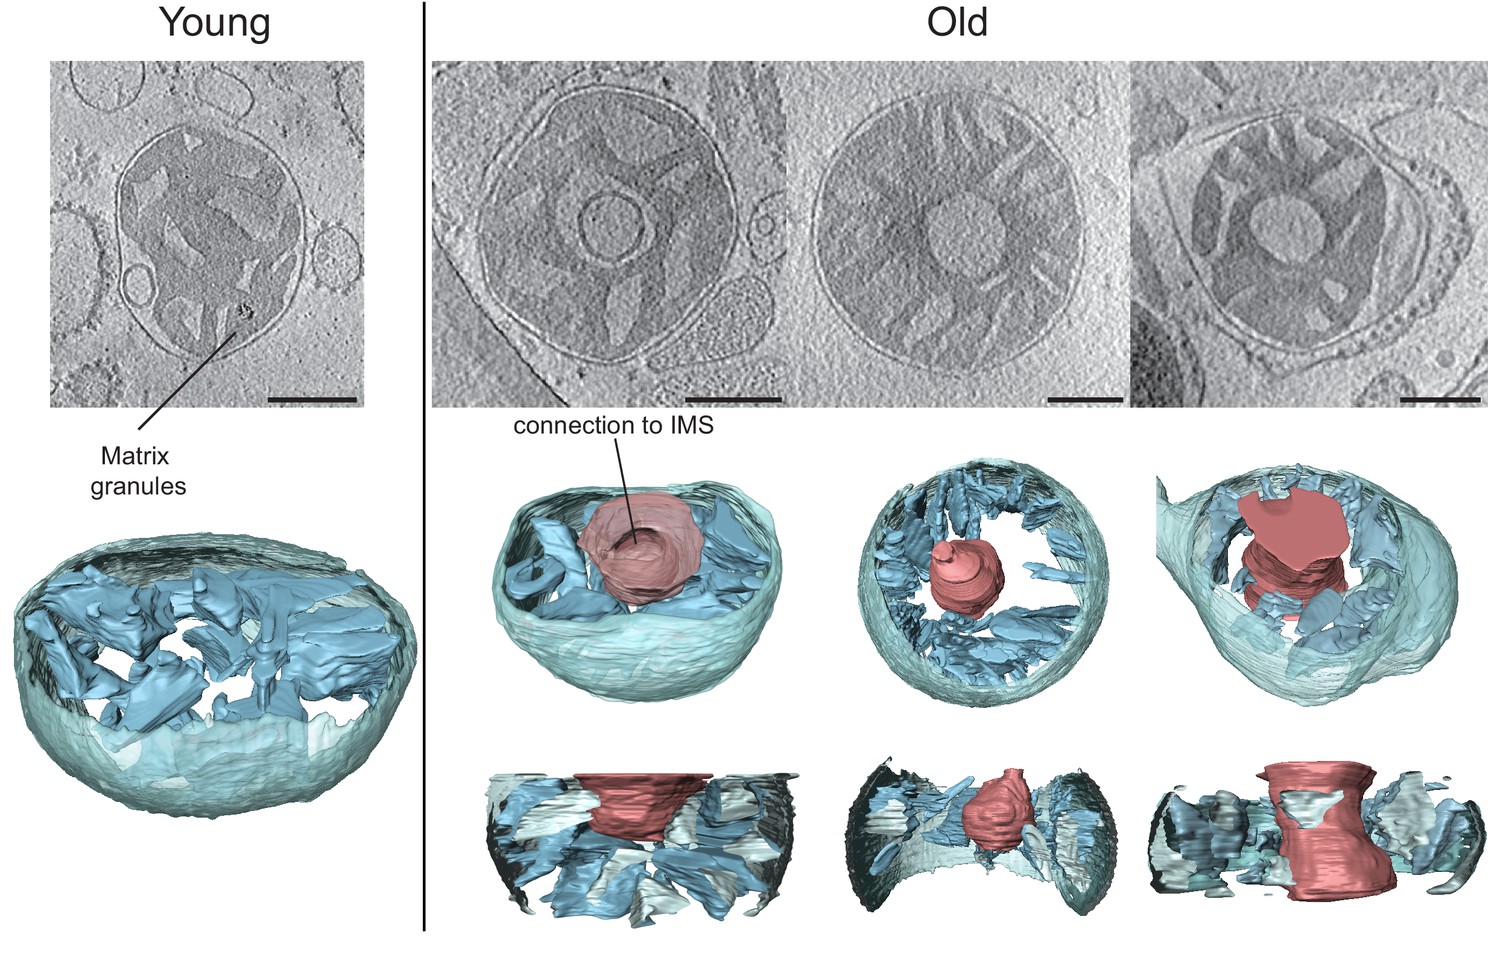
Cryo-ET of liver mitochondria from young (left, 20 weeks old) and old (right, 80 weeks old) mice.
Upper panel: slices through tomographic volumes (scale bars, 250 nm). Lower panels: segmented 3D volumes. About 25% of the mitochondria from old animals have large central voids (red). The voids were connected to the inter-membrane space (IMS) by openings of variable size.
Figure 4
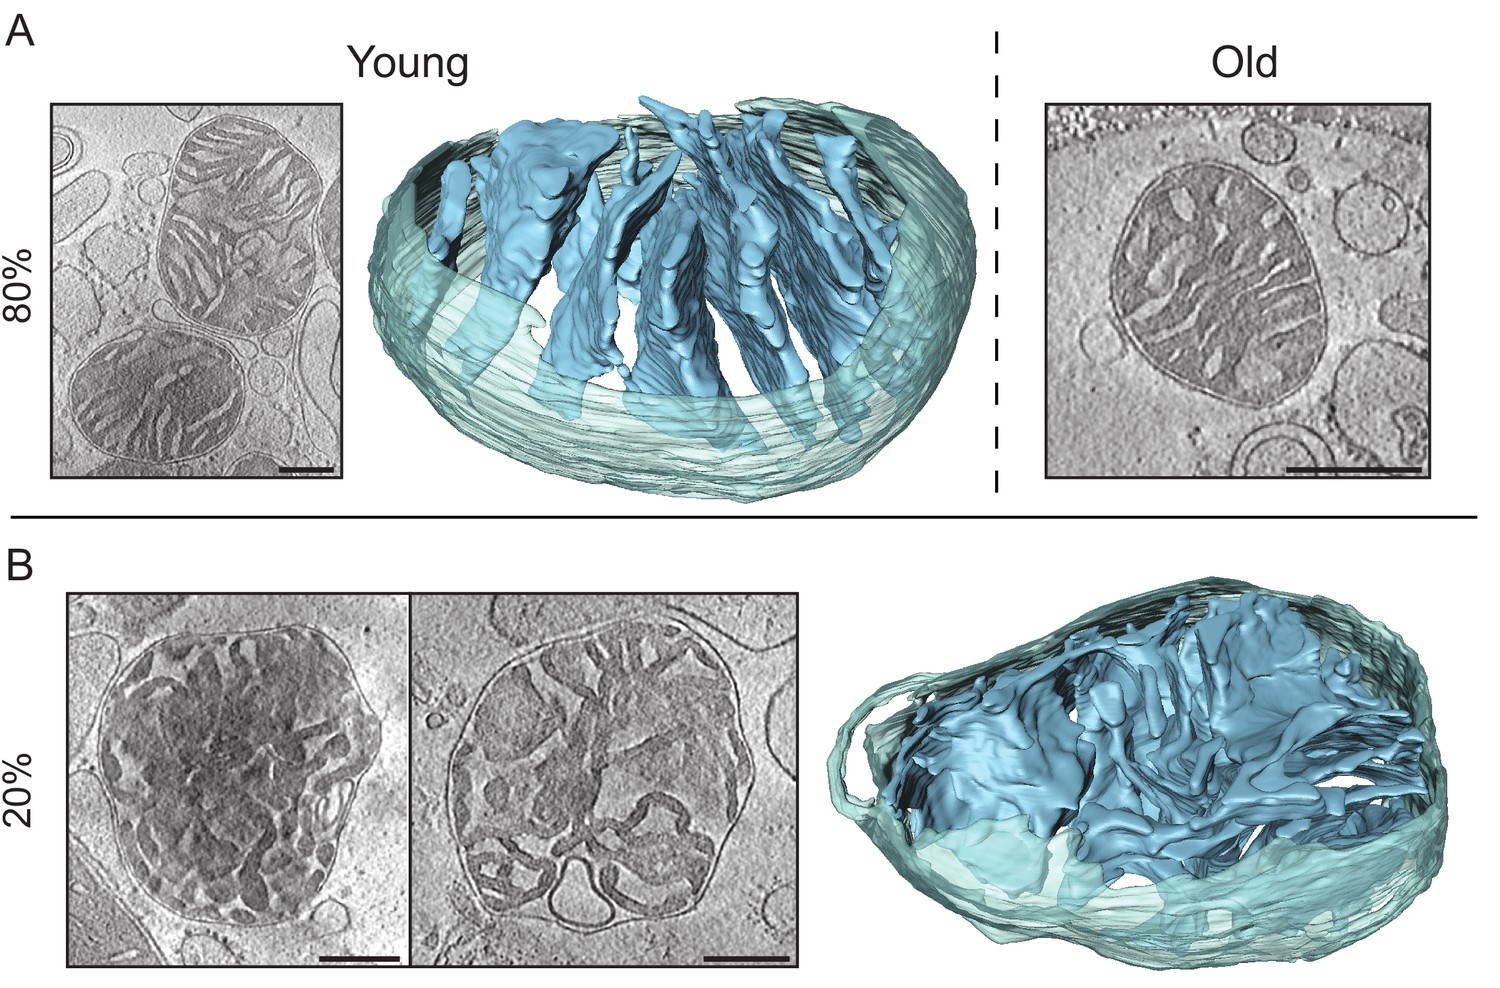
Cryo-ET of kidney mitochondria from young (20 weeks old) and old (80 weeks old) mice.
(A) About 80% of the kidney mitochondria from young (left) or old (right) animals had lamellar and locally parallel cristae, not unlike heart mitochondria, except that the cristae were less tightly packed. (B) About 20% of the mitochondria from young and old kidney showed an inner membrane morphology resembling that in apoptotic cells (Scorrano et al., 2002), without any discernible pattern and wide or irregular junctions. Scale bars, 250 nm.
Figure 5
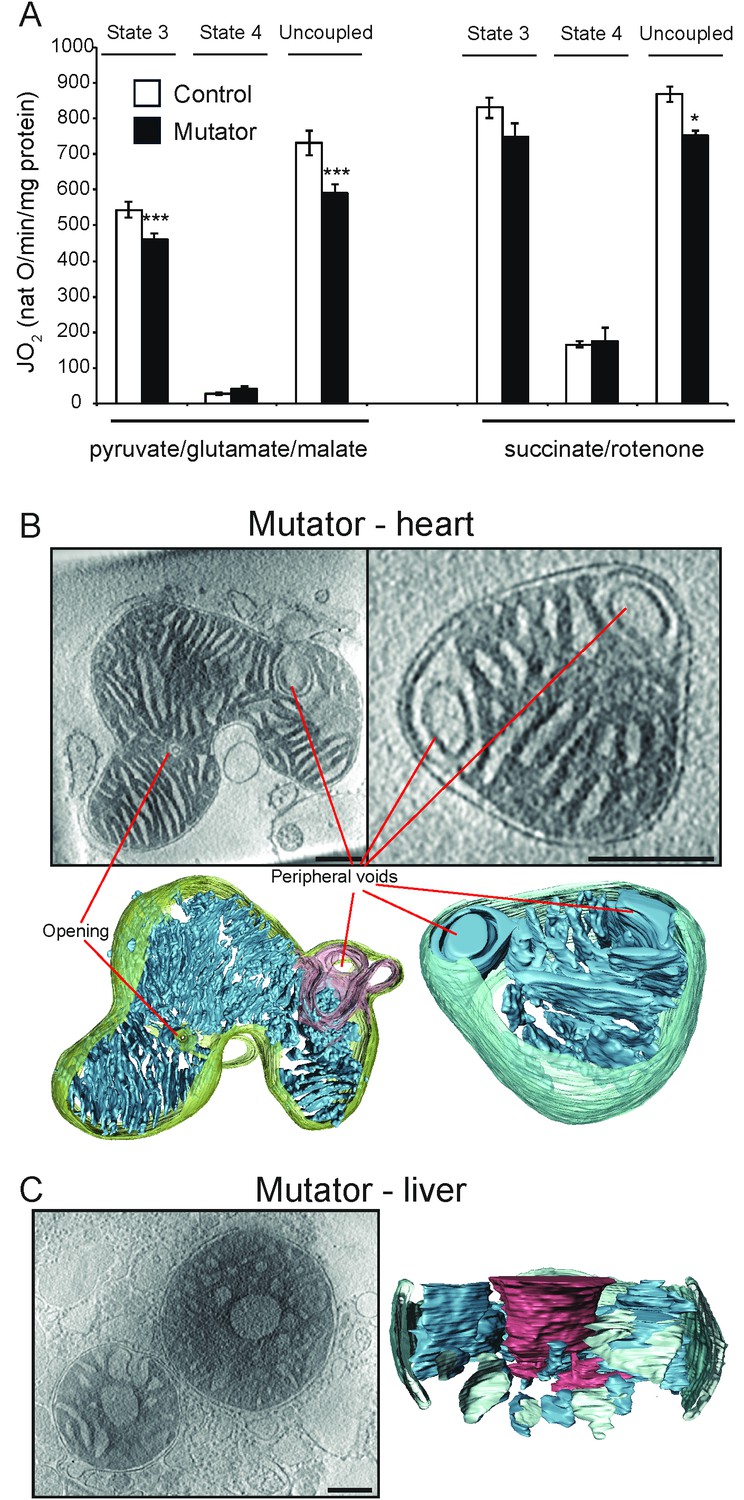
Activity and ultrastructure of mtDNA mutator mouse mitochondria.
(A) Oxygen consumption rate assessed in heart mitochondria from control (white bars, n = 8, 30 weeks old) and mutator (black bars, n = 8, 30 weeks old) mice. Mitochondria were isolated and analysed as in Figure 1. (B–C) Cryo-ET. (B) Mutator mouse heart mitochondria had lamellar, parallel cristae that were similar to those of wild-type heart mitochondria (see Figure 2), but with occasional peripheral voids at the inner boundary membrane. (C) About 40% of liver mitochondria from mutator mice had low-density central voids, as in old liver (see Figure 3).
Figure 6
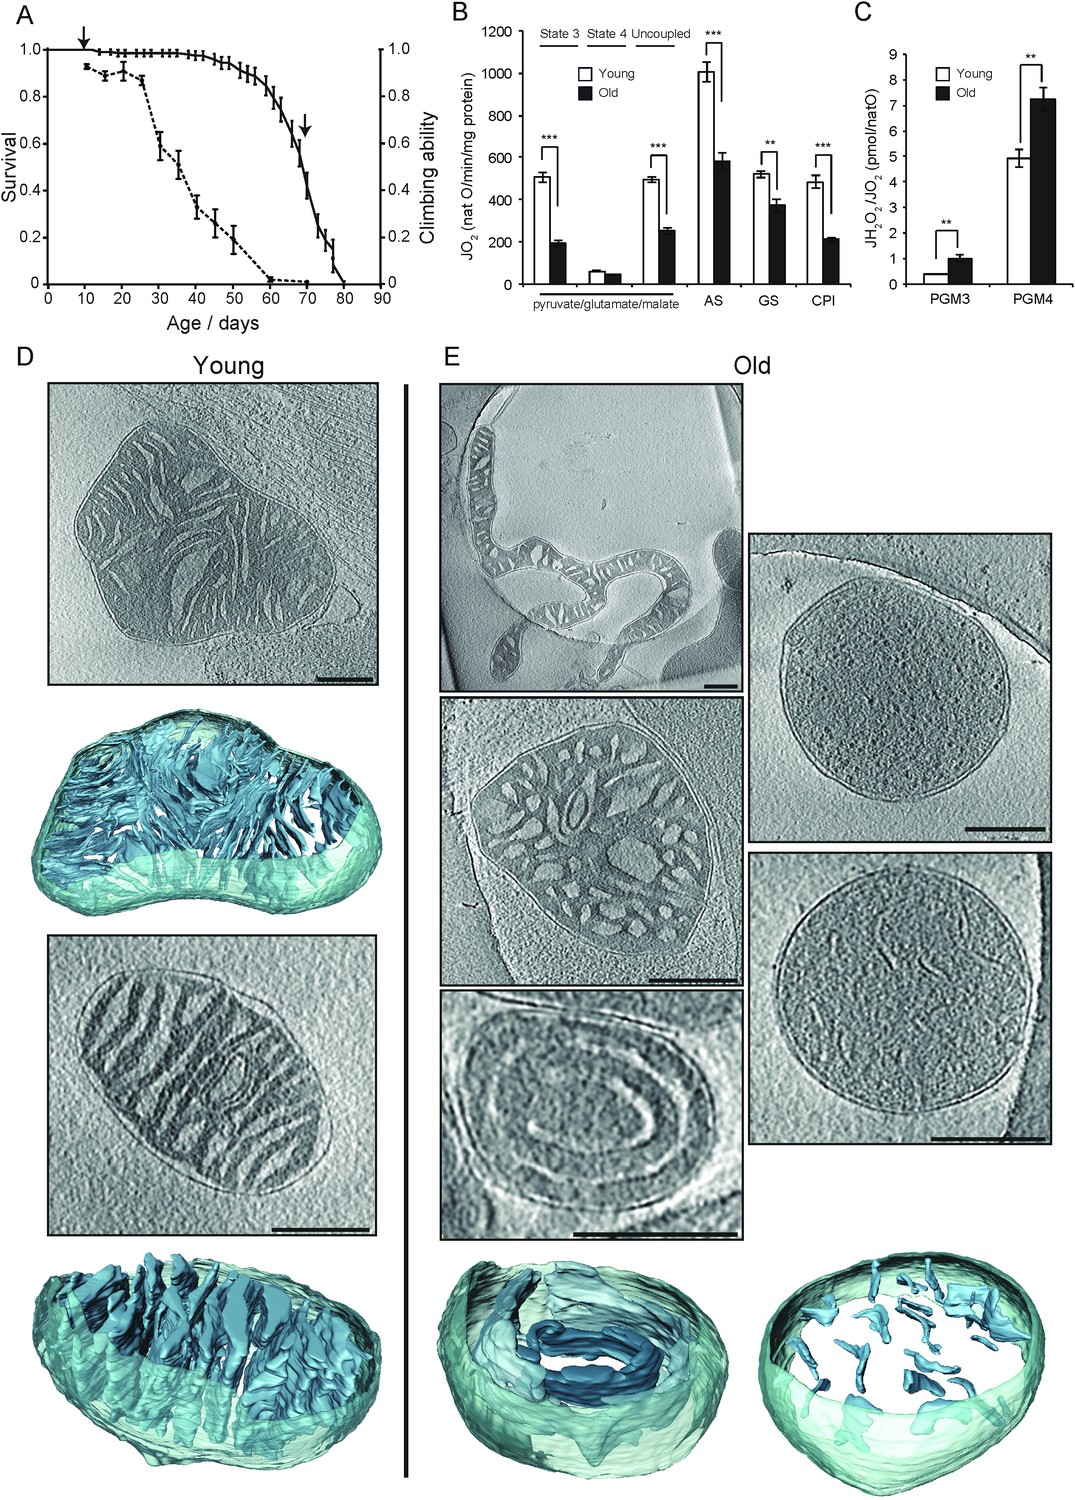
Activity and ultrastructure of D. melanogaster mitochondria.
(A) Survival rates (n = 150; solid line) and climbing ability (n ≥ 25; dashed line) of wDah wild-type flies. Error bars represent SEM and arrows indicate sampling points for young (15 days old) and old (70 days old) flies. (B) Oxygen consumption rate assessed in mitochondria from young (white bars, n = 3) and old (black bars, n = 3) flies. Mitochondria were isolated and analysed as in Figure 1. Succinate and glycerol-3-phosphate (AS), and finally rotenone were added (GS) for comparison to complex I-driven respiration (CPI). (C) Mitochondrial peroxide yield in mitochondria from young (white bars, n = 3) and old (black bars, n = 3) flies. (D–E) Cryo-ET of typical mitochondria from young (D) or old (E) flies. Mitochondria from young flies had lamellar, mostly parallel cristae, similar to those from mouse heart. Mitochondria from old flies had highly variable shapes and cristae organisation, with the following main types (clockwise from top left): elongated and branched morphology; round, lacking cristae; small disconnected cristae; concentric narrow cristae (note that the innermost vesicle, shown in a darker shade of blue, appears to be unconnected to other membranes); irregular, wide cristae.
Videos
Video 1
Tomographic volume and 3D segmentation of the mitochondrion from young mouse heart shown in Figure 2, upper left, right hand panel.
https://doi.org/10.7554/eLife.24662.004
Video 2
Tomographic volume and 3D segmentation of the mitochondrion from young mouse liver shown in Figure 3, upper left.
https://doi.org/10.7554/eLife.24662.008
Video 3
Tomographic volume and 3D segmentation of the mitochondrion from old mouse liver shown in Figure 3, upper right, central panel.
https://doi.org/10.7554/eLife.24662.010
Video 4
Tomographic volume and 3D segmentation of the mitochondrion from young fly shown in Figure 6D, upper panel.
https://doi.org/10.7554/eLife.24662.014
Video 5
Tomographic volume and 3D segmentation of the mitochondrion from old fly shown in Figure 6E, lower right.
https://doi.org/10.7554/eLife.24662.015
Video 6
Tomographic volume and 3D segmentation of the mitochondrion from old fly shown in Figure 6E, lower left.
https://doi.org/10.7554/eLife.24662.016Tables
Table 1
Overview of organisms and tissues analyzed. #number of animals dissected (mouse) or number of mitochondrial preparations (fly) vs number of individual mitochondria examined tomographically.
| Organism | Age | Tissue | Samples / mitochondria# | Mitochondria with abnormal morphology (%) |
|---|---|---|---|---|
| mouse | young | heart | 4/27 | wide cristae 4%; cristae membrane swirls 19% |
| old | heart | 3/17 | wide cristae 24%; cristae membrane swirls 6% | |
| young | liver | 5/18 | voids 11%; granules 6% | |
| old | liver | 4/31 | voids 32%; granules 6%; apoptotic 3% | |
| young | kidney | 3/33 | apoptotic 12%; granules 3% | |
| old | kidney | 2/22 | apoptotic 18%; granules 18% | |
| mutator | heart | 2/10 | membrane swirls 30%; membrane enclosures 40%; granules 20% | |
| mutator | liver | 2/10 | voids 40%; granules 20% | |
| fly | young | whole organism | 3/29 | elongated (axial ratio > 3) 10%; wide cristae 10% |
| old | whole organism | 3/39 | elongated (axial ratio > 3) 18%; wide cristae 15%; branched 5%; various other 23% |
Download links
A two-part list of links to download the article, or parts of the article, in various formats.
Downloads (link to download the article as PDF)
Open citations (links to open the citations from this article in various online reference manager services)
Cite this article (links to download the citations from this article in formats compatible with various reference manager tools)
Changes of mitochondrial ultrastructure and function during ageing in mice and Drosophila
eLife 6:e24662.
https://doi.org/10.7554/eLife.24662


