Domestic chickens activate a piRNA defense against avian leukosis virus
- University of Rochester Medical Center, United States
- Center for Genome Sciences and Systems Biology, Washington University School of Medicine, United States
- Animal Health Diagnostic Center, Cornell University College of Veterinary Medicine, United States
- University of Manitoba, Canada
Figures
Figure 1 with 4 supplements
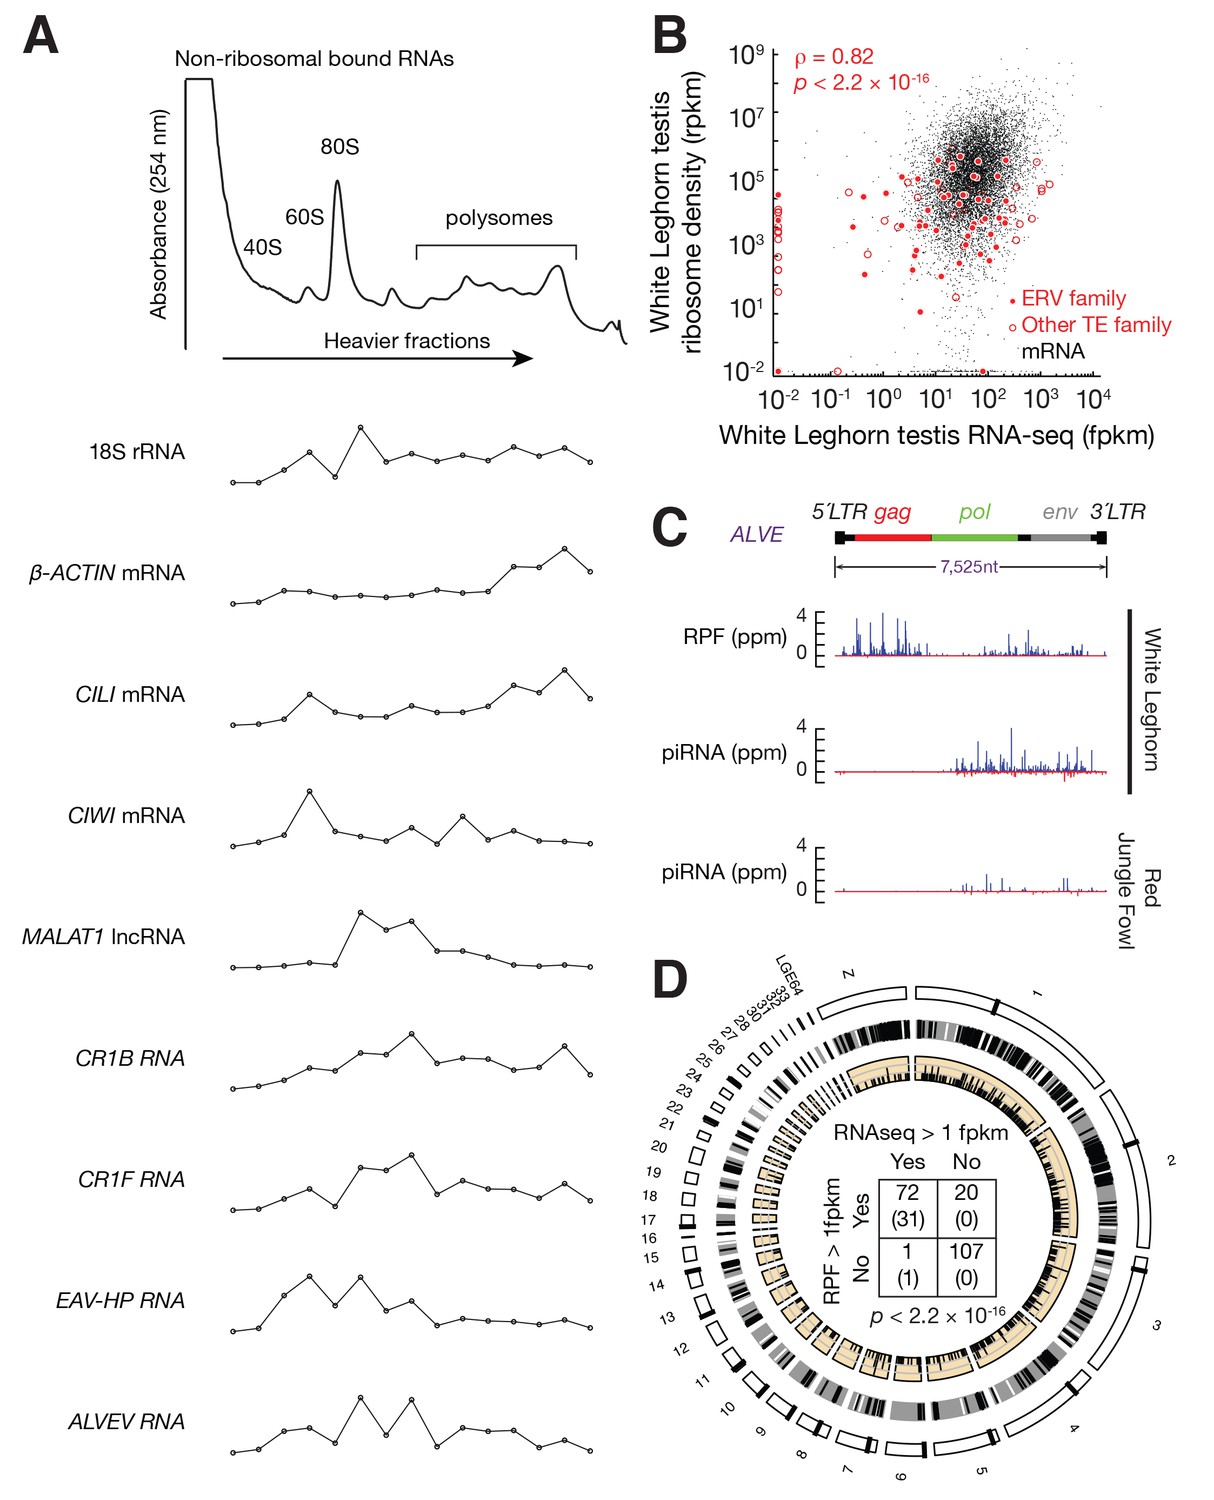
Active ERVs in White Leghorn testis.
(A) A254 absorbance profile of 10% to 50% sucrose density gradients of testis lysates from adult rooster. From top to bottom, plots show the relative abundance of 18S rRNA, β-ACTIN mRNA, CILI mRNA, CIWI mRNA, chicken Malat1 lncRNA, CR1B, CR1F, EAV-HP, and ALVE quantified by RT-qPCR. Data were normalized to a spike-in control RNA. (B) Scatter plots of transcript abundance versus ribosome density. Each black dot represents an mRNA expressed in testis. Each filled red circle represents an ERV family, and each open red circle represents any other TE family, including DNA transposons and CR1 superfamily; rpkm, reads per kilobase of transcript per million mapped reads; fpkm, fragments per kilobase of transcript per million mapped reads. (C) Normalized reads of White Leghorn RPFs (Top), White Leghorn piRNAs (Middle), and Red Jungle Fowl small RNA reads (>23 nt) (Bottom). Blue represents sense mapping reads; Red represents anti-sense mapping reads. The gene organization of ALVE is also shown. Gag, group-specific antigen; Pol, polymerase; Env, envelope protein; ppm, parts per million. (D) Circos plot representing the locations, from periphery to center, of cytological position (black lines represent centromeres), piRNA clusters in White Leghorn (Black lines represent conserved piRNA clusters; White lines represent divergent piRNA clusters), putative new insertions discovered by TEMP (tiles) using genomic resequencing of White Leghorn, and 2 × 2 contingency table for Fisher’s exact test to assess the significance of the coincidence of transcription and translation of each TE family. The table data correspond to the number of TE families in each category and, in parentheses, the number of TE families in each category with recent transpositions.
Figure 1—figure supplement 1

Tissue distribution of ERVs and piRNA pathway genes.
(A) Box plots show the abundance of ERV families in different chicken tissues measured by RNA-seq data. (B) Expression of A-MYB, CILI, and CIWI in each tissue measured by RNA-seq data.
Figure 1—figure supplement 2
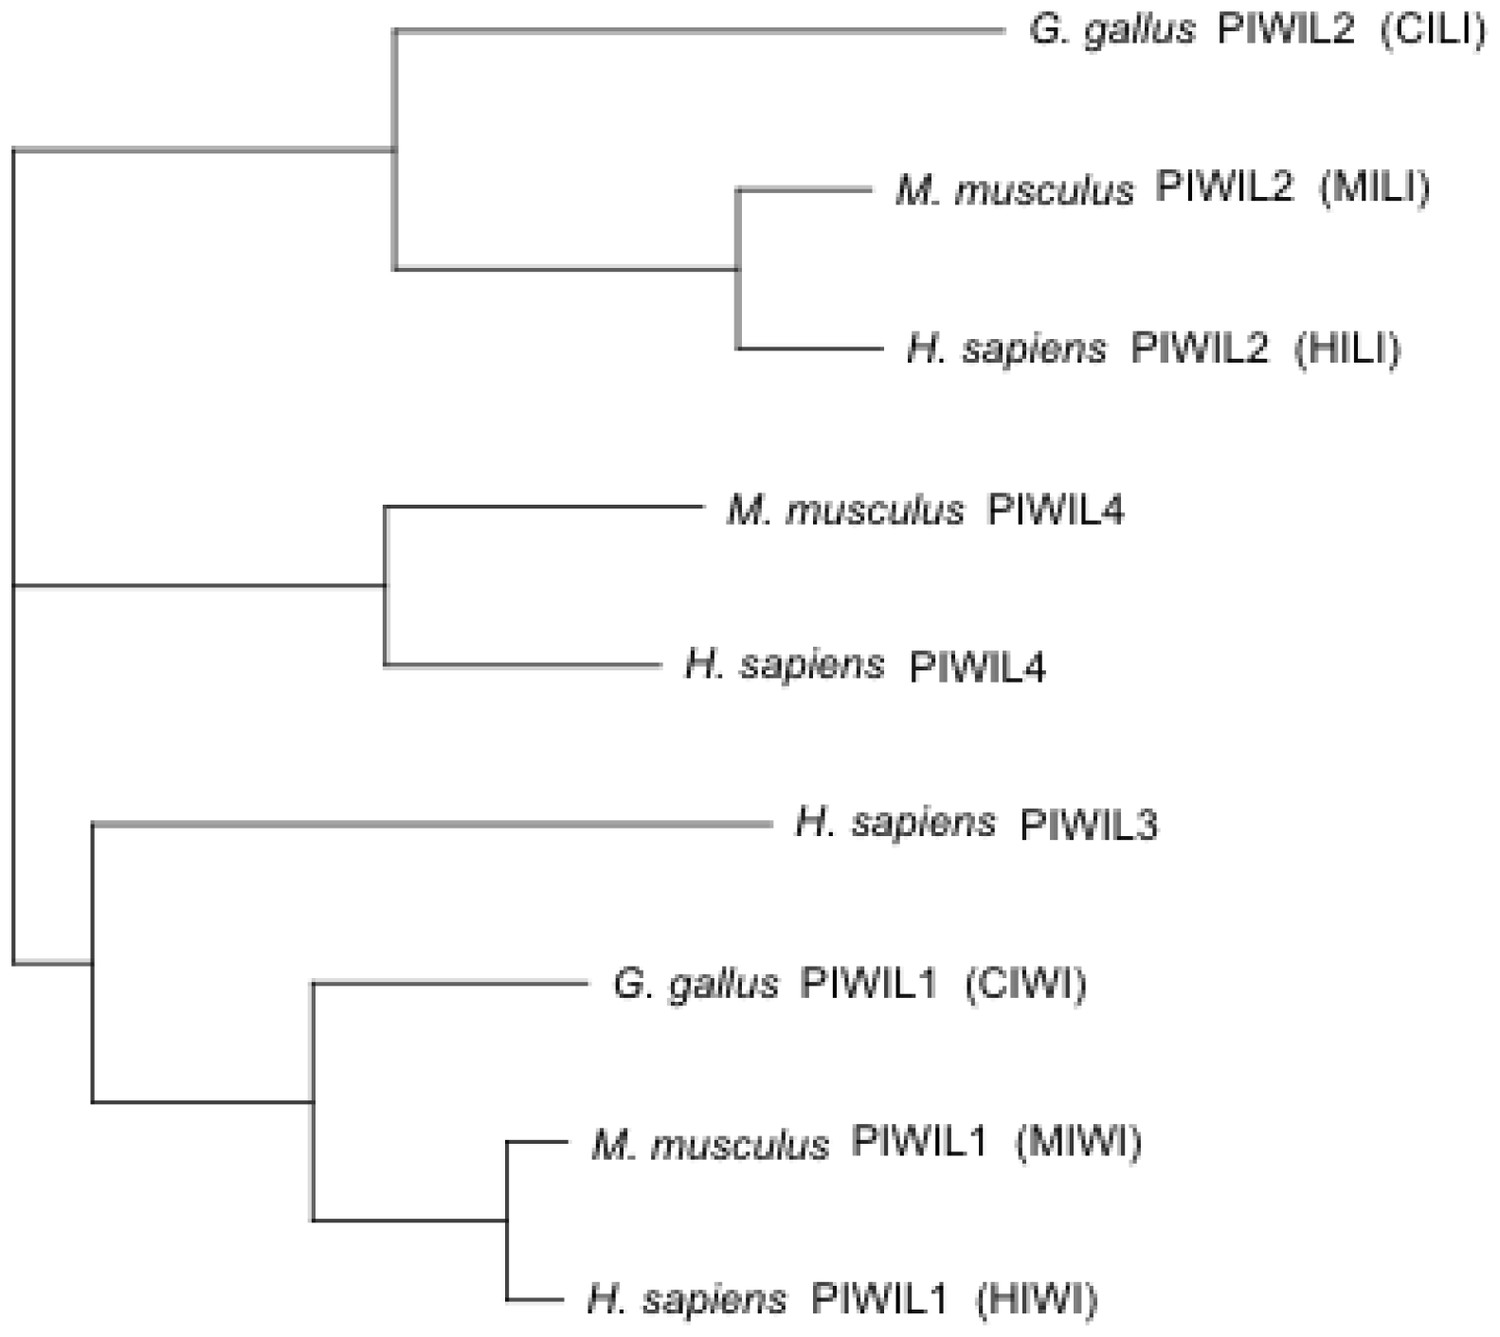
PIWI proteins are conserved between mammals and birds.
Phylogenetic tree of PIWI proteins, including four human PIWI proteins, three mouse PIWI proteins, and two chicken PIWI proteins.
Figure 1—figure supplement 3
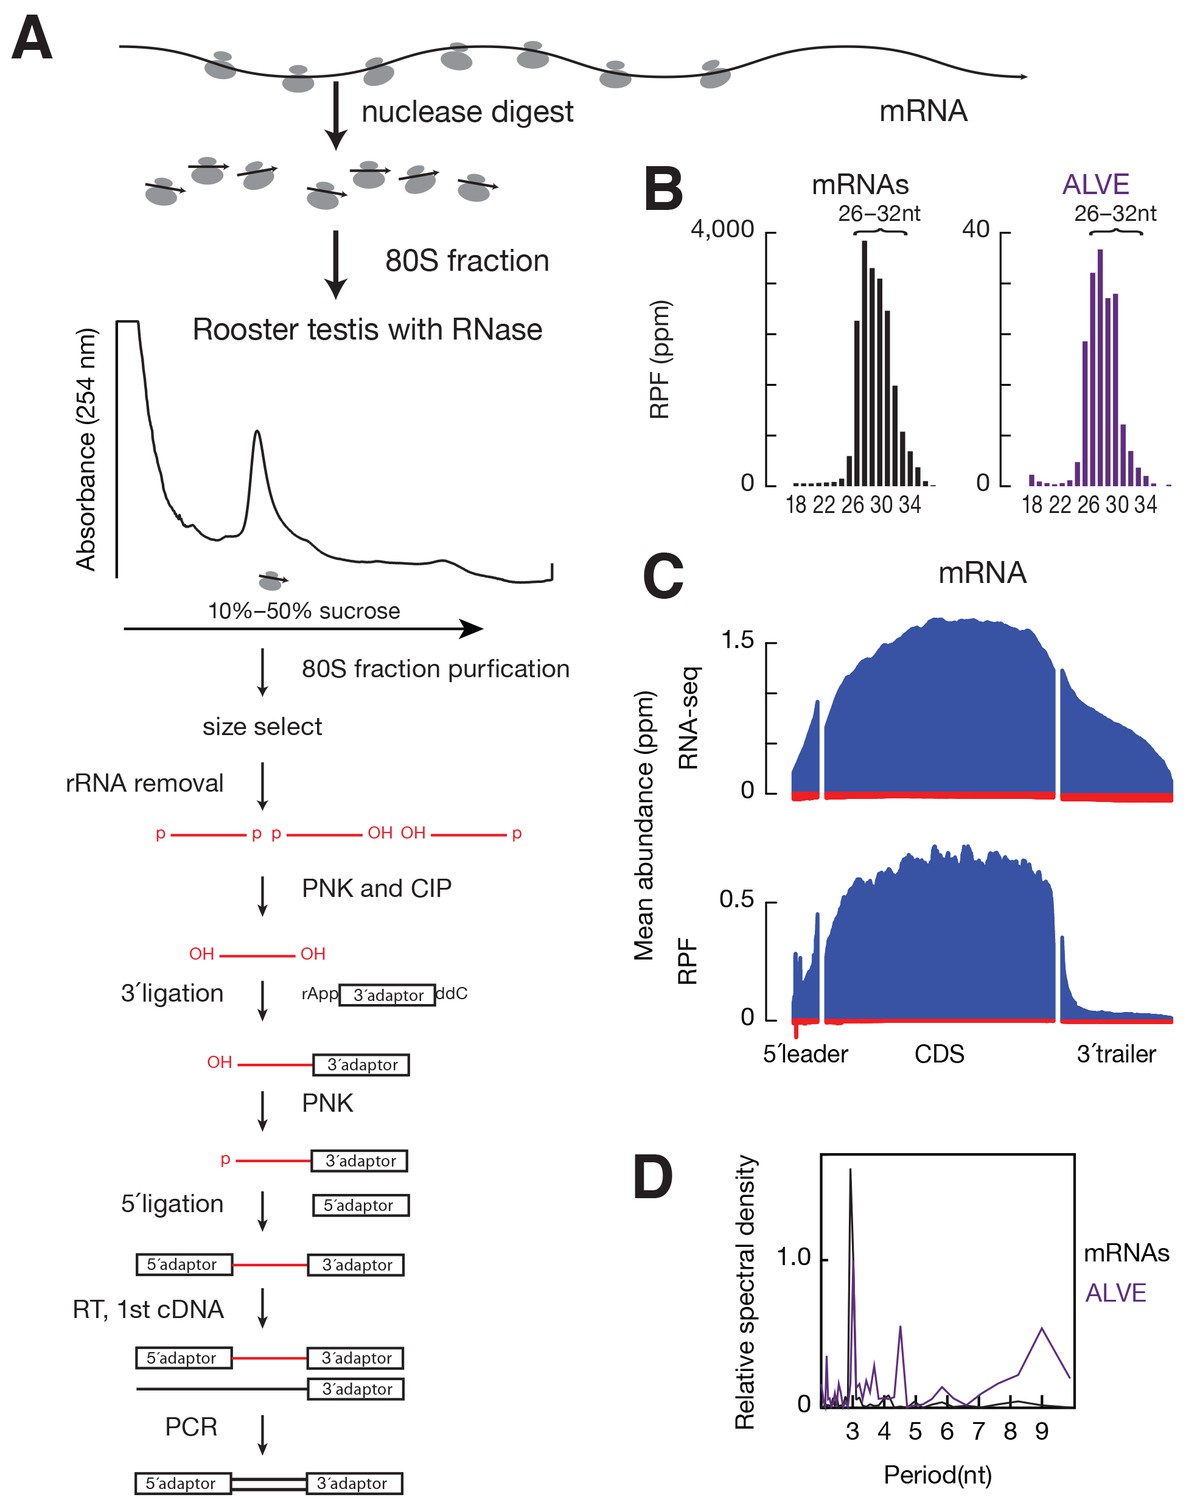
Ribosome profiling in adult rooster testes.
(A) Schematic of ribosome profiling library construction. (B) Length distributions of RPFs mapped to mRNA CDS (black) and ALVE (purple). (C) Metagene plots of RNA-seq (top) and RPF (bottom) at 5´ leader, CDS, and 3´ trailer of mRNAs. The x-axis shows the median length of these regions, and the y-axis represents the mean of normalized abundance. (D) Discrete Fourier transformation of the distance spectrum of 5´ ends of RPFs across mRNA CDSs (black) and ALVE (purple).
Figure 1—figure supplement 4
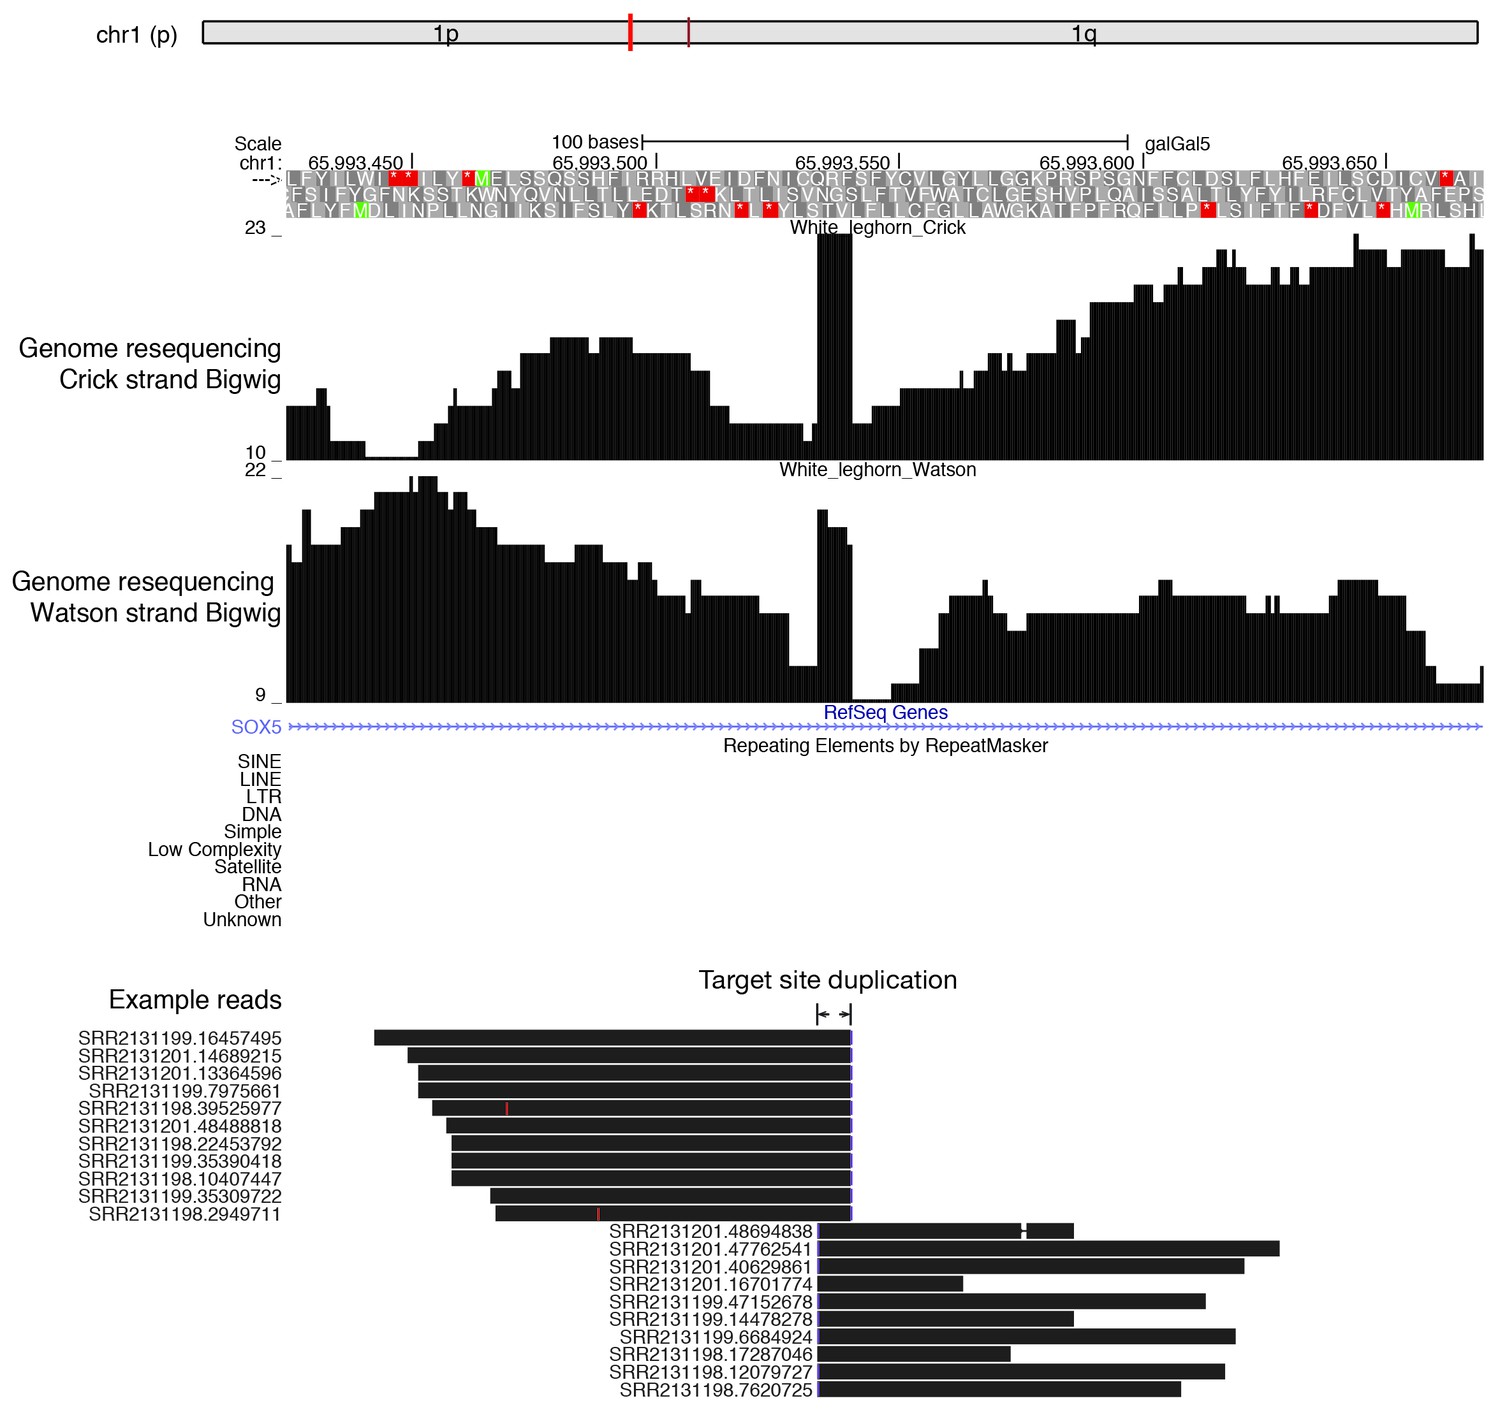
A recent ALVE insertion in the SOX5 gene detected by genome-resequencing of White Leghorn.
From top to bottom, the genomic location of the insertion, the genome resequencing signals mapping to Crick strand and Watson strand, Ref-Seq track showing the first intron of SOX5, RepeatMasker track showing no other TEs in these regions, and example reads that map to the first intron of SOX5 genes are shown (the rest of reads that map to ALVE do not align to the reference genome). The 6 bp targeted site duplication is labeled on the example reads.
Figure 2 with 2 supplements
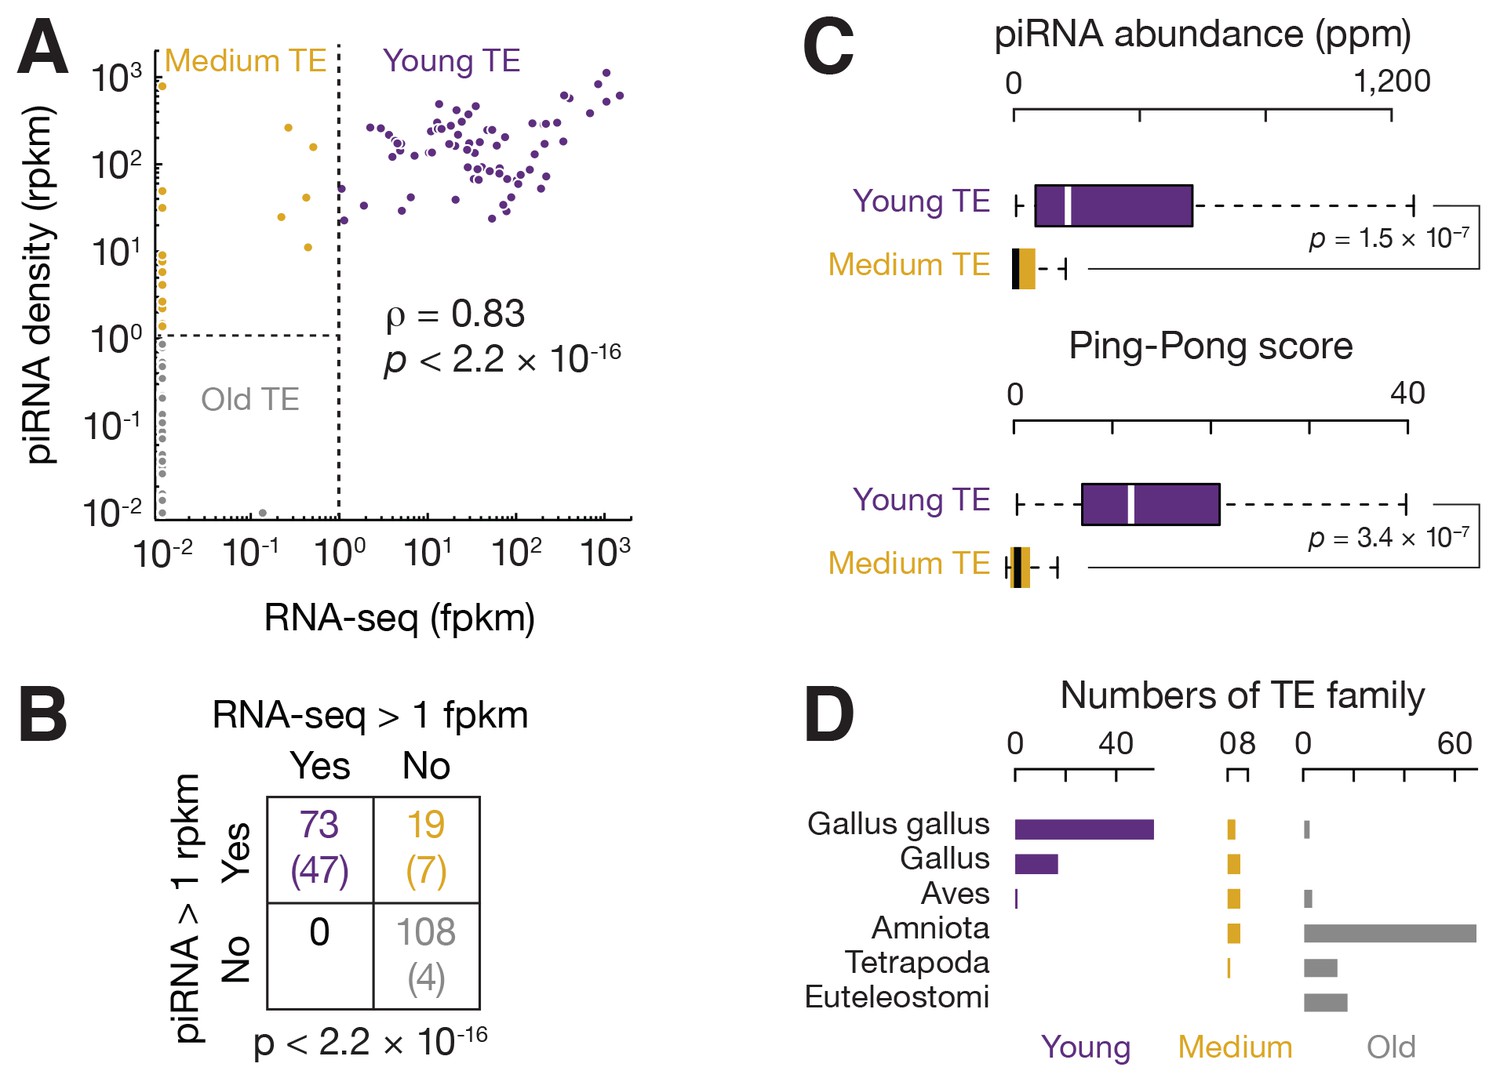
Three groups of TEs based on TE expression and piRNA expression.
(A) Scatter plots of TE transcript abundance versus TE piRNA abundance. Each filled circle represents a TE family. Here and in Figure 2—figure supplements 1 and 2, young TE in purple, medium TE in yellow, and old TE in grey. (B) 2 × 2 contingency table for Fisher’s exact test to assess the significance of the coincidence of the TE transcript abundance and TE piRNA abundance. The table data correspond to the number of TE families in each category and, in parentheses, the number of ERV families in each category. (C) Top, box plots present piRNA abundance per TE family. Bottom, box plots present Ping-Pong amplification score per TE family. (D) Histograms of TE ages.
Figure 2—figure supplement 1

piRNA-mediated TE suppression in rooster testes.
(A) Length distributions of testis small RNAs that map to TE regions. Blue represents sense mapping piRNAs; Red represents anti-sense mapping piRNAs. (B) Scatter plots of piRNA abundance in total small RNA library and oxidized small RNA library. Each filled circle represents a TE family. Color identifies young, medium, or old TE as in Figure 2. (C) Sequence logo showing the nucleotide composition of TE piRNA species; Top, sense mapping TE piRNAs; Bottom, anti-sense mapping TE piRNAs. (D) Scatter plots of sense piRNA abundance versus anti-sense piRNA abundance. Each filled circle represents a TE family. Color identifies young, medium, or old TE. (E) The 5´−5´ overlap between TE piRNAs from opposite strands was analyzed.
Figure 2—figure supplement 2
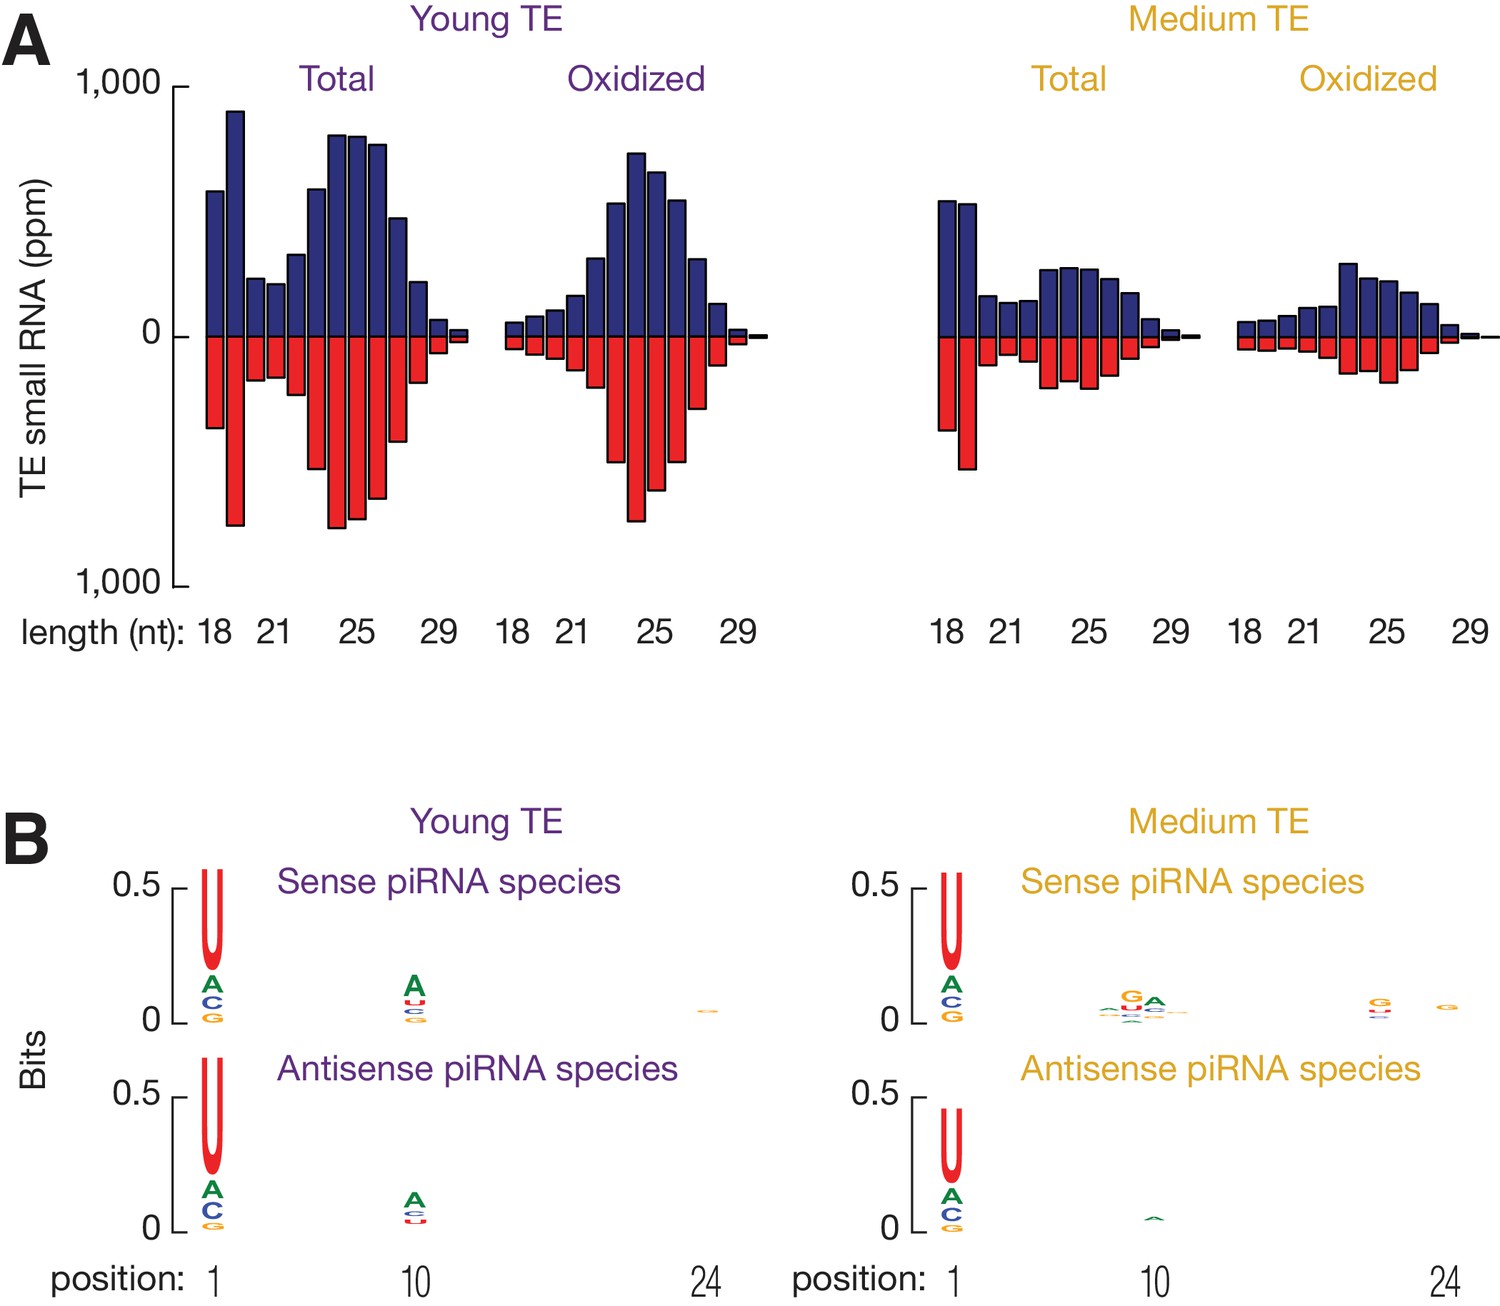
Medium TE piRNAs are authentic piRNAs.
(A) Length distributions of testis small RNAs that map to young TEs (left) and medium TEs (right). (B) Sequence logo showing the nucleotide composition of Young TE piRNA species (left) and Medium TE piRNA species (right); Top, sense mapping TE piRNAs; Bottom, anti-sense mapping TE piRNAs.
Figure 3

ALVE piRNA acquisition.
(A) Length distributions of testis small RNAs mapping to ALVE. Blue represents sense mapping piRNAs; Red represents anti-sense mapping piRNAs. (B) Sequence logo showing the nucleotide composition of ALVE piRNA species from White Leghorn (left) and ALVE species from Red Jungle Fowl (right), top, sense ALVE mapping reads, bottom, anti-sense ALVE mapping reads. (C) Analysis of the 5´−5´ overlap between ALVE piRNAs from opposite strands was analyzed. Significance of ten-nucleotide overlap (‘Ping-Pong’) was determined from Z-score. Z-score >3.3 corresponds to p-value<0.01. (D) Analysis of the 5´−5´ overlaps between EAV-HP piRNAs from opposite strands. (E) Scatter plots comparing mRNA abundance between White Leghorn and Red Jungle Fowl. Each black filled circle represents an mRNA expressed in testis, and each red filled circle represents an mRNA coding for a protein in the piRNA pathway.
Figure 4 with 2 supplements
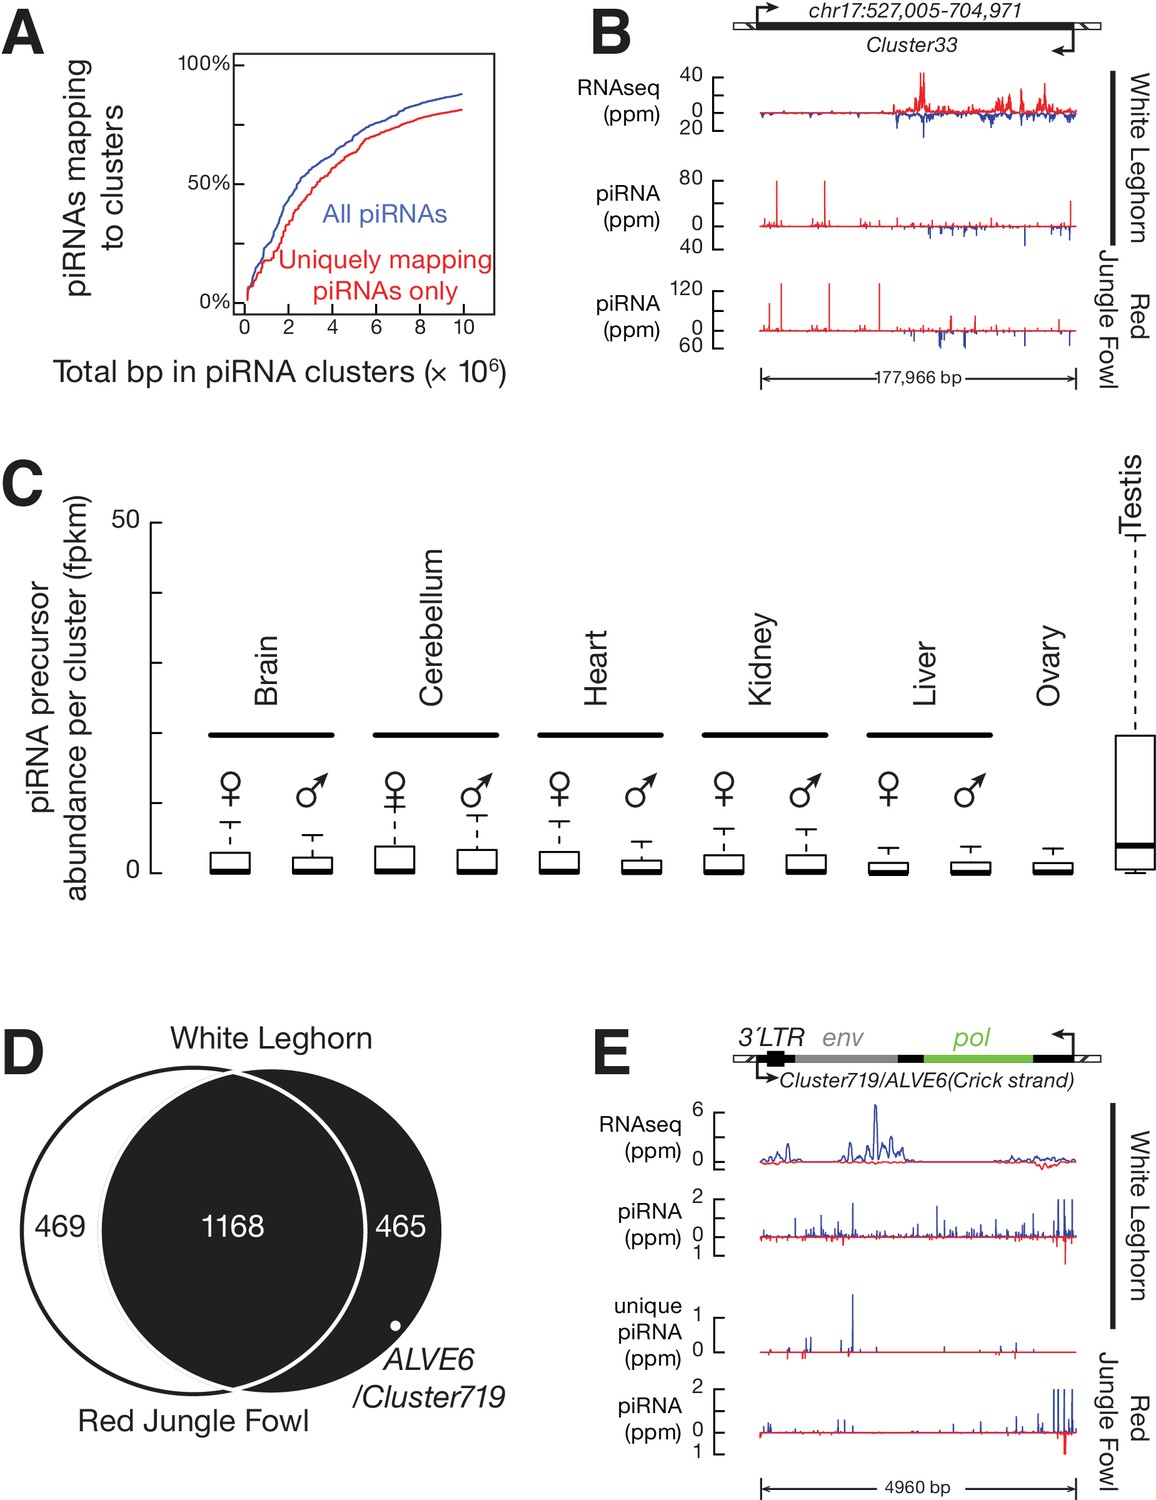
ALVE6 is the primary piRNA-producing locus for viral piRNAs.
(A) Cumulative distributions for all piRNAs (Blue) and for uniquely mapping piRNAs (Red) on the 1633 piRNA loci in White Leghorn. (B) An example of conserved piRNA-producing loci, Cluster33, in chicken. Normalized RNA-seq reads of piRNA precursors, piRNAs in White Leghorn, and piRNAs in Red Jungle Fowl. Blue represents Watson-strand piRNAs; Red represents Crick-strand piRNAs. (C) Box plots showing abundance of piRNA precursors in 12 chicken tissues. (D) Venn diagram showing piRNA clusters defined in Red Jungle Fowl (White) and White Leghorn (Black). (E) Normalized RNA-seq reads of piRNA precursors in White Leghorn, White Leghorn piRNAs, unique mapping piRNAs, and Red Jungle Fowl small RNA reads (>23 nt).
Figure 4—figure supplement 1
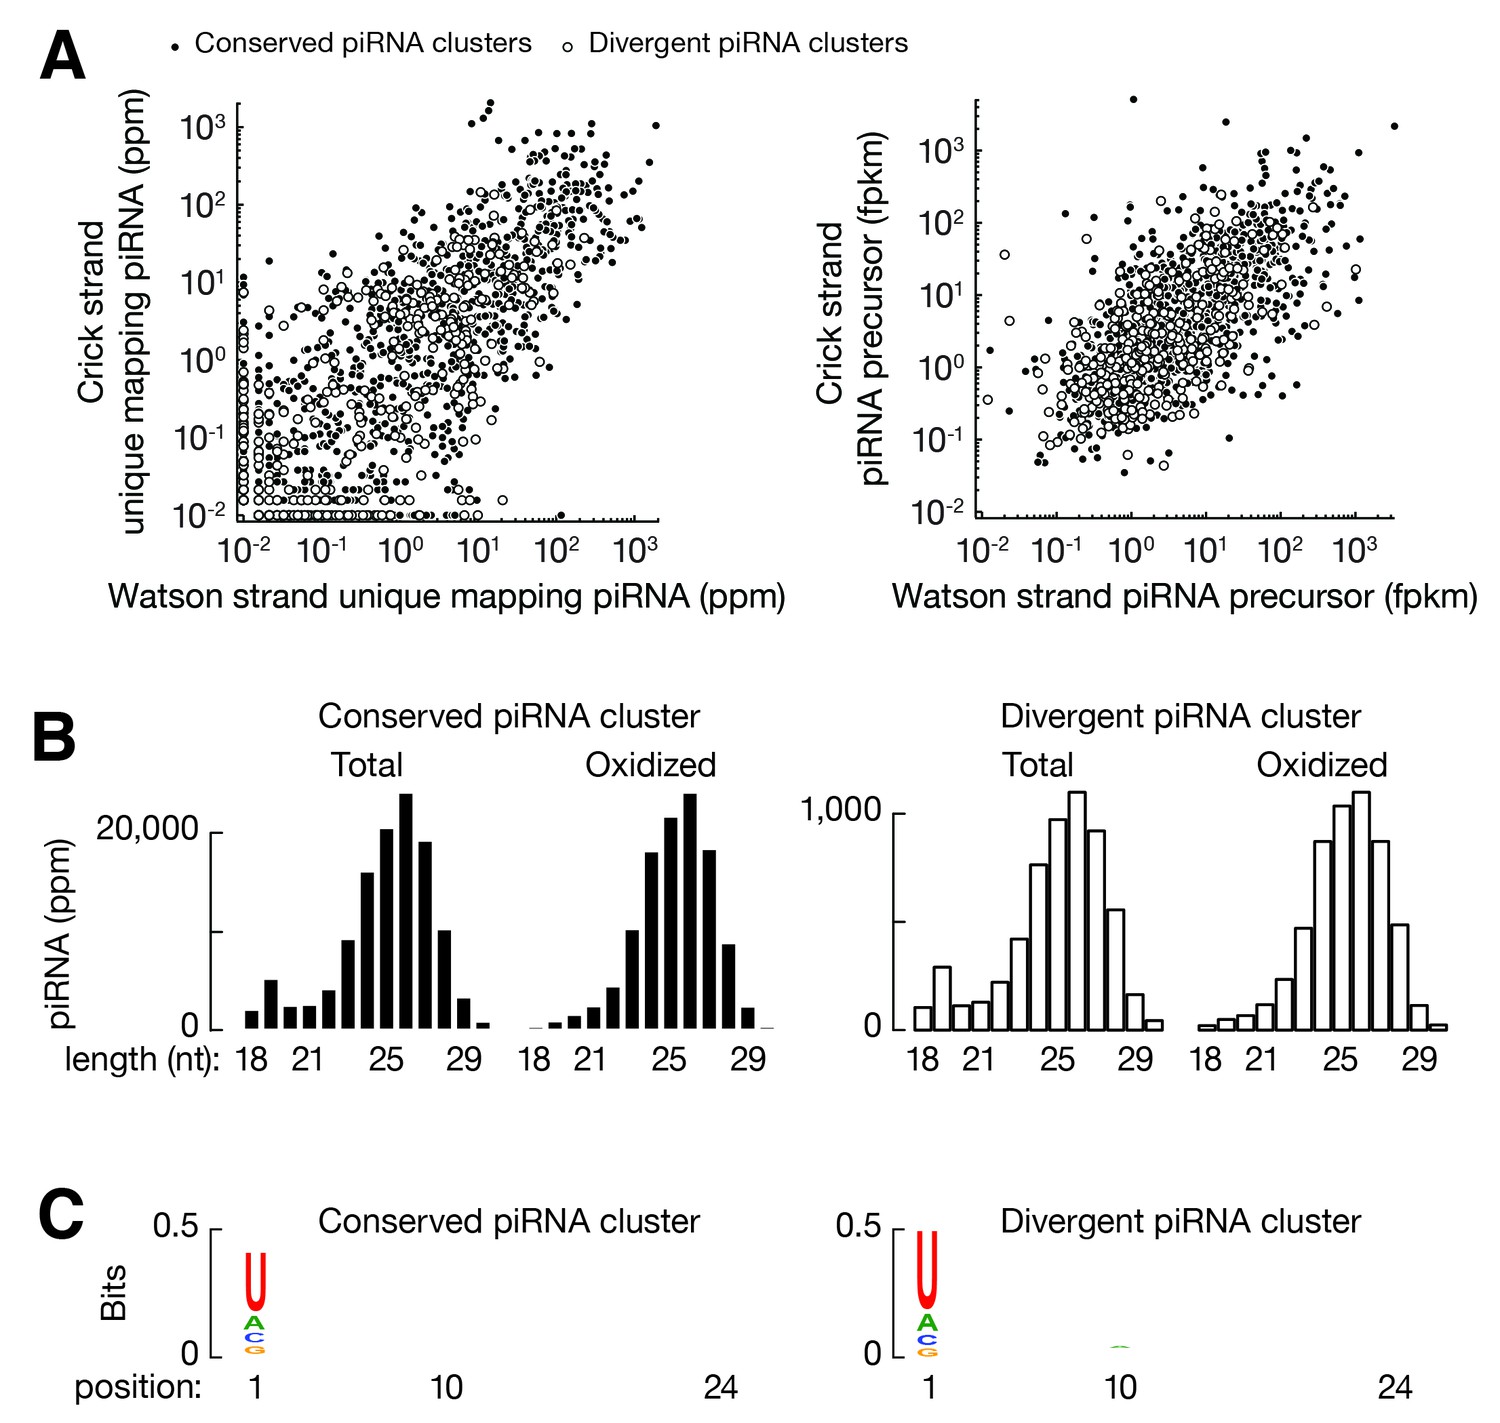
Divergent transcription of piRNA clusters.
(A) Scatter plots of Watson-strand piRNA abundance versus Crick-strand piRNA abundance (left); scatter plots of Watson-strand piRNA precursor abundance versus Crick-strand piRNA precursor abundance (right). Each filled circle represents a conserved piRNA cluster and each open circle represent a divergent piRNA cluster. (B) Length distributions of testis small RNAs from conserved piRNA clusters (left) and divergent piRNA clusters (right). (C) Sequence logo showing the nucleotide composition of piRNA species from conserved piRNA clusters (left) and from divergent piRNA clusters (right).
Figure 4—figure supplement 2
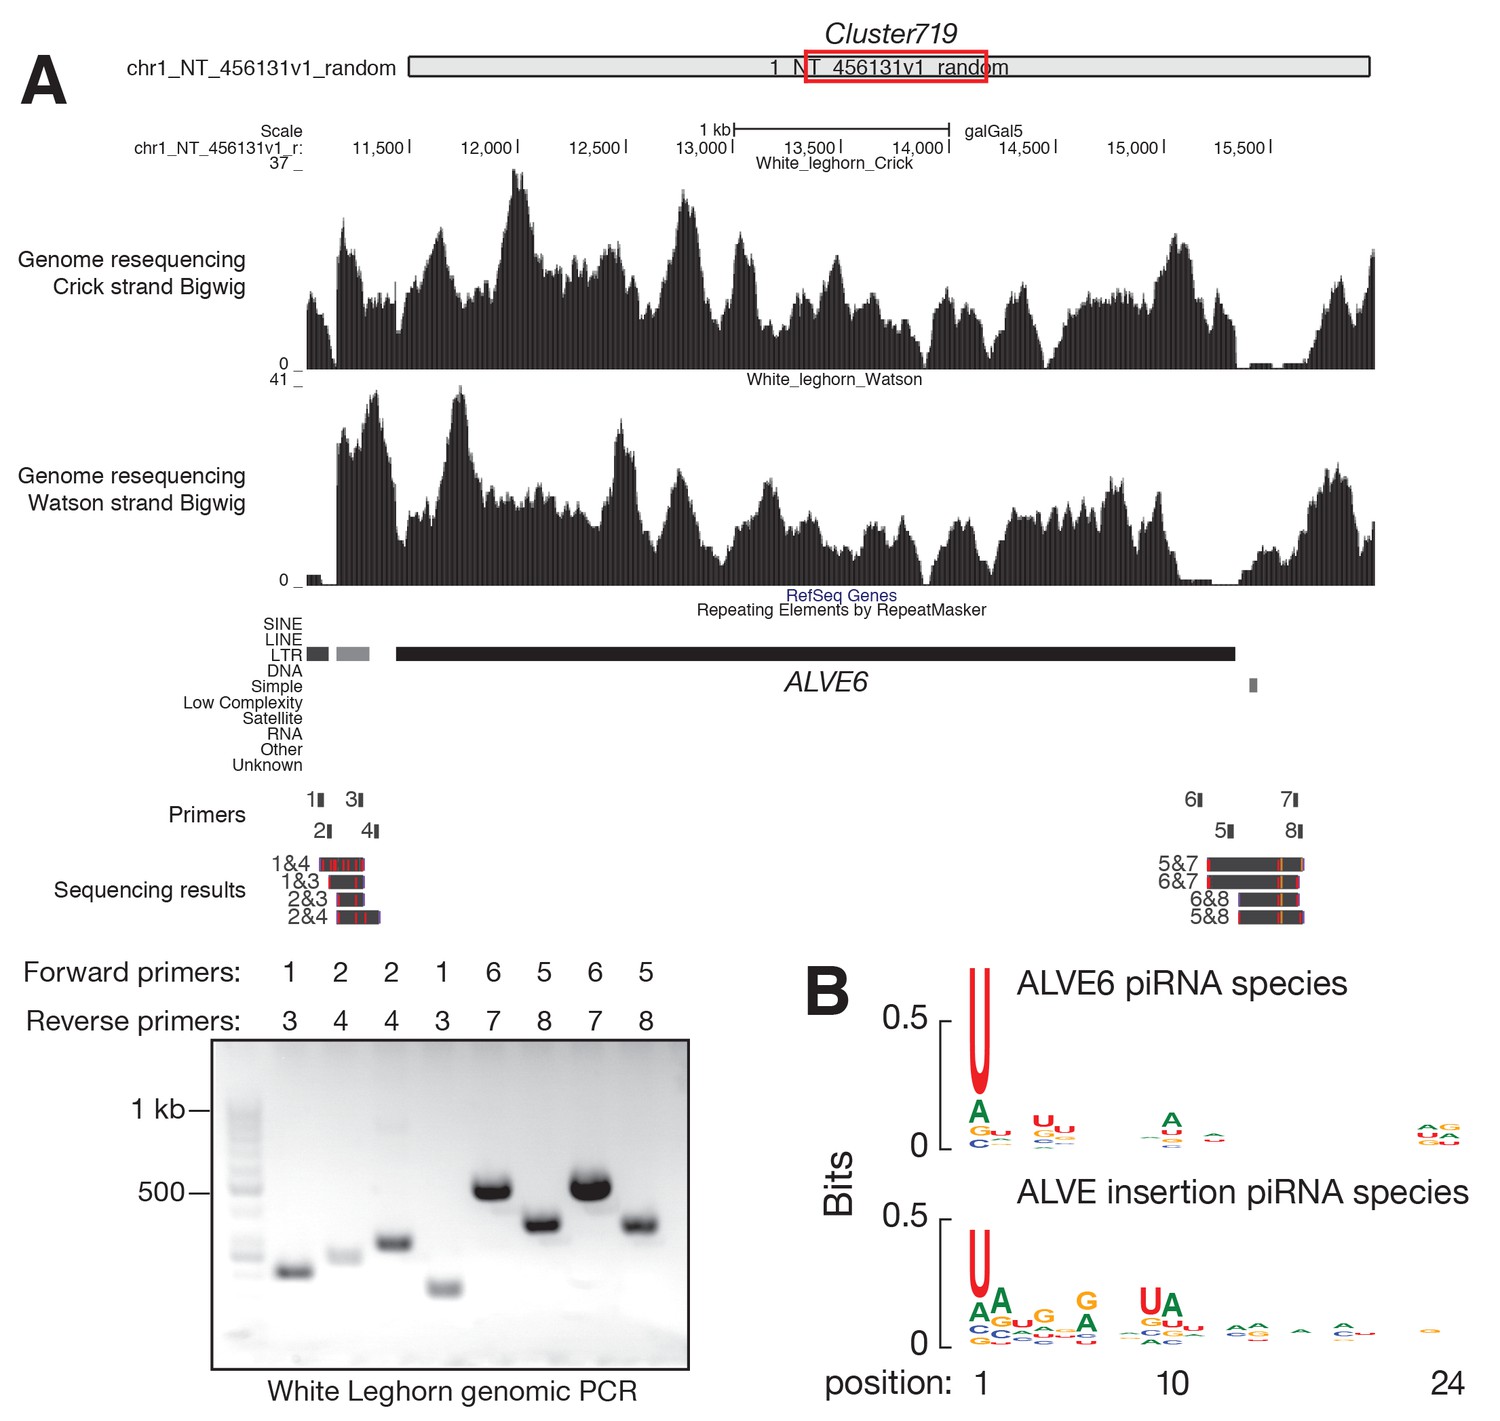
ALVE6 existed in chicken genome prior domestication.
(A) From top to bottom, the genomic location of Cluster719, White Leghorn genomic re-sequencing signals mapping to Crick strand and Watson strand, Ref-Seq track showing depletion of annotated gene, RepeatMasker track showing the annotated ALVE region, the position of primers used for genomic PCRs, and genomic PCR sequences. Separation of genomic PCR products is shown on the agarose gel, and the primers used for genomic PCRs are labeled in each lane. The sequences of these PCR products were blasted against Red Jungle Fowl with complete alignment. A red tick-mark represents a base substitution; an orange tick-mark represents an insertion. (B) Sequence logo showing the nucleotide composition of ALVE piRNA species from ALVE6 locus (top) and from new ALVE insertions (bottom).
Additional files
-
Supplementary file 1
Detailed information and statistics for the sequencing data used in this study.
(A) Ribosome profiling sequencing statistics: reads and species. (B) Small RNA sequencing statistics: reads and species. (C) RNA-Seq statistics: reads and species. (D) 200 TE families. (E) TE insertions defined by TEMP. (F) Genome coordinates for the 1633 rooster piRNA-producing loci defined in this study are provided in UCSC BED format (i.e., 0-based) for galGal5. (G) Primers used in this study for qRT-PCR and genomic PCR.
- https://doi.org/10.7554/eLife.24695.015
Download links
A two-part list of links to download the article, or parts of the article, in various formats.
Downloads (link to download the article as PDF)
Open citations (links to open the citations from this article in various online reference manager services)
Cite this article (links to download the citations from this article in formats compatible with various reference manager tools)
Domestic chickens activate a piRNA defense against avian leukosis virus
eLife 6:e24695.
https://doi.org/10.7554/eLife.24695


