Resolving stem and progenitor cells in the adult mouse incisor through gene co-expression analysis
- University of California, San Francisco, United States
- Brigham and Women’s Hospital, Harvard Medical School, United States
- The Jackson Laboratory, United States
Abstract
Investigations into stem cell-fueled renewal of an organ benefit from an inventory of cell type-specific markers and a deep understanding of the cellular diversity within stem cell niches. Using the adult mouse incisor as a model for a continuously renewing organ, we performed an unbiased analysis of gene co-expression relationships to identify modules of co-expressed genes that represent differentiated cells, transit-amplifying cells, and residents of stem cell niches. Through in vivo lineage tracing, we demonstrated the power of this approach by showing that co-expression module members Lrig1 and Igfbp5 define populations of incisor epithelial and mesenchymal stem cells. We further discovered that two adjacent mesenchymal tissues, the periodontium and dental pulp, are maintained by distinct pools of stem cells. These findings reveal novel mechanisms of incisor renewal and illustrate how gene co-expression analysis of intact biological systems can provide insights into the transcriptional basis of cellular identity.
https://doi.org/10.7554/eLife.24712.001eLife digest
To maintain healthy tissues and organs in adult animals, the cells that die or become damaged need to be replaced. This process is made possible by adult stem cells, which can divide to produce more stem cells (via a process called self-renewal) or specialize into other types of cells. This means that stem cells can maintain their own population by self-renewal while continually being able to generate specialized cells that replenish tissues and organs.
Mouse incisor teeth are useful models to understand how adult organs are regenerated because, unlike human teeth, the incisor teeth of mice and other rodents grow continuously throughout the life of the animal. The tip of the mouse incisor is eroded as the animal eats, resulting in the loss of cells. A group of adult stem cells at the base of the tooth produce new cells that then move to the tip to replace the lost cells.
Although virtually all cells in the body have the same set of genes, only small subsets are active in each cell type. It is possible to distinguish cells of different types by their patterns of gene activity. However, little is known about the gene expression patterns that distinguish stem cells and specialized cells in mouse incisors.
Using a technique called gene co-expression analysis, Seidel et al. set out to identify all the genes that are active in stem cells and their descendants at the base of the mouse incisor. The experiments reveal the patterns of activity of thousands of genes, providing a clearer picture of the different cell types present and the biological processes at play. Seidel et al. then used other techniques to identify two genes that can be used as markers to identify distinct types of stem cells in the incisor.
The next steps following on from this work will be to understand in more detail how stem cells behave in renewing the incisor. In the future, these findings may help guide the use of stem cells in regenerating human teeth and other organs.
https://doi.org/10.7554/eLife.24712.002Introduction
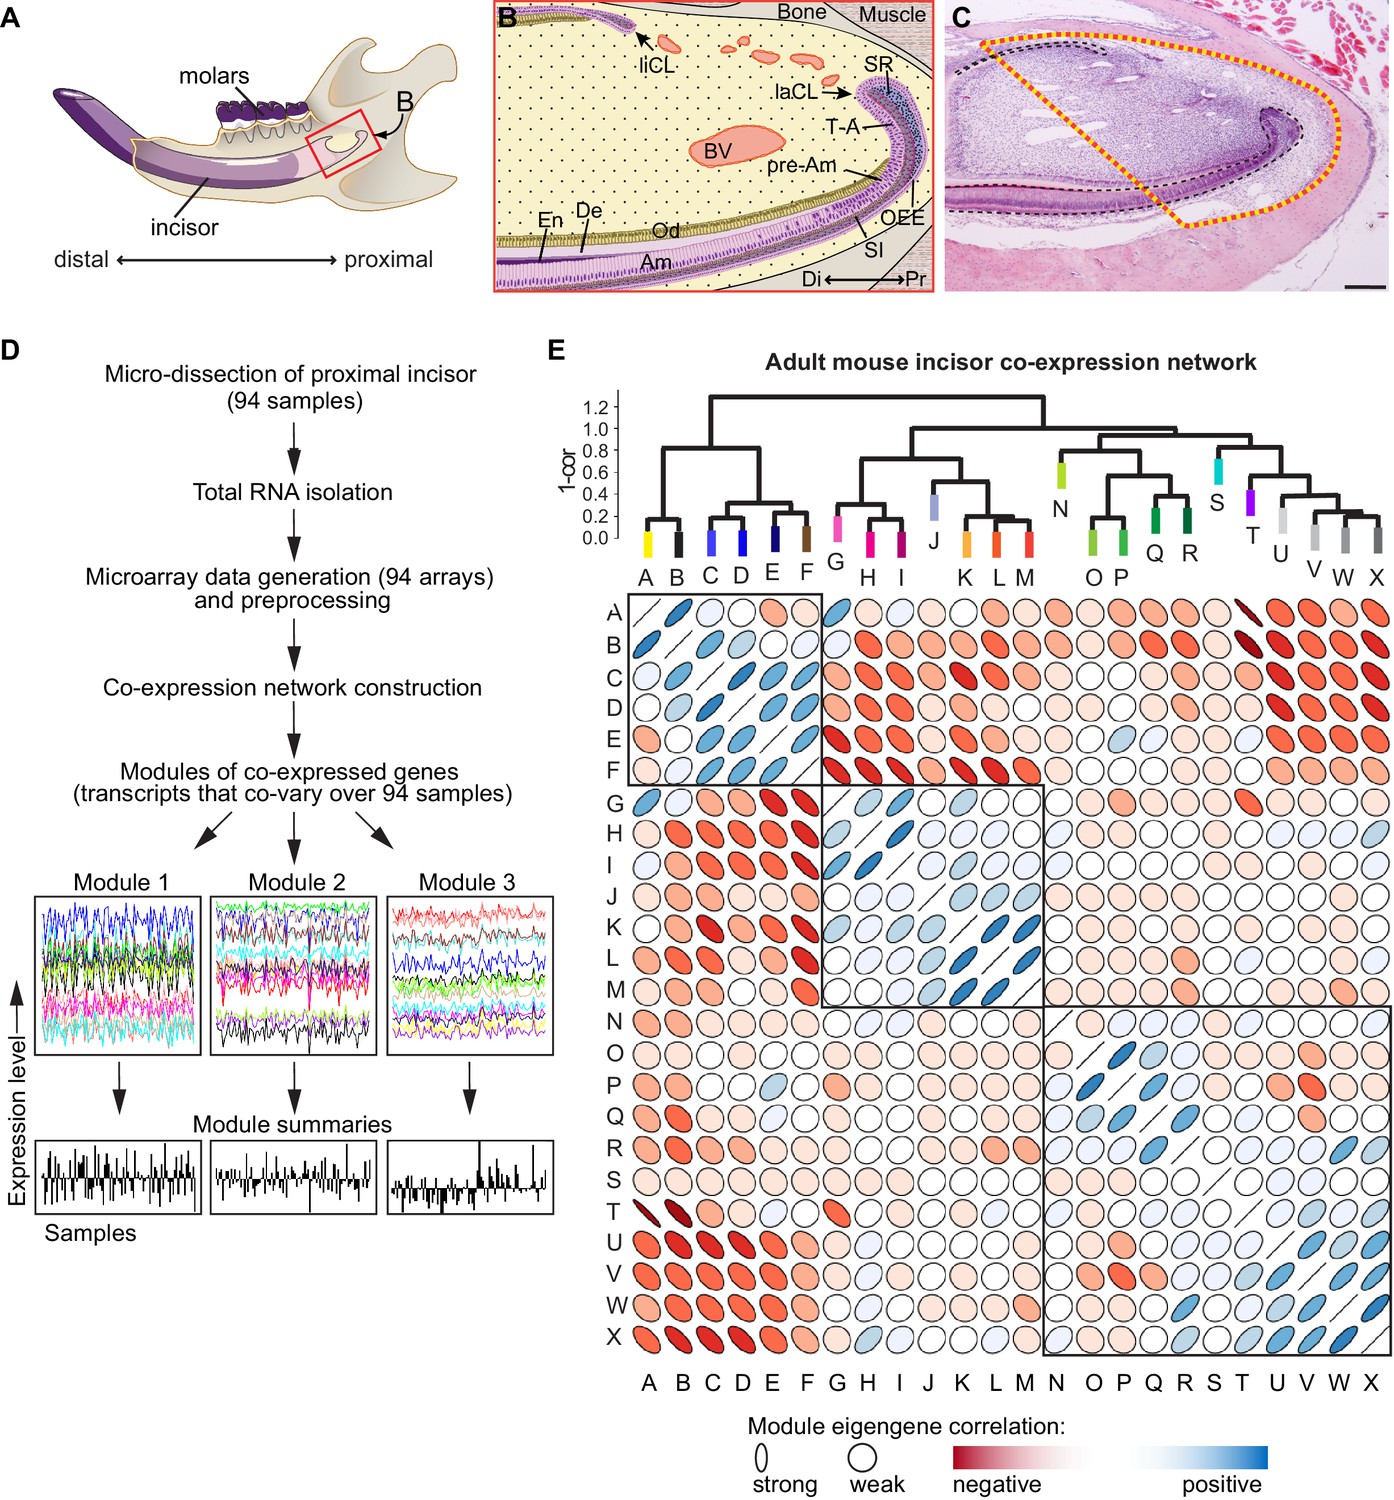
To maintain homeostasis, adult tissues must replace cells that have completed their life cycle. An emerging model for studying adult mammalian tissue renewal is the rodent incisor, which grows continuously throughout the animal’s life. As with many renewing organs, the differentiated cell types of the rodent incisor have a limited life span and are lost over time. A number of cell types, including the ameloblasts and odontoblasts that secrete the mineralized enamel and dentin, respectively, are constantly generated by progenitors located at the proximal end of the tooth (Figure 1A,B). These cells replenish the tissues that are lost from the distal end of the tooth due to abrasion during gnawing. In the epithelial compartment, stem cell progeny leave the niche, known as the labial cervical loop (laCL), as they begin the process of differentiation, and they then enter a transit-amplifying (T-A) zone and proliferate (Hu et al., 2014). These cells then differentiate, secrete matrix, and finally undergo apoptosis, all the while gradually advancing towards the distal tip of the organ. This linearity, akin to a conveyor belt, makes the incisor a useful model system to study adult epithelial tissue homeostasis, as tissue renewal occurs in an easily-observed proximo-distal fashion, whereby cells at increasingly advanced stages of maturation are found at progressively more distal locations (Figure 1A,B). The organization of the mesenchyme has been less well-studied than the epithelium, but this tissue also has distinct compartments comprised of progenitors that give rise to various differentiated cell types, including the dentin-producing odontoblasts (Feng et al., 2011; Kaukua et al., 2014; Zhao et al., 2014). A tissue complex of mesenchymal origin known as the periodontium wraps the incisor growth region and anchors the tooth in the jaw (Nanci and Bosshardt, 2006).
Figure 1
Analysis of transcriptional co-variation in adult mouse incisor reveals gene co-expression modules.
(A) Diagram depicting sagittal view of right lower jaw of a mouse. (B) Schematic of the stem cell-containing region in the proximal (Pr) mouse incisor. Stem cell pools that give rise to epithelial cell types (purple) are located in the proximal portion of the lingual and labial cervical loops (liCL, laCL). Mesenchymal cell types of the incisor (yellow), such as the dentin (De)-secreting odontoblasts (Od), are constantly replenished by progenitors located in the mesenchyme between the CLs. Blood vessels (BV) are highly abundant in this region. In the laCL, stem cells located in the outer enamel epithelium (OEE), adjacent proximal stellate reticulum (SR), and stratum intermedium (SI), give rise to highly proliferative transit-amplifying (T–A) cells which, after undergoing mitosis, differentiate along several epithelial lineages as the progeny advance to the distal (Di) tip of the incisor and differentiate into enamel (En)-secreting ameloblasts (Am). (C) Hematoxylin and eosin stained sagittal section of the mouse incisor. Dashed line indicates tissue region for which analysis was performed. Scale bar: 200 μm. (D) Workflow for incisor gene co-expression network construction. RNA samples were used to generate genome-wide microarray expression profiles for 94 intact incisor specimens, which were used as input for unsupervised gene co-expression analysis. Gene co-expression modules consist of transcripts that co-vary and therefore have highly similar expression signatures across all samples (x-axis). Examples of three co-expression modules are shown. The characteristic expression pattern of each module is summarized by its first principal component, or module eigengene (module summaries; (Horvath and Dong, 2008)). (E) Structure of the incisor co-expression network. Twenty-four gene co-expression modules were identified and hierarchically clustered based on eigengene dissimilarity (1 – cor) using average linkage. The correlation matrix of the module eigengenes is depicted below. Blue and red denote positive and negative correlations, respectively, with stronger correlations denoted by thinner ellipses (Murdoch and Chow, 1996). Three main clusters of positively correlated modules are evident from the dendrogram and correlation plot.
Relatively little is known about the molecular identities of progenitor cells in the incisor or about the signals they use to regulate the production of cell types that are required to maintain homeostasis. The high turnover and short lifespan of differentiated cell types in the incisor indicate that there are active pools of progenitor cells (Smith and Warshawsky, 1976, 1975). In vivo lineage tracing assays have identified Gli1 and Bmi1-expressing populations of stem cells in both the incisor epithelium and mesenchyme (Biehs et al., 2013; Seidel et al., 2010). Both Gli1 and Bmi1 also mark label-retaining cells (LRCs) that divide infrequently and therefore retain BrdU or genetic labels. Within the incisor, LRCs are restricted to the proximal incisor mesenchyme and the proximal part of the laCL and lingual cervical loop (liCL). Additional lineage-tracing studies identified Sox2 as a stem cell marker in the incisor epithelium but not the mesenchyme (Juuri et al., 2012). The properties displayed by Gli1-, Bmi1- and Sox2-expressing cells – slow division kinetics, residence in a discrete niche, and contribution to the differentiation of various lineages – are classically considered to be typical of stem cell populations. To date, only these three markers have been found to label incisor stem cells, and thus a major limitation of the incisor model has been a paucity of markers that clearly distinguish its cell types, including progenitor cells. Indeed, this limitation is not unique to the incisor, as the precise cellular composition of most mammalian organs is still unclear. The ability to clearly distinguish cell types and distinct stages of maturation is an essential prerequisite to understanding renewal and regeneration.
Gene co-expression analysis is a powerful approach for elucidating transcriptional signatures of distinct cell types in heterogeneous tissue samples (Oldham et al., 2008). This approach is based on two straightforward ideas: (i) different cell types express different genes, and (ii) the relative abundance of a given cell type will vary among heterogeneous tissue samples. Therefore, transcript levels of genes that are specifically and consistently expressed by a cell type will appear highly correlated when measured over a large number of biological replicates. We set out to apply this strategy to the proximal adult mouse incisor region, with the goal of identifying transcriptional signatures of progenitor cells and their descendants. We identified modules of co-expressed genes representing differentiated cells, transit-amplifying cells, and residents of stem cell niches. We further demonstrated the power of this approach by using in vivo lineage tracing to define populations of incisor stem cells, and we discovered that two adjacent mesenchymal tissues, the periodontium and dental pulp, are maintained by distinct pools of stem cells. More generally, our data indicate that this strategy provides a useful analytical framework for deconstructing biological systems by identifying recurrent patterns of transcriptional variation driven by large numbers of cells.
Results
Transcriptome analysis of the mouse incisor reveals modules of co-expressed genes
We micro-dissected proximal incisor samples from 94 six-week-old female CD1 wild-type mice; each tissue sample was heterogeneous and consisted of the entire range of cell types present in the proximal incisor region (Figure 1C). We profiled transcriptomes using Illumina Mouse Ref 8 v2.0 gene expression BeadChip microarrays, which contain 25,697 probes. Following data pre-processing (Oldham et al., 2012), we performed genome-wide gene co-expression analysis (Lui et al., 2014; Zhang and Horvath, 2005) and identified 24 modules of co-expressed genes (termed A-X, Figure 1D; Figure 1E). The characteristic expression pattern of each module was summarized by its first principal component, or module eigengene (ME) (Horvath and Dong, 2008; Oldham et al., 2008), and verified by selecting several markers among the highest ranked genes and conducting in situ hybridization (ISH) analysis. Hierarchical clustering of modules based on eigengene dissimilarity revealed distinct subgroups of modules within the dendrogram (Figure 1E), suggesting broad themes of transcriptional co-variation in the incisor.
A subset of gene co-expression modules corresponds to distinct cell lineages
We quantified the similarity between the expression patterns of individual genes and the eigengenes of co-expression modules by calculating the Weighted Gene Co-expression Network Analysis (WGCNA) (Zhang and Horvath, 2005) measure of intramodular connectivity, kME, for all genes with respect to all modules (Supplementary file 1). kME is defined as the Pearson correlation between the expression pattern of a gene and a ME (Horvath and Dong, 2008). Intuitively, the ME summarizes the characteristic expression pattern of genes comprising a module, and kME quantifies the extent to which individual genes track this pattern. kME can therefore be used to identify individual genes that best represent a module and mark particular cell types or biological processes (Oldham et al., 2008). To determine how these modules mapped to cell types of the incisor, we initially examined the top 15 genes ranked by kME and conducted an extensive ontology search using literature available in PubMed. We also examined genes reported to be expressed during late development and postnatal life in the ‘Gene Expression in Tooth’ database (http://bite-it.helsinki.fi/).
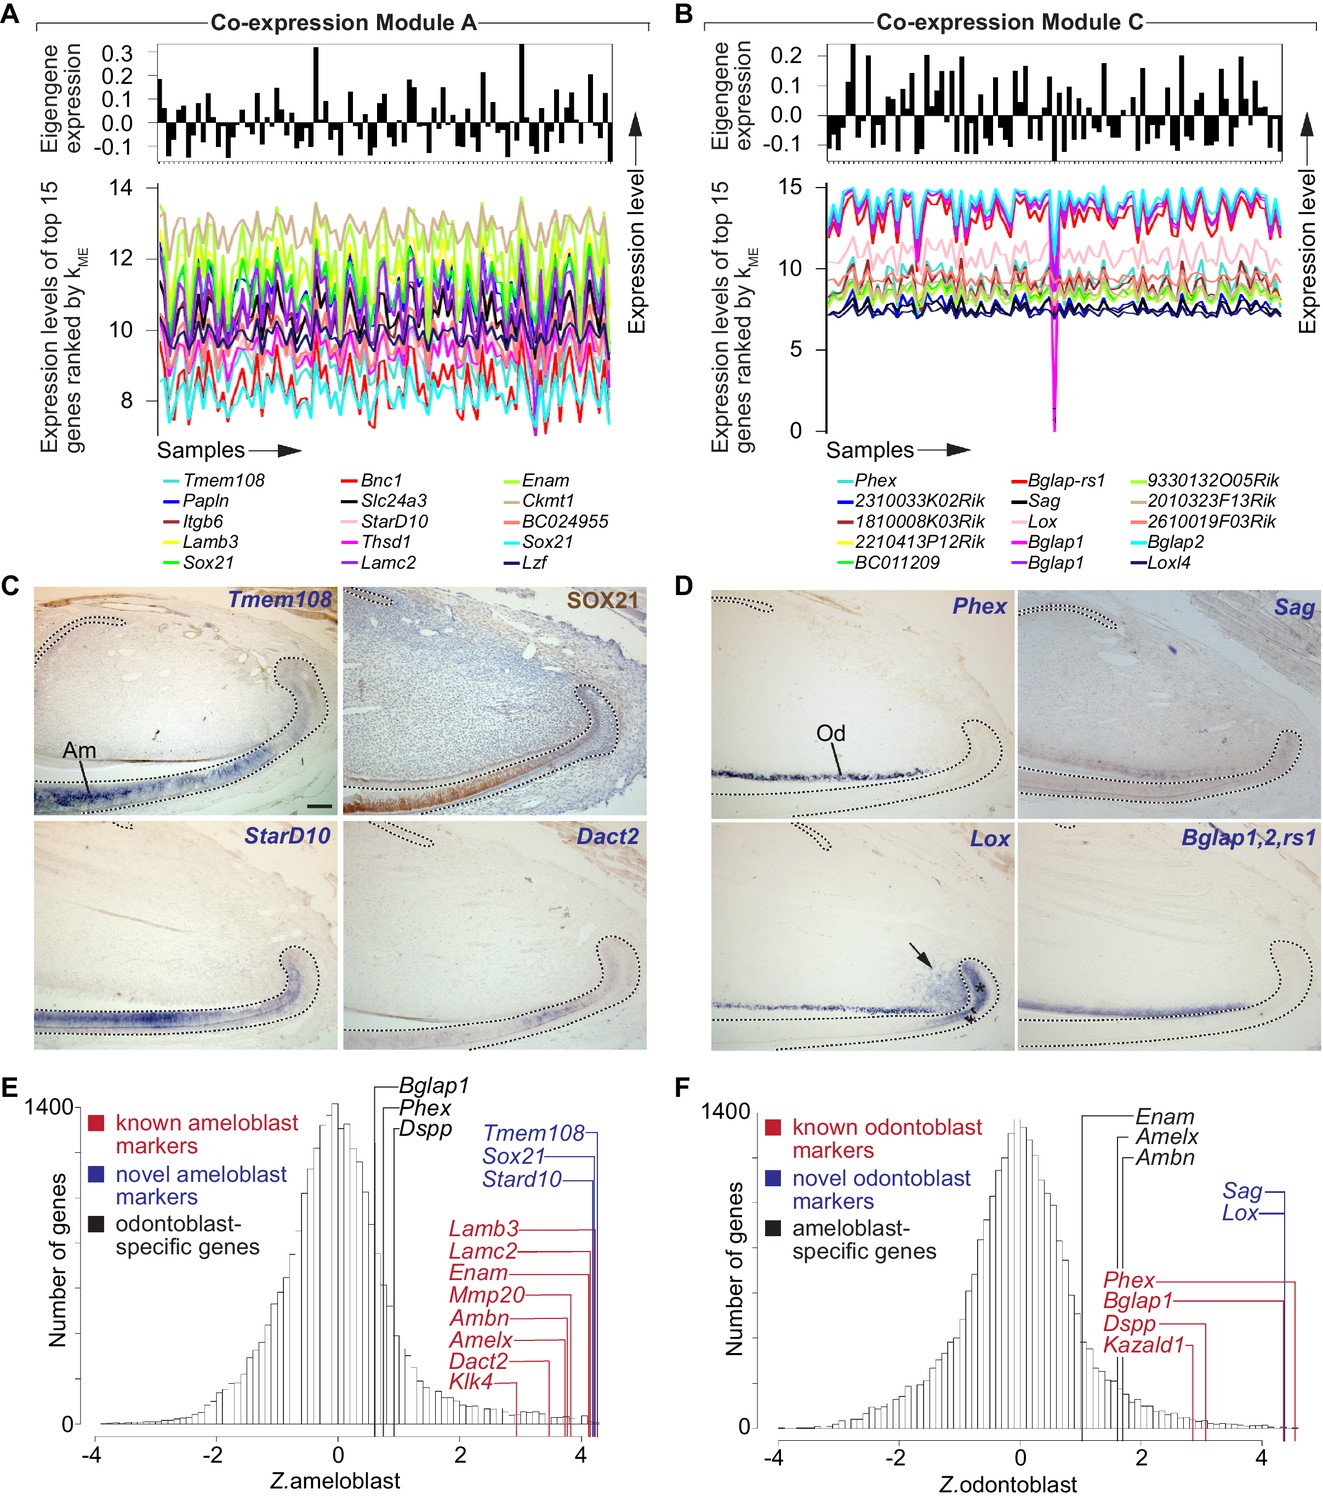
This analysis immediately suggested that Module A (Figure 1E; Figure 2A) represents a transcriptional signature of ameloblasts, which are enamel-producing differentiated cells derived from epithelial stem cells in the laCL (Figure 1B). For example, both Lamb3 (kME.Arank = 4) and Lamc2 (kME.Arank = 10) encode subunits of Laminin 5 that are expressed by ameloblasts in developing mouse incisors (Yoshiba et al., 2000). Expression of Enam (kME.A rank = 11) is also restricted to ameloblasts (Hu et al., 2001). For Lamc2 and Enam, multiple microarray probes targeting these transcripts had kME ranks for Module A within the top 0.5% of all probes on the microarray (Supplementary file 1). Similarly, Ambn and Amelx, which encode enamel matrix proteins that are widely used as ameloblast markers (Lee et al., 1996; Snead et al., 1988), were also strongly associated with Module A (kME.A ranks of 107 and 118, respectively; Supplementary file 1). Another gene in this module was Dact2 (kME.Arank = 192), which encodes a transcription factor-binding protein whose expression has previously been shown to be restricted to the dental epithelium during molar development (Kettunen et al., 2010).
Figure 2 with 1 supplement see all
Identification of gene co-expression modules corresponding to distinct lineages of differentiated stem cell progeny.
(A,B) Snapshots of gene co-expression Modules A and C. Top: the module eigengene (first principal component) summarizes the characteristic expression pattern of genes in each module. Bottom: expression patterns of the top 15 genes ranked by kME values for each module. (C) Immunohistochemistry (top-right panel) and in situ hybridization (remaining panels) confirms ameloblast-specific expression for genes in Module A. (D) In situ hybridization confirms expression in odontoblasts for genes in Module C. Arrow and asterisk denote additional expression domain of Lox in mesenchymal and epithelial T-A region, respectively. (E,F) Genome-wide distribution of predicted ameloblast (E) and odontoblast (F) expression specificity. Dashed lines in (C,D) delimit ectodermal epithelium. Am, ameloblasts; Od, odontoblasts. Scale bar: 100 μm.
Further investigation showed that Module C represents a transcriptional signature of odontoblasts, which are the dentin-secreting cells comprising the outer layer of the dental pulp. For example, Bglap1 and Bglap2 were among the top-ranked genes for Module C (Figure 2B), and these are expressed by mesenchymally derived pre-odontoblasts and odontoblasts (Bronckers et al., 1987). Phex (kME.C rank = 1) is expressed in developing odontoblasts (Ruchon et al., 1998), and Dspp, a known marker of odontoblasts (Bègue-Kirn et al., 1998; D'Souza et al., 1997), was strongly associated with Module C (kME.C rank = 190). Similarly, Kazald1, which is expressed by secretory odontoblasts (James et al., 2004), was also associated with Module C (kME.C rank = 266).
We next asked if module organization could predict novel markers of distinct cell types, beginning with differentiated cell types such as ameloblasts and odontoblasts. We used immunohistochemistry and ISH to examine expression of genes with high kME for those modules that, to our knowledge, have not been previously implicated in ameloblast or odontoblast biology. As shown in Figure 2C, Tmem108 (kME.A rank = 1), SOX21 (kME.A ranks = 5, 15, 1302), and StarD10 (kME.A rank = 8) all showed robust and specific expression in the ameloblast lineage. These data demonstrate that Module A consists of genes that are predominantly expressed in the ameloblast lineage of the adult mouse incisor.
Next, we investigated expression patterns of genes that were strongly associated with Module C, to determine if the module organization was an effective tool to predict novel markers of odontoblast identity (Figure 2D). As expected, expression of Phex (kME.C rank = 1) was restricted to odontoblasts (Ruchon et al., 1998). Expression of Bglap1, Blgap2, and Bglap-rs1 (kME.C ranks = 6, 9, 10, 14) was detected with a probe for an mRNA sequence shared by all three genes, confirming specificity to the odontoblast lineage. Expression of Sag (kME.C rank = 7) was also restricted to odontoblasts, while expression of Lox (kME.C rank = 8) showed a more complex pattern, with robust expression in odontoblasts but additional expression in regions where T-A cells are located in epithelium and mesenchyme (arrow and asterisk in Figure 2D). This discrepancy may reflect biological or technical sources of variability such as additional Lox isoforms and/or non-specific targeting by microarray or ISH probes. Overall, these results indicate that Module C consists of genes that are predominantly expressed in the odontoblast lineage.
To compare the distributions of predicted expression specificity for ameloblasts (Z.ameloblast) and odontoblasts (Z.odontoblast), we generated standardized, genome-wide histograms of kME values for each module (Figure 2E) (Lui et al., 2014). We observed that known markers of ameloblasts possessed Z.ameloblast >> Z.odontoblast, and vice versa. These results indicate that the expression signatures captured by Modules A and C are both sensitive and specific: canonical markers of each cell type have high kME values for the appropriate module and lower kME values for the inappropriate module. Importantly, the vast majority of genes with the highest kME values for these two modules, which are likely to play central roles in the establishment and maintenance of the functional identities of these cell types (Lui et al., 2014; Oldham et al., 2008) have not been characterized in the ameloblast or odontoblast lineages.
Taken together, these findings establish that gene co-expression analysis of heterogeneous tissue samples can discern and predict transcriptional signatures of the two principal secretory cell types of the adult mouse incisor. We also identified gene co-expression modules corresponding to other differentiated cell types that are present in this biological system (Figure 2—figure supplement 1). For example, over-representation analysis with cell type-specific gene sets revealed that Module J was significantly enriched with experimentally validated markers of oligodendrocytes (p<10−8, Figure 2—figure supplement 1B–E), suggesting that this module corresponds to a transcriptional signature of Schwann cells. Similarly, Module S was significantly enriched with experimentally validated markers of skeletal muscle cells (p<10−12, Figure 2—figure supplement 1B). It appears that this highly specific module resulted from contamination of a small number of tissue samples by cells from the muscle tissue surrounding the jawbones. These modules corroborate the ability of gene co-expression analysis to isolate distinct transcriptional signatures of differentiated cell types from heterogeneous tissue samples in silico while simultaneously providing a broad perspective on the cellular composition of biological systems.
A subset of gene co-expression modules corresponds to cellular differentiation states
Although some gene co-expression modules clearly corresponded to specific cell lineages, others were less obvious. To determine which cells in the incisor were responsible for producing the transcriptional patterns captured by these modules, we analyzed expression patterns for at least three of the top 15-ranked members of each module. As a starting point, we chose modules that were strongly positively correlated with Modules A and C and therefore clustered in the left branch of the incisor network dendrogram (Figure 1E). Interestingly, expression of Cdkn1a (kME.B ranks = 2, 3, 7), Smox (kME.Branks = 4, 5, 9, 31, 68), and Atp2b (kME.B rank = 8), which were among the highest-ranked members of Module B (Supplementary file 1), was detected in epithelium-forming cell types of the ameloblast, stratum intermedium, and odontoblast lineages located distal to the laCL (Figure 2—figure supplement 1G–I). Given that a number of genes are expressed in all three lineages during the differentiation and secretory stages of tooth development (http://bite-it.helsinki.fi/), this finding was not surprising. The expression patterns of these genes, which included factors involved in cell cycle exit, are consistent with the location of Module B in the dendrogram and suggest a close relationship between genes in this module with those that are expressed in the ameloblast and odontoblast lineages. Expression patterns of genes in Modules D and E were similar to those of genes contributing to Module C (data not shown), and genes contributing to Module F, including Tgfbi (kME.F ranks = 1, 2), Fgfr3 (kME.F ranks = 11, 99), and Nes1 (kME.F ranks = 28, 49), were expressed in the distal dental pulp mesenchyme, but not in the proximal-most pulp cells (Figure 2—figure supplement 1J–L). Thus, expression of genes contributing to Modules A-F was predominantly detected in regions distal to the stem cell niches in the epithelial cervical loops and in the mesenchyme located between these epithelial regions. The clustering of Modules A-F may reflect correlated cellular abundance among these regions, as dissections that include a greater representation of the epithelial niches are more likely to include a greater representation of the mesenchyme between them.
Transit-amplifying cells are represented by multiple modules
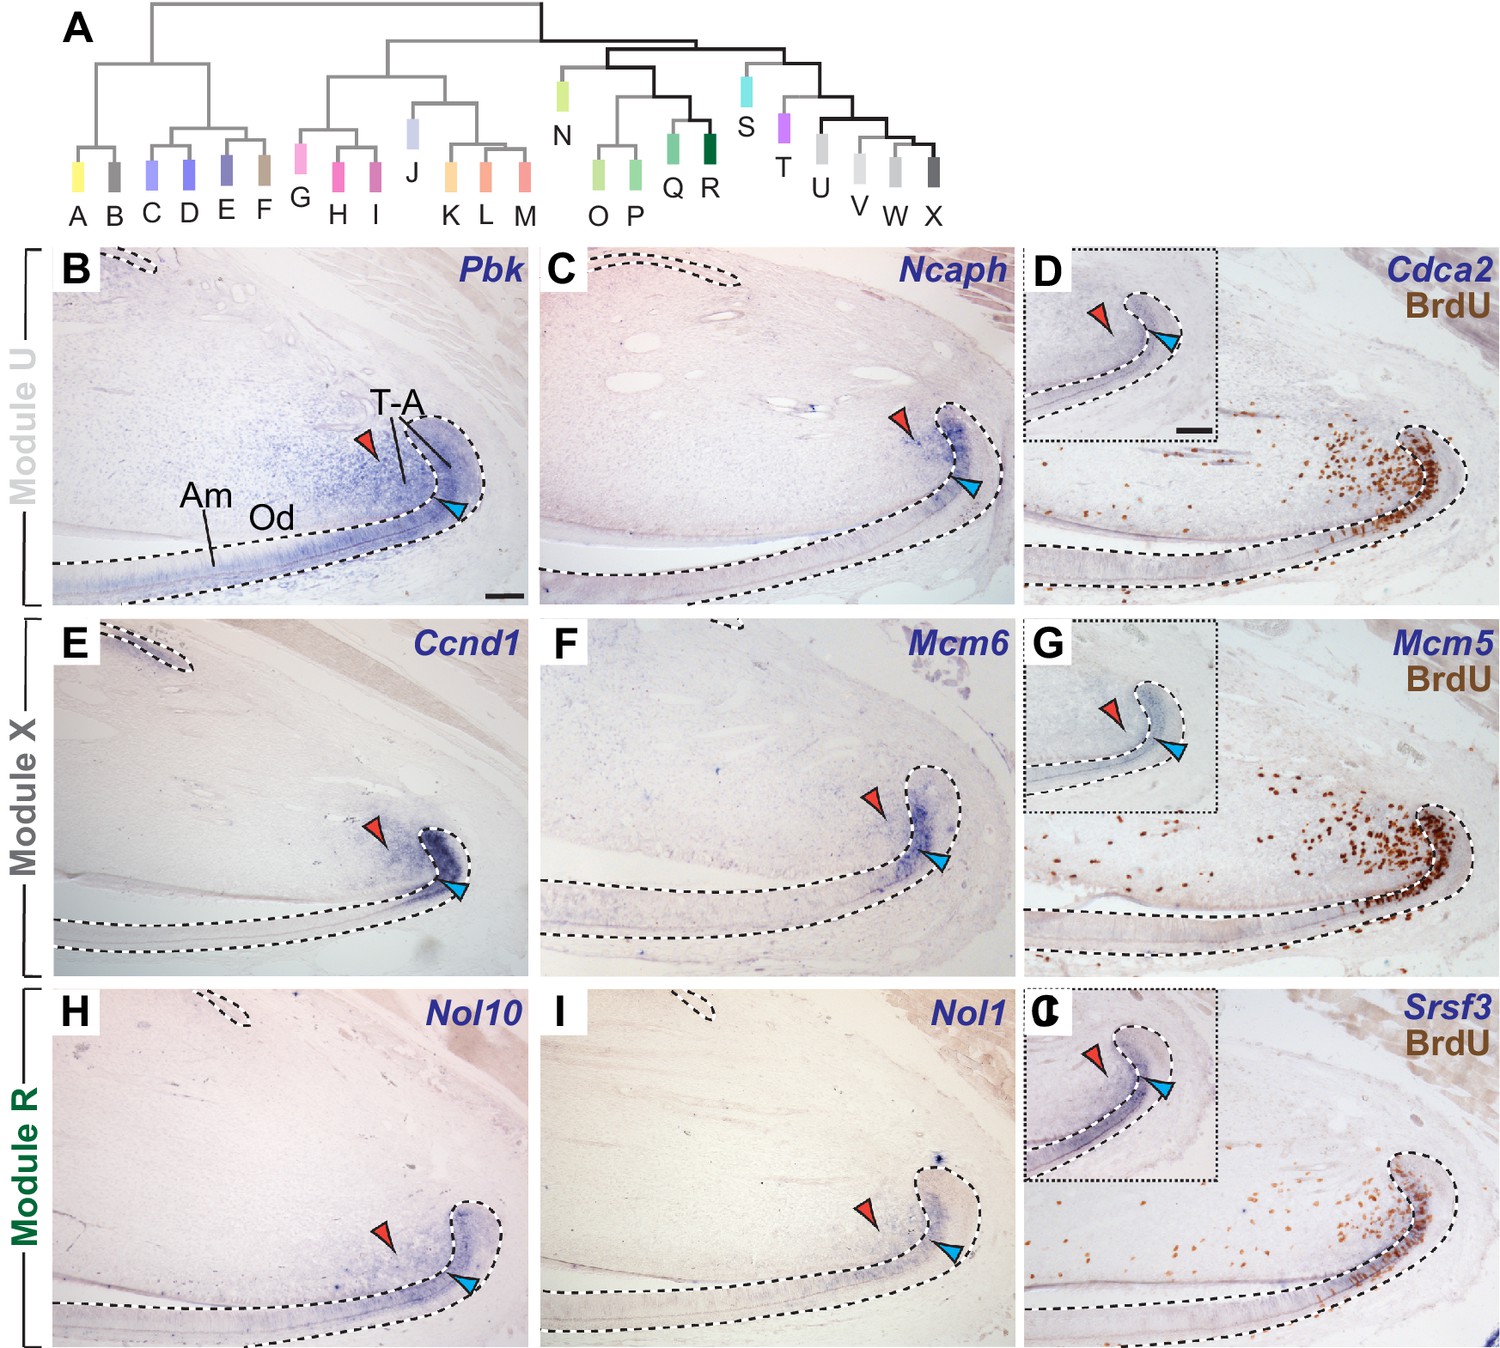
Functional enrichment analysis indicated that Module U, the second largest co-expression module, was enriched for genes expressed during the mitotic phase of the cell cycle (p=3.1×10⁻²⁴). We therefore analyzed expression patterns for genes in this module as well as other modules with which it was positively correlated (Figure 1E, Figure 3A). As predicted by the functional enrichment analysis, expression of Pbk (kME.U rank = 1), Ncaph (kME.U rank = 2), and Cdca2 (kME.U rank = 3), the three highest ranked genes contributing to Module U (Supplementary file 1), was found in actively proliferating transit-amplifying (T-A) cells in the proximal incisor (Figure 3B–D), which can be visualized as BrdU-incorporating cells using immunohistochemistry (Young et al., 1992). All three genes were expressed in BrdU-positive, T-A cell-containing regions in both the incisor epithelium and mesenchyme.
Figure 3 with 2 supplements see all
The incisor gene co-expression network contains several modules of genes co-expressed in transit-amplifying (T–A) cells.
(A) Highly ranked genes contributing to modules clustered in the right-hand portion of the dendrogram are expressed in regions with actively proliferating epithelial and mesenchymal T-A cells. (B–D) mRNA expression of genes highly ranked in module U is detected in T-A cells in the incisor epithelium (blue arrowhead) and mesenchyme (red arrowhead). (E–G) In situ hybridization for highly ranked genes contributing to Module X. (H–J) Transcription of genes in Module R is restricted to T-A cells. In situ hybridization and antibody staining against BrdU (D,G,J) confirm expression of Cdca2, Mcm5 and Srsf3 in proliferating cells. Insets show mRNA expression prior to detection of BrdU on same tissue section. Dashed lines delimit ectodermal epithelium. Am, ameloblasts; Od, odontoblasts, T-A, transit-amplifying cells. Scale bars: 100 μm, C-J as in B; insets in G, J as inset in D.
Interestingly, T-A cell-specific expression was not restricted to members of Module U. We also identified a T-A cell signature in co-expression Modules V, W, and X, which were the modules most strongly positively correlated with Module U (Figure 3E–G, and Figure 3—figure supplement 1I–L). Similar to the genes contributing to Module U, expression of genes in Modules V, W, and X labeled proliferating cells in both the epithelium or the mesenchyme in all cases. When we extended our follow-up analyses to modules that clustered within the same branch of the dendrogram, but that were less strongly correlated to Module U, we discovered that Modules N-R also represented T-A cell-specific expression signatures (Figure 3H–J, and Figure 3—figure supplement 1A–D). The surprising finding that T-A cells were represented by multiple closely related modules of co-expressed genes reflects the importance of these actively dividing cells as central executors of incisor renewal as well as the ability of the methodology to unravel detailed gene expression profiles within both epithelial and mesenchymal T-A cell regions. To better understand what the T-A cell-specific modules represent, we analyzed enrichment patterns in these modules for Gene Ontology annotations related to cell proliferation (Figure 3—figure supplement 2). Whereas Modules T-X were enriched in genes involved in processes characteristic of the M-phase of the cell cycle, Modules N-R were enriched in genes involved in biosynthetic and metabolic processes, suggesting roles during interphase, during which cell growth and DNA replication occur. Together, these data indicate that T-A-specific gene co-expression modules may represent distinct biological processes that are integrated to induce or maintain proliferation. They also suggest that these processes may be temporally segregated in subpopulations of T-A cells. The T-A cell-specific modules provide a platform for elucidating the molecular mechanisms that regulate stem cell progeny during this poorly understood stage of maturation.
Identification of modules enriched with markers expressed by epithelial progenitors
We next asked if the handful of stem cell markers that have been identified in the adult mouse incisor through in vivo lineage tracing were associated with particular co-expression modules. Gli1 and Bmi1 mark stem cell pools in both the incisor epithelium and mesenchyme, whereas Sox2 exclusively marks epithelial stem cells (Biehs et al., 2013; Juuri et al., 2012; Seidel et al., 2010). Although Gli1 was not represented by a probe on the microarrays that we used, Ptch1, which like Gli1 reports active Hedgehog signaling and is expressed in the same pattern in the incisor as Gli1 (Seidel et al., 2010), was associated with Module L, and Sox2 was associated with Module H (Figure 4A, Supplementary file 1). Expression of Bmi1 was detected in all specimens but not associated with a co-expression module. Lgr5, another gene that recently has been suggested to be expressed by incisor stem cells (Chang et al., 2013; Suomalainen and Thesleff, 2010), was not detected by the microarray in any of the samples. These results may reflect the limited sensitivity of microarrays for detecting low-expressed transcripts in rare cell populations in heterogeneous tissue samples.
Figure 4 with 3 supplements see all
Module clusters G-H-I and K-L-M are enriched for candidate epithelial and mesenchymal stem cell markers.
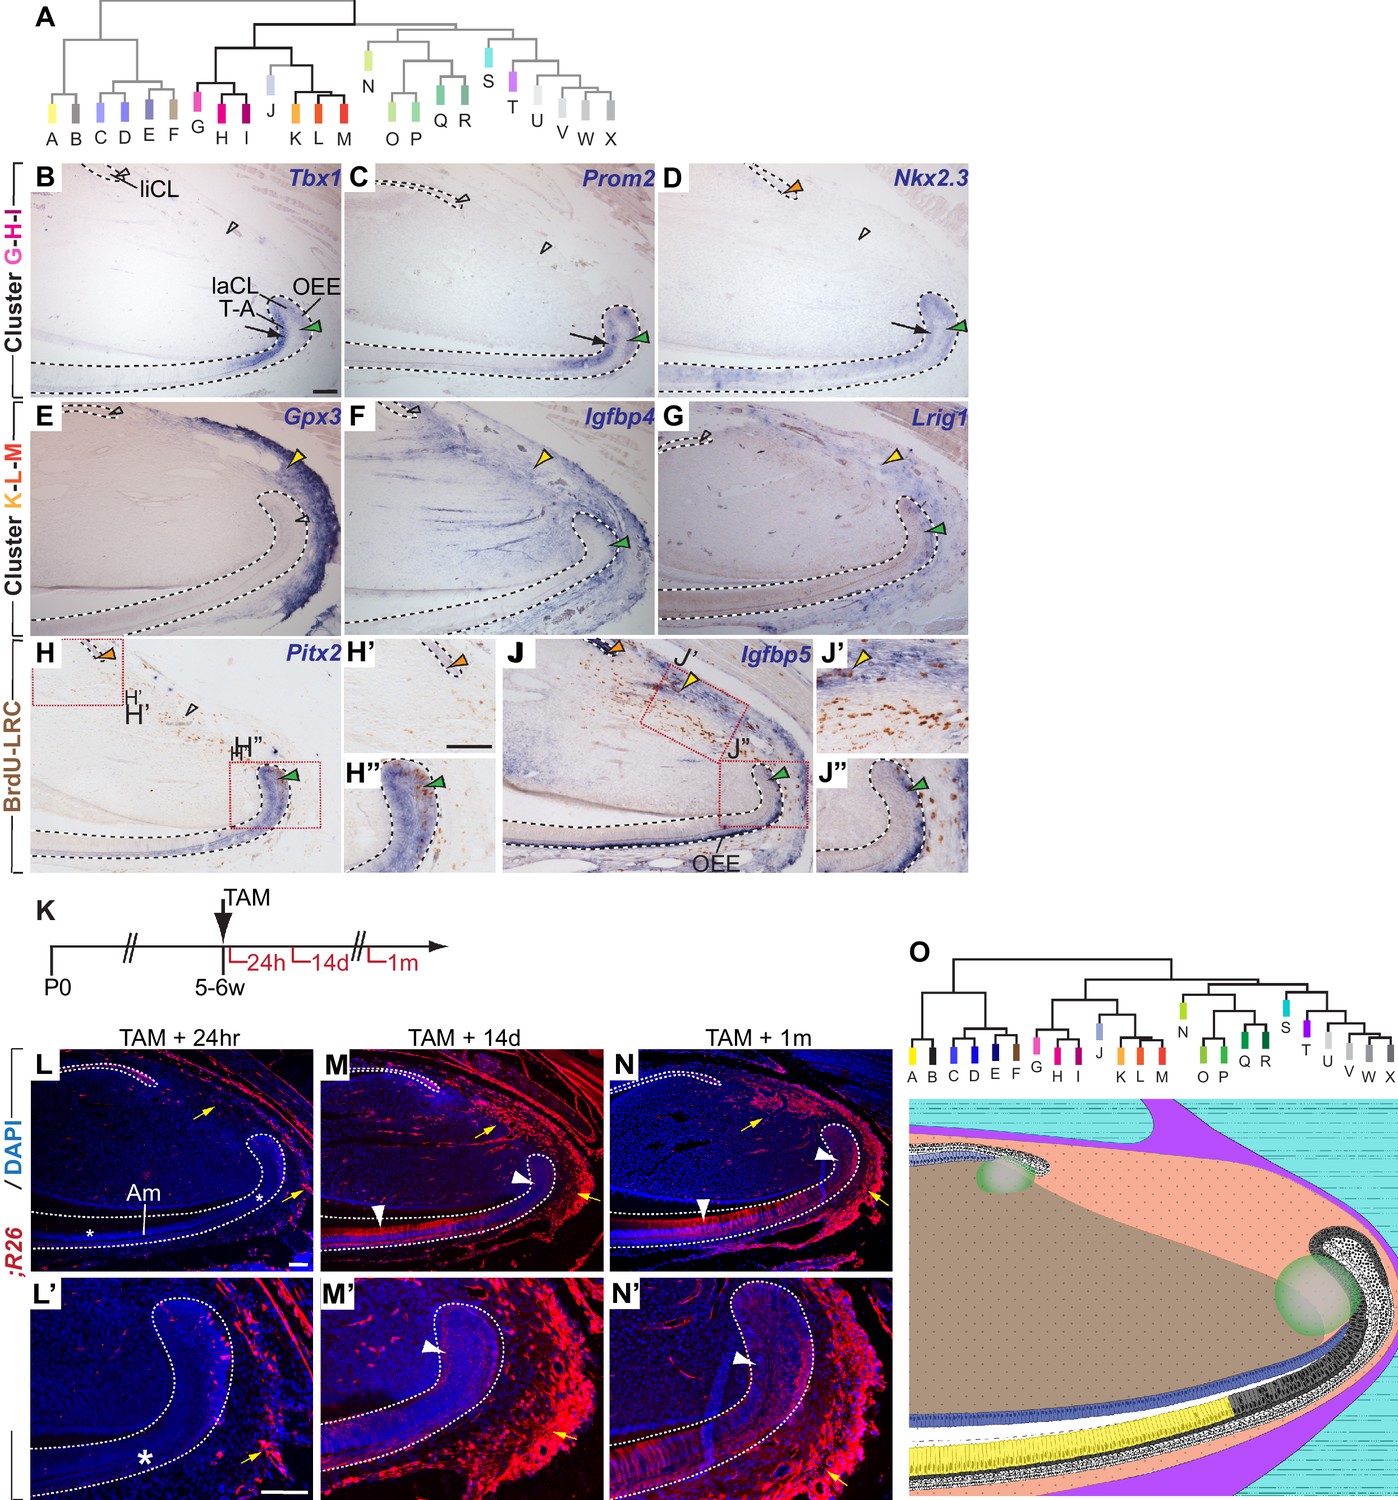
(A) Dendrogram depicting incisor gene co-expression network with modules featured in panels B-J highlighted. (B–D) mRNA expression of genes with high module memberships for modules G, H and I is restricted to the ectodermal epithelium and includes the proximal epithelium of the labial cervical loop (laCL; green arrowheads) and the epithelial T-A region (black arrows). Expression in the lingual cervical loop (liCL) was detected for Nkx2.3 (orange arrowhead) but not in case of Tbx1 and Prom2 (open arrowheads) (E–G) Genes contributing to modules K-L-M are predominantly expressed in the proximal incisor mesenchyme (yellow arrowheads). A number of genes affiliated with this cluster show additional transcriptional activity in the proximal laCL (green arrowheads). (H–H”) In situ hybridization and antibody staining against BrdU in samples with BrdU-label-retaining cells (LRCs) detects expression of Pitx2, which contributes to the G-H-I module cluster, in LRCs in the laCL and in the liCL. (J–J”) Igfbp5 is expressed by cells in the liCL, the outer enamel epithelium (OEE), including BrdU-LRCs in the laCL (green arrowhead in J, J”), and a subset of mesenchymal LRCs located close to the periphery of the organ (yellow arrowheads in J and J’). (K) Dosing scheme for in vivo lineage analysis of cells expressing Igfbp5. (L–N’) Lineage tracing of Igfbp5-positive cells 24 hr (L, L’), 14 days (M, M’), and 1 month (N, N’) post Tamoxifen treatment. Asterisks indicate the absence of labeled epithelial cells. White arrowheads highlight labeled progeny in the T-A region or amongst differentiated ameloblasts (Am). In the periodontal tissue, labeled cells increase in number over time (yellow arrows). (O) Summary of the domains of expression of the modules and module clusters mapped onto a schematic view of the incisor growth region. Color code matches the dendrogram; overlapping modules are represented using corresponding color shading. Module clusters C-D-E, G-H-I, K-L-M, and U-V-W-X are represented by the central hue used for that branch of the dendrogram. Dashed lines delimit ectodermal epithelium. T-A, transit-amplifying cells. Scale bars: 100 μm, C-H and J as in B; H”, J’, J” as in H’; M, N as in L; M’, N’ as in L’.
Module H, the co-expression module with which Sox2 was most strongly associated, also contained Tbx1 (kME.Hrank = 14), which was previously shown to be expressed in the epithelium of developing incisors (Catón et al., 2009). We found that Tbx1 expression is also restricted to the epithelium in the adult incisor, and we detected transcripts in the T-A and pre-ameloblast region as well as in several cells in the proximal region of the laCL (Figure 4B) where epithelial stem cells reside. Other genes strongly associated with this putative epithelial progenitor module included Epha1 and Prom2 (Figure 4C, and Figure 4—figure supplement 1A); like Sox2 (Juuri et al., 2012) and Tbx1, expression of these genes was restricted to the incisor epithelium and included the proximal regions of the laCL, where we previously detected LRCs. Expression of Epha1 was found predominantly in stellate reticulum (SR) cells in the laCL and in more distal cells subtending the SR cells adjacent to this region (Figure 4—figure supplement 1A). In contrast, expression of Prom2 appeared to overlap that of Tbx1 in the T-A cell and pre-ameloblast region as well as in the outer enamel epithelium (OEE) of the laCL (Figure 4B). In addition to being a highly-ranked gene for Module H, Prom2 also showed a strong association to the neighboring Module I. Further investigation of Modules G and I, which were strongly positively correlated with Module H and each other (Figure 1C), revealed that multiple genes, including Epha1 and Prom2, associated strongly with two or all three modules (Supplementary file 1). Therefore, we extended our expression analysis to include the two neighboring modules and treated the G-H-I group of modules as a clustered unit.
Of the genes primarily contributing to Module G, we analyzed the expression patterns of Scnn1b (kME.G rank = 3), p63 (kME.G rank = 5), and Nkx2-3 (kME.G rank = 11), the last of which was previously shown to be required for molar development (Biben et al., 2002). All three were expressed predominantly in the T-A and OEE regions of the laCL with no or low levels of expression in the SR (Figure 4D, and Figure 4—figure supplement 1B). Expression was not limited to the CL on the labial side but rather extended distally into both the OEE and differentiated ameloblasts and was also found in the liCL. Isl1 (kME.G rank = 33), which was previously shown to be expressed exclusively in the incisor epithelium during tooth development (Mitsiadis et al., 2003), was expressed in the same pattern in the laCL as p63, Nkx2-3, and Scnn1b, with distally extending expression maintained in the OEE and ameloblasts but decreased levels in the pre-ameloblasts (Figure 3—figure supplement 1C). The distally extended expression appears characteristic of Module G genes and is reflected in the strong positive correlation of Module G’s eigengene signature with that of the ameloblast-specific Module A (Figure 1E), whereas the correlations between Modules H and A as well as I and A were weaker (Figure 1E).
Expression of Pitx2 (kME.Irank = 2) in the T-A cell and OEE regions of the laCL widely overlapped with the expression domains of Prom2 (Figure 4C). Pitx2 expression appeared to be highest in the apical aspect of the laCL, where Sox2 is expressed at high levels (Juuri et al., 2012), and was also present in the SR. In the proximal SR and OEE regions, expression of Pitx2 was detected in LRCs (Figure 4H–H”). However, similar to Tbx1, Epha1 and Prom2, expression of Pitx2 was not detected in the liCL epithelium. Shh, which is expressed in epithelial T-A cells, pre-ameloblasts and ameloblasts in the labial incisor epithelium (Seidel et al., 2010), was also among the genes contributing to Modules G, H, and I (kME.Grank = 14, kME.Hrank = 53, and kME.Irank = 7), which was surprising given the absence of Shh expression in the proximal laCL. Thus, expression of all analyzed genes contributing to Modules G, H, and I specifically overlapped with T-A cells in the epithelium and, with the exception of Shh, in the proximal laCL.
Modules K-M are enriched for candidate stem cell markers and markers specific to periodontal tissues
We next focused our attention on modules that appeared to exhibit mesenchymal character. As with Modules G-I, Modules K-M were highly correlated, and several genes showed promiscuity for all three modules (Figure 1E, Supplementary file 1). Expression analysis of Gpx3, which was strongly correlated to all three modules (kME.Krank = 10, kME.Lrank = 2, and kME.Mrank = 6), Fbln1 (kME.L rank = 4), and Igfbp4 (kME.Lranks = 5,12), showed that all three genes are actively transcribed in the mesenchymal tissue in the proximal part of the incisor (Figure 4E, and Figure 4—figure supplement 1E). In the case of Igfbp4, expression was observed in an additional domain in the proximal laCL epithelium. Similar expression patterns were observed for Pecam1 (kME.K rank = 13), Scara5 (kME.Lrank = 15, kME.Lrank = 1), Igfbp5 (kME.Krank = 1), and Lrig1 (kME.Lrank = 10) (Figure 4G – Figure 4—figure supplement 1F). Double-labeling experiments using (i) antibody staining against BrdU in wild-type animals that were treated with BrdU followed by a long chase period to generate LRCs and (ii) an antibody against PECAM1 or ISH to detect Igfbp5 demonstrated that both genes are expressed in LRCs in the incisor mesenchyme and laCL epithelium (Figure 4J–J”, and Figure 4—figure supplement 1G); the identity of the PECAM1-positive cells in the epithelium is not clear, but as the epithelium is not vascularized, this marker must label a non-vascular cell type in the epithelium.
We also noted that expression of genes contributing to Modules K-M was predominantly observed in cells of the periodontium (Figure 4E–G, and Figure 4—figure supplement 1E–G’), which is the tissue responsible for anchoring the tooth to the alveolar bone. While little is known about the periodontal tissue in the incisor, previous studies that mostly focused on molar teeth identified a small number of genes expressed in periodontal cells (Supplementary file 2). Comparison with the data obtained from our co-expression analysis showed that most of these factors were associated with Modules K, L, and M, suggesting that this group of modules is driven primarily by gene expression in periodontal cells (Supplementary file 2). The expression of these markers in the proximal part of the tooth suggested that these modules may be enriched for candidate stem cell markers and genes required for periodontal tissue maintenance. The relative expression patterns of the modules are presented in Figure 4O.
To test whether our analysis could enable functional identification of a stem cell population, we next focused on Igfbp5, which was the highest ranked gene contributing to Module K and was previously found to be increased in LRCs in the hair follicle bulge (Tumbar et al., 2004). To establish whether Igfbp5 marks stem cells in the incisor, we generated a tamoxifen-inducible Igfbp5iCre-ERT2 allele that drives expression of Cre recombinase without reducing Igfbp5 expression (Figure 4—figure supplement 2), and we bred mice carrying both this allele and the Ai14 (R26RFP) reporter allele (Madisen et al., 2010) to perform in vivo lineage tracing (Figure 4K). 24 hr after tamoxifen treatment of the double-heterozygous animals, RFP expression was detected in cells of the periodontium, the liCL and in the proximal portion and OEE of the laCL, as well as in a number of cells in the alveolar nerve that innervates the incisor. Thus, reporter expression was found in regions of the proximal incisor where we detected Igfbp5 mRNA expression (Figure 4J–J”), and we proceeded to perform lineage analyses using the Igfbp5iCre-ERT2 driver. 14 days after treatment with tamoxifen, the number of RFP-positive cells in the incisor mesenchyme surrounding the cervical loops and within the laCL and distally adjacent epithelium was strongly increased when compared to 24 hr post-induction, suggesting that the originally labeled Igfbp5-expressing cells supply new cells in these regions (Figure 4M). A similar distribution of RFP-labeled cells was present 1 month after tamoxifen treatment (Figure 4N). Interestingly, except for a small number of RFP-labeled cells whose morphology and locations were consistent with a neurobiological identity, RFP-positive cells were absent from the inner dental pulp mesenchyme and remained restricted to the periodontal portion of the incisor mesenchyme. These findings suggest that Igfbp5-expressing cells contribute to epithelial and periodontium homeostasis without contributing to maintenance of the pulp compartment.
Notably, Lrig1, a marker of stem cells in the intestine and the skin (Jensen and Watt, 2006; Powell et al., 2012) not previously identified in incisor stem cells, was represented in Module L. Consistent with this observation, Lrig1 was expressed in the proximal incisor mesenchyme and laCL epithelium but not in pulp cells, odontoblasts or differentiated epithelial cells (Figure 4G). ISH yielded a relatively low signal for Lrig1 when compared to most other genes analyzed for this group of modules, which may suggest transcription at low levels or expression in a subset of cells within the domain. To determine if Lrig1 is expressed by LRCs, we crossed a tamoxifen-inducible Lrig1Cre-ERT2 mouse line (Powell et al., 2012) with the R26RFP reporter allele. To generate LRCs, Lrig1Cre-ERT/+;R26RFP/+ newborn mice were injected with BrdU and aged for 8 weeks (Figure 5A). Double immunofluorescence assays against BrdU and RFP were performed in specimens from mice chased for 24 hr after tamoxifen administration; the short chase period was used to mark Lrig1-positive cells. This experiment confirmed the presence of Lrig1-expressing LRCs in the proximal laCL epithelium and the most proximal incisor mesenchyme (Figure 5B–B”), indicating that some Lrig1-expressing cells are quiescent. Interestingly, in the mesenchyme-derived portion of the incisor, the BrdU-LRC population was comprised of two neighboring subdomains that appear as stripes in the two-dimensional sections: an Lrig1-negative inner, or distal, region and an Lrig1-positive proximal region (Figure 5B). RFP also marked cells in the alveolar nerve, and occasionally single RFP-positive cells were observed within the liCL and in blood vessels. However, RFP was not detected in differentiated cells of the epithelium or within the pulp mesenchyme. Thus, expression of the Lrig1Cre-ERT2 allele was restricted to regions in the incisor where Lrig1 mRNA is expressed and included some, but not all, BrdU-LRCs (Figure 4G).
Figure 5 with 1 supplement see all
Lrig1 marks stem cell pools in the epithelium and mesenchyme of the mouse incisor.
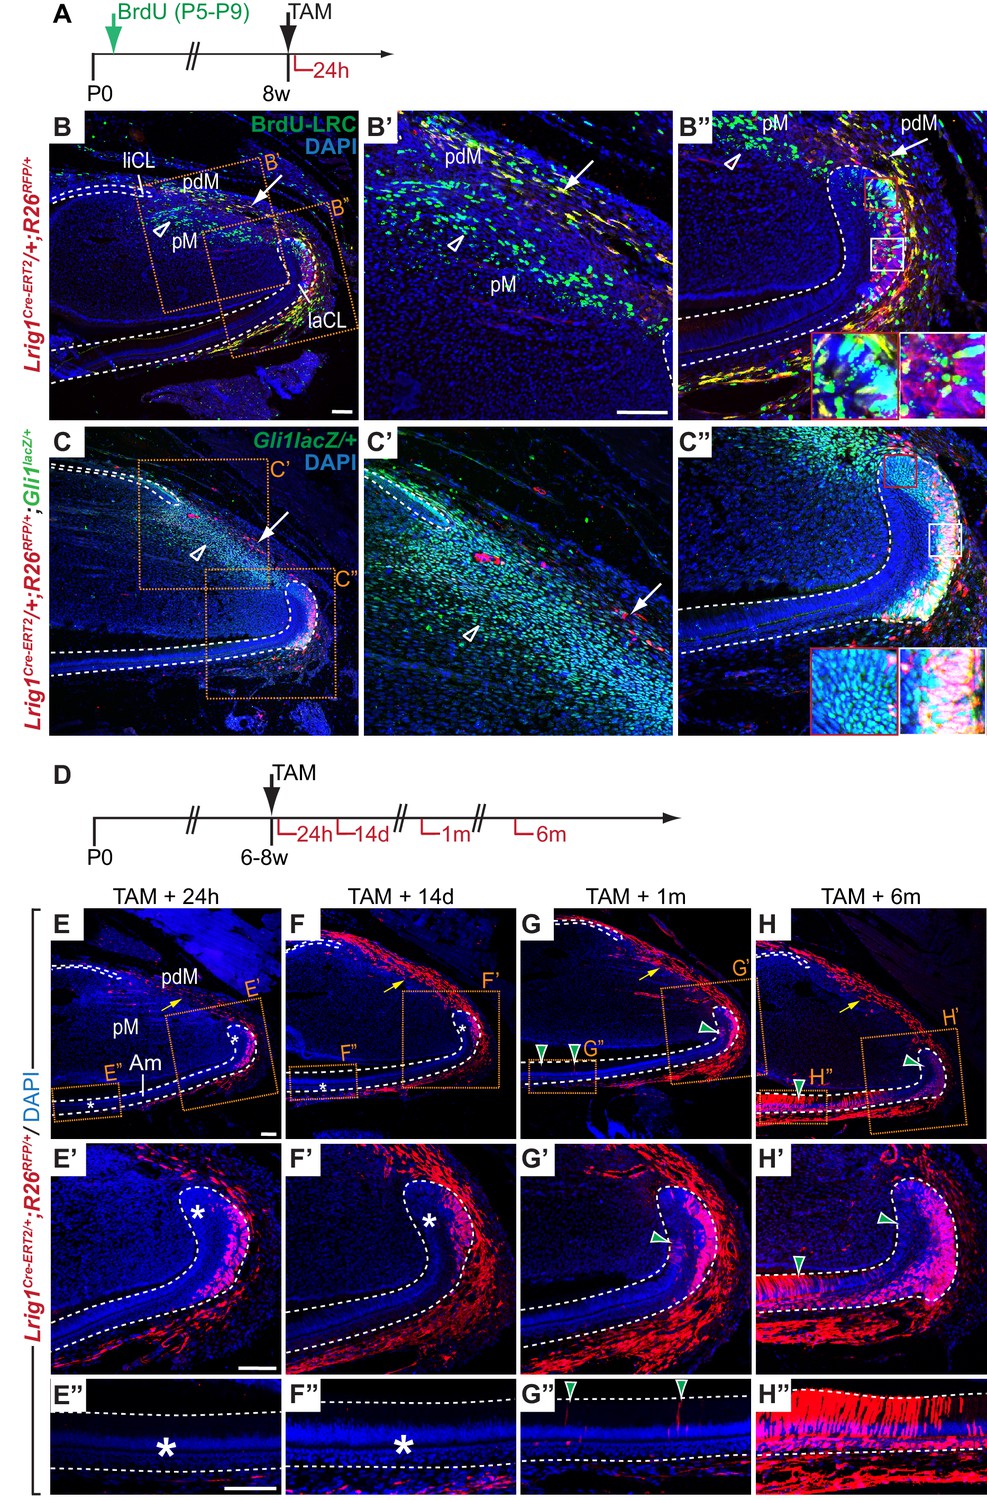
(A) Experimental design for testing Lrig1 expression by label-retaining cells (LRCs). BrdU was administered repeatedly to newborn Lrig1Cre-ERT2/+;R26RFP/+ mice (green arrows), followed by an injection-free period. Cre-mediated recombination of RFP was induced in Lrig1-expressing cells 24 hr prior to sacrifice (black arrows). (B–B”) A section of the incisor of an adult Lrig1Cre-ERT2/+; R26RFP/+ mouse stained with DAPI (blue), anti-RFP (red) and anti-BrdU (green), 24 hr after administration of Tamoxifen. Lrig1 is expressed by LRCs in the lower part of the labial cervical loop (laCL, white box in B” but not by LRCs in the upper laCL (red box in B”). Lrig1 expression in the proximal mesenchyme divides the mesenchymal BrdU-LRC population into Lrig1-negative (green, open arrowhead), pulp mesenchyme (pM)-specific and Lrig1-positive (yellow, white arrow), periodontal mesenchyme-specific subdomains. (C–C”) Lrig1-positive cells are found in incisor regions marked by Gli1lacZ-expression. Mesenchymal RFP-positive cells are rare in number when compared to Gli1lacZ-positive cells (arrow in C, C’) and absent from Gli1lacZ-expressing mesenchymal cells distal to the laCL and liCL (open arrowheads). Lrig1-positive cells in the laCL express Gli1lacZ (white box). RFP expression is absent from a population of Gli1lacZ-positive cells in the apical portion of the laCL adjacent to T-A cells (red box). (D) Dosing scheme for in vivo lineage tracing of Lrig1-positive cells. (E–H”) Lineage tracing of Lrig1-expressing cells 24 hr (E, E’, E”), 14 days (F, F’, F”), 1 month (G, G’, G”) and 6 months (H, H’, H”) after Tamoxifen induction. Asterisks indicate the absence of labeled epithelial cells. Green arrowheads denote newly formed labeled progeny in the T-A region or amongst differentiated ameloblasts (Am). Yellow arrows denote increase of labeled cells in the periodontal tissue over time. liCL, lingual cervical loop. Dashed lines delimit epithelium. Scale bars: 100 μm, C as in B; B”, C’, C” as in B’; F, G, H as in E; F’, G’, H’ as in E’; F”, G”, H” as in E”.
To definitively determine whether the Lrig1-expressing cells in the laCL and the proximal incisor are stem cells that self-renew and give rise to progeny over an extended period, we followed the fate of RFP-labeled cells in tamoxifen-induced Lrig1Cre-ERT2/+;R26RFP/+ mice over chase periods of different lengths (Figure 5D). As before, 24 hr after treatment with tamoxifen, we detected RFP-positive cells in the LRC-containing regions of the incisor, including the laCL and the mesenchymal tissue surrounding both CLs (Figure 5E–E”); no RFP was detected in the dental pulp mesenchyme between the CLs or in tissues of uninduced Lrig1Cre-ERT2/+;R26RFP/+ control animals (data not shown). 14 days after the initial labeling, Lrig1-positive cells remained restricted to the proximal laCL epithelium, and RFP-positive cells were absent from the T-A and differentiated cell regions (Figure 5F–F"). Short BrdU chases performed on the lineage tracing specimens revealed that the only proliferative populations were the epithelial and flanking mesenchymal T-A cells, with the periodontium remaining BrdU-negative (Figure 5—figure supplement 1).
Next, we wished to determine the relationship between expression of Lrig1 and Gli1, an established marker of both epithelial and mesenchymal stem cells (Seidel et al., 2010; Zhao et al., 2014). We found that Lrig1 expression, as reflected by CreER-mediated RFP expression 24 hr after tamoxifen administration, largely overlaps with Gli1 in Lrig1Cre-ERT2/+;R26RFP/+;Gli1lacZ/+mice; however, Lrig1 is more restricted in the SR and absent from the most apical portion of the Gli1lacZ-positive domain of the laCL (Figure 5C). In the mesenchyme, RFP-positive cells were relatively sparse compared to cells expressing Gli1lacZ, and these populations do not co-localize in the dental pulp. In the mesenchyme surrounding the CLs, both double-positive or RFP-positive cells that did not express Gli1lacZ were detected (Figure 5C’). Thus, Lrig1-positive cells constitute a subdomain of the Gli1-expressing cells in the laCL epithelium, but not in the incisor mesenchyme.
Given the apparent overlap of Gli1 and Lrig1 expression, we found it surprising that Lrig1Cre-ERT2/+;R26RFP/+ did not exhibit labeled progeny in differentiated or T-A cells, especially because progeny formation from cells marked by Gli1, Sox2, or Bmi1 were detected within days after tamoxifen administration (Biehs et al., 2013; Juuri et al., 2012; Seidel et al., 2010). However, one month post-induction, a small number of labeled cells was present amongst the T-A cells, as well as in the SR, SI and ameloblasts (Figure 5G–G”). After 6 months, the number of RFP-positive cells in the T-A region and SR had increased, and the majority of ameloblasts, SI cells and OEE cells were labeled (Figure 5H–H”). The extent of RFP labeling in specimens that were analyzed 3 months or 12 months after tamoxifen administration was comparable to the 6 month time point (data not shown). Thus, Lrig1 is expressed by long-lived stem cells located in the OEE and/or SR of the laCL that give rise to cells of all epithelial lineages over long periods of time. The delay in appearance of labeled progeny in the T-A cell region when compared to lineage tracing performed for Gli1 and other markers previously tested (Biehs et al., 2013; Juuri et al., 2012; Seidel et al., 2010), together with the absence of Lrig1-positive cells from the Gli1-expressing population adjacent to the T-A cell region, suggests that Lrig1 marks a relatively quiescent progenitor pool.
In the proximal incisor mesenchyme, the number of RFP-positive cells strongly increased 14 days after induction with tamoxifen (Figure 5F), suggesting that Lrig1-positive cells in this region turn over more rapidly when compared to epithelial cells that express Lrig1. Similar numbers of RFP-positive cells were observed in the mesenchyme surrounding the CLs in specimens that were analyzed one, 3, 6 or 12 months post-tamoxifen (Figure 5G and data not shown). Interestingly, RFP-positive cells were absent from the mesenchyme of the dental pulp, the compartment surrounded by the dental epithelium, but rather were restricted to the periodontal tissue surrounding the epithelial cervical loops on the outer surface of the incisor. Together, these data demonstrate that Lrig1 marks two distinct pools of stem cells, one in the incisor epithelium that enables renewal of epithelial cell types, such as ameloblasts, and one in the proximal mesenchyme that produces cells contributing to the periodontium. These fate mapping experiments further revealed that the periodontal mesenchyme in the incisor is maintained by a mesenchymal stem cell pool that is separate from the progenitors that maintain the mesenchymal cells of the dental pulp, pointing to the existence of distinct subpopulations of mesenchymal stem cells in the incisor.
Periodontal stem cell populations marked by Lrig1 and Acta2 partially overlap and mediate renewal of distinct regions of the periodontium
We further interrogated renewal of the periodontium by examining Acta2, a gene that had high rankings for Module L (which contained Lrig1) based on data from three different microarray probes (kME.Lranks = 120, 150, 200; Supplementary file 1). In molars, lineage tracing has shown that Acta2 is expressed by periodontal progenitors (Roguljic et al., 2013). As expected from our co-expression data, Acta2 expression was found in the periodontal mesenchyme proximal to the epithelial CLs, but not in mesenchymal cells in the pulp (Figure 4—figure supplement 3B). Transcription was also detected in perivascular cells in both the periodontal and pulp area, and in a small number of cells in the proximal laCL (Figure 4—figure supplement 3B’). In the periodontal compartment, ACTA2 expression included BrdU LRCs (Figure 4—figure supplement 3C), but no mRNA or protein was detected in a band of cells directly surrounding the laCL and subtending the adjacent OEE on the labial aspect of the incisor (Figure 4—figure supplement 3B–C’). This Acta2-negative domain contained a number of LRCs and was Lrig1-positive (Figure 4G – Figure 4—figure supplement 3C’).
We next performed lineage tracing in Acta2Cre-ERT2;R26RFP mice (Wendling et al., 2009) to determine whether Acta2 is also expressed by periodontal progenitors in the incisor. In contrast to the progenitors in molar teeth, progenitors in the incisor produce periodontal fibroblasts that are constantly renewed and move distally at a similar rate as ameloblasts and odontoblasts (Smith and Warshawsky, 1976). Shortly after tamoxifen administration (Figure 4—figure supplement 3A), RFP-expressing cells were present in areas where we detected Acta2 mRNA and protein (Figure 4—figure supplement 3D). Similar to what we observed when investigating the fate of Lrig1-positive cells, the number of RFP-positive cells in the periodontal mesenchyme increased between the 24 hr and 7 day time points (Figure 4—figure supplement 3D). In contrast, the number of labeled cells detected after longer chase periods appeared to remain constant (Figure 4—figure supplement 3F) and RFP-positive cells were still present 6 months after tamoxifen treatment (data not shown). These data are consistent with achievement of a steady state and indicate that Acta2 is expressed by periodontal progenitors in the incisor.
To investigate the relationship between Lrig1- and ACTA2-expressing progenitors in the periodontal compartment, we co-labelled cells derived from the Lrig1-positive progenitor pool with ACTA2. Interestingly, the progeny of Lrig1-positive cells that were labeled three months prior to analysis did not contribute to all regions of the periodontal mesenchyme marked by ACTA2 (Figure 4—figure supplement 3H). Whereas expression overlapped in a domain surrounding the ACTA2-negative inner portion of the periodontium, RFP-positive cells were absent from the outermost layer of periodontal tissue, close to the bone. We also assessed co-localization of Lrig1 descendants with cells expressing N-CAM, a gene that is broadly expressed in the periodontal tissue of the incisor (Obara and Takeda, 1997) and that showed strong membership for Module L (kME.Lranks = 39, 206; Supplementary file 1). This analysis confirmed that descendants of Lrig1-expressing cells contributed to the inner but not outer periodontal mesenchyme (Figure 4—figure supplement 3I). In contrast, progeny of cells marked by Acta2 expression were found in the outer portion of the periodontium but absent from the periodontal tissue directly surrounding the incisor epithelium (Figure 4—figure supplement 3D–G). Thus, the inner (near the tooth) region of the periodontal mesenchyme is preferentially renewed by Lrig1-expressing progenitors, whereas the outer (near the bone) region is renewed by Acta2-expressing progenitors. Together, these data identify subpopulations of periodontal progenitors, marked by Lrig1 and Acta2 expression, that promote renewal of distinct regions of periodontal tissues during incisor homeostasis.
Discussion
Gene co-expression analysis elucidates the cellular composition and interplay of biological processes required during renewal of the adult mouse incisor
Here we set out to characterize the cellular composition of the adult mouse incisor and identify cell type-specific markers by analyzing patterns of transcriptional co-variation in a large number of biological replicates. The results from this study provide strong evidence that correlated gene expression patterns are driven by variation in the abundance of distinct cell types and cell states. We identified transcriptional signatures driven primarily by ameloblasts, odontoblasts, Schwann cells, and skeletal muscle cells. The ability to detect a transcriptional signature of a cell type through gene co-expression analysis of intact tissue specimens depends on many factors, including the abundance of the cell type, the distinctiveness of its transcriptome, its anatomical distribution with respect to other cell types, the technology platform, the sampling strategy, and the algorithmic approach (Oldham, 2014). Therefore, different cell types will have different signal to noise ratios. For example, ameloblasts and odontoblasts are abundant, differentiated cell types with distinctive transcriptomes that were easily detected with our strategy. In contrast, Schwann cells are much less abundant but co-express a unique set of genes that allowed them to clearly stand out in the incisor co-expression network. Optimization of some of the factors listed above (e.g. RNA-seq analysis of a larger number of samples) should improve the sensitivity of our approach.
We also identified transcriptional signatures related to distinct states of cellular differentiation, including the progenitor state, transit-amplifying state, and cell cycle exit at the onset of differentiation. Among the patterns corresponding to differentiation states, we identified modules representing stem cell progeny far along in their maturation process within distinct compartments as well as compartment-specific modules enriched for genes expressed by progenitors. For example, one newly identified progenitor marker, Lrig1, discriminates subpopulations of Gli1-positive epithelial progenitors that appear to have different capacities to provide daughter cells for replenishing the organ. By providing an unbiased view of the major transcriptional themes in the adult mouse incisor, our study lays the groundwork for future investigations into molecular interactions that are required to establish or maintain the functional identities of distinct cell types and cell states in this model system. Unbiased gene co-expression analysis of intact biological systems also provides a data-driven framework for studying the effects of perturbations, such as blocking a specific molecular pathway or causing injury. By comparing transcriptional co-variation in perturbed and naive states through differential co-expression analysis, identification of relevant phenotypes that affect specific cell types or cell states can be accelerated.
Gene co-expression analysis vs. single-cell approaches
Single-cell methods have come of age and hold great promise for gene expression applications. However, technical noise and limited coverage of cells and transcriptomes can constrain the use of this strategy for unbiased characterization of intact biological systems. In contrast, gene co-expression analysis of bulk tissue specimens is a comparatively simple and efficient approach that can reveal the major building blocks of a biological system’s transcriptome by analyzing expression patterns that are derived simultaneously from millions of cells. Thus, these two types of analyses can be seen as complementary with regard to resolution and tissue volume analyzed. From a practical perspective, the presence of genes encoding cell-surface proteins in the co-expression modules we have identified will simplify the isolation, purification, and detailed characterization of individual cell populations using single-cell methods, which will be an important next step.
It is also important to note that the microarrays used in this study have limited dynamic range and sample almost exclusively from the protein-coding transcriptome. Therefore, the full picture of gene expression in the adult mouse incisor is likely to be more complex than the initial description presented here. Future surveys that combine deep sequencing of coding and non-coding transcripts from large numbers of intact tissue specimens and single cells will provide a powerful approach for deconstructing the transcriptional architecture of the incisor and other biological systems. In addition, because our studies here exclusively used two-dimensional section analysis, it will be important in the future to analyze proximal incisor gene expression patterns in three dimensions as well.
Lineage potential of adult stem cells marked by Igfbp5 or Lrig1
In this study, we discovered several co-expression modules enriched with genes that are predominantly expressed in the LRC-containing regions of the proximal incisor mesenchyme. Amongst the genes with expression profiles most similar to Modules K and L were Igfbp5 and Lrig1. Lrig1 is expressed in stem cells in the intestine and skin (Jensen et al., 2009; Jensen and Watt, 2006; Powell et al., 2012), and Igfbp5 is transcribed by LRCs in the hair follicle bulge (Tumbar et al., 2004). Interestingly, co-labeling with BrdU-LRCs revealed that expression of both Igfbp5 and Lrig1 divides the mesenchymal LRC population into an inner subpopulation that does not express either gene and an outer region where Igfbp5 and Lrig1 expression are found. Lineage tracing for Igfbp5 and Lrig1 revealed that the outer LRC-containing region of the mesenchyme contains progenitors that contribute specifically to periodontal cell lineages but not mesenchymal cells of the dental pulp. This finding demonstrates for the first time that the inner mesenchyme and the periodontal tissue in this continuously growing tooth are maintained by separate pools of progenitors. The extent to which the Igfbp5-positive and Lrig1-positive populations overlap will need to be addressed in the future.
Of note, Lrig1-expressing cells were shown to contribute specifically to the upper but not the lower portion of the mesenchymally derived dermis of the skin (Driskell et al., 2013). This result is intriguing as it parallels our finding that Lrig1-expressing mesenchymal cells only contribute to the periodontal tissue but not the dental pulp mesenchyme. Moreover, our analysis of cell proliferation in the Lrig1 lineage tracing experiments did not identify a specific periodontal T-A cell population, indicating a relatively slow turnover rate of this tissue.
Multiple progenitor pools are known to facilitate coordinated renewal in other organs. For example, in the skin, several stem cell pools exist that contribute, with varying overlap, to the renewal of the interfolliclular epidermis, hair follicles and sebaceous glands (Jensen et al., 2009). Although during normal homeostasis the stem cells contribute to their respective compartments, they can be mobilized to regenerate nearby compartments after injury. Whether the Igfbp5- or Lrig1-expressing periodontal progenitors are able to contribute to the dental pulp lineages following injury remains to be determined. Of note, in a small number of Lrig1Cre-ERT/+;R26RFP/+ animals chased for one year after tamoxifen treatment, we observed low-level contribution to the odontoblast lineage (data not shown); it is possible that this lineage contribution arose as the result of injury. Alternatively, this increase in plasticity could reflect changes in stem cell number or regeneration capacity that occur in the incisor as animals age.
Coordination of progeny formation in the mesenchymal and epithelial compartment of the incisor is achieved at the T-A cell level
To achieve proper homeostatic renewal of an organ composed of several tissues, progeny production by stem cell niches in all tissue compartments must be highly coordinated. Indeed, cell-labeling experiments performed in rodent incisors several decades ago showed that ameloblasts, odontoblasts and periodontal fibroblasts move distally at the same rate (Beertsen and Hoeben, 1987). The notion that the T-A cell stage serves as an important checkpoint for coordination between tissues is strongly supported by our finding that all factors that contributed to T-A cell specific modules were always expressed in proliferating cells in both the epithelium and mesenchyme and never in only one tissue. Our previous results highlight SHH as a likely signal through which coordination between the different stem cell pools in the incisor is achieved (Seidel et al., 2010; Zhao et al., 2014). These studies showed that stem cells maintaining the epithelial tissues on the labial and lingual aspect of the tooth, the mesenchymal cell types of the dental pulp including the dentin-forming odontoblasts, and the periodontium are all marked by Gli1 expression, a hallmark of responsiveness to HH signaling. Similarly, Bmi1 appears to be expressed by stem cells in all niches of the incisor (Biehs et al., 2013), whereas Sox2 and Lrig1 mark stem cells only in a restricted set of compartments (Figure 5, (Juuri et al., 2012). An interesting open question is whether other members of the SRY-related HMG-box (SOX) family of transcription factors are expressed in the liCL, mesenchymal and periodontal stem cell niches and substitute for the function of SOX2 in these regions, or whether SRY-mediated transcriptional regulation is uniquely required for control of progeny formation from epithelial stem cells housed in the laCL.
Another intriguing discovery is that distinct sets of stem cells, as defined by a constellation of markers uncovered by module analysis, have different properties in the laCL and give rise to unique cell fates in the mesenchyme. Lrig1, which encodes a type I transmembrane protein, is specifically expressed by a subset of Gli1-expressing cells in the laCL and by stem cells that give rise to periodontal tissues (Figure 5). Our lineage tracing analysis further showed that the cells that maintain the lingual incisor epithelium and pulp mesenchyme do not express Lrig1. An exciting extension to the finding that Lrig1 marks a pool of stem cells in the periodontium would be a comparison with the periodontium around molar roots. In both cases, these tissues develop from the dental follicle, wrap the teeth and anchor them to the jaw. Because molars have a finite growth period, in contrast to the continuous growth of the incisor, it would be of interest to determine how the periodontium is maintained in the molar. Additionally, an important future direction will be establishing the molecular function of LRIG1 in the tooth as well as the source and function of the ligand whose signaling it regulates in this system.
In conclusion, the wealth of information gained by our analysis of gene co-expression in the incisor will advance the use of this organ as a model for stem cell-based tissue renewal. More generally, results gained from deconstructing an organ using this transcriptome-focused approach can enable a deeper understanding of the biology of the system. In addition, by comparing gene co-expression networks between different species, important species-specific characteristics of organs can readily be identified. To this end, comparisons of gene co-expression relationships in the developing brains of humans and mice have yielded invaluable insights into transcriptional differences in neural stem cells that have contributed to changes in brain architecture during evolution (Lui et al., 2014). Going forward, comparisons of gene co-expression in different organs will help elucidate conserved pathways and general mechanisms that govern tissue renewal from stem cells. Such information can also enhance bioengineering approaches that use stem cells as a starting material for generating tissues for therapeutic purposes.
Material and methods
Animal husbandry
Request a detailed protocolMice carrying the Acta2Cre-ERT2 (Wendling et al., 2009), Ai14 (Madisen et al., 2010), Gli1-lacZ (Bai et al., 2002), and Lrig1CreERT2 (Powell et al., 2012) were maintained and genotyped as previously described. 6-week-old female CD1 mice were purchased from Charles River Laboratories and used for generation of tissue samples for microarray analysis. 6–8 week old animals were used for expression analysis and lineage tracing experiments. For generation of label-retaining cells, neonatal mice were injected daily from P5 to P9 with BrdU (5’bromo-2’deoxyuridine) and aged to 8 weeks. For detection of proliferating cells, BrdU was given in a single injection to adult mice 1.5 hr prior to sacrifice. BrdU was administered at 40 µg per gram of bodyweight. Mice were treated with a single dose of 5 mg tamoxifen (in corn oil) given by oral gavage in case of lineage tracing studies, and three doses of 10 mg tamoxifen every other day given in case of ablation experiments. Expression and lineage tracing analyses were performed using specimens from at least three different animals, examined for each functional experiment. All animals were maintained at the UCSF vivarium and the UCSF Institutional Animal Care and Use Committee (IACUC) approved all experiments performed in this study.
Generation of Igfpb5iCreERT2 line
Request a detailed protocolThe Igfbp5iCreER-T2 line was produced at the Jackson Laboratory. To generate the inducible Cre line, a codon optimized Cre recombinase variant (iCre) (Shimshek et al., 2002) was fused to a modified ligand-binding domain of human estrogen receptor (ERT2) (Feil et al., 1997). To allow for expression from the target locus without disruption of the endogenous allele, an internal ribosome entry sequence (IRES) was placed 5’ to the start of the iCreERT2 coding sequence and the cassette was inserted into the Igfbp5 sequence after the stop codon. A Frt-flanked neo cassette was placed in the third intron upstream of the final coding exon and the entire construct was flanked by 5’ and 3’ homology arms. A diphtheria toxin cassette was included for negative selection. The construct was linearized and electroporated into C57BL/6J embryonic stem (ES) cells, subjected to G418 selection and 37 putative targets were identified by loss of native allele (LOA) qPCR screening. Six clones were confirmed by 5’ and 3’ Southern blot, and three clones with normal karyotypes were injected into albino C57BL/6J blastocysts. Chimeras were bred to C57BL/6J mice and screened for germline transmission of the targeted allele. A single clone was pursued and double confirmed by Southern blot.
RNA isolation and microarray data generation
Request a detailed protocolMandibular incisors of 140 wild-type female CD1 mice were isolated as previously described (Chavez et al., 2014), and the tissue region proximal to the first occurrence of mineralized dentin on both labial and lingual aspects of the incisor was isolated and stored in RNA-later (Ambion). The tissue level along the proximo-distal axis was readily identified on both lingual and labial aspect of the incisor with a 5.0x magnification based on the color difference between the mineralized tissues. Total RNA was isolated from individual tissue samples using Qiagen’s RNeasy kit according to the manufacturer’s instructions. To improve the total yield in the final step of the protocol, the eluate was run over the microspin column a second time. Only tissues obtained from left lower incisors were used for RNA extraction. RNA quality and quantity were assessed using a Nanodrop Spectrophotometer and a Bioanalyzer assay, and only the 94 samples with a concentration of >20 ng/µl (average of both assays) and the highest RNA-integrity scores (RIN) of >8.5 were used by the microarray facility. RNA concentrations were confirmed utilizing a ribogreen assay, hybridization to Illumina Mouse Ref 8 v2.0 gene expression BeadChips performed, and initial data analyzed in R with the SampleNetwork function (Oldham et al., 2012), which identifies outlying samples, performs data normalization, and adjusts for batch effects. After removing one outlying sample, data were quantile normalized (Bolstad et al., 2003) and technical batch effects were assessed. A highly significant batch effect associated with microarray slide was detected and corrected using the ComBat R function (Johnson et al., 2007).
Gene co-expression analysis
Request a detailed protocolGene co-expression modules were identified in R using a four-step approach as previously described (Molofsky et al., 2013; Lui et al., 2014). First, pairwise Pearson correlation coefficients (cor) were calculated for all possible pairs of microarray probes (n = 25,697) over all samples (n = 93). Second, probes were clustered using the flashClust implementation of a hierarchical clustering procedure with complete linkage and 1 – cor as a distance measure (Langfelder and Horvath, 2008). The resulting dendrogram was cut at a static height of ~0.594, corresponding to the top 1% of pairwise correlations for the entire dataset. Third, all clusters consisting of at least 15 members were identified and summarized by their module eigengene (i.e. the first principal component obtained via singular value decomposition) (Horvath and Dong, 2008; Oldham et al., 2006). Fourth, highly similar modules were merged if their Pearson correlation coefficients exceeded an arbitrary threshold (0.85). This procedure was performed iteratively such that the pair of modules with the highest correlation >0.85 was merged, followed by recalculation of all module eigengenes, followed by recalculation of all correlations, until no pairs of modules exceeded the threshold. Following these steps, 24 co-expression modules were identified. The strength of module membership (kME) for each probe on the microarray was determined by calculating the Pearson correlation between its expression pattern over all samples with each module eigengene (Horvath and Dong, 2008; Oldham et al., 2008).
Module enrichment analysis
Request a detailed protocolModule enrichment analysis with curated gene sets was performed using a one-sided Fisher’s exact test in R with gene symbol as a common identifier. Modules were defined as consisting of all unique genes that were positively and maximally correlated with a given module eigengene at a significance threshold of p<8.11×10−08. This threshold corresponds to a Bonferroni-corrected P-value of .05 / (the total number of probes X the total number of modules). Gene Ontology (GO) analysis was performed using The Database for Annotation, Visualization and Integrated Discovery (DAVID) (Dennis et al., 2003). Enriched GO terms for Biological Processes (level 5) were detected and clustered using the Functional Annotation Clustering tool with default parameters.
Histology, in situ hybridization and immunohistochemistry
Request a detailed protocolSample preparation and decalcification, hematoxylin and eosin staining, immunofluorescence staining and RNA in situ hybridization were performed as previously described (Seidel et al., 2010).
Primers for the ISH probes were designed using Primer-BLAST (http://www.ncbi.nlm.nih.gov/tools/primer-blast), and a BLAST search within the mouse genomic and transcript database was performed for each primer pair in order to ensure specificity. Primer pairs, probe sizes, as well as gene reference sequences are provided in supplementary files. cDNA from mouse incisors was used as a template for PCR amplification, and fragments of interest were cloned into pGEM-T Easy Vector Systems plasmids (Promega). DH5α cells were transformed with 1 µl of plasmid and plated on LB plates with 100 µg/ml ampicillin. Single colonies were picked for overnight amplification in liquid LB, and plasmid DNA was purified using a Plasmid Miniprep kit (Qiagen). 10 µg of plasmid were linearized using 50 u of the appropriate restriction enzyme, and probes were transcribed using SP6, T3, or T7 polymerases together with RNA-DIG labeling mix (Roche). When generating probes to examine the expression of previously identified markers in the incisor system, we noticed that all probes for Bglap1, Bglap2 and Bglap-rs1 in fact detected transcripts of all three genes, likely as the result of high sequence similarity. Therefore, we designed a probe for in situ hybridization that detects expression of all three genes simultaneously (expression restricted to the odontoblast lineage in the adult incisor). Primer sequences can be found in the Supplementary file 3.
Sections used for immunofluorescence were counterstained with DAPI (Vector Laboratories) and mounted in 1% DABCO in glycerol. Signal amplification utilizing the TSA Plus Fluorescein System (Perkin Elmer, NEL741001KT) was performed for detection of BrdU and beta-galactosidase following incubation with appropriate biotinylated secondary antibodies. A Leica-TCS SP5 confocal microscope was used for imaging except for detection of p63 in Figure 4—figure supplement 1D. In this case, a Leica DFC500 camera was used with a Leica DM 5000B microscope. For chromatogenic detection of CDKN1A and SOX21, the same sample preparation and antigen retrieval procedures were followed as for immunofluorescence detection. Overnight incubation with the primary antibody was followed by washes in phosphate-buffered saline (PBS), incubation with the appropriate secondary antibody, washes in PBS, incubation with ABC complex (VECTASTAIN Elite ABC HRP Kit, Vector Laboratories, PK6100), washes in PBS, signal detection using a DAB Peroxide substrate kit (Vector Laboratories, SK-4100) according to the manufacturer’s instructions, PBS washes and post-fixation in 4% PFA. Slides were mounted with Dako Faramount Aqueous Mounting Media (Dako, S3025). For visualization of BrdU following in situ hybridization, slides were blocked in 5% bovine serum albumin in PBS with 0.1% Tween20 following the color reaction step of the in situ hybridization procedure. Incubation with the primary antibody and subsequent steps were performed as described for detection of CDKN1A and SOX21. Images were acquired using a Leica DFC500 camera on a Leica DM5000B microscope. Information regarding primary and secondary antibodies can be found in Supplementary file 4.
Quantification of proliferating cells
Request a detailed protocolImages of BrdU and DAPI stained sagittal sections of the cervical loop regions of 3 experimental animals and 3 controls were acquired using a Leica-TCS SP5 confocal microscope. BrdU positive cells of the 5 most central sections per specimen were quantified manually using ImageJ, and a Welch two sample t-test was performed.
References
-
Gli2, but not Gli1, is required for initial shh signaling and ectopic activation of the shh pathwayDevelopment 129:4753–4761.
-
Movement of fibroblasts in the periodontal ligament of the mouse incisor is related to eruptionJournal of Dental Research 66:1006–1010.https://doi.org/10.1177/00220345870660050201
-
NK-2 class homeobox genes and pharyngeal/oral patterning: nkx2-3 is required for salivary gland and tooth morphogenesisThe International Journal of Developmental Biology 46:415–422.
-
BMI1 represses Ink4a/Arf and hox genes to regulate stem cells in the rodent incisorNature Cell Biology 15:846–852.https://doi.org/10.1038/ncb2766
-
Immunolocalization of Gla proteins (osteocalcin) in rat tooth germs: comparison between indirect immunofluorescence, peroxidase-antiperoxidase, avidin-biotin-peroxidase complex, and avidin-biotin-gold complex with silver enhancementJournal of Histochemistry & Cytochemistry 35:825–830.https://doi.org/10.1177/35.8.3298423
-
Enamel-free teeth: tbx1 deletion affects amelogenesis in rodent incisorsDevelopmental Biology 328:493–505.https://doi.org/10.1016/j.ydbio.2009.02.014
-
Isolation and culture of dental epithelial stem cells from the adult mouse incisorJournal of Visualized Experiments e51266.https://doi.org/10.3791/51266
-
Gene expression patterns of murine dentin matrix protein 1 (Dmp1) and dentin sialophosphoprotein (DSPP) suggest distinct developmental functions in vivoJournal of Bone and Mineral Research 12:2040–2049.https://doi.org/10.1359/jbmr.1997.12.12.2040
-
Regulation of cre recombinase activity by mutated estrogen receptor ligand-binding domainsBiochemical and Biophysical Research Communications 237:752–757.https://doi.org/10.1006/bbrc.1997.7124
-
Geometric interpretation of gene coexpression network analysisPLoS Computational Biology 4:e1000117.https://doi.org/10.1371/journal.pcbi.1000117
-
A comparison of enamelin and amelogenin expression in developing mouse molarsEuropean Journal of Oral Sciences 109:125–132.https://doi.org/10.1034/j.1600-0722.2001.00998.x
-
Bono1: a gene associated with regions of deposition of bone and dentineGene Expression Patterns 4:595–599.https://doi.org/10.1016/j.modgep.2004.01.013
-
Dact1-3 mRNAs exhibit distinct expression domains during tooth developmentGene Expression Patterns 10:140–143.https://doi.org/10.1016/j.gep.2010.02.002
-
Ameloblastin expression in rat incisors and human tooth germsThe International Journal of Developmental Biology 40:1141–1150.
-
Role of Islet1 in the patterning of murine dentitionDevelopment 130:4451–4460.https://doi.org/10.1242/dev.00631
-
A graphical display of large correlation matricesThe American Statistician 50:178–180.https://doi.org/10.1080/00031305.1996.10474371
-
Structure of periodontal tissues in health and diseasePeriodontology 2000 40:11–28.https://doi.org/10.1111/j.1600-0757.2005.00141.x
-
Functional organization of the transcriptome in human brainNature Neuroscience 11:1271–1282.https://doi.org/10.1038/nn.2207
-
Transcriptomics: from differential expression to coexpressionThe OMICs: Applications in Neuroscience 1:85.https://doi.org/10.1016/0045-6039(85)90309-4
-
In vivo identification of periodontal progenitor cellsJournal of Dental Research 92:709–715.https://doi.org/10.1177/0022034513493434
-
Pex mRNA is localized in developing mouse osteoblasts and odontoblastsJournal of Histochemistry & Cytochemistry 46:459–468.https://doi.org/10.1177/002215549804600405
-
Movement of entire cell populations during renewal of the rat incisor as shown by radoioautography after labeling with 3H-thymidine. the concept of a continuously differentiating cross-sectional segment. (With an appendix on the development of the periodontal ligament)American Journal of Anatomy 145:225–259.https://doi.org/10.1002/aja.1001450206
-
Spatial- and temporal-restricted pattern for amelogenin gene expression during mouse molar tooth organogenesisDevelopment 104:77–85.
-
Patterns of wnt pathway activity in the mouse incisor indicate absence of wnt/beta-catenin signaling in the epithelial stem cellsDevelopmental Dynamics : An Official Publication of the American Association of Anatomists 239:364–372.https://doi.org/10.1002/dvdy.22106
-
Differential expression of laminin-5 subunits during incisor and molar development in the mouseThe International Journal of Developmental Biology 44:337–340.
-
A general framework for weighted gene co-expression network analysisStatistical Applications in Genetics and Molecular Biology 4:1128.https://doi.org/10.2202/1544-6115.1128
Article and author information
Author details
Funding
National Institutes of Health (RL9-EB008539)
- Kerstin Seidel
National Institutes of Health (K99-DE024214)
- Kerstin Seidel
Sandler Foundation
- Michael C Oldham
National Institutes of Health (R01-DE024988)
- Ophir D Klein
National Institutes of Health (R35-DE026602)
- Ophir D Klein
The funders had no role in study design, data collection and interpretation, or the decision to submit the work for publication.
Acknowledgements
We thank Sarah Alto and Rebecca d’Urso for assistance with the mouse colony, Steven Garcia for providing mouse muscle RNA for generation of the Atp2b in situ probe, and Jeff Bush, Hua Tian, Jason Pomerantz, Amnon Sharir, Jimmy Hu, and members of the Klein and Oldham laboratories for experimental assistance and helpful discussions. This work was funded by NIH R01-DE024988 and R35-DE026602 (ODK), SysCODE interdisciplinary postdoctoral training fellowship RL9-EB008539 and K99-DE024214 (KS), and the UCSF Program for Breakthrough Biomedical Research, which is funded in part by the Sandler Foundation (MCO).
Ethics
Animal experimentation: This study was performed in strict accordance with the recommendations from the National Institutes of Health Guide for the Care and Use of Laboratory Animals and approved by the Institutional Animal Care and Use Committee at the University of California San Francisco (IACUC protocol AN099613 updated in November 2016 to AN151723).
Copyright
© 2017, Seidel et al.
This article is distributed under the terms of the Creative Commons Attribution License, which permits unrestricted use and redistribution provided that the original author and source are credited.
Metrics
-
- 2,853
- views
-
- 426
- downloads
-
- 53
- citations
Views, downloads and citations are aggregated across all versions of this paper published by eLife.
Citations by DOI
-
- 53
- citations for umbrella DOI https://doi.org/10.7554/eLife.24712
Download links
A two-part list of links to download the article, or parts of the article, in various formats.
Downloads (link to download the article as PDF)
Open citations (links to open the citations from this article in various online reference manager services)
Cite this article (links to download the citations from this article in formats compatible with various reference manager tools)
Resolving stem and progenitor cells in the adult mouse incisor through gene co-expression analysis
eLife 6:e24712.
https://doi.org/10.7554/eLife.24712


