Erythropoietin signaling regulates heme biosynthesis
- Brigham and Women’s Hospital, Harvard Medical School, United States
- Boston Children’s Hospital, Harvard Medical School, United States
- University of Georgia, United States
- University of Utah School of Medicine, United States
- Genome Center of Wisconsin, United States
- University of Wisconsin-Madison, United States
- Massachusetts Institute of Technology, United States
- Dana-Farber Cancer Institute, Harvard Medical School, United States
Figures
Figure 1
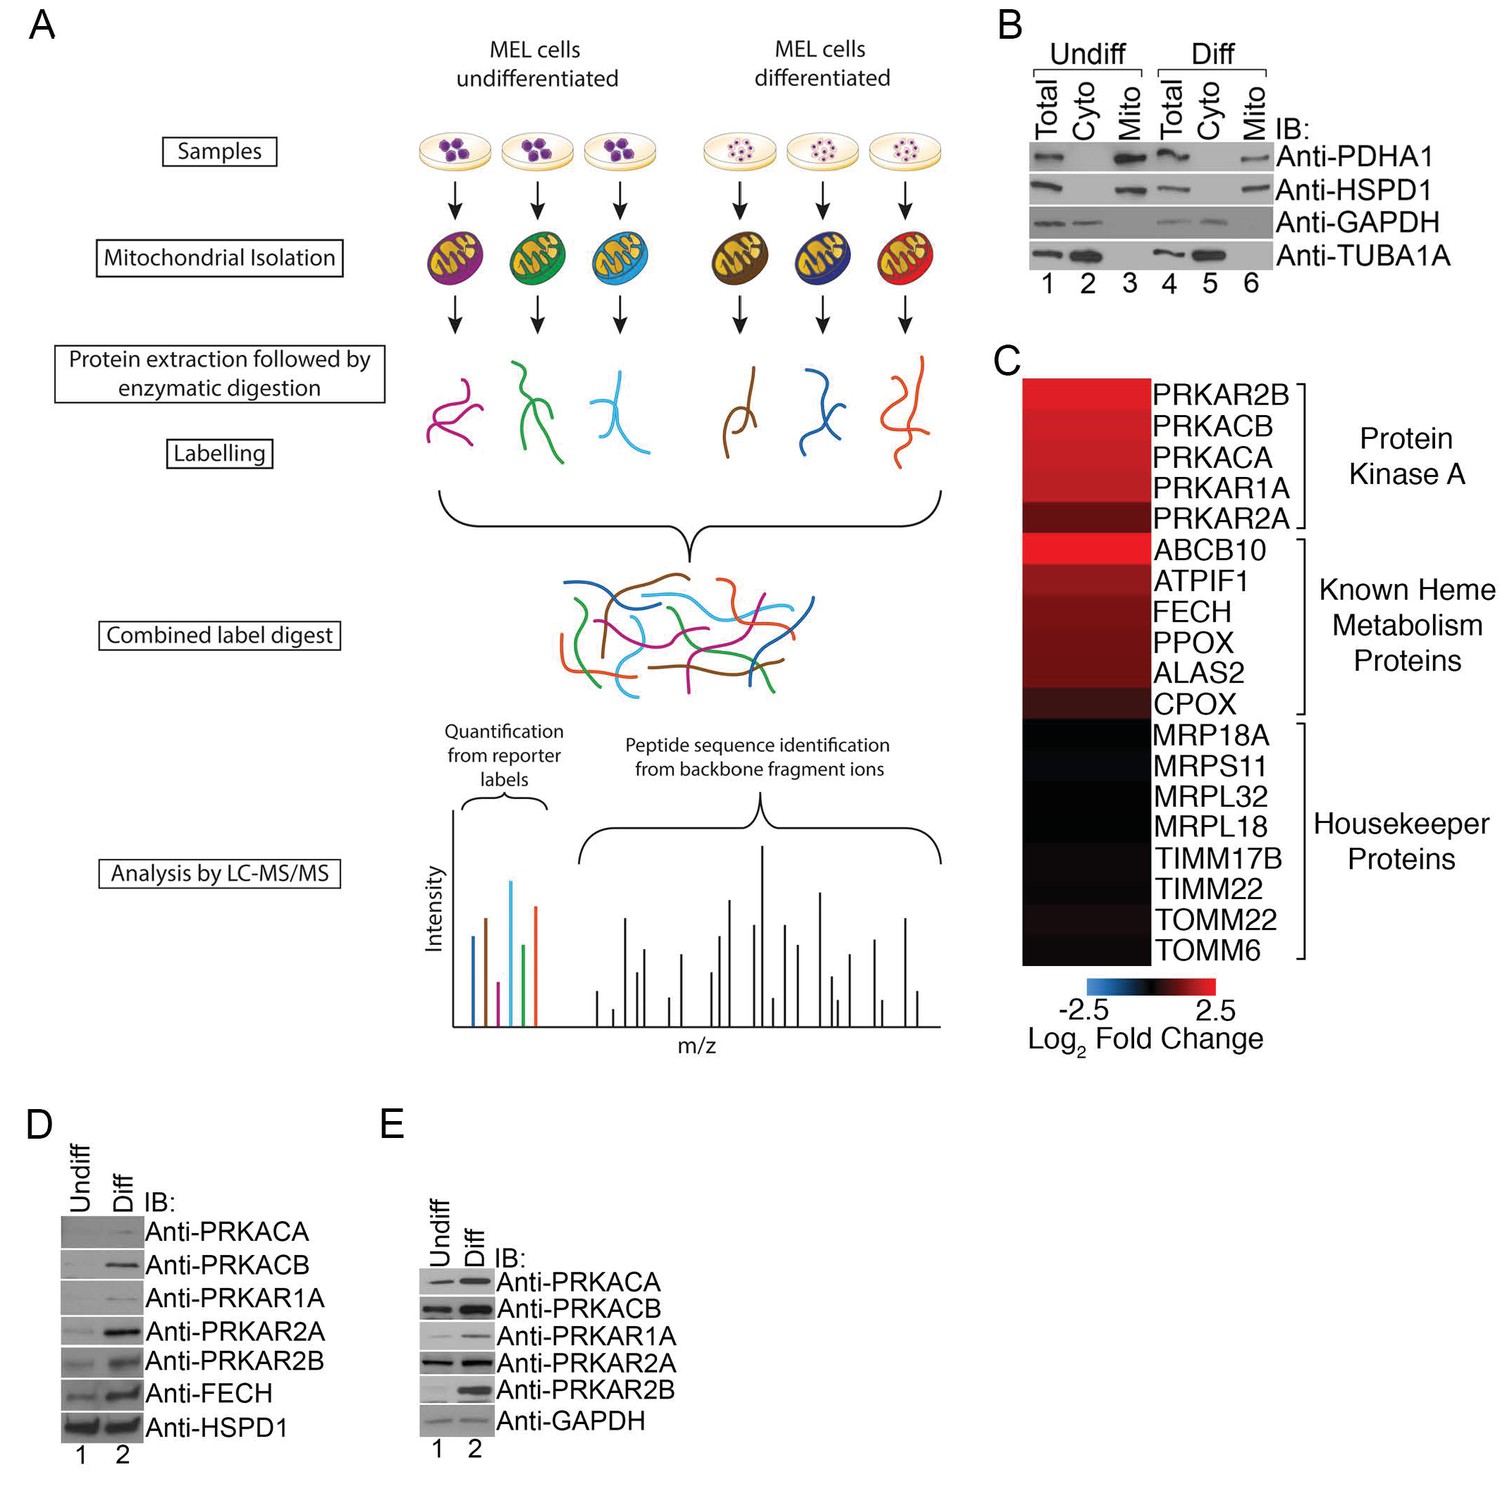
PKA activity regulates heme biosynthesis.
(A) A schema detailing the preparation of samples enriched for mitochondria from undifferentiated and differentiated MEL cells is shown. Following preparation of samples from both cohorts, the samples were trypsin digested and labeled with different tandem mass tags (TMTs), followed by mass spectrometry analysis. (B) Enrichment of undifferentiated (undiff) and differentiated (diff) mitochondrial samples was confirmed by western analysis for mitochondrial (PDHA1 and HSPD1) and cytosolic (GAPDH and TUBA1A) markers prior to mass spectrometry analysis. (C) The upregulation of PKA regulatory (PKAr) and catalytic (PKAc) subunits as well as previously identified heme metabolism proteins in mitochondria-enriched fractions of differentiated MEL cells but not several housekeeping proteins is presented in logarithmic scale. Please see Figure 1—source data 1 for precise changes. (D and E) Immunoblot analyses of the expression of PKA subunits in mitochondrial fractions (D) and whole cell lysates (E). All immunoblots were performed twice. Undiff-undifferentiated; Diff-differentiated; IB-immunoblot.
-
Figure 1—source data 1
Changes in the mitochondrial expression of selection erythroid and housekeeping mitochondrial proteins.
Changes in the expression of proteins together with their accession numbers are shown in log2 scale. These data are depicted in the heat map in Figure 1C.
- https://doi.org/10.7554/eLife.24767.004
Figure 2
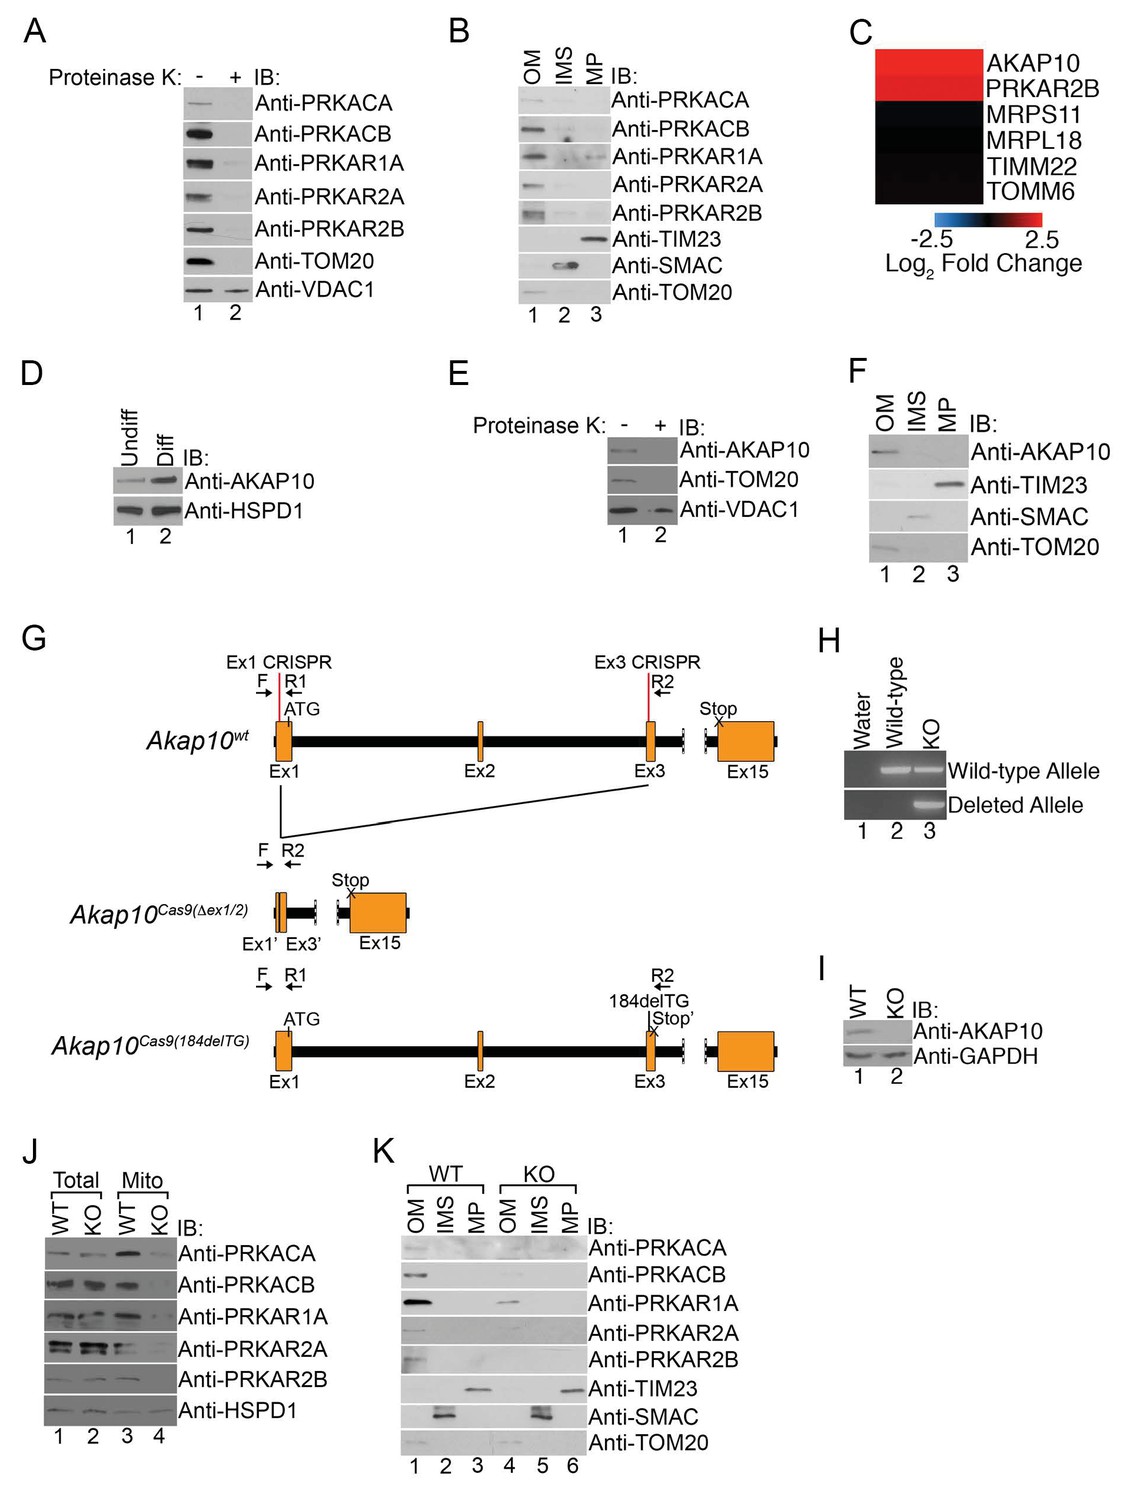
Mitochondrial PKA is localized to the outer membrane during erythropoiesis by AKAP10.
(A) Intact mitochondria isolated from maturing MEL cells (day 3) were untreated or treated with proteinase K and subsequently analyzed by immunoblotted with antibodies specific for the indicated proteins. (B) Mitochondria from day 3 maturing MEL cells were fractionated into the indicated compartments and 5 µg of protein were analyzed with immunoblotting. (C and D) A heat map demonstrating the increased mitochondrial expression of AKAP10 similar to PRKAR2B in maturing erythroid cells (C) that was confirmed using immunoblotting (D). Please see Figure 2—source data 1 for precise changes. (E and F) Proteinase K digestion assay (E) and submitochondrial fractionation (F) showed that AKAP10 is mostly localized to the OM. (G) A schematic depicting the wild-type (Akap10wt) and the two Akap10-null alleles Akap10Cas9(△ex1-2/184delTG) generated using CRISPR/Cas9 genome editing. The positions of the exon 1 (Ex1) and exon 3 (Ex3) CRISPR oligos are denoted. The introns are shown in black with exons in orange. The Akap10Cas9(ex1-2) allele has complete removal of exon 2 and truncates exons 1 and 3 to fuse exons 1’ and 3’, respectively. The Akap10Cas9(184delTG) allele has a two-nucleotide deletion in exon 3 leading to a frameshift and a premature stop codon (Stop’). Both alleles are expected to disrupt the N-terminal region encoding the mitochondrial-targeting motif. (H) The Akap10Cas9(△ex1-2) deleted allele can only be detected when genotyping was performed with primers F and R2 while the Akap10Cas9(184delTG) allele can still be detected with primers F and R1, resembling wild-type. These results were sequence confirmed. (I) Immunoblot analysis showing that neither allele gave rise to any detectable AKAP10 protein. (J and K) Loss of AKAP10 had no effect on total PKA subunit expression but reduced the amount of PKA subunits in whole mitochondria (J) as well as the OM fraction (K). All immunoblots were performed twice. Undiff-undifferentiated; Diff-differentiated; OM-outer membrane; IMS-intermembrane space; MP-mitoplast; WT-wild-type; KO-knockout; IB-immunoblot.
-
Figure 2—source data 1
Change in the mitochondrial expression of AKAP10 during erythroid maturation.
The increase in AKAP10 (NP_064305) mitochondrial expression is listed in log2 scale. These data are depicted in the heat map in Figure 2C. PRKAR2B and other controls were as previously shown in Figure 1C and Figure 1—source data 1.
- https://doi.org/10.7554/eLife.24767.006
Figure 3 with 1 supplement
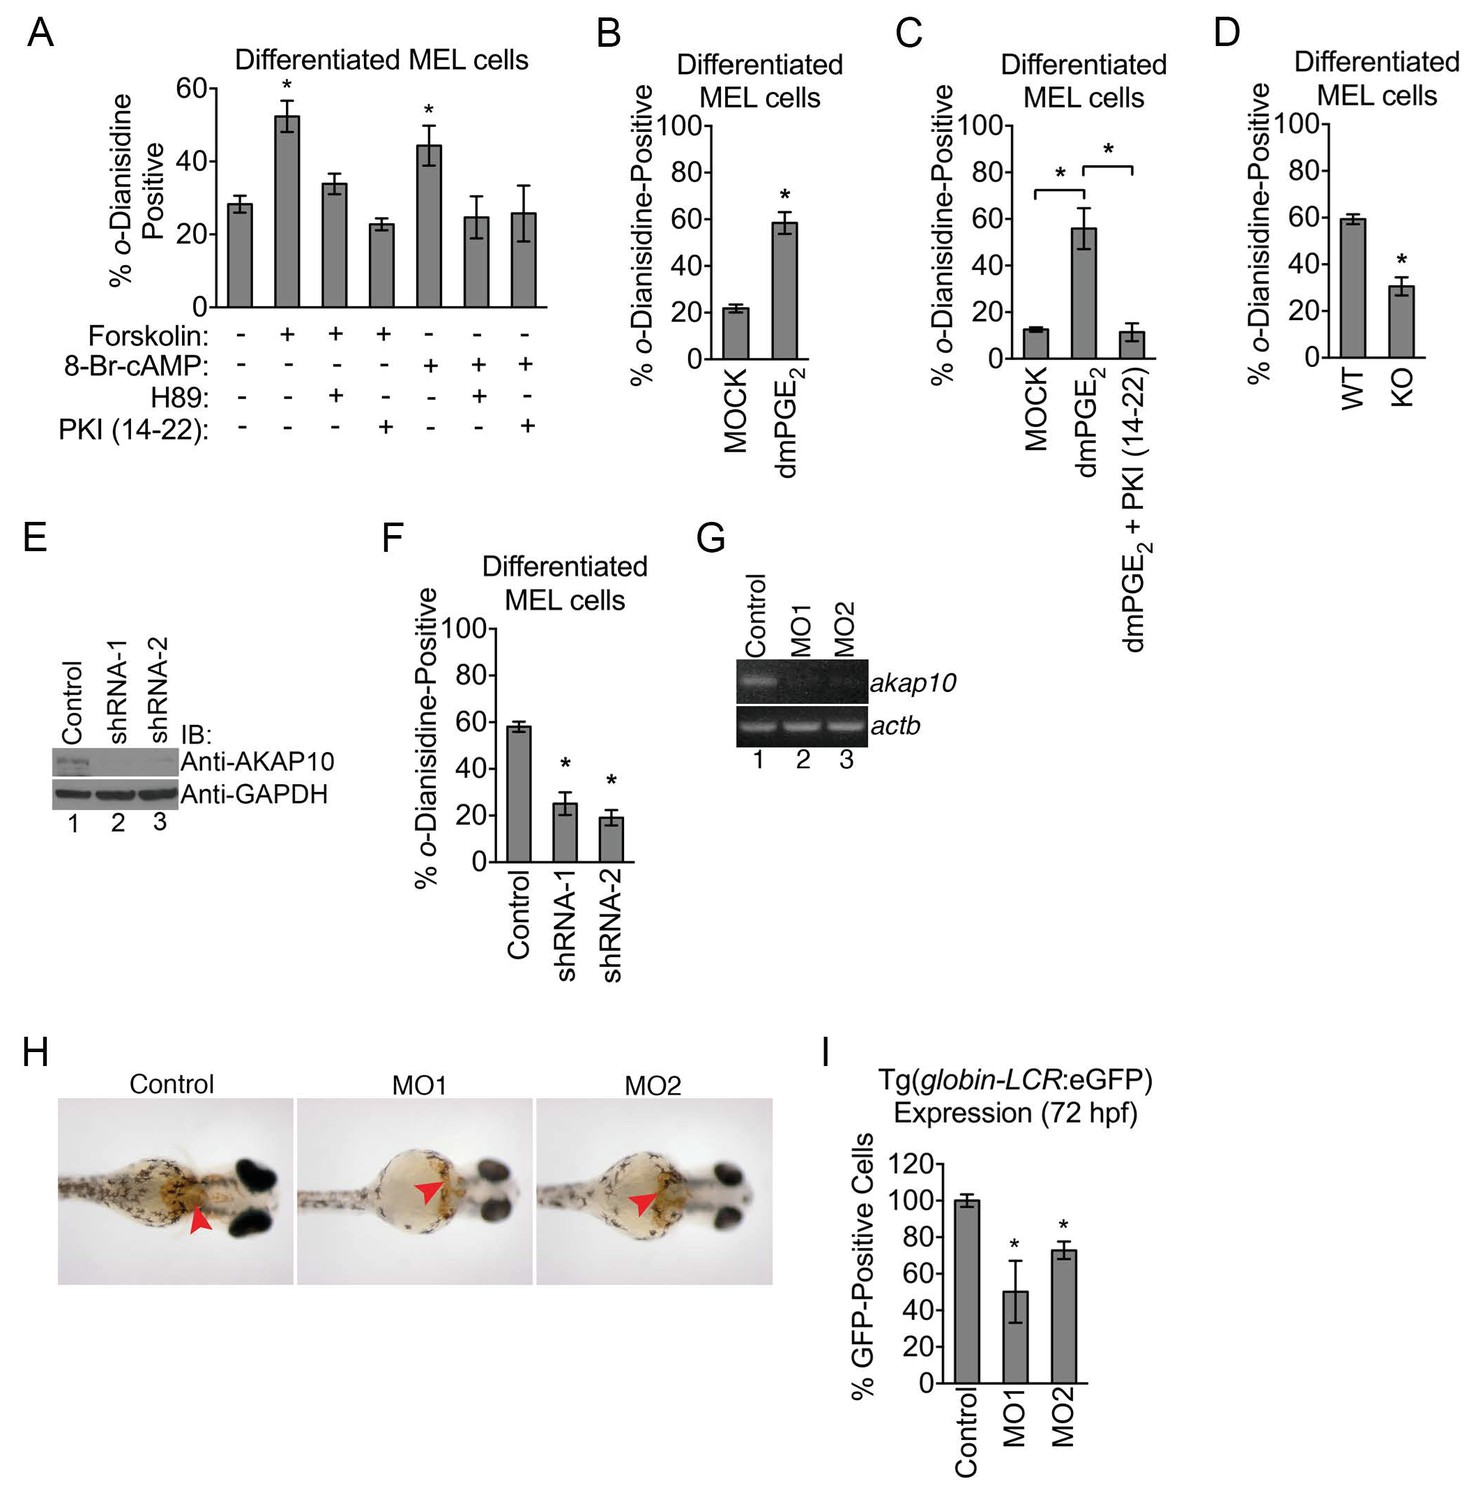
Mitochondrial outer membrane PKA signaling is required for erythropoiesis.
(A–C) o-dianisidine staining for hemoglobinized MEL cells treated with several pharmacologic modulators of PKA activity. (A) PKA activation with 8-Br-cAMP or high-dose forskolin (50 µM) triggers an increase in heme production that is blocked by H89 or PKI (14-22) treatment at day 3 of DMSO induction. (B and C) A similar increase in hemoglobinization was observed with dMPGE2 that was also inhibited by PKI (14-22). (D) Wild-type (WT) or AKAP10-knockout (KO) erythroid cells at day 4 of differentiation were stained with o-dianisidine. (E and F) AKAP10 expression was knocked-down using two different shRNAs (E) that lead to reduced hemoglobinization (F). (G–I) akap10-specific morpholinos (MOs) were used to inhibit akap10 expression in zebrafish embryos (G). These morphants were anemic with reduced hemoglobinization (H) and red blood cell counts (I). *p-value<0.05, Mean ± SEM, n = 3. All immunoblots were performed twice. 8-Br-cAMP-8-bromoadenosine 3’,5’-cyclic monophosphate; dmPGE2-dimethyl-prostaglandin E2; WT-wild-type; KO-knockout; shRNA-short hairpin RNA; MO-morpholino; IB-immunoblot.
Figure 3—figure supplement 1
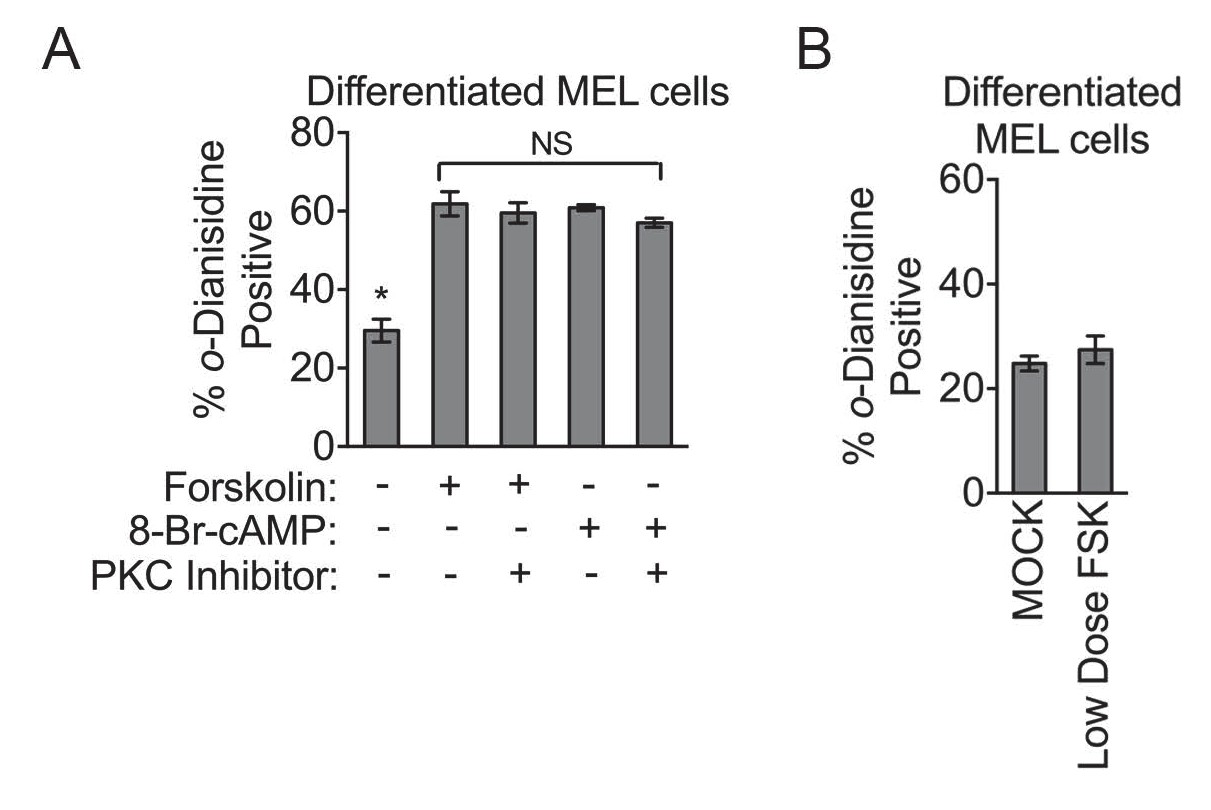
PKA activity regulates heme biosynthesis.
(A) Treatment of differentiating MEL cells with 30 nM of the PKC inhibitor, bis-indolylmaleimide II, had no inhibitory effect on PKA activators. (B) MEL cells treated with low-dose forskolin (10 µM) has no significant effect on hemoglobinization as shown by o-dianisidine staining. Mean ± SEM, n = 3.
Figure 4 with 1 supplement
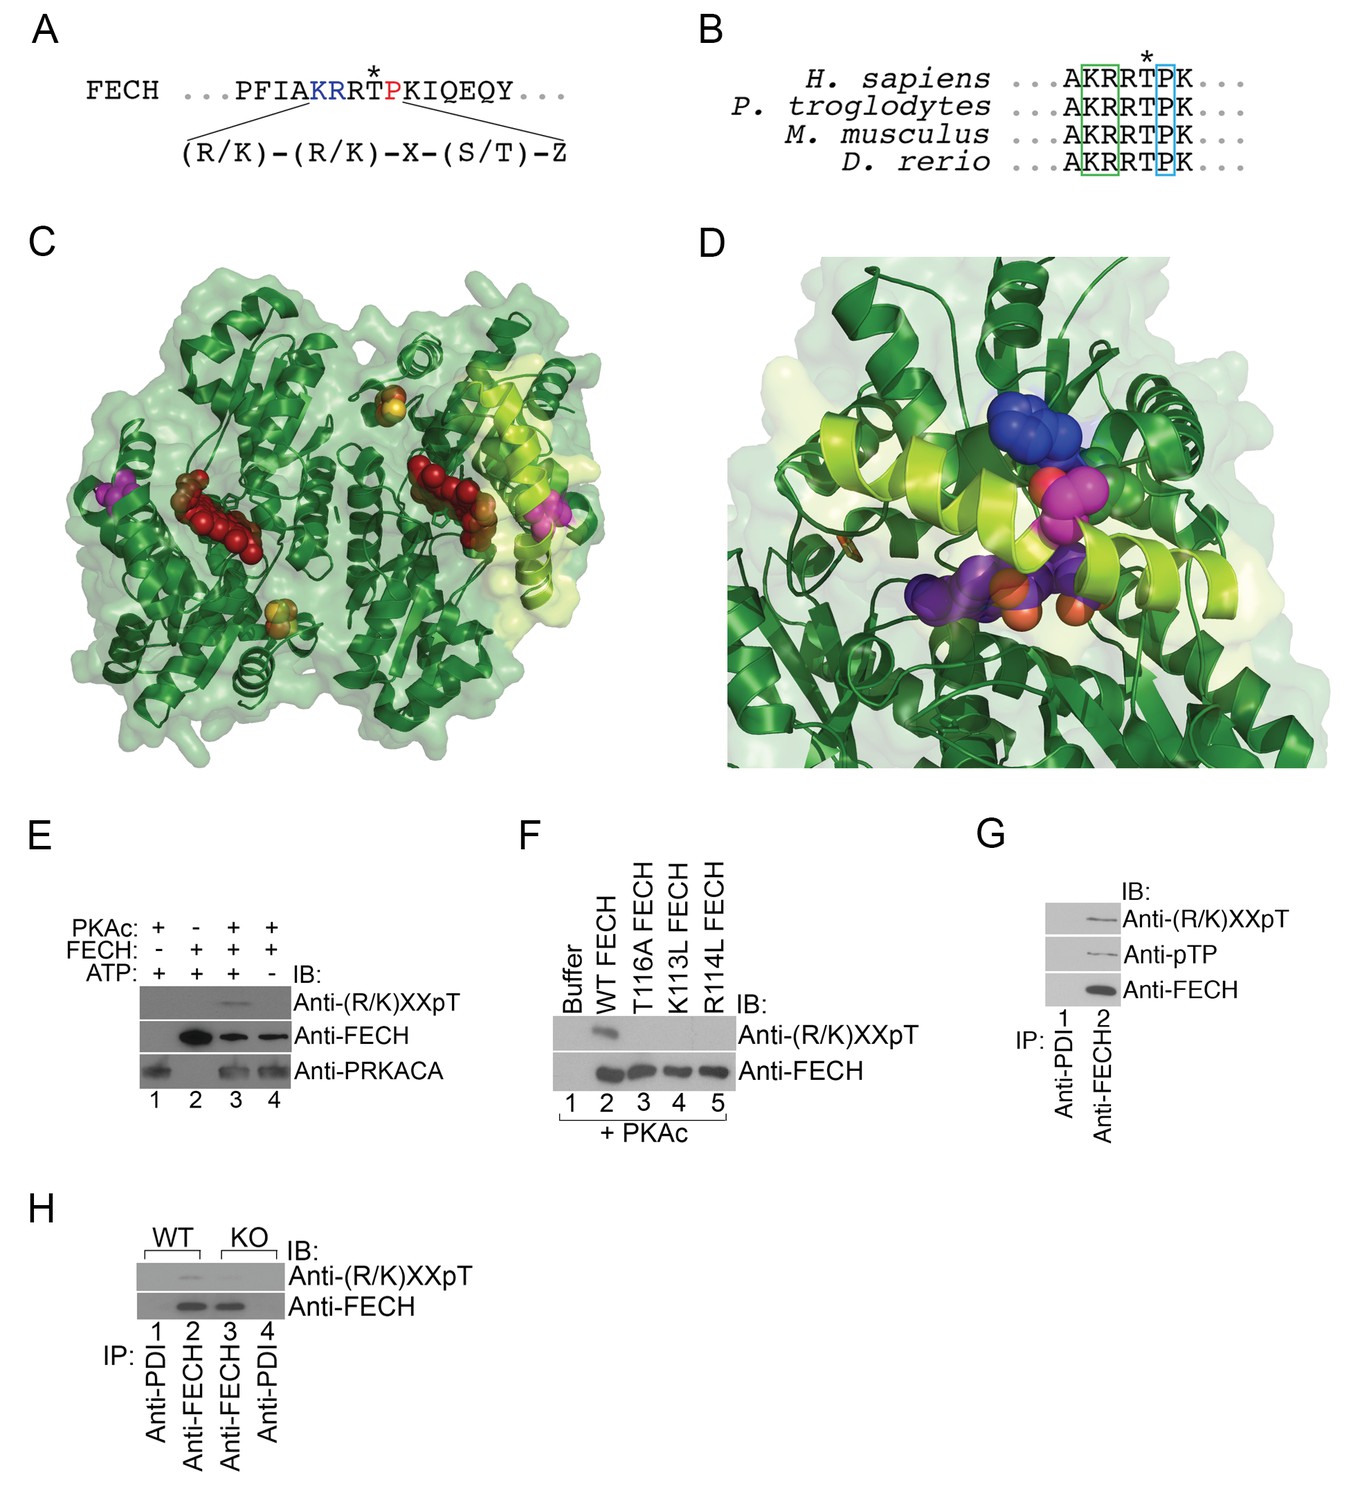
FECH is directly phosphorylated by PKA.
(A) The motif surrounding Thr116 in human FECH constitutes a PKA phosphorylation site with a canonical Lys (K) and Arg (R) at positions −3 and −2, respectively, and an uncharged residue at the +1 position. (B) This PKA phosphorylation motif is highly conserved in FECH proteins across vertebrate species. (C) The FECH homodimer is shown with the transparent surface in green and the subunits in solid green ribbon. PPIX is shown as a red space filling model, the [2Fe-2S] clusters as solid rust and yellow balls, and the highlighted Thr116 (site of PKA-mediated phosphorylation) shown as solid violet spheres. The α-helix in which Thr116 resides, highlighted with lemon green, forms one lip of the opening to the active site where porphyrin is bound in this structure (PDB 2QD1). (D) The structure surrounding Thr116 (shown in fuchsia), which is situated in the middle of a long α-helix, is enlarged. Thr116 is in close proximity and hydrogen bonded to His86 (dark blue) and adjacent to Val85 (dark green). The Thr116-containing α-helix is highlighted with lemon green and the protoporphyrin behind in the active site is purple. Structural modeling suggests that phosphorylation of Thr116 would result in a shift of the Thr116-containing α-helix away from the His86-containing α-helix. (E) Purified recombinant His-tagged human FECH was phosphorylated by purified PKAc only in the presence of ATP at a 1:1 ratio. The phosphorylated form of FECH was detected by immunoblotting with an anti-phosphothreonine antibody. (F) An in vitro kinase assay was also performed with wild-type and variant forms of purified His-tagged human FECH. Disruption of the lysine or arginine at the −3 and −2 positions, respectively, similarly abolishes phosphorylation in vitro as a T116A mutation as shown by immunoblotting. (G) Differentiated MEL cells were immunoprecipitated with the indicated antibodies and immunoblotting analysis was performed. Immunoprecipitated FECH can be recognized by two different anti-phosphothreonine antibodies directed against the upstream positive residues and the proline immediately following the threonine. (H) Wild-type (WT) or AKAP10-KO (KO) were lysed and immunoprecipitated with the indicated antibodies. Bound proteins were analyzed by immunoblotting. All immunoblots were performed twice. ATP-adenosine triphosphate; PPIX-protoporphyrin IX; IB-immunoblot; IP-immunoprecipitate.
Figure 4—figure supplement 1
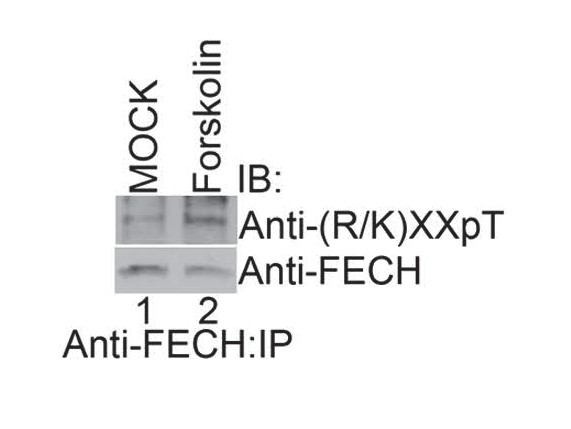
Activation of PKA with high-dose forskolin increases FECH phosphorylation.
Differentiated MEL cells treated with a high-dose of forskolin (50 µM) were lysed, immunoprecipitated with the indicated antibodies, and subjected to western analysis. High-dose forskolin increased FECH phosphorylation. This is a representative blot from two independent experiments. IB-immunoblot; IP-immunoprecipitate.
Figure 5 with 1 supplement
Phosphorylation of FECH is required for its full activity.
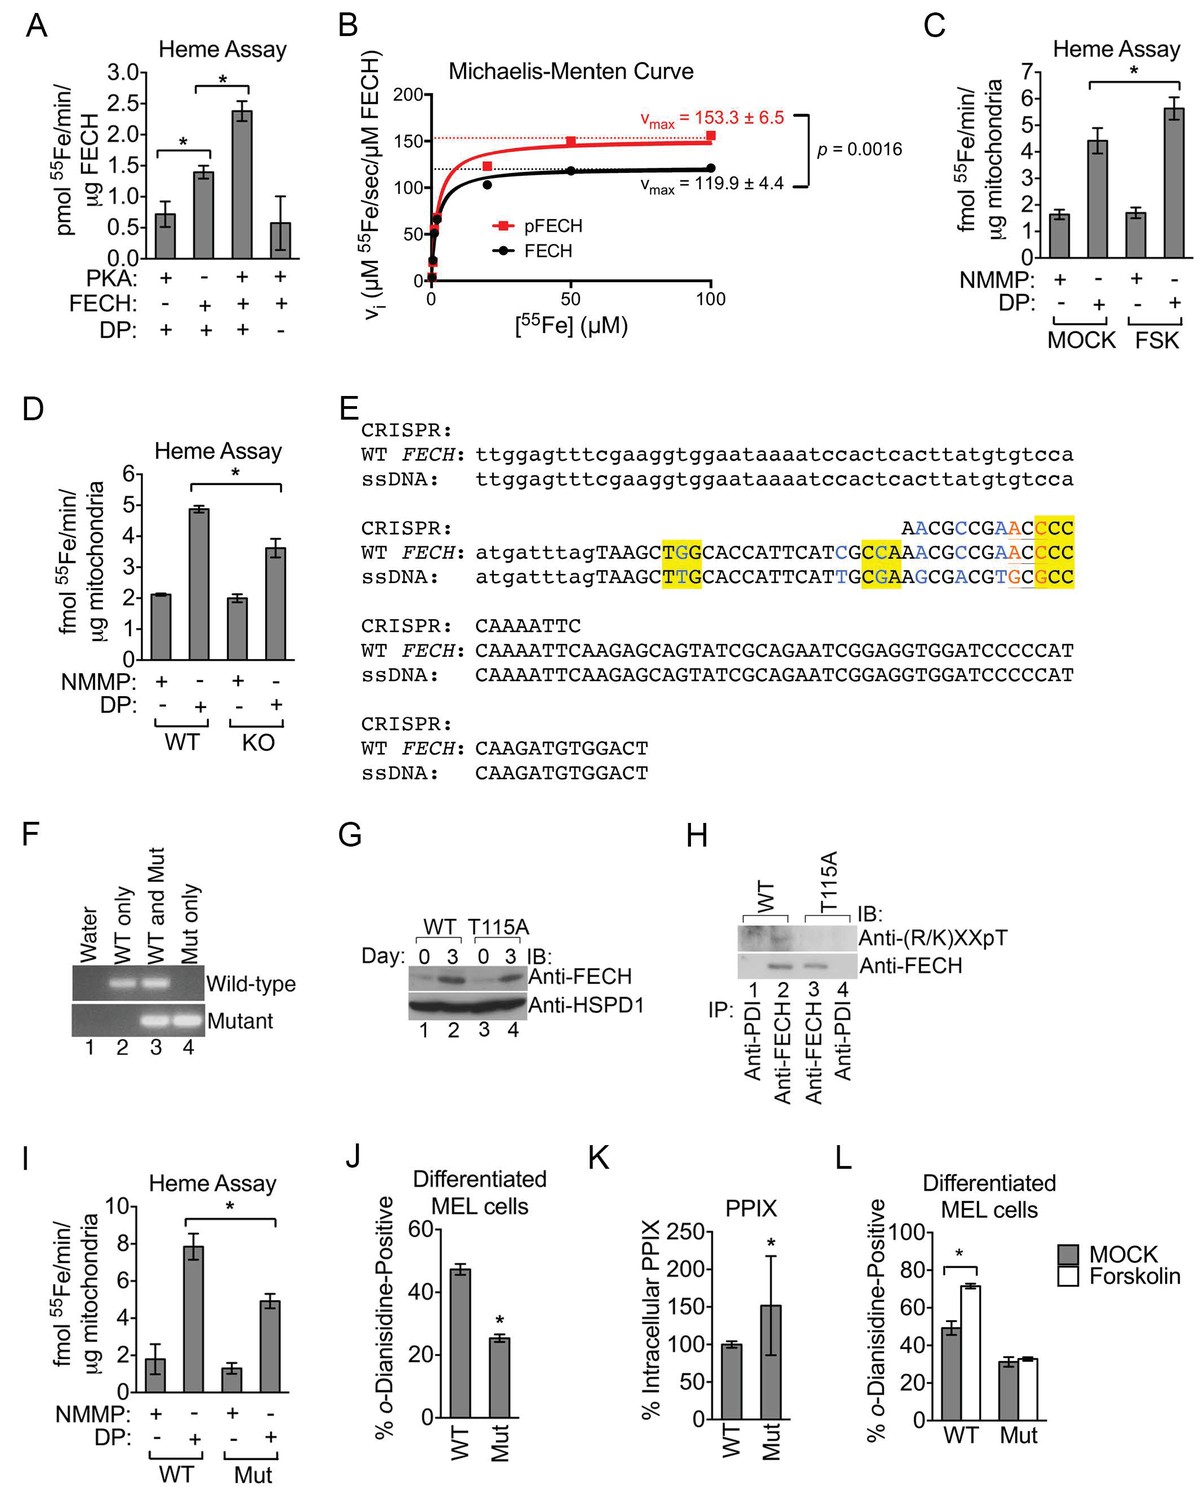
(A) Single-point FECH activity was determined in vitro by measuring the amount of 55Fe incorporation into the protoporphyrin IX analog, deuteroporphyrin (DP). FECH has basal activity that is significantly increased by PKA-mediated phosphorylation. This increase in activity was dependent upon both DP and ATP, highlighting the substrate specificity of the assay for DP and the dependence on phosphorylation. (B) Kinetic analyses were subsequently performed with 0.1 µM FECH, 3 µM DP, and 0.2–100 µM 55FeCl3 at 25°C. Phosphorylation of FECH leads to a statistically significant increase in maximum velocity (vmax). There was no significant difference in the Km. Please see Figure 5—source data 1 for vmax and Km values. (C and D) FECH activity was measured in isolated intact mitochondria. Samples from high-dose forskolin (FSK)-treated differentiating MEL cells have higher FECH activity (C) (*p-value<0.05, Mean ± SEM, n = 5). In contrast, AKAP10-KO mitochondria had less FECH activity (D). Very little activity was detected in samples in which DP was substituted with NMMP. (E) A schematic showing the intron 3 and exon 4 sequences of wild-type murine Fech as well as the CRISPR oligo and the single-stranded DNA (ssDNA) that were introduced as a template for DNA repair. Intronic and exonic sequences are shown in lower and upper cases, respectively. Highlighted in yellow are the three PAM (protospacer adjacent motif) sequences closest to the T115A mutation site that facilitates the potential use of multiple CRISPR oligos. The missense mutations necessary to generate the T115A substitution are in orange. Shown in blue are synonymous substitutions designed to either disrupt the PAM sequences to prevent cleavage of the newly introduced mutant allele or to facilitate genotyping using allele-specific primers near the T115A mutation site. (F) Genomic DNA was isolated from the individual clones of MEL cells and used for PCR analysis with allele-specific primers. The parental MEL cells only had the wild-type allele. The intron 3 and exon 4 sequences of these cells were sequenced to confirm these agarose gel electrophoresis results. (G) Undifferentiated and differentiated parental and mutant cells expressing only the FECHT115A allele were lysed and subjected to western analysis to examine the induction of FECH protein during erythroid maturation. FECHThr115Ala protein had very similar up regulation with differentiation. (H) Differentiated MEL cells were lysed, immunoprecipitated with the indicated antibodies, and bound proteins were subjected to western analysis. Cells expressing only mutant FECH were phosphorylation defective at Thr115. (I–K) Mitochondria isolated from differentiated MEL cells expressing only endogenous FECHT115A (Mut), generated by genome editing, has lower FECH activity than wild-type (WT) control (I). These cells expressing non-phosphorylated FECH also have reduced hemoglobinization by o-dianisidine staining (J) and increased accumulation of PPIX substrate (K) as demonstrated by HPLC analysis (*p-value<0.05, Mean ± SEM, n = 11). (L) Wild-type or mutant differentiated MEL cells treated with vehicle (MOCK) or FSK were stained with o-dianisidine. Cells expressing mutant FECH were refractory to the effects of FSK. *p-value<0.05, Mean ± SEM, n = 3, unless otherwise specified. All immunoblots were performed twice. IB-immunoblot; vi-initial velocity; Km-Michaelis-Menten constant; FSK-forskolin; NMMP:N-methyl-mesoporphyrin-IX.
-
Figure 5—source data 1
Maximum velocity (vmax) and Michaelis-Menten (Km) constants.
The vmax and Km constants for unphosphorylated and in vitro phosphorylated FECH are shown. The data here are graphically presented in Figure 5B and Figure 5—figure supplement 1. *p-value<0.05, **non-significant, Mean ± SEM, n = 3.
- https://doi.org/10.7554/eLife.24767.012
Figure 5—figure supplement 1
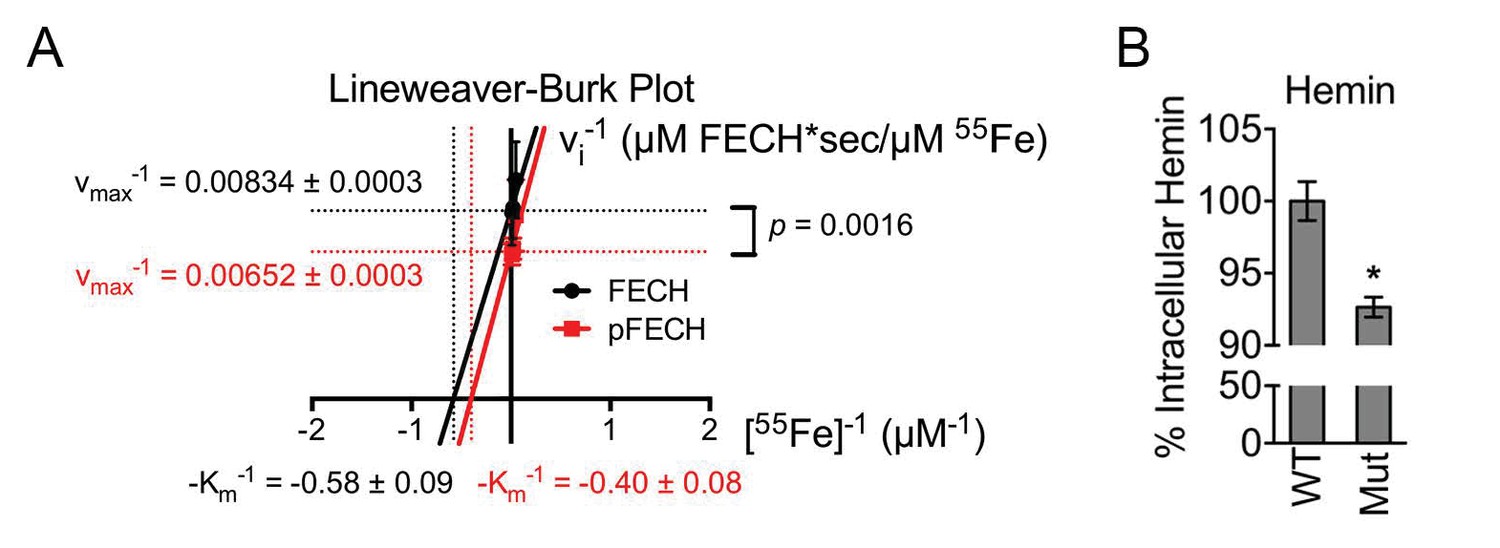
Phosphorylation is required for full FECH activity.
(A) A Lineweaver-Burk plot showing changes in the vmax−1 and Km−1 when FECH is phosphorylated in vitro. Phosphorylation of FECH leads to a statistically significant increase in maximum velocity (vmax). There was no significant difference in the Km. Please see Figure 5—source data 1 for vmax and Km values. (B) HPLC analysis of differentiated wild-type or variant FECH expressing cells showed lower levels of hemin accumulation in cells expressing only phosphorylation defective FECH. *p-value<0.05, Mean ± SEM, n = 12.
Figure 6
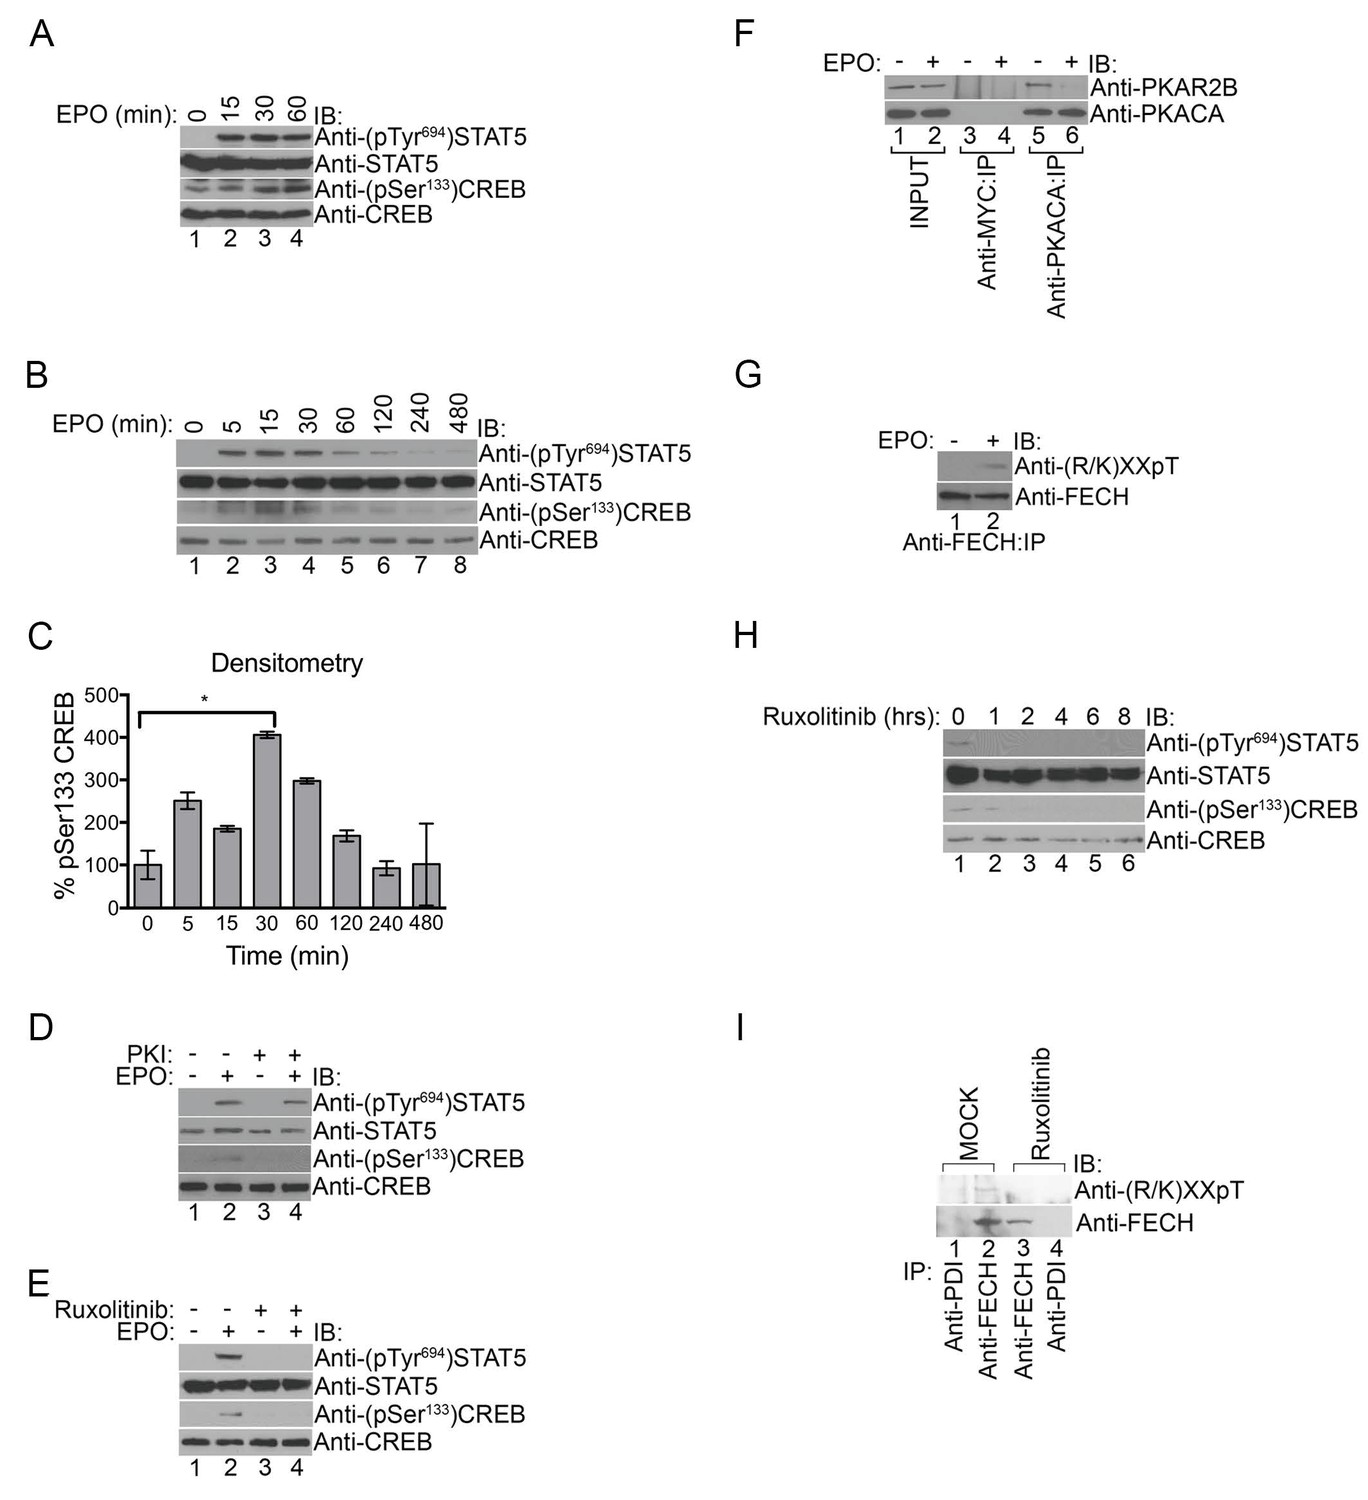
PKA links EPO signaling with heme production during erythropoiesis.
(A) Primary murine erythroblasts were cultured from the E13.5 fetal liver, starved for 2 hr and treated with EPO (50 U/mL) for the indicated times. Western analysis showed that EPO triggered increased phosphorylation of STAT5Tyr694 and CREBSer133, indicating increased JAK2 and PKA activity, respectively. (B and C) Human UT7 erythroid cells were serum-starved overnight, treated with EPO (2 U/mL) for the indicated times, and subjected to immunoblot analysis. EPO treatment increased both STAT5Tyr694 and CREBSer133 phosphorylations similar to (A). A representative blot is shown in (B) and densitometry quantification from three independent experiments (n = 3) where the phospho-CREB signal is normalized to total CREB signal is shown in (C). Time points within the first 60 min were significantly different than time 0. (D and E) UT7 cells were treated with the indicated compounds, and immunoblot analysis was performed. CREBSer133 phosphorylation can be blocked by both the PKA inhibitor, 14–22, (D) and the JAK2 inhibitor, Ruxolitinib (E). In contrast, 14–22 had no effect on STAT5 phosphorylation (D). (F) UT7 cells untreated or treated with EPO were lysed and immunoprecipitated with the indicated antibodies. Western analysis showed that EPO stimulation resulted in dissociation of PKAc from PKAr. (G) Following PHZ treatment, primary erythroblasts were harvested from the adult murine spleen, starved for 2 hr, and stimulated with EPO (50 U/mL) for 30 min. Lysates were immunoprecipitated and subjected to immunoblot analysis that showed increased FECH phosphorylation with EPO-mediated activation. (H and I) HEL cells induced to hemoglobinize by L-ALA supplementation were treated with Ruxolitinib for 2 hr. Western blot analysis demonstrated reduced CREBSer133 phosphorylation (H) and FECH phosphorylation (I) with inhibition of the constitutively active JAK2 mutant. All immunoblots were performed twice unless otherwise specified. *p-value<0.05, Mean ± SEM, n = 3. IB-immunoblot; IP-immunoprecipitate; EPO-erythropoietin; PHZ-phenylhydrazine;HEL-human erythroleukemia; L-ALA--δ-aminolevulinic acid.
Figure 7
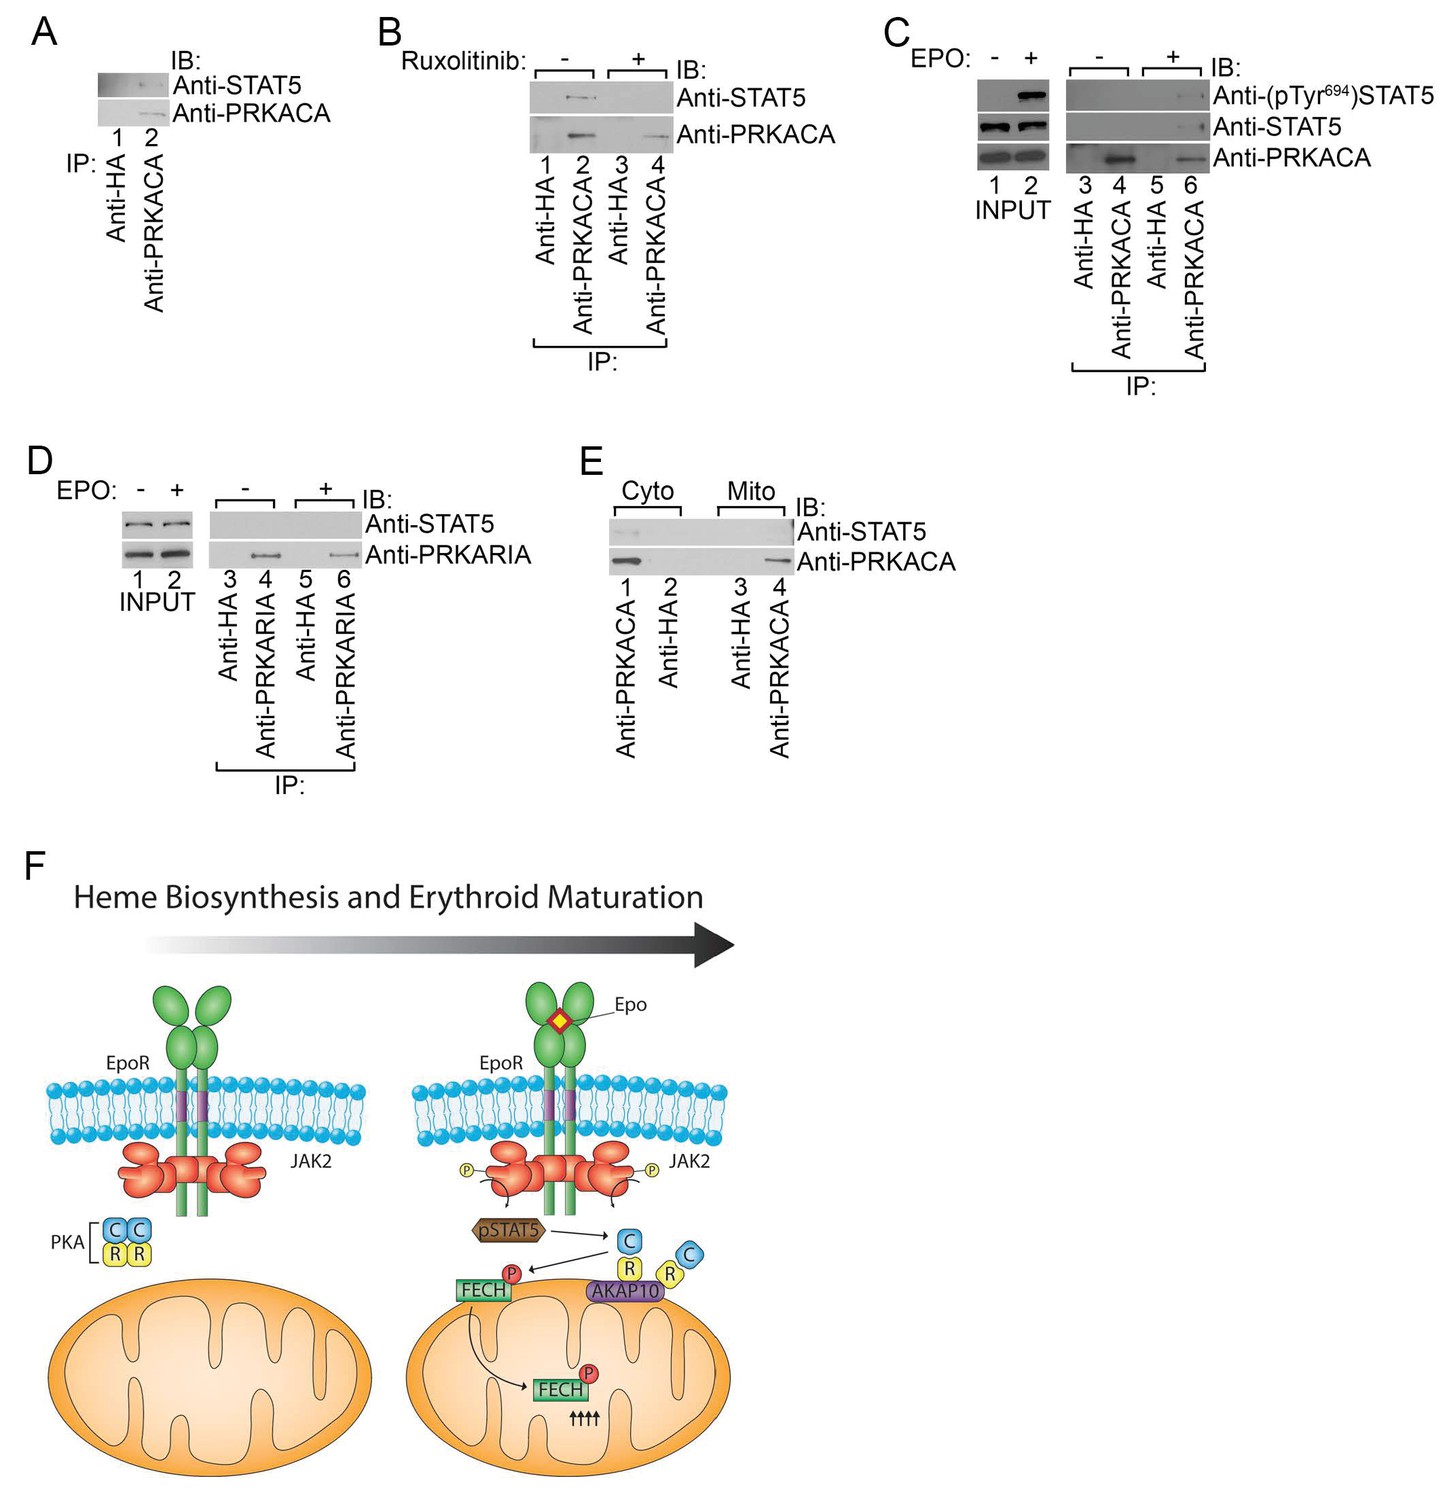
Phosphorylated STAT5 forms a molecular complex with mitochondrial PKAc.
(A) HEL cells were lysed and immunoprecipitated with the indicated antibodies and subjected to immunoblot analysis. (B) HEL cells treated with MOCK or Ruxolitinib for 2 hr were subjected to similar analysis as (A). (C and D) UT7 cells starved overnight and treated with MOCK or EPO for 10 min were lysed and immunoprecipitated with the indicated antibodies. Immunoblot analysis was performed with the indicated antibodies. (E) Cytosolic and mitochondrial extracts were isolated from HEL cells and immunoprecipitated with the indicated antibodies. Bound proteins were resolved on SDS-PAGE and analyzed by immunoblotting with the indicated antibodies. (F) Model of how, during erythropoiesis, EPO signaling activates PKA at the mitochondrial OM that is localized by the GATA1-target, AKAP10. PKA phosphorylates FECH, which is required to achieve full FECH activity necessary to accommodate the vast heme demand for hemoglobin assembly. All immunoblots were performed twice. IB-immunoblot; IP-immunoprecipitate.
Author response image 1
Download links
A two-part list of links to download the article, or parts of the article, in various formats.
Downloads (link to download the article as PDF)
Open citations (links to open the citations from this article in various online reference manager services)
Cite this article (links to download the citations from this article in formats compatible with various reference manager tools)
Erythropoietin signaling regulates heme biosynthesis
eLife 6:e24767.
https://doi.org/10.7554/eLife.24767


