The genomic landscape of human cellular circadian variation points to a novel role for the signalosome
- University of Zurich, Switzerland
- University of Geneva, Switzerland
- Laboratory of Chronobiology, Germany
- University of Lausanne, Switzerland
- Institute of Physiology, Charité-Universitätsmedizin Berlin, Working Group Sleep Research & Clinical Chronobiology, Germany
Figures
Figure 1 with 3 supplements

eQTLs influencing circadian function.
(a) Manhattan plot of identified polymorphisms for all measured traits. Blue line, threshold for suggestive candidates, p<10−5, approx. FDR ≤ 0.1. Genes likely associated with the most significant alleles are shown in red. (b) For all SNPs at the indicated p-value (x-axis), Tukey Boxplot of the distribution of difference in allele frequency between self-declared ‘larks’ and ‘owls’ (y-axis, absolute value of (frequency in larks – frequency in owls); x-axis, p-value threshold used for the test; number of alleles at each stringency indicated underneath). (c) Equivalent chart for Tag-SNPs only, that is one SNP per hapblock. See also Figure 1—figure supplement 1 for distributions and Manhattan plots for individual traits; see Figure 1—figure supplement 2 for quantile-quantile plots associated with each Manhattan plot; see Figure 1—figure supplement 3 for density plots of allele frequency distributions in extreme chronotypes. Figure 1—source data 1 lists all alleles identified with p<10−5 for each trait, as well as the closest gene.
-
Figure 1—source data 1
SNPs associated with (a) PER1 and (b) PER2 expression, (c) Amplitude, (d) Phase, and (e) Period.
The closest annotated gene is indicated for each SNP, as well as the unadjusted GWAS p-value.
- https://doi.org/10.7554/eLife.24994.006
Figure 1—figure supplement 1
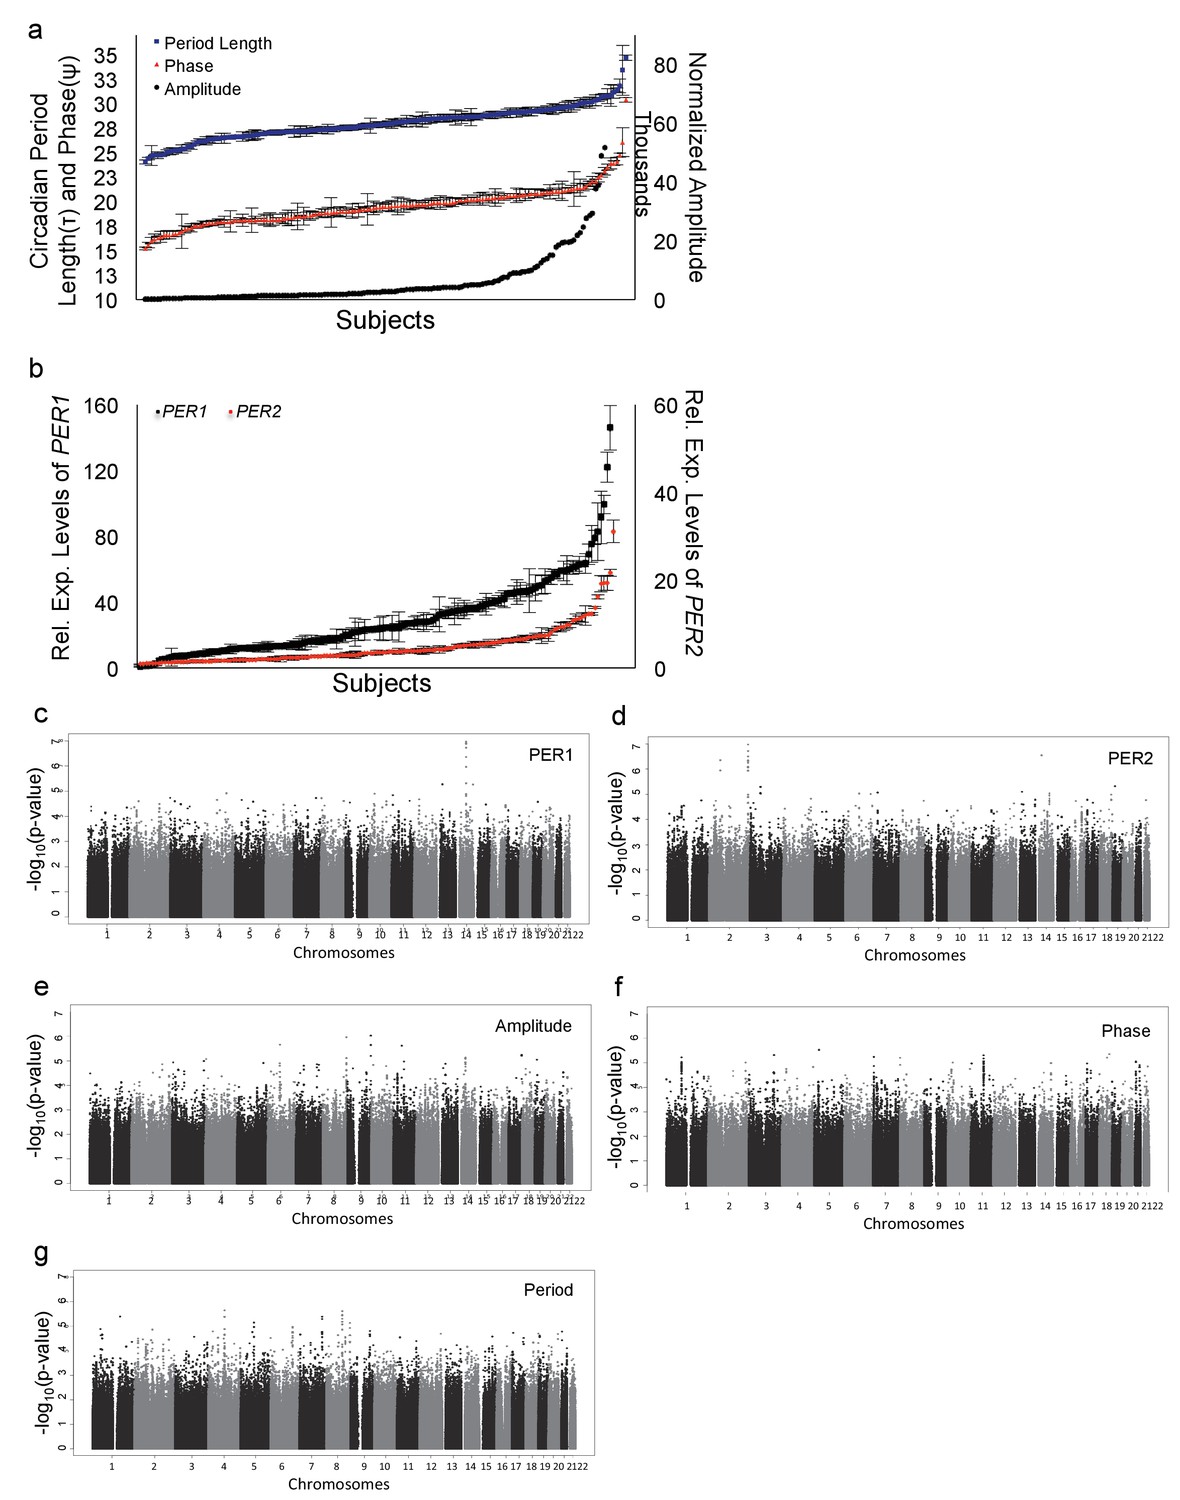
Umbilical cord fibroblasts from different individuals show large variations in circadian parameters.
(a) Circadian period length (blue), circadian phase (red) and circadian amplitude (black) measured in 159 umbilical cord fibroblast lines of the Genecord II library. Left y-axis, circadian period length and phase in hours; Right y-axis, circadian amplitude. Average ± standard error from four replicates in three separate measurements. (b) Peak expression levels of PER1 (black) and PER2 (red) in the same fibroblasts. Average ±standard error from four measured replicates for each subject, relative to lowest expression detected. (c–g) Individual Manhattan plots showing polymorphisms at different confidence levels for each measured clock parameter used as a quantitative trait for genome-wide analysis.
Figure 1—figure supplement 2
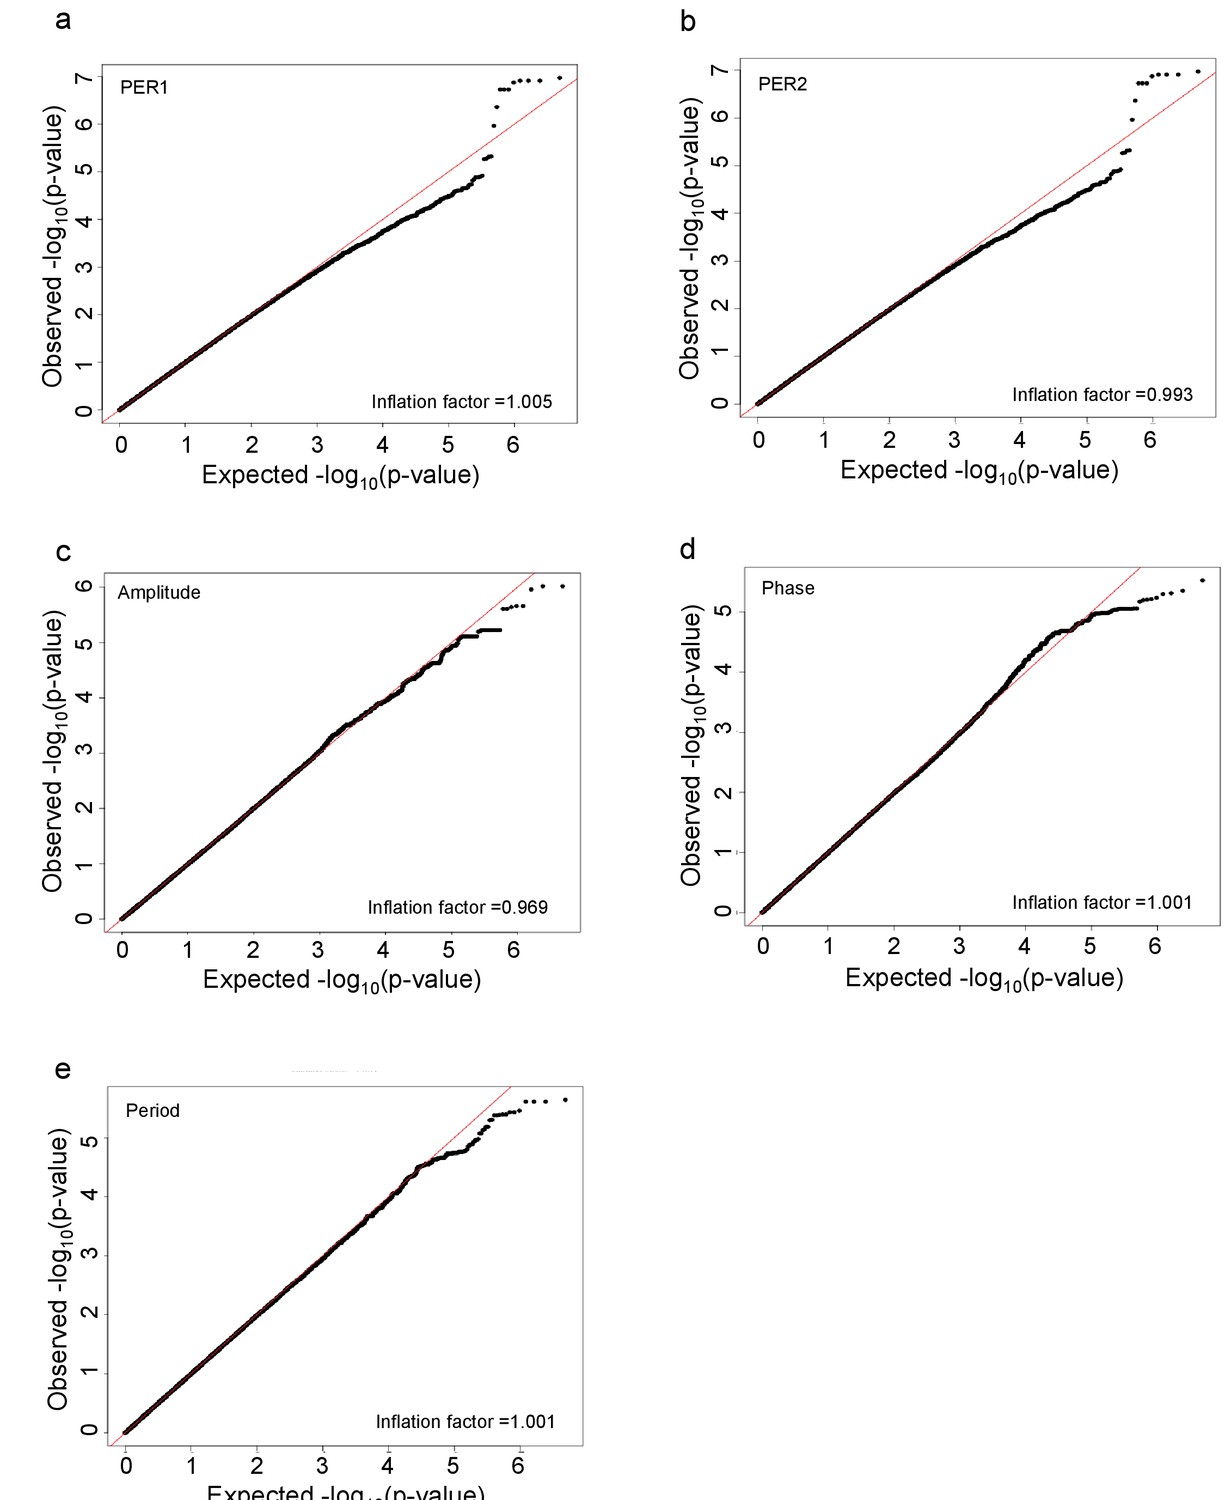
Quantile-quantile plots for GWAS of each clock parameter.
https://doi.org/10.7554/eLife.24994.004
Figure 1—figure supplement 3
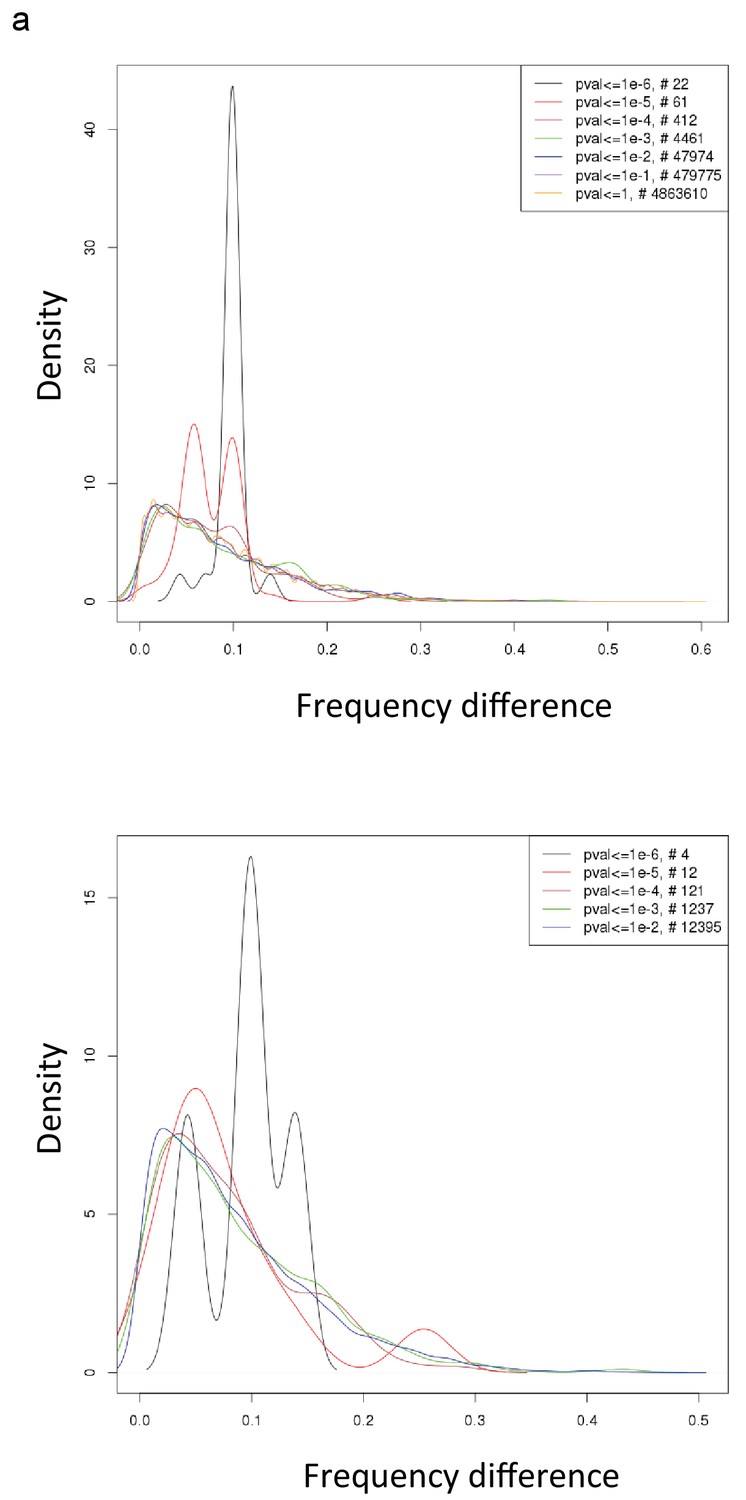
‘Larks’ and ‘owls’ show skewed distribution of GWAS-positive alleles.
(a) For all SNPs at the p-value indicated in the legend, the relative density distribution of differences in GWAS-positive allele frequency between self-declared ‘larks’ and ‘owls’. Y-axis, density in arbitrary units; X-axis, distribution of difference in allele frequency between self-declared ‘larks’ and ‘owls’ (absolute value of (frequency in larks – frequency in owls)) (b) Equivalent chart for Tag-SNPs only. These data represent the same data as in Figure 1b and c, plotted differently.
Figure 2 with 1 supplement
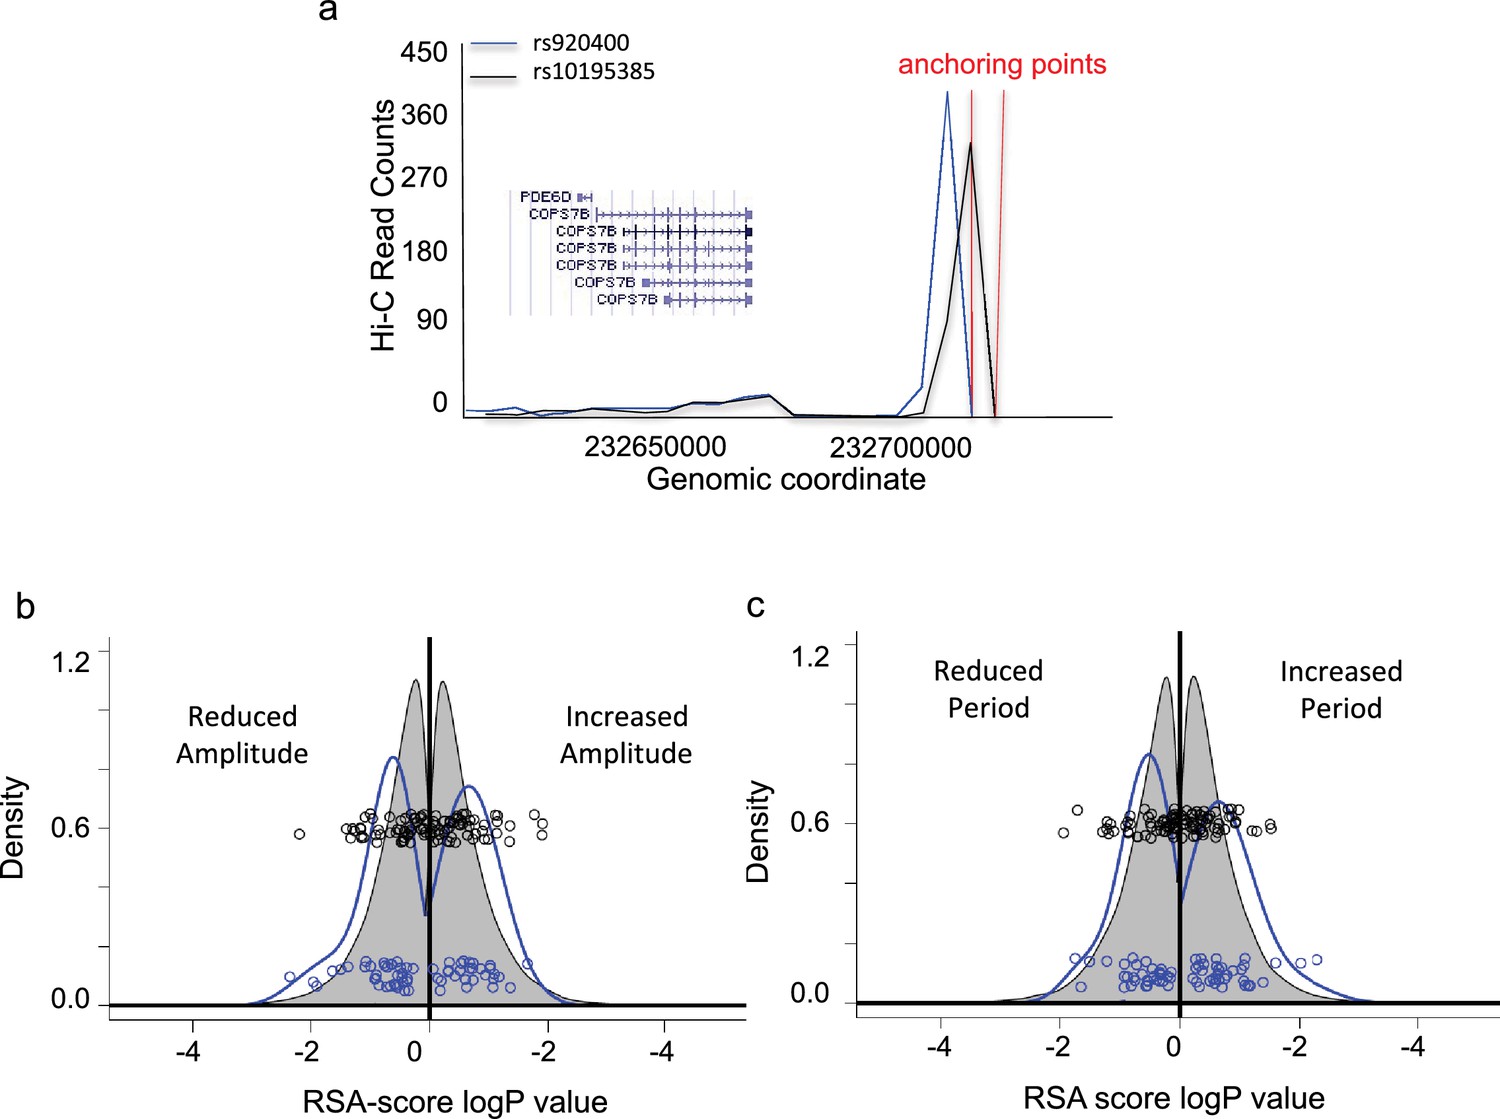
Assessment of genes associated with identified eQTLs.
(a) Genome-wide high-throughput chromosome conformation capture (Hi-C) for probes spanning rs920400 (blue) and rs10195385 (black). Y-axis, read counts. X-axis, genomic location of reads. Gene neighborhood is shown in the inset. (b) RSA-score distribution of period lengths of U2OS cell cultures transfected with RNAi hairpins targeting each gene in the genome (grey) or in significant genelist (blue). Y-axis, relative density (area sums to 1); X-axis, log RSA score. Left of 0, period length less than normal; right of 0, period length greater than normal. Blue circles, co-plotted scatterplot of individual values for significant genelist; black circles, corresponding sample set drawn randomly from the whole genome. (c) RSA-score density distribution of amplitude. (X and Y axes as in (b).) An annotated Significant Genelist is given in Supplementary file 1. See also Figure 2—figure supplement 1 for circadian clock properties of cells in which significant genes are targeted by RNAi, as well as representative raw data and cumulative density plots.
Figure 2—figure supplement 1
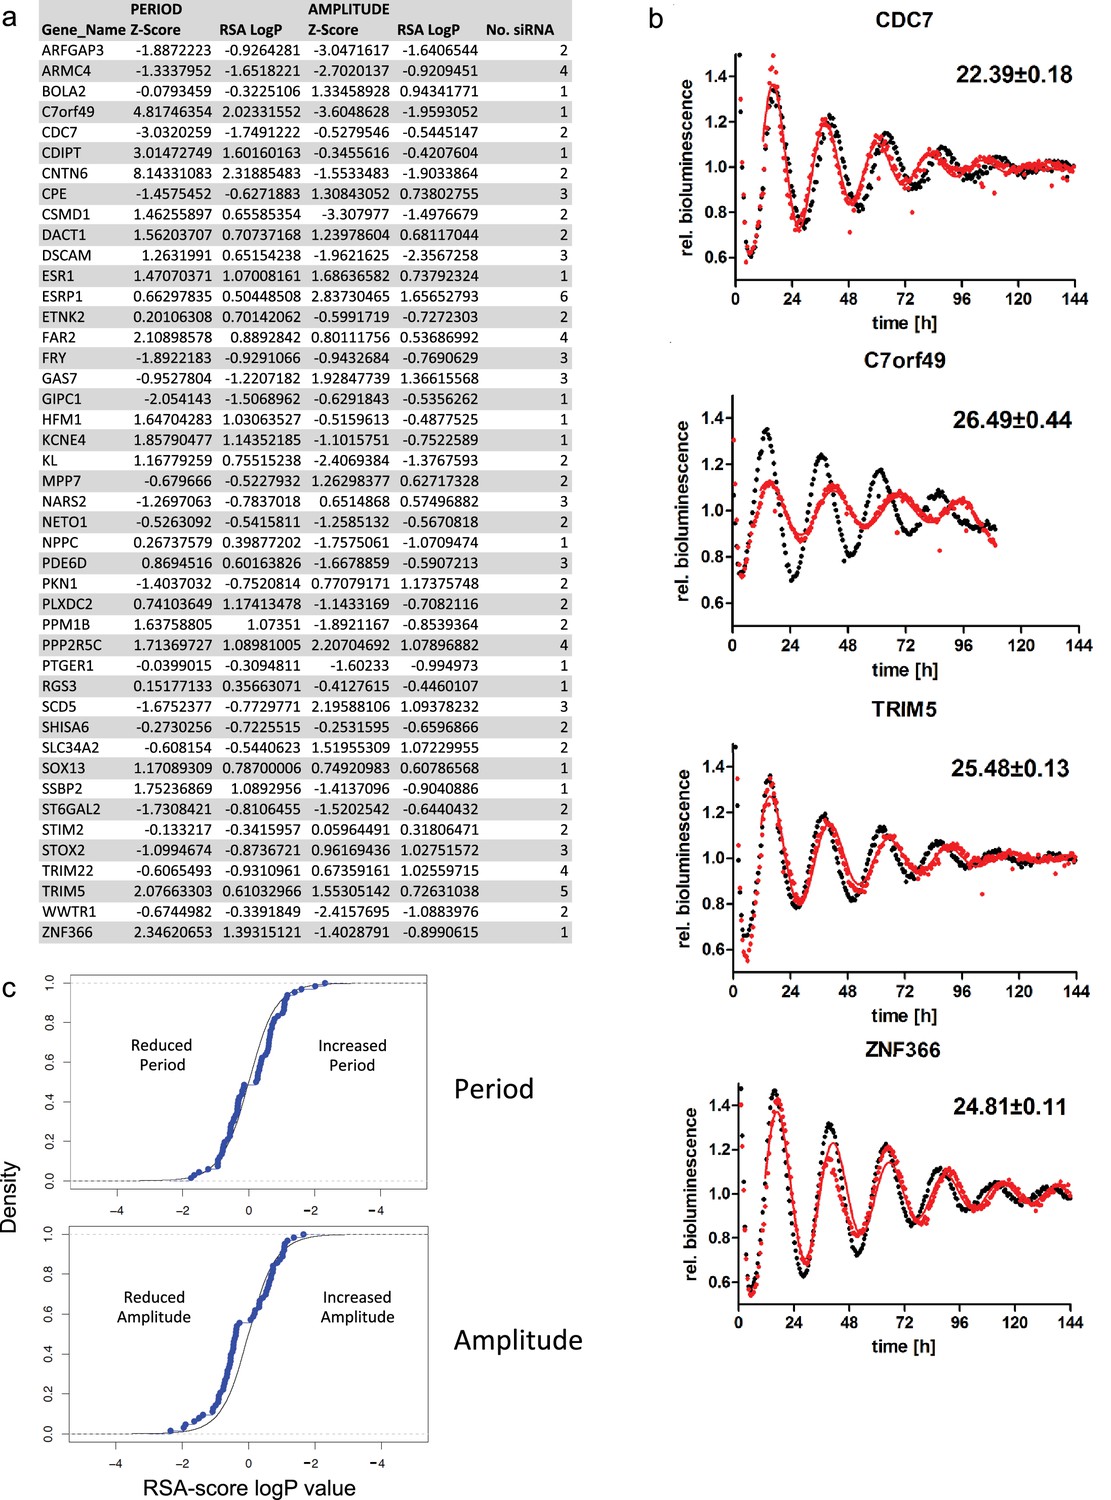
Clock properties of U2OS cells after RNAi depletion of GWAS-identified transcripts.
(a) Z-scored circadian period and amplitude values (left) and RSA scores (right, reflecting the reproducibility-weighted average of all RNAi hairpins; number of different hairpins indicated) for each gene in Supplementary file 2 present in the Open Biosystems lenti-RNAi library. (b) Detrended and normalized circadian bioluminescence profiles of clock-synchronized U2OS cells expressing Bmal1-luciferase. Red, cells infected with lenti-RNAi hairpins targeting indicated genes. Black, control profiles (plate-wide mean expression). Points are detrended average values of all samples; lines are fitted sine curves best representing the data. Upper right, average period length ± confidence interval calculated from sine fit compared to plate-wide mean centered at 24 hr (control). (c) Cumulative RSA-score distribution of circadian period (top) and amplitude (bottom) of U2OS cell cultures transfected with RNAi hairpins targeting each gene in the genome (black) or in significant genelist (blue points). Y-axis, relative density; X-axis, RSA-score. Left of 0, values less than normal; Right of 0, values greater than normal.
Figure 3 with 2 supplements
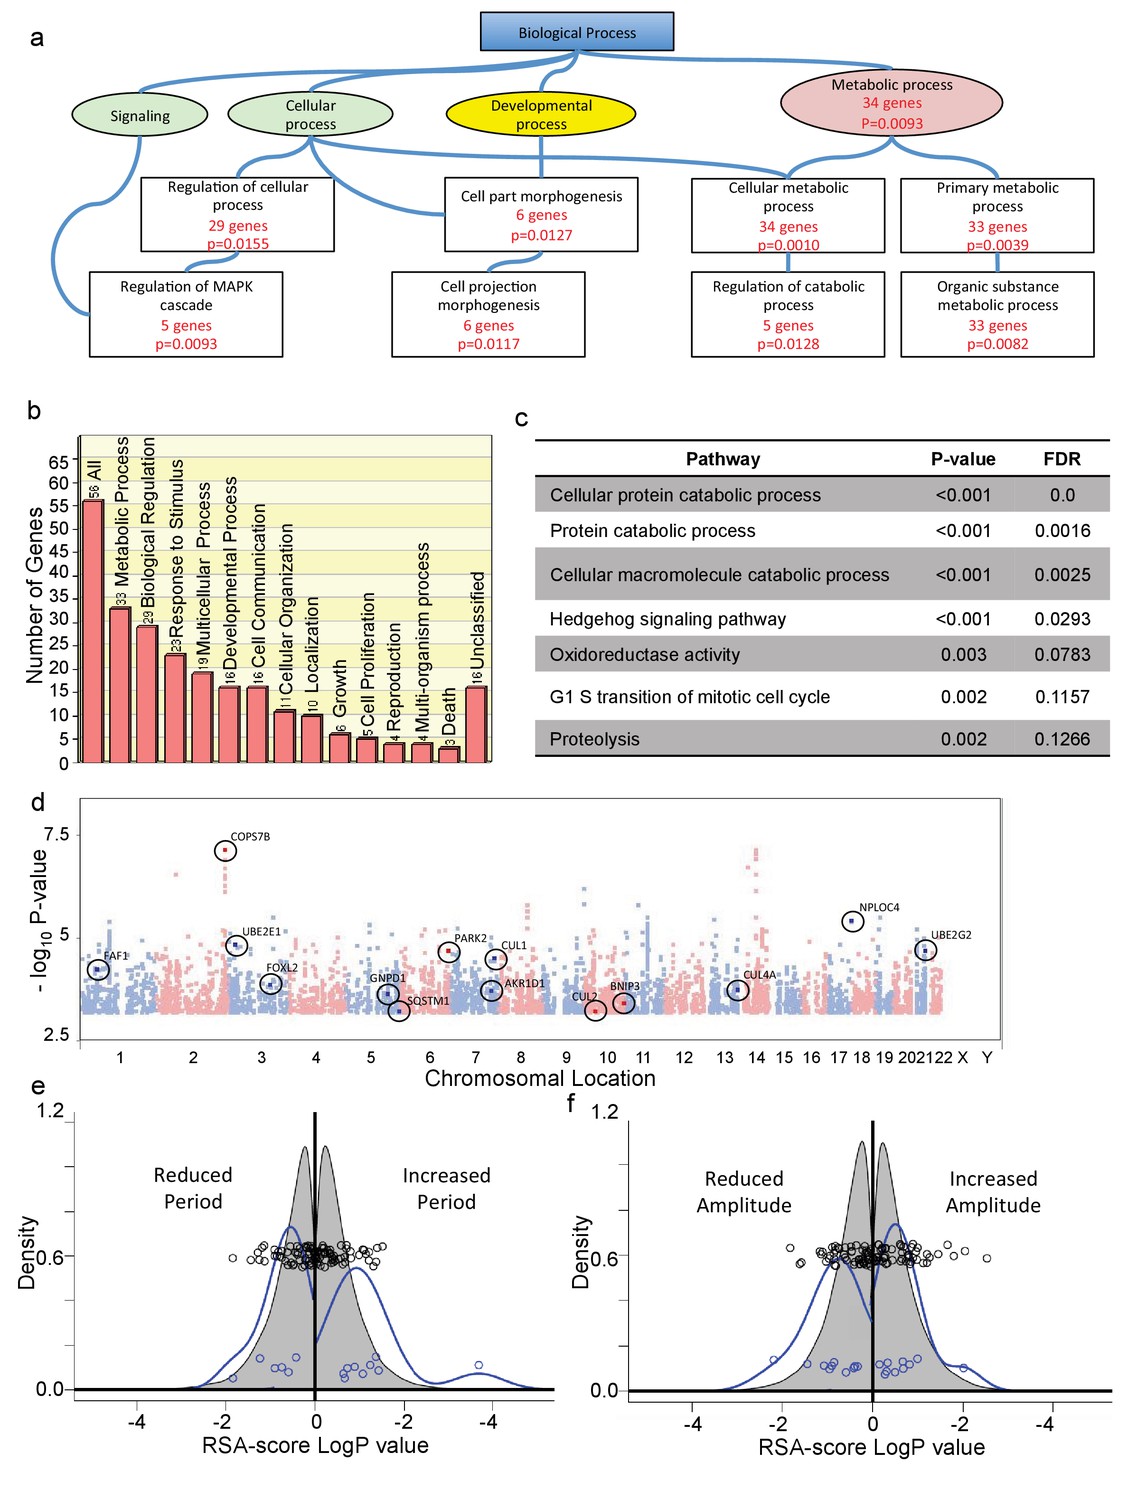
Positive SNPs highlight protein catabolism as essential for human circadian variation.
(a) Abbreviated Gene Ontology diagram from the Gene SeT Analysis Toolkit (WebGestalt), showing biological process categories containing genes (Supplementary file 1) associated with positive SNPs. Boxes with red statistical description represent enriched categories, with the number of associated genes and corresponding multiple comparison-adjusted p-value. (Individual pathways and associated genes are annotated in Figure 3—source data 1.) (b) Biological processes categorization of all identified genes (GOSlim tool). Y axis, number of genes in the category. (c) The most significant nonredundant pathways associated with positive alleles, identified by GeneSet Enrichment Analysis (GSEA4GWAS toolkit; a full chart including closely-related pathways is given in Figure 3—figure supplement 1; All genes are listed in Supplementary file 2; individual pathways and a clickable list of associated genes and SNPs is given in Figure 3—source data 2.) (d) Manhattan plot of all alleles p>10−3. GSEA-uncovered genes related to protein catabolism are indicated, and associated polymorphisms are circled. (e) RSA-score distribution of period lengths of U2OS cell cultures transfected with RNAi hairpins targeting each gene in the genome (grey), or targeting genes in (d) (blue). Circles, co-plotted scatterplot of individual values. X and Y axes as in Figure 2b,c. (f) RSA score distribution for circadian amplitude observed in U2OS cell cultures transfected with RNAi hairpins targeting each gene in the genome (grey), or targeting genes in (d) (blue). Circles, co-plotted scatterplot of individual values. X and Y axes as in Figure 2b,c. See also Figure 3—figure supplement 1 for a full list of GSEA-identified pathways, as well as a list of RNAi-targeted genes associated with protein catabolism, and the circadian clock properties of the cells in which this targeting occurred.
-
Figure 3—source data 1
Multiple-comparison-adjusted p-values and significant associated genes for each pathway identified in Figure 3a (and in more detail in Figure 3—figure supplement 1).
- https://doi.org/10.7554/eLife.24994.012
-
Figure 3—source data 2
Multiple-comparison-adjusted p-values, false discovery rates, and significant associated genes for each pathway identified in Figure 3—figure supplement 2a.
Significantly associated genes, as well as all genes in the pathway not significantly associated, can be perused via the ‘view detail’ links for each pathway.
- https://doi.org/10.7554/eLife.24994.013
Figure 3—figure supplement 1
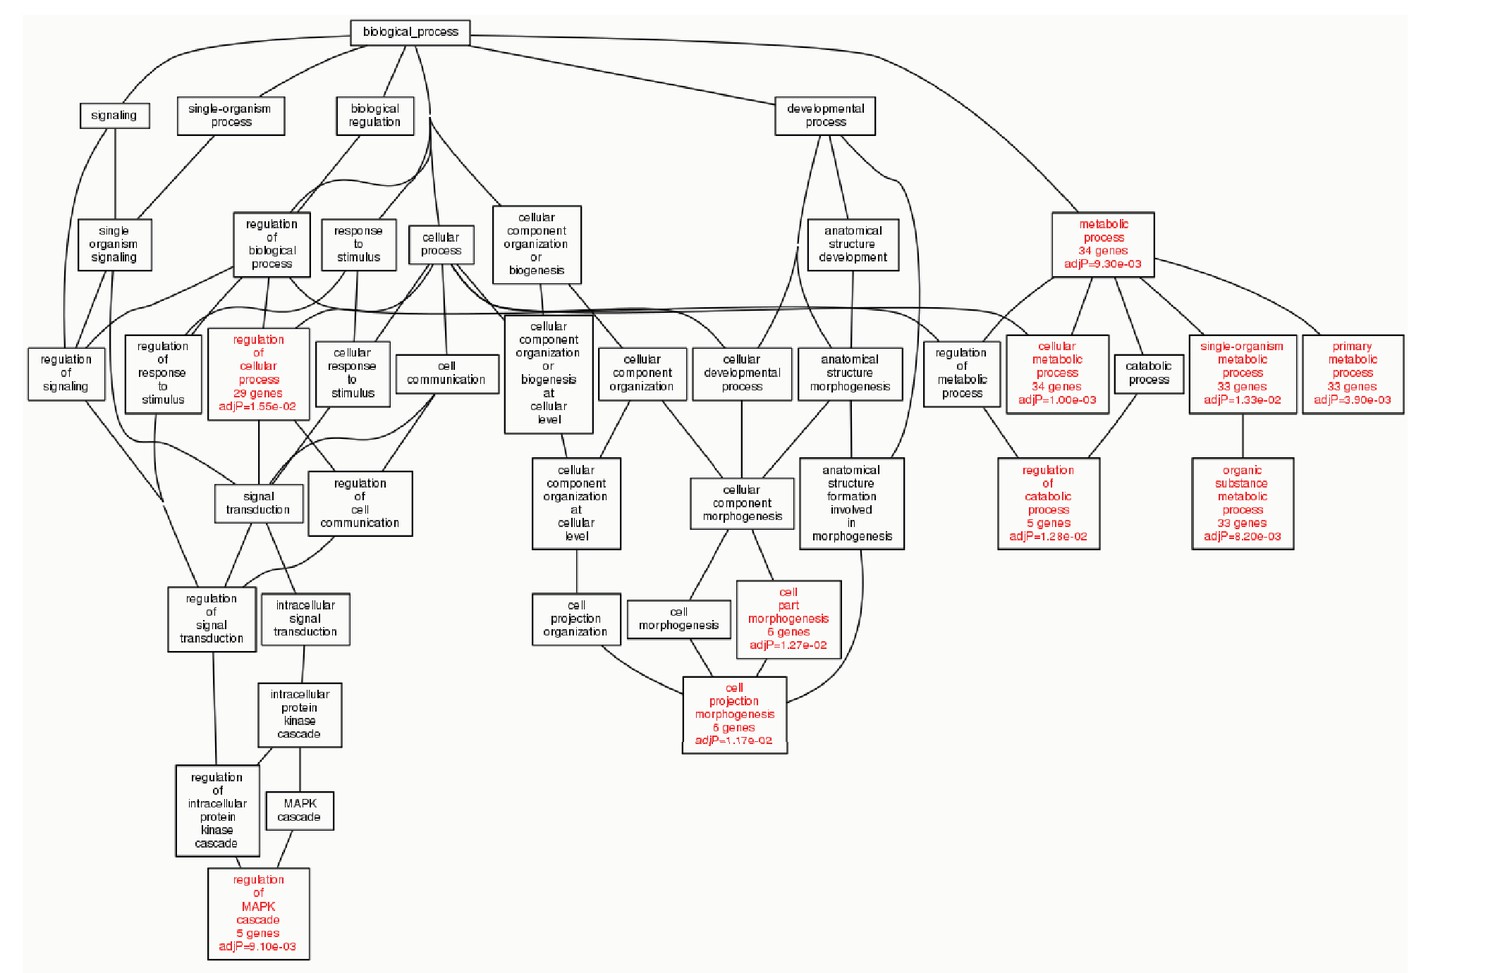
Full Gene SeT Analysis Toolkit (WebGestalt) biological process category diagram containing genes associated with positive SNPs.
Nodes with red labels represent enriched categories and nodes with black labels represents non-enriched parents. Numbers of genes are indicated in enriched categories, as well as multiple comparison-adjusted p-values. Individual genes in these categories are listed in Figure 3—source data 1.
Figure 3—figure supplement 2
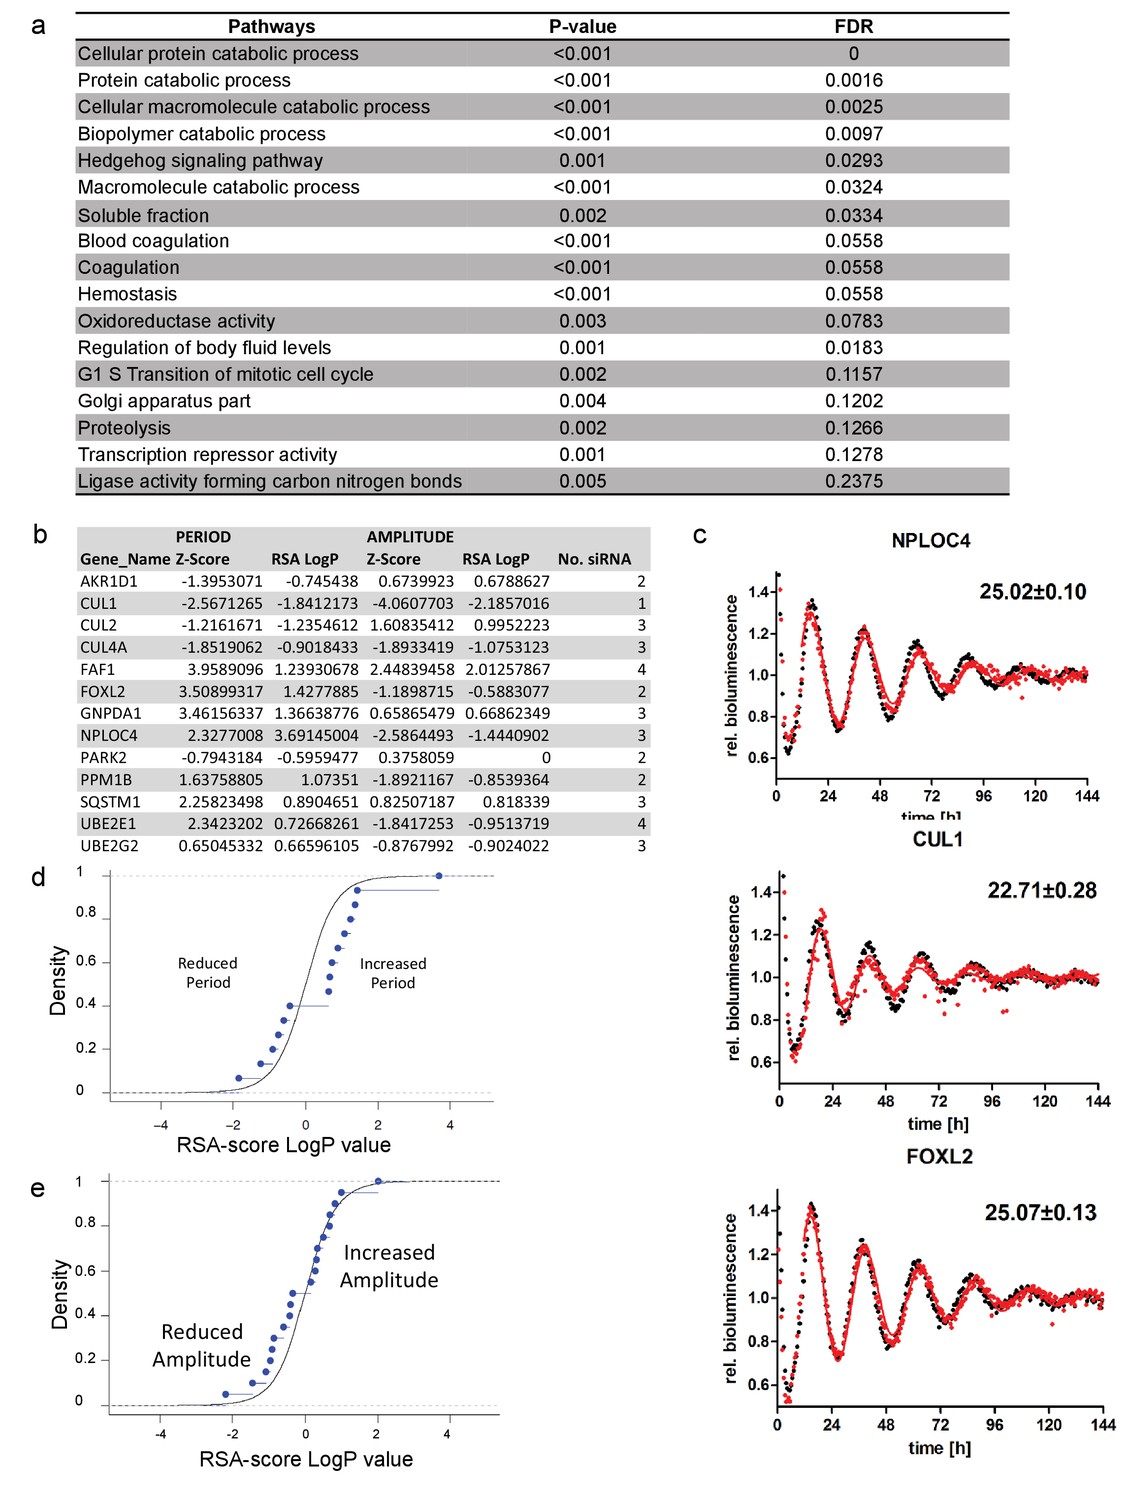
Clock properties of U2OS cells after RNAi depletion of GSEA-identified transcripts.
(a) GSEA4GWAS annotated significant pathways associated with circadian traits. A genelist associated with these pathways is available in Supplementary file 3, and a clickable list of pathways, genes, and associated alleles is presented in Figure 3—source data 2. (b) Left column, list of genes (used for Figure 3d–f) linked to protein catabolism-associated terms, and present in the Open Biosystems lenti-RNAi library. Middle columns, Z-scored circadian period and amplitude values (left) and RSA scores (right) for cells targeted by RNAi for each of the genes. Right column, Number of RNAi hairpins per gene. (c) Representative raw data, plotted as described in Figure 2—figure supplement 1. (d) Cumulative RSA-score distribution of circadian period of U2OS cell cultures transfected with RNAi hairpins targeting each gene in the genome (black) or in significant genelist in (b) (blue points). Y-axis, relative density; X-axis, RSA-score. Left of 0, values less than normal; Right of 0, values greater than normal. (e) Cumulative RSA score distribution for circadian amplitude in the same cultures.
Figure 4 with 1 supplement
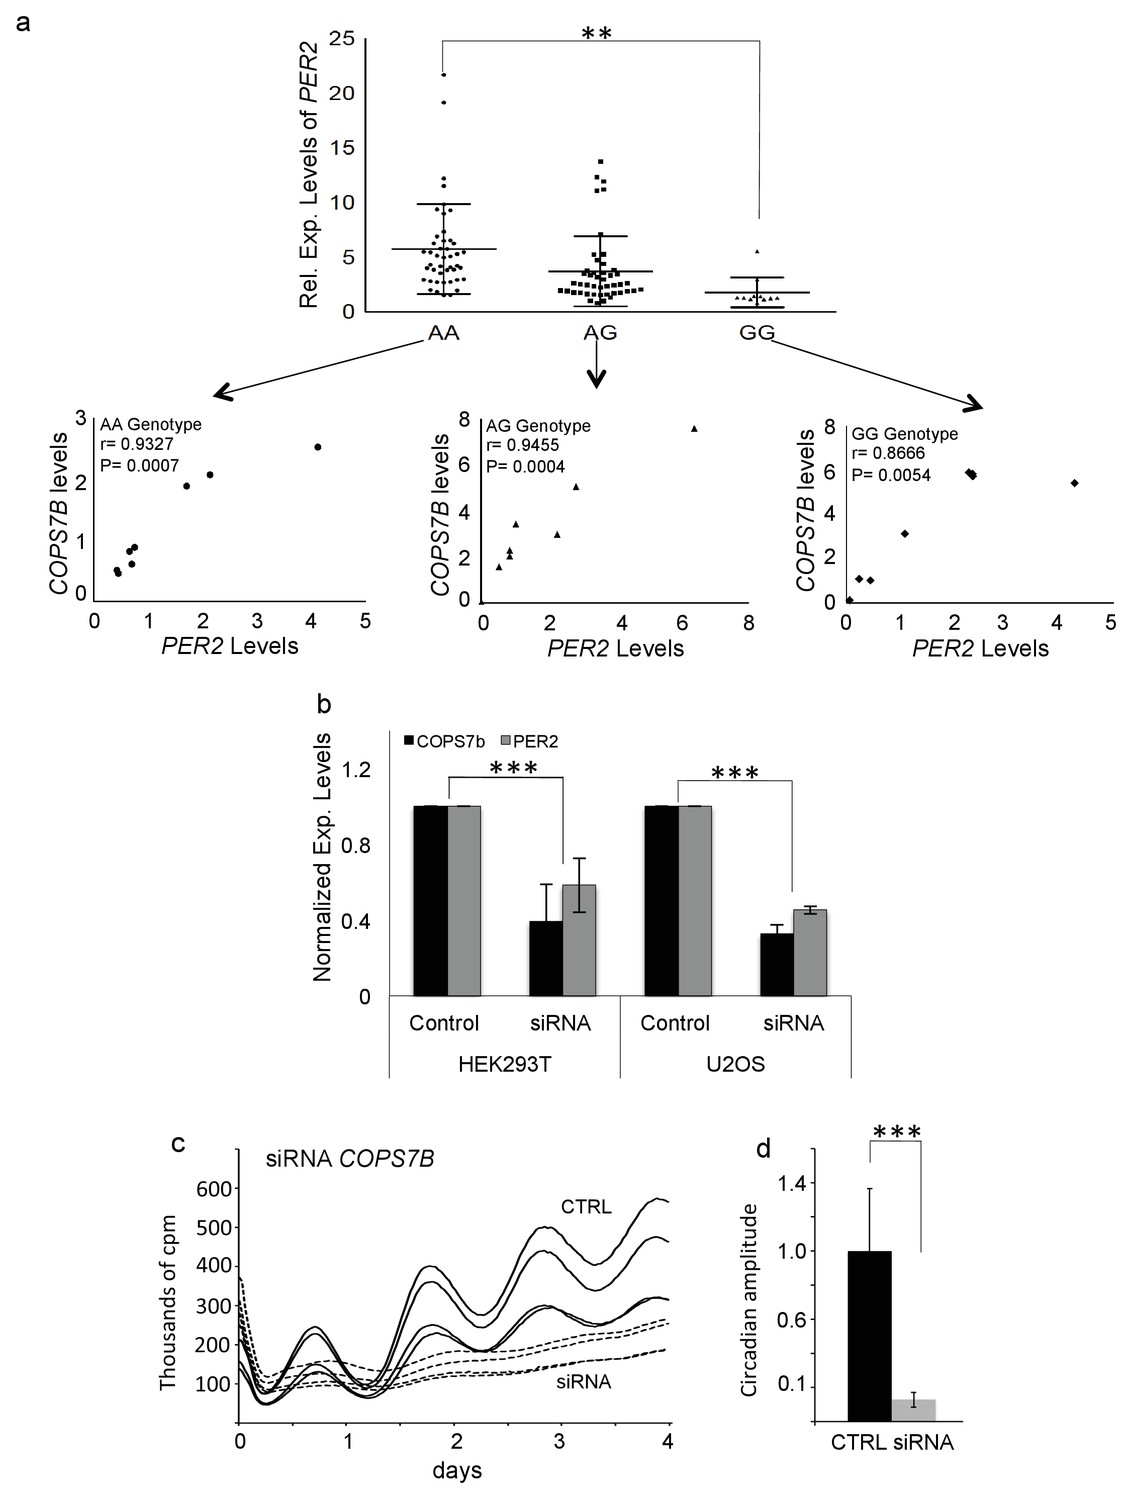
COPS7B influences PER2 expression and cellular clock function.
(a) Expression levels of PER2 stratified by rs920400 genotype. (AA vs. GG genotype, T-test p=0.00026). Insets - Correlation between PER2 and COPS7B gene expression within each genotype. (b) Reduction of PER2 expression (grey) and COPS7B expression (black) in HEK293T and U2OS cells transfected with three short interfering RNAs targeting COPS7B (c) Raw bioluminescence profiles of U2OS cells cotransfected with a Bmal-luciferase circadian reporter and siRNAs targeting COPS7B (dotted lines) or scrambled siRNA (solid lines). (d) Reduction in circadian amplitude by short interfering RNAs targeting COPS7B (p=0.0021, student T-test). These siRNAs also lengthen the circadian period by 1.15 hr (p=3.27094E−05). See also Figure 4—figure supplement 1 for similar RNAi assays performed upon the COPS4 gene.
Figure 4—figure supplement 1
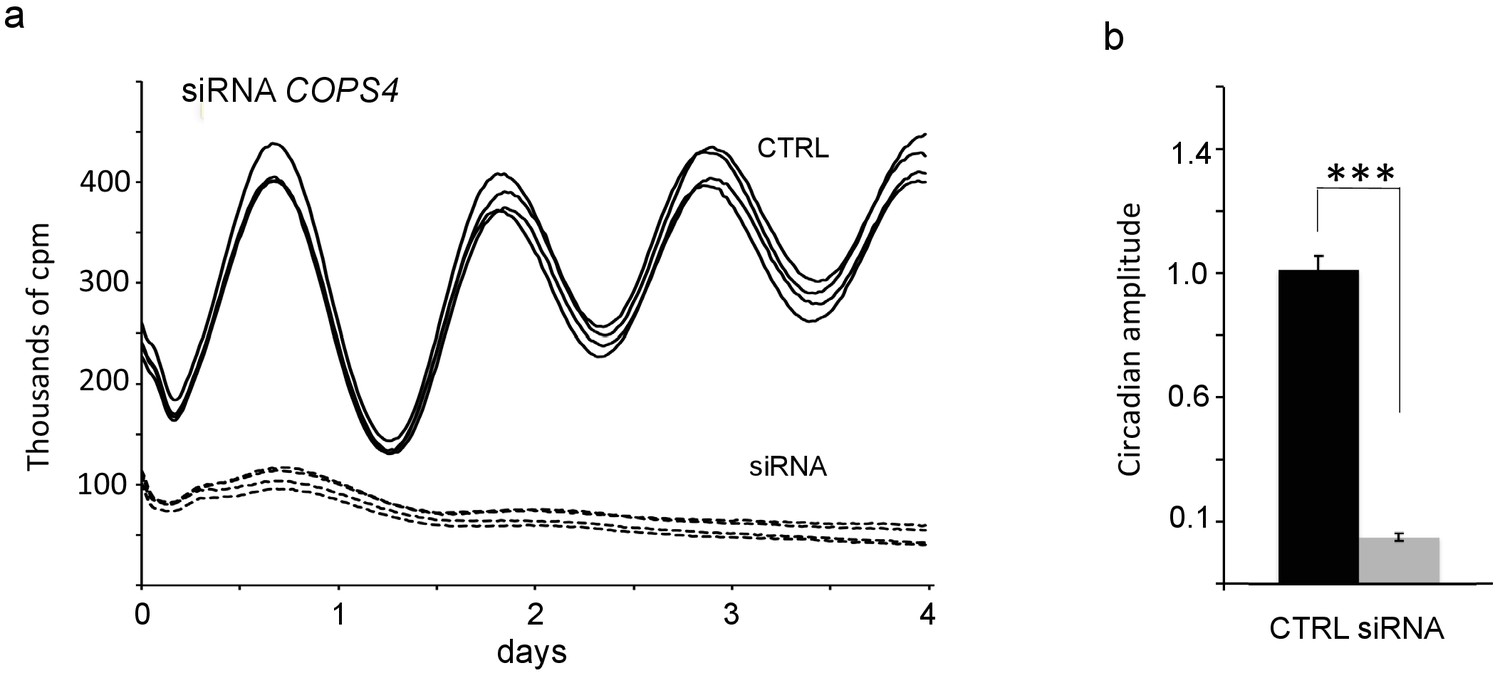
Effects of COPS4 depletion upon circadian period and amplitude.
(a) Raw bioluminescence profiles of U2OS cells cotransfected with a Bmal-luciferase circadian reporter and siRNAs targeting COPS4 (dotted lines) or scrambled siRNA (solid lines). (d) Reduction in circadian amplitude by short interfering RNAs targeting COPS4 (p=6.47781E−07, student T-test).
Figure 5 with 2 supplements
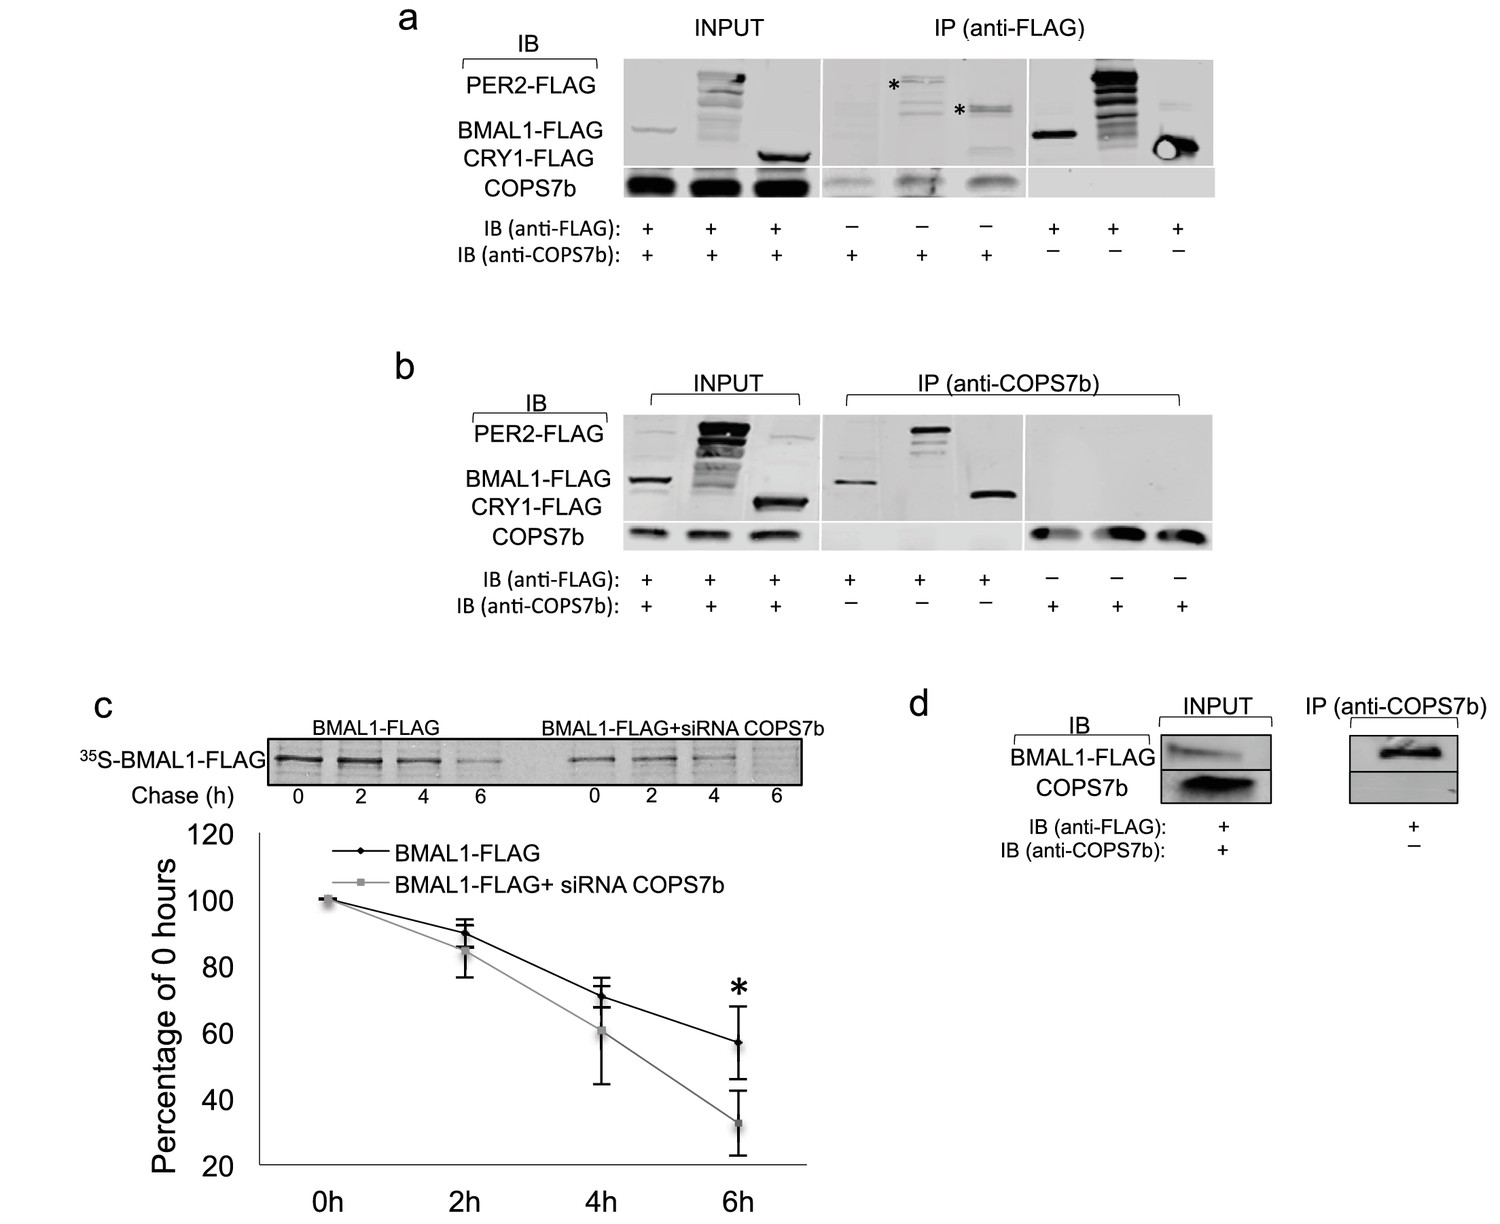
COPS7B stabilizes the essential clock protein BMAL1.
(a–b) Coimmunoprecipitation assay of HEK293T cells transfected with plasmids expressing FLAG epitope-tagged clock proteins (BMAL1-flag, PER2-flag and CRY1-flag). *Unspecific background bands. (a) immunoprecipitated with antibodies against FLAG or (b) against endogenous COPS7B. (c) Pulse-chase analysis of BMAL1-flag protein stability in absence (left; black diamonds in graph below) or presence (right; grey squares in graph below) of siRNAs targeting COPS7B in HEK293T cells. All cells were incubated with 35S-labelled methionine-cysteine for 1 hr, and chased with excess unlabeled cysteine for 0 hr, 2 hr, 4 hr, or 6 hr before immunoprecipitation. Upper panel, representative radioblot; lower panel, quantification from 3 experiments ± s.d., expressed as percentage of labeled immunoprecipitated protein (relative to 0 hr) at indicated time. *p=0.04999, Student T-test. (d) Immunoprecipitation experiments between BMAL1 and COPS7B performed in U2OS cells. See also Figure 5—figure supplement 1 for negative control experiments upon untransfected cells; see Figure 5—figure supplement 2 for pulse-chase analysis of PER2-flag and CRY1-flag protein stability in the presence or absence of siRNAs targeting COPS7B.
Figure 5—figure supplement 1
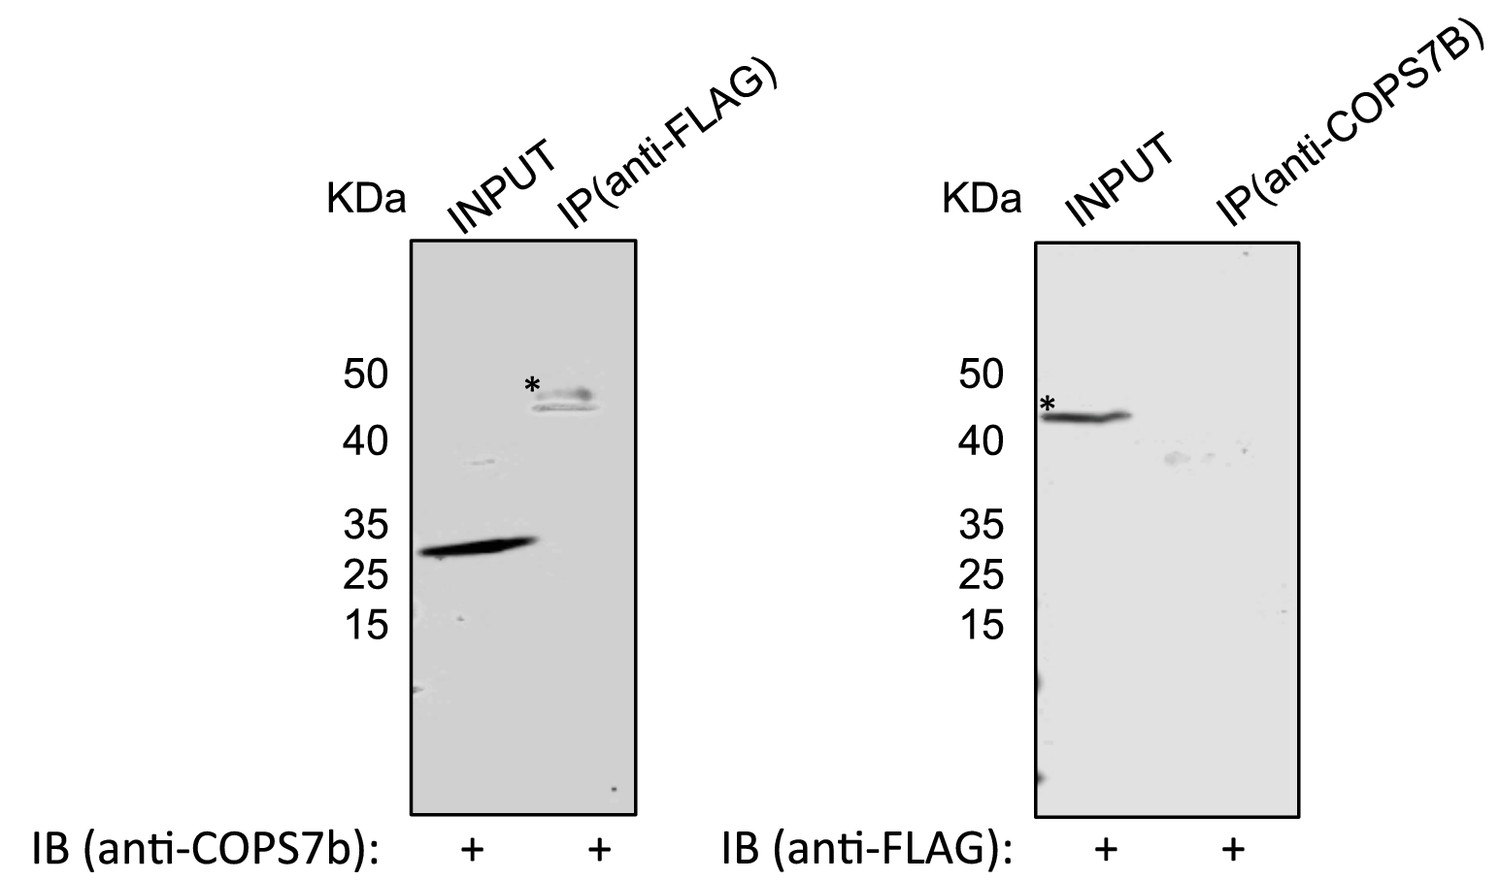
Negative control immunoprecipitation experiments identical to those described in Figure 5a,b, but using untransfected HEK293T cells as a substrate.
Coimmunoprecipitation assay of untransfected HEK293T cells. (left) immunoprecipitated with antibodies against flag and probed with anti COPS7B and (right) immunoprecipitated with antibodies against endogenous COPS7B and probed with anti-FLAG. * background bands of size unrelated to the proteins in question.
Figure 5—figure supplement 2
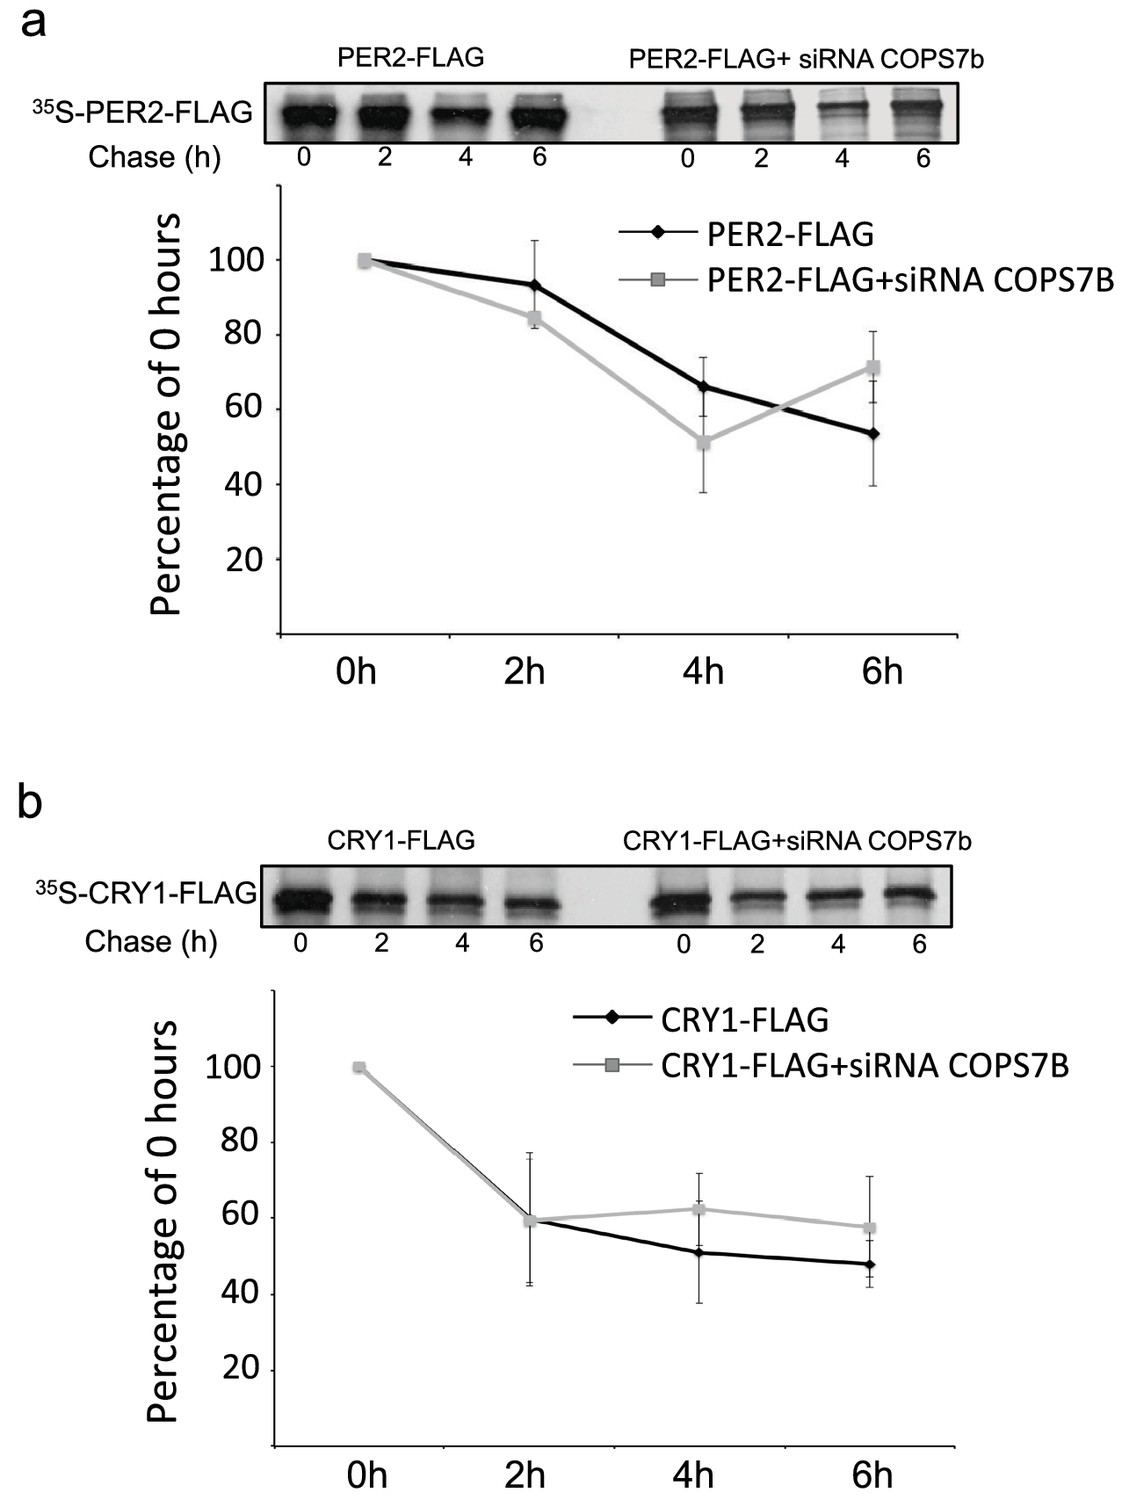
Pulse-chase analysis of PER2 (a) and CRY1 (b) protein half-lives in absence (left-control lanes; black diamonds in graph below) or presence (right lanes; grey squares in graph below) of siRNAs targeting COPS7B.
HEK293T cells were transfected either with FLAG epitope-tagged clock proteins (PER2-flag and CRY1-flag) or FLAG epitope-tagged clock proteins plus siRNA targeting COPS7B, incubated with 35S-labelled methionine-cysteine for 1 hr, and chased with excess unlabeled methionine-cysteine for the indicated times (x-axis, 0 hr, 2 hr, 4 hr, 6 hr) before immunoprecipitation. Upper panel, autoradiography of representative immunoprecipitated samples; lower panel, quantification from 3 experiments,±s.d. Y-axis, percentage of labeled immunoprecipitated protein (relative to 0 hr) at indicated time.
Figure 6 with 1 supplement
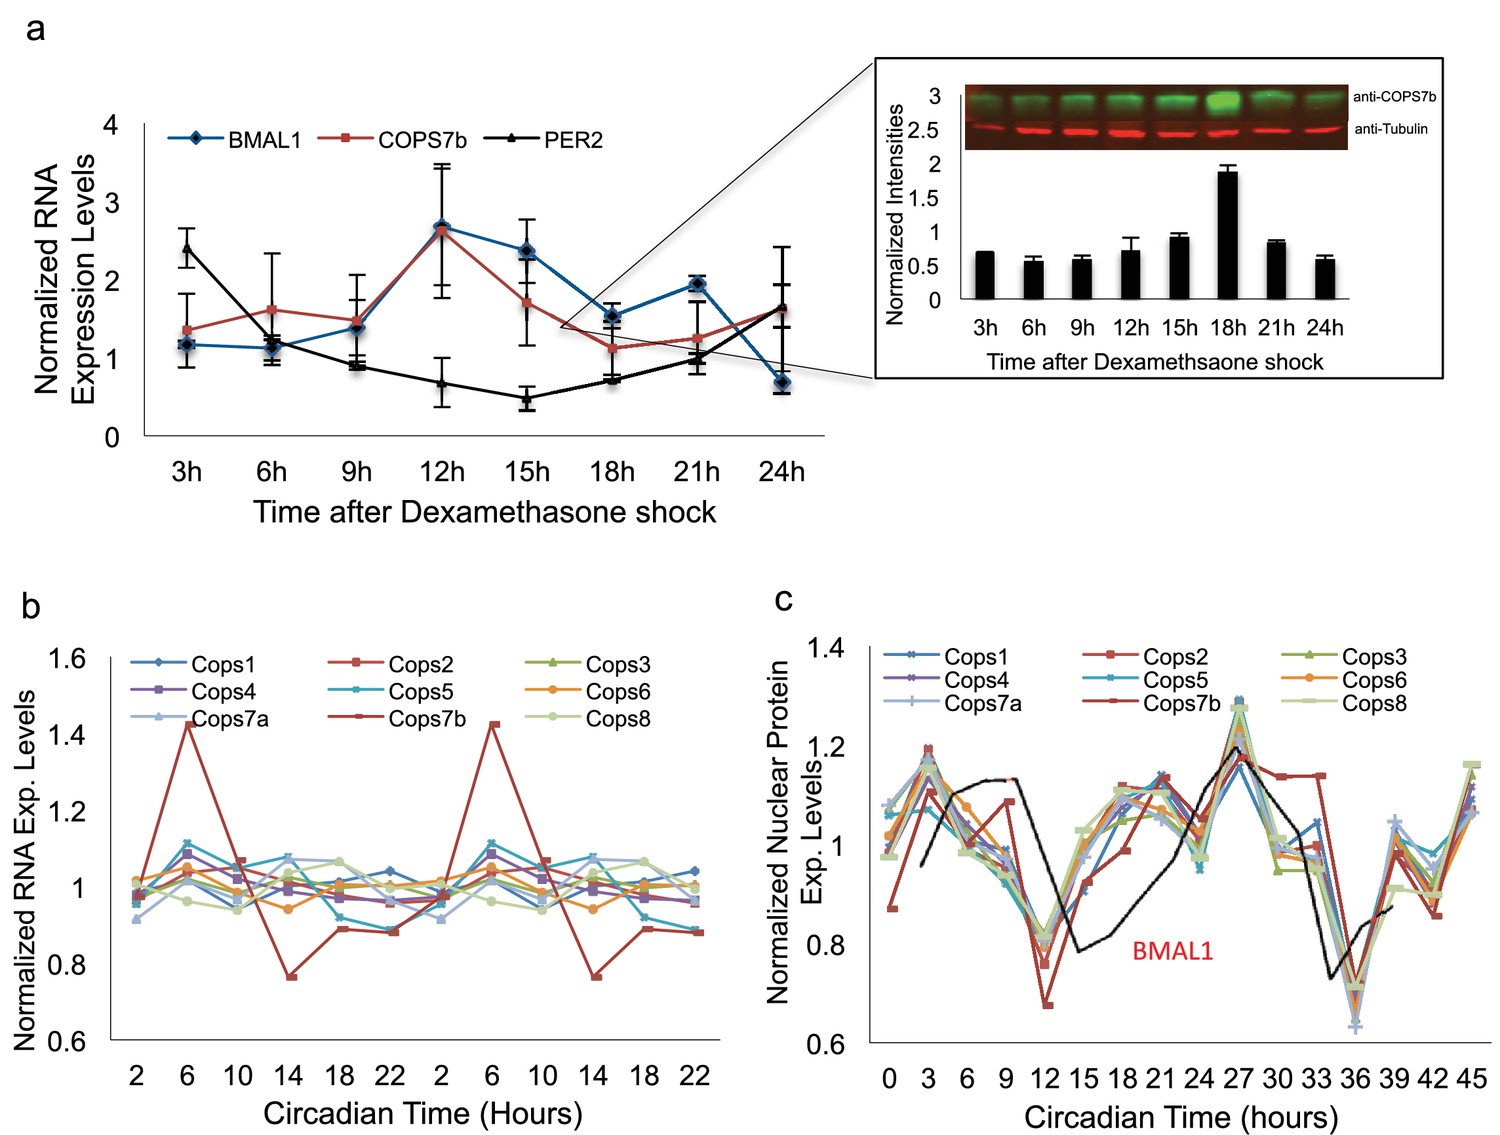
The signalosome is rhythmically imported into the nucleus.
(a) BMAL1, PER2 and COPS7B RNA levels in U2OS cells at different times of day, as determined via qPCR. Inset - Western blot analysis of nuclear COPS7B protein under identical conditions. Top panel, representative raw blot; bottom panel, quantification. (b) RNAseq transcript levels of genes encoding COP9 signalosome subunits in mouse liver at different times of day. (c) Protein levels of COP9 signalosome subunits measured by MS in mouse liver nuclei at different times of day. Red line, protein levels of circadian clock protein BMAL1. See also Figure 6—figure supplement 1 for ms-based relative abundance analysis of different COP9 signalosome subunits, as well as protein levels of proteasome subunits measured by MS in mouse liver nuclei at different times of day.
Figure 6—figure supplement 1
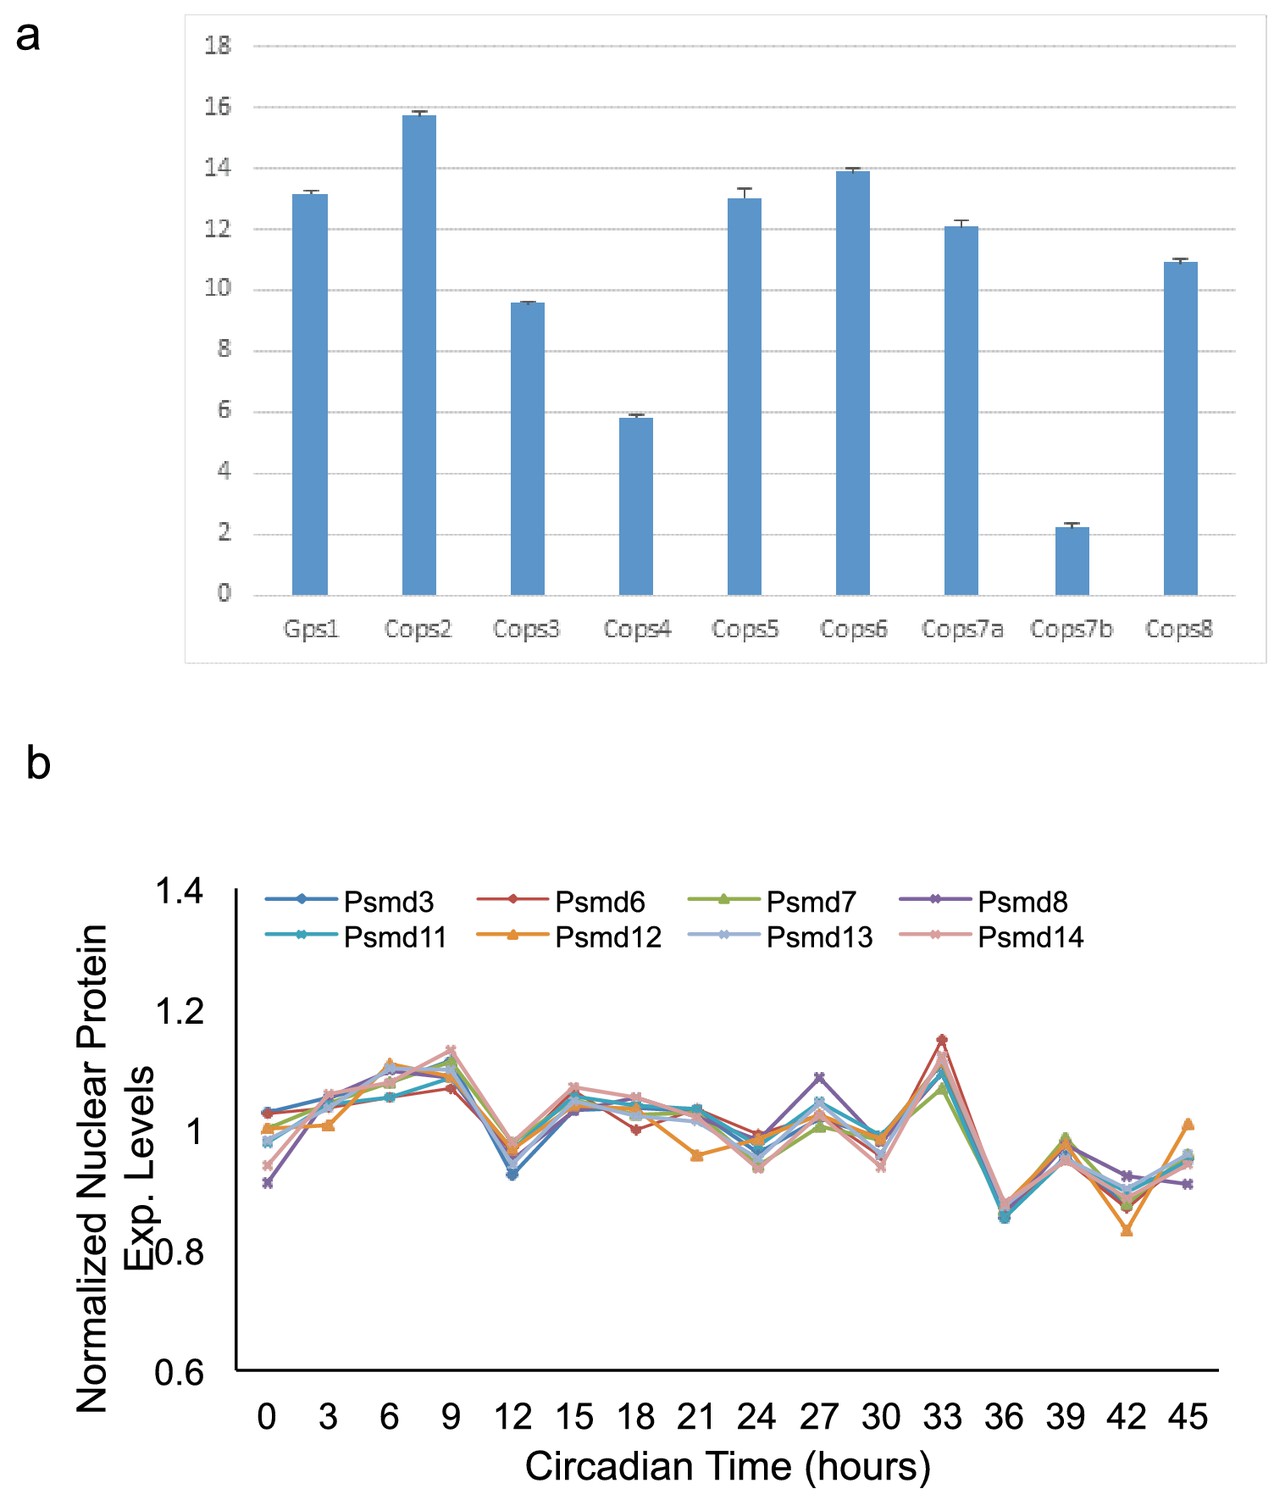
Relative expression of signalosome and proteasome subunits.
(a) Nuclear protein expression levels of signalosome subunits, measured relative to each other, by mass spectrometry in mouse liver nuclei. Y axis, arbitrary units . (b) Nuclear protein expression levels of proteasome subunits measured by mass spectrometry in mouse liver nuclei at different times of day. Y axis, arbitrary units in which median expression across the day is normalized to 1 for each subunit in order to best visualize time-of-day-dependent differences.
Additional files
-
Supplementary file 1
Spearman correlations between the sets of positive alleles (p<10−5) identified for all phenotypes.
- https://doi.org/10.7554/eLife.24994.021
-
Supplementary file 2
List of genes associated with positive SNPs, determined via GWAS, Hi-C and RTC analysis.
Right columns, unadjusted p-values and –logP values.
- https://doi.org/10.7554/eLife.24994.022
-
Supplementary file 3
List of genes implicated in the pathways determined via Gsea4GWAS analysis.
Middle columns, unadjusted p-values and –logP values. Right column, lowest-level GO term associated with each pathway.
- https://doi.org/10.7554/eLife.24994.023
-
Transparent reporting form
- https://doi.org/10.7554/eLife.24994.024
Download links
A two-part list of links to download the article, or parts of the article, in various formats.
Downloads (link to download the article as PDF)
Open citations (links to open the citations from this article in various online reference manager services)
Cite this article (links to download the citations from this article in formats compatible with various reference manager tools)
The genomic landscape of human cellular circadian variation points to a novel role for the signalosome
eLife 6:e24994.
https://doi.org/10.7554/eLife.24994


